t. rowe price prnex new era fund trnex new era...
TRANSCRIPT

Proof #4
PRNEX
TRNEX
New Era Fund
New Era Fund– I Class
SEMIANNuAlREPORT
June 30, 2017
T. RowE PRICE
The fund invests in companies that own or develop natural resources and other basic commodities.

Proof #4
REPORTS ON THE WEB
Sign up for our Email Program, and you can begin to receive updated fund reports and prospectuses online rather than through the mail. Log in to your account at troweprice.com for more information.
HIGHLIGHTS
• Naturalresourcesstocksdeclinedinthefirsthalfof2017amidrenewedweaknessintheglobalcommoditiescomplex,particularlyinoilprices.
• TheNewEraFundreturned-2.38%inthesix-monthperiodendedJune30,2017,andoutperformedtheMSCIWorldSelectNaturalResourcesIndexanditsLipperpeergroupaverage.
• Wecontinuetolookforcompanieswithlowcoststructuresandhealthybalancesheetsthataremorelikelytosurviveabearmarketforcommoditiesoverthelongertermandemergeinastrongercompetitivepositionwhenthecycleeventuallyturns.
• Webelievethatthecommoditycycleenteredastructuraldownturnin2011andthatcommodityproducersareinagoldeneraofproductivitythatcontinuestodrivedownoperatingandcapitalcosts,particularlyinoilandNorthAmericannaturalgas.Wearestillfindingpocketsofopportunity,however,throughadiverseselectionoffundamentallysoundnaturalresourcescompanieswithsolidbalancesheets,talentedmanagement,andlonger-termgrowthrunways.
T. Rowe Price New Era Fund
The views and opinions in this report were current as of June 30, 2017.They are not guarantees of performance or investment results andshouldnotbe takenas investmentadvice. Investmentdecisionsreflectavarietyof factors,and themanagers reserve the right tochange theirviews about individual stocks, sectors, and the markets at any time.As a result, the views expressed should not be relied upon as a fore-castof the fund’s future investment intent.Thereport iscertifiedunderthe Sarbanes-Oxley Act, which requiresmutual funds and other publiccompanies to affirm that, to the best of their knowledge, the informa-tionintheirfinancialreportsisfairlyandaccuratelystatedinallmaterialrespects.

Proof #4
T. Rowe Price New Era Fund
Manager’s Letter
1
Fellow Shareholders
Natural resources stocks declined in the first half of 2017, due largely to renewed
weakness in the global commodities complex. The segment experienced strong gains
in 2016 as global economic indicators showed synchronized improvement and a
production cut by the Organization of the Petroleum Exporting Countries (OPEC)
placed a temporary floor beneath sentiment. Commodities resumed their long-term
slide early in 2017 as modest economic growth expectations are unlikely to boost
demand enough to overcome global oversupply for many commodities. Additionally,
a rapid increase in production by North American shale producers in response to
higher oil prices predictably resulted in a return of downward pressure on prices.
As shown in the Performance Comparison table, your fund returned -2.38% for the six months ended June 30, 2017. (Returns for the I Class shares differ slightly due to their different fee structure.) The fund trailed the broad market S&P 500 Index but outperformed the MSCI
World Select Natural Resources Index and its Lipper peer group average of similarly managed funds. Please note: On April 1, 2017, the MSCI index replaced the S&P 500 Index as the fund’s official passive benchmark, because we believe the MSCI index is a better reflection of the fund’s investment strategy. We will continue to use the Lipper benchmark for our discussion of relative performance.
Six-MonthPeriodEnded6/30/17 TotalReturn
NewEraFund -2.38%
NewEraFund–IClass -2.32
S&P500Index 9.34
MSCIWorldSelectNaturalResourcesIndex -2.57
LipperGlobalNaturalResourcesFundsAverage -5.41
Performance Comparison
Proof #4
2
Our decisions to overweight and underweight various industries helped the fund’s relative performance. A large overweight to specialty chemicals versus the Lipper benchmark offered the biggest boost, followed by an underweight to hard-hit U.S. oil and gas exploration and production (E&P) companies. Stock selection also benefited the fund’s relative results, due largely to our preference for healthy balance sheets and low cost positions. Our holdings in the U.S. E&P and major integrated oil and gas industries were particularly helpful. This was partially offset by negative selection in specialty chemicals, paper and forest products, and agriculture.
MARKET ENVIRONMENT
U.S. stocks recorded solid gains in the first six months of 2017, extending a rally that started in the wake of Donald Trump’s election victory in November 2016 amid hopes for lower taxes and higher infrastructure spending—although there has been little substantive progress on these initiatives. Strong first-quarter corporate earnings and moves by the Trump administration to reduce the regulatory burden in certain industries were also supportive. The market was relatively unfazed by lackluster first-quarter economic growth and
a pair of interest rate hikes by the Federal Reserve (Fed). Investors also shook off concerns about political controversies swirling around the White House, failed attempts by congressional Republicans to repeal the Affordable Care Act, and heightened geopolitical tensions surrounding the Korean Peninsula. The large-cap S&P 500 Index advanced more than 9% for the six-month reporting period. Large-cap U.S. stocks generally outpaced mid-caps and small-caps, while growth outperformed value across all market capitalizations.
International developed markets stocks outperformed U.S. shares, with a weaker U.S. dollar versus major non-U.S. currencies boosting returns for U.S. investors. European stocks gained 16% in dollar terms. The region’s economy grew 0.6% in the first quarter (1.9%
year-over-year), the strongest pace of growth in nearly two years. The European Central Bank removed its bias toward easy policy in June, but monetary policy remains broadly accommodative. Centrist election victories allayed fears about rising populism and added to the
LARGE-CAPU.S.
STOCkSGENERALLy
OUTPACEdMId-CAPS
ANdSMALL-CAPS,
WhILEGROWTh
OUTPERFORMEd
vALUEACROSS
ALLMARkET
CAPITALIzATIONS.

Proof #4
3
positive market sentiment. UK shares trailed with a 10% gain as Prime Minister Theresa May’s government prepared to start formal Brexit negotiations with the European Union. Japanese shares gained 10%. The nation’s economy expanded 0.3% in the first quarter of 2017 (1.0% annualized) and marked a fifth consecutive quarter of growth. Improving global growth and a weaker yen versus last year contributed to stronger exports, while increased spending by consumers, businesses, and government also offered support.
Emerging markets equities outperformed developed markets stocks, advancing 19% as currencies gained against the dollar and the global economy improved. Many emerging Asian markets produced excellent returns, especially South Korea, China, Taiwan, and India. Latin American markets were broadly positive, with Mexican shares advancing more than 24%.
As measured by Lipper, natural resources stocks fell roughly 7% as commodities prices fell against the backdrop of an unfavorable global supply/demand dynamic. Gas utilities and packaging and specialty chemical producers—areas of the market where low commodities prices translate into low input costs—posted strong double-digit gains. Agriculture, precious metals, and oil and gas refiners were modestly positive. Industrial metals stocks saw moderate losses, while integrated oil and gas companies and oil E&P stocks fell sharply.
PORTFOLIO REVIEW AND POSITIONING
Overall, we have a structurally defensive posture with a focus on long-term growth, high quality through healthy balance sheets, and low costs within the commodity arena. Although our opportunity set has narrowed as falling commodities prices pressure balance sheets, we are still finding pockets of opportunity in certain areas of the market:
• Majorintegratedoilproducerswithstrongfinancialandoperating leverage;
• Refinerspoisedforhealthymarginsascrudeoilsuppliesaccelerate and refining activity declines during autumn’s facilities maintenance cycle;
• Commodities-relatedcompanies,includingspecialtychemicaland packaging, that could benefit from low input costs and high end-market demand;

Proof #4
4
• Regulatedutilitiesgeneratingsustainablegrowthinalow-rateenvironment, with an emphasis on natural gas;
• Companieswithlimitedfinancialleverageandnohiddencounterparty risk, given the potential for increased bankruptcies in the commodities complex; and
• EnergyE&Pcompaniesabletoreducecostsandmaintaingrowth, with select North American shale producers among the prime examples.
Our specialty chemical holdings performed well in absolute terms during the semiannual reporting period. Stock selection weighed modestly on relative performance, but a large overweight position versus the benchmark helped results as lower oil and gas prices tend to benefit companies further downstream. Croda International (UK) was among our top contributors. Croda sells a range of chemicals derived from natural and organic ingredients to the consumer care and industrial products industries. We were encouraged to see good organic growth in the company’s personal care business, as well as a cyclical recovery in its performance technologies division. Over time, Croda’s management has focused on increasing returns through innovative and patented chemicals, providing good growth exposure
in relatively defensive market segments. Industrial gas company Linde (Germany) was another strong performer. The company announced solid first-quarter results that slightly beat expectations and confirmed guidance for the year. Shares increased further after news that Linde and Praxair (U.S.) reached a formal agreement to merge. (Please refer to the fund’s portfolio of investments for a complete list of holdings and the amount each represents in the portfolio.)
The fund’s industrial machinery holdings also saw good gains in the first half of 2017. Positive stock selection and an overweight position versus the benchmark aided relative results. In a low-growth world, we value
companies that are able to grind out steady growth and those that have unique self-help stories in progress. Industrial engineering group Sandvik (Sweden) advanced as the company continued to distance itself from the growth-challenged metals and mining sector, allowing it to focus on more profitable business lines. Pump, valve, and controls
ThEFUNd’S
INdUSTRIAL
MAChINERy
hOLdINGSALSO
SAWGOOdGAINS
INThEFIRSThALF
OF2017.

Proof #4
5
manufacturer Pentair (U.S.) generated solid gains after the company announced solid first-quarter earnings. Markets were further encouraged in May when the company announced an upcoming management change and a split into separate, more-focused water and electrical businesses.
Our holdings in the fertilizer and agricultural
chemicals industry declined modestly overall in absolute terms, while stock selection and an underweight position detracted from relative results. A position in a nitrogen fertilizer manufacturer CF Industries (U.S.) fell as the company suffered from a continued decline in urea prices. We remain optimistic about the company’s longer-term prospects, however. CF is a low-cost producer that generates strong free cash flow. We believe we are at a trough in urea fundamentals (urea is a widely used nitrogen-based fertilizer) and remain confident in the long-term outlook for the segment. Our lack of exposure to the lithium ion theme hurt relative performance as names within this niche segment of the fertilizer and agricultural chemicals industry rose on investor optimism around the future potential of the electric car industry.
Our U.S.-based oil and gas E&P companies weighed heavily on absolute returns as oil prices resumed their slide during the period. Stock selection and an underweight position helped relative results, however. We are confident that the industry will remain challenged in light of technological advances in U.S. shale that have dramatically lowered the cost curve and boosted production, contributing to global oversupply in spite of renewed commitment to production cuts from OPEC countries. We prefer to avoid high beta names within the industry; instead, we favor producers with solid balance sheets, strong management teams, and an ability to generate solid relative returns on capital in a lower oil price environment. We believe such companies will be long-term winners over the course
EnergyServices and
Processors12%
EnergyIndustrials
12%
Metals andMining
7%
Chemicals16%
Explorationand Production19%
Other andReserves9%
Utilities9%
Integrateds16%
Based on net assets as of 6/30/17.
Industry Diversification

Proof #4
6
of the commodity bear market. Pioneer Natural Resources, EOG Resources, and Continental Resources were among the fund’s largest detractors. Although Concho Resources declined during the period, it outperformed the broader industry. In an environment of falling oil and gas prices, we believe the company, which focuses its operations in the Permian region, will continue to benefit from a low-cost drilling inventory and that it will deliver industry-leading production growth.
OUTLOOK
We believe that we are in the initial years of a long-term secular downcycle in commodities, although markets are likely to be disrupted by periodic bouts of cyclical volatility. In fact, cyclical and secular
performance are likely to be synchronized over the next few quarters. The broader market is beginning to recognize the profoundly disruptive impact that North American shale production volumes are having on global oil supply and prices. Oil prices rose in the closing months of 2016 and in early 2017 after OPEC announced it was limiting production. North American shale producers increased production in response to higher prices, which eventually contributed to renewed downward pressure on prices. This is consistent with our long-term view of a low-price environment for oil disrupted by brief periods of outperformance.
We are often asked: How low can oil prices go? We believe the rapid productivity gains seen in recent years—gains that we have described in greater detail in previous letters—will provide some surprising answers in the years ahead. This is particularly so if already high inventories and a cyclical upswing in supply happen to coincide with a downturn in the economic cycle or
a recession. While some market participants expect a return to higher oil prices, we believe average per-barrel prices will settle in the $40s over the long term, especially having recently witnessed the rapid production response of the U.S. shale industry at relatively benign prices. We note, however, that this ultimately depends on the degree to which technological innovation continues to improve productivity and drive down costs.
WEbELIEvEThAT
WEAREINThE
INITIALyEARSOFA
LONG-TERMSECULAR
dOWNCyCLEIN
COMMOdITIES,
ALThOUGhMARkETS
ARELIkELyTO
bEdISRUPTEdby
PERIOdICbOUTSOF
CyCLICALvOLATILITy.

Proof #4
7
Since November 2014, we have seen elevated volatility in the markets for commodities and high yield debt with prices trading in a wide cyclical range. Against this backdrop, we remain committed to bottom-up stock selection and our philosophy of buying and holding a diverse selection of fundamentally sound natural resources companies with healthy balance sheets and skilled management. Despite the potential for periodic bouts of short-term volatility, we will continue to make tactical portfolio adjustments as appropriate in the context of a secular downcycle in commodities. We believe the market will reward our disciplined and consistent investment approach over the long term.
Respectfully submitted,
Shawn DriscollPortfolio manager and chairman of the fund’s Investment Advisory Committee
July 21, 2017
The committee chairman has day-to-day responsibility for managing the portfolio and works with committee members in developing and executing the fund’s investment program.

Proof #4
8
T. Rowe Price New Era Fund
Risks of Stock Investing
Thefund’ssharepricecanfallbecauseofweaknessinthestockmarkets,aparticularindustry,orspecificholdings.Stockmarketscandeclineformanyreasons,includingadversepoliticaloreconomicdevelopments,changesininvestorpsychology,orheavyinstitutionalselling.Theprospectsforanindustryorcompanymaydeterioratebecauseofavarietyoffactors,includingdisappointingearningsorchangesinthecompetitiveenvironment.Inaddition,theinvestmentmanager’sassessmentofcompaniesheldinafundmayproveincorrect,resultinginlossesorpoorperformanceeveninrisingmarkets.Fundsthatinvestonlyinspecificindustrieswillexperiencegreatervolatilitythanfundsinvestinginabroadrangeofindustries.Therateofearningsgrowthofnaturalresourcescompaniesmaybeirregularsincethesecompaniesarestronglyaffectedbynaturalforces,globaleconomiccycles,andinternationalpolitics.Forexample,stockpricesofenergycompaniescanfallsharplywhenoilpricesfall.
Glossary
Lipper averages:TheaveragesofavailablemutualfundperformancereturnsforspecifiedtimeperiodsincategoriesdefinedbyLipperInc.
Lipper indexes:Fundbenchmarksthatconsistofasmallnumber(10to30)ofthelargestmutualfundsinaparticularcategoryastrackedbyLipperInc.
MSCI World Select Natural Resources Index: AnunmanagedindexthatmeasurestheperformanceofU.S.andinternationalstocksengagedintheextractionandproductionofnaturalresources.
S&P 500 Index: Anunmanagedindexthattracksthestocksof500primarilylarge-capU.S.companies.
Note:MSCImakesnoexpressorimpliedwarrantiesorrepresentationsandshallhavenoliabilitywhatsoeverwithrespecttoanyMSCIdatacontainedherein.TheMSCIdatamaynotbefurtherredistributedorusedasabasisforotherindicesoranysecuritiesorfinancialproducts.Thisreportisnotapproved,reviewed,orproducedbyMSCI.

Proof #4
9
T. Rowe Price New Era Fund
TWENTY-FIVE LARGEST HOLDINGS Percentof NetAssets 6/30/17
Total 4.5%ExxonMobil 2.9AirProducts&Chemicals 2.9OccidentalPetroleum 2.7EOGResources 2.6
ConchoResources 2.1vulcanMaterials 2.1PioneerNaturalResources 2.0RPM 2.0MarathonPetroleum 2.0
bakerhughesaGE 2.0AtmosEnergy 1.8EIduPontdeNemours 1.4ball 1.3AkzoNobel 1.2
CFIndustries 1.2boliden 1.1koninklijkevopak 1.1Sherwin-Williams 1.1PPGIndustries 1.1
Flowserve 1.1GalpEnergia 1.0Pentair 1.0Agrium 1.0EdisonInternational 1.0
Total 44.2%
Note:Theinformationshowndoesnotreflectanyexchange-tradedfunds(ETFs),cashreserves,orcollateralforsecuritieslendingthatmaybeheldintheportfolio.
Portfolio Highlights

Proof #4
10
T. Rowe Price New Era Fund
MAJOR PORTFOLIO CHANGESListedindescendingorderofsize.
SixMonthsEnded6/30/17
Largest Purchases Largest Sales
EOGResourcesGalpEnergia*TransCanada*Agrium*TechnipFMC***RSPPermian*Arconic*AkzoNobelParsleyEnergyContinentalResources
CimarexEnergyEQT**RoyaldutchShellPeytoExploration&development**Exelon**FMCTechnologies**NRGEnergyTechnipFMC***SouthernCopperSouthernCompany**
*Positionadded. **Positioneliminated.***Positionaddedandeliminated.
Portfolio Highlights

Proof #4
11
T. Rowe Price New Era Fund
Performance and Expenses
As of 6/30/17
6/07 6/08 6/09 6/10 6/11 6/12 6/13 6/14 6/15 6/16 6/17
N E W E R A F U N D
New Era Fund $9,675
S&P 500 Index $20,008
Lipper Global Natural Resources Funds Average $6,877
MSCI World Select Natural Resources Index $10,709
Note: Performance for the I Class will vary due to its differing fee structure. See returns table below.
10,000
15,000
20,000
25,000
30,000
$35,000
Growth of $10,000
Thischartshowsthevalueofahypothetical$10,000investmentinthefundoverthepast10fiscalyearperiodsorsinceinception(forfundslacking10-yearrecords).Theresultiscomparedwithbenchmarks,whichmayincludeabroad-basedmarketindexandapeergroupaverageorindex.Marketindexesdonotincludeexpenses,whicharedeductedfromfundreturnsaswellasmutualfundaveragesandindexes.
Since InceptionPeriodsEnded6/30/17 1year 5years 10years Inception date
NewEraFund 4.10% 3.05% -0.33% – –
NewEraFund–IClass 4.22 – – 14.50% 12/17/15
Current performance may be higher or lower than the quoted past performance, which cannot guarantee future results. Share price, principal value, and return will vary, and you may have a gain or loss when you sell your shares. For the most recent month-end performance, please visit our website (troweprice.com) or contact a T. Rowe Price representative at 1-800-225-5132 or, for I Class shares, 1-800-638-8790.
Thistableshowshowthefundwouldhaveperformedeachyearifitsactual(orcumulative)returnsfortheperiodsshownhadbeenearnedataconstantrate.Averageannualtotalreturnfiguresincludechangesinprincipalvalue,reinvesteddividends,andcapitalgaindistributions.Returnsdonotreflecttaxesthattheshareholdermaypayonfunddistributionsortheredemptionoffundshares.Whenassessingperformance,investorsshouldconsiderbothshort-andlong-termreturns.
Average Annual Compound Total Return

Proof #4
12
T. Rowe Price New Era Fund
NewEraFund 0.67%
NewEraFund–IClass 0.56
Theexpenseratioshownisasofthefund’sfiscalyearended12/31/16.Thisnumbermayvaryfromtheexpenseratioshownelsewhereinthisreportbecauseitisbasedonadifferenttimeperiodand,ifapplicable,includesacquiredfundfeesandexpensesbutdoesnotincludefeeorexpensewaivers.
Expense Ratio
Fund Expense Example
Asamutualfundshareholder,youmayincurtwotypesofcosts:(1)transactioncosts,suchasredemptionfeesorsalesloads,and(2)ongoingcosts,includingmanagementfees,distributionandservice(12b-1)fees,andotherfundexpenses.Thefollowingexampleisintendedtohelpyouunderstandyourongoingcosts(indollars)ofinvestinginthefundandtocomparethesecostswiththeongoingcostsofinvestinginothermutualfunds.Theexampleisbasedonaninvestmentof$1,000investedatthebeginningofthemostrecentsix-monthperiodandheldfortheentireperiod.
Pleasenotethatthefundhastwoshareclasses:Theoriginalshareclass(InvestorClass)chargesnodistributionandservice(12b-1)fee,andtheIClasssharesarealsoavailabletoinstitutionallyorientedclientsandimposeno12b-1oradministrativefeepayment.Eachshareclassispresentedseparatelyinthetable.
Actual ExpensesThefirstlineofthefollowingtable(Actual)providesinformationaboutactualaccountvaluesandexpensesbasedonthefund’sactualreturns.youmayusetheinformationonthisline,togetherwithyouraccountbalance,toestimatetheexpensesthatyoupaidovertheperiod.Simplydivideyouraccountvalueby$1,000(forexample,an$8,600accountvaluedividedby$1,000=8.6),thenmultiplytheresultbythenumberonthefirstlineundertheheading“ExpensesPaidduringPeriod”toestimatetheexpensesyoupaidonyouraccountduringthisperiod.
Hypothetical Example for Comparison PurposesTheinformationonthesecondlineofthetable(hypothetical)isbasedonhypotheticalaccountvaluesandexpensesderivedfromthefund’sactualexpenseratioandanassumed5%peryearrateofreturnbeforeexpenses(notthefund’sactualreturn).youmaycomparetheongoingcostsofinvestinginthefundwithotherfundsbycontrastingthis5%hypotheticalexampleandthe5%hypotheticalexamplesthatappearintheshareholderreportsoftheotherfunds.Thehypotheticalaccountvaluesandexpensesmaynotbeusedtoestimatetheactualendingaccountbalanceorexpensesyoupaidfortheperiod.

Proof #4
13
T. Rowe Price New Era Fund
Fund Expense Example (continued)
Note:T.RowePricechargesanannualaccountservicefeeof$20,generallyforaccountswithlessthan$10,000.ThefeeiswaivedforanyinvestorwhoseT.RowePricemutualfundaccountstotal$50,000ormore;accountselectingtoreceiveelectronicdeliveryofaccountstatements,transactionconfirmations,prospectuses,andshareholderreports;oraccountsofaninvestorwhoisaT.RowePricePersonalServicesorEnhancedPersonalServicesclient(enrollmentintheseprogramsgenerallyrequiresT.RowePriceassetsofatleast$250,000).Thisfeeisnotincludedintheaccompanyingtable.Ifyouaresubjecttothefee,keepitinmindwhenyouareestimatingtheongoingexpensesofinvestinginthefundandwhencomparingtheexpensesofthisfundwithotherfunds.
youshouldalsobeawarethattheexpensesshowninthetablehighlightonlyyourongoingcostsanddonotreflectanytransactioncosts,suchasredemptionfeesorsalesloads.Therefore,thesecondlineofthetableisusefulincomparingongoingcostsonlyandwillnothelpyoudeterminetherelativetotalcostsofowningdifferentfunds.Totheextentafundchargestransactioncosts,however,thetotalcostofowningthatfundishigher.
beginning Ending ExpensesPaid Accountvalue Accountvalue duringPeriod* 1/1/2017 6/30/2017 1/1/17to6/30/17
Investor ClassActual $1,000.00 $976.20 $3.38
hypothetical(assumes5%returnbeforeexpenses) 1,000.00 1,021.37 3.46
I ClassActual 1,000.00 976.80 2.74
hypothetical(assumes5%returnbeforeexpenses) 1,000.00 1,022.02 2.81
*Expensesareequaltothefund’sannualizedexpenseratioforthe6-monthperiod,multipliedbytheaverageaccountvalueovertheperiod,multipliedbythenumberofdaysinthemostrecentfiscalhalfyear(181),anddividedbythedaysintheyear(365)toreflectthehalf-yearperiod.TheannualizedexpenseratiooftheInvestorClasswas0.69%,andtheIClasswas0.56%.
New Era Fund

Proof #4
14
T. Rowe Price New Era FundUnaudited
Financial Highlights For a share outstanding throughout each period
The accompanying notes are an integral part of these financial statements.
Investor Class
6 Months Ended
6/30/17
Year Ended
12/31/16 12/31/15 12/31/14 12/31/13 12/31/12 NET ASSET VALUE
Beginning of period
$ 33.66 $ 27.27 $ 34.45 $ 44.42 $ 41.91
$ 42.05
Investment activities
Net investment income(1)
0.31
0.44
0.42
0.41
0.39
0.51
Net realized and unrealized gain / loss
(1.11)
6.38
(6.87)
(4.32)
6.03
1.16
Total from investment activities
(0.80)
6.82
(6.45)
(3.91)
6.42
1.67
Distributions
Net investment income
– (0.43) (0.42) (0.42) (0.25)
(0.53)
Net realized gain
– – (0.31) (5.64) (3.66)
(1.28)
Total distributions
– (0.43) (0.73) (6.06) (3.91)
(1.81)
NET ASSET VALUE
End of period $ 32.86 $ 33.66 $ 27.27 $ 34.45 $ 44.42 $ 41.91
Ratios/Supplemental Data Total return(2) (2.38)% 25.01% (18.76)% (7.83)% 15.72% 4.01%
Ratio of total expenses to average net assets
0.69%
(3) 0.67%
0.67%
0.65%
0.66%
0.67%
Ratio of net investment income to average net assets
1.89%
(3) 1.42%
1.28%
0.90%
0.87%
1.19%
Portfolio turnover rate
28.4% 65.6% 76.7% 61.9% 54.6%
37.5%
Net assets, end of period
(in millions)
$ 2,448 $ 2,842 $ 2,733 $ 3,611 $ 4,338
$ 4,440
(1) Per share amounts calculated using average shares outstanding method. (2) Total return reflects the rate that an investor would have earned on an investment in the fund
during each period, assuming reinvestment of all distributions. Total return is not annualized for periods less than one year.
(3) Annualized

Proof #4
15
T. Rowe Price New Era FundUnaudited
Financial Highlights For a share outstanding throughout each period
The accompanying notes are an integral part of these financial statements.
I Class
6 Months Ended
6/30/17
Year Ended
12/31/16
12/17/15(1)
Through 12/31/15
NET ASSET VALUE
Beginning of period
$ 33.66 $ 27.26
$ 27.08
Investment activities
Net investment income(2)
0.35
0.49
0.01
Net realized and unrealized gain / loss (1.13) 6.38
0.17
Total from investment activities (0.78) 6.87
0.18
Distributions
Net investment income – (0.47)
–
NET ASSET VALUE
End of period $ 32.88 $ 33.66 $ 27.26
Ratios/Supplemental Data Total return(3) (2.32)% 25.20% 0.66%
Ratio of total expenses to average net assets 0.56%(4)
0.56%
0.58%(4)
Ratio of net investment income to average net assets 2.12%(4)
1.53%
1.41%(4)
Portfolio turnover rate 28.4% 65.6%
76.7%
Net assets, end of period (in thousands) $ 993,864 $ 783,927
$ 6,389
(1) Inception date (2) Per share amounts calculated using average shares outstanding method. (3) Total return reflects the rate that an investor would have earned on an investment in the fund
during each period, assuming reinvestment of all distributions. Total return is not annualized for periods less than one year.
(4) Annualized

Proof #4
T. Rowe Price New Era FundUnaudited June 30, 2017
Portfolio of Investments ‡ Shares/Par $ Value
(Cost and value in $000s)
16
First Page Footer
COMMON STOCKS 96.8%
AGRICULTURE 4.4%
Fertilizers & Agricultural Chemicals 3.6%
Agrium 382,900 34,649
CF Industries 1,512,783 42,297
Incitec Pivot (AUD) 5,554,681 14,570
OCI (EUR) (1) 373,963 8,234
Yara International (NOK) 631,188 23,734
123,484
Packaged Foods & Meats 0.8%
Pilgrim's Pride (1) 455,400 9,982
Sanderson Farms 157,300 18,192
28,174
Total Agriculture 151,658
CHEMICALS 16.3%
Commodity Chemicals 1.1%
Orion Engineered Carbons 394,233 7,865
Valvoline 1,161,401 27,548
35,413
Diversified Chemicals 3.7%
Akzo Nobel (EUR) 486,368 42,299
EI du Pont de Nemours 614,700 49,612
PPG Industries 331,100 36,408
128,319
Industrial Gases 4.4%
Air Products & Chemicals 686,663 98,234
Linde (EUR) 154,609 29,430
Praxair 185,200 24,548
152,212

Proof #4
T. Rowe Price New Era Fund
Shares/Par $ Value
(Cost and value in $000s)
17
Specialty Chemicals 7.1%
Air Liquide (EUR) 116,081 14,347
Axalta Coating Systems (1) 300,000 9,612
Corbion (EUR) 578,376 18,498
Croda International (GBP) 646,606 32,746
PolyOne 275,522 10,674
RPM 1,284,000 70,042
Sherwin-Williams 104,450 36,658
Symrise (EUR) 257,422 18,264
Umicore (EUR) 190,663 13,263
Victrex (GBP) 844,004 20,619
244,723
Total Chemicals 560,667
ENERGY INDUSTRIALS 12.2%
Construction & Engineering 1.2%
Gamesa (EUR) 420,231 8,991
Granite Construction 427,700 20,632
Vestas Wind Systems (DKK) 109,784 10,141
39,764
Construction & Farm Machinery & Heavy Trucks 0.6%
AGCO 314,400 21,187
21,187
Construction Materials 3.0%
Buzzi Unicem (EUR) 466,893 11,642
Martin Marietta Materials 93,610 20,836
Vulcan Materials 565,300 71,612
104,090
Electrical Components & Equipment 0.7%
Legrand (EUR) 336,175 23,492
23,492

Proof #4
T. Rowe Price New Era Fund
Shares/Par $ Value
(Cost and value in $000s)
18
Industrial Conglomerates 0.5%
Carlisle Companies 168,600 16,085
16,085
Industrial Machinery 4.4%
Andritz (EUR) 262,757 15,853
Flowserve 779,700 36,201
Krones (EUR) 160,718 18,631
Mueller Water Products 1,206,800 14,095
Pentair 523,800 34,854
Sandvik (SEK) 1,153,479 18,161
Valmont Industries 83,500 12,491
150,286
Metal & Glass Containers 1.8%
Ball 1,079,000 45,545
Vidrala (EUR) 247,022 17,545
63,090
Total Energy Industrials 417,994
ENERGY SERVICES & PROCESSORS 12.2%
Oil & Gas Equipment & Services 6.4%
Aker Solutions (NOK) (1) 2,814,725 12,735
Baker Hughes 1,260,000 68,682
Dril-Quip (1) 216,100 10,546
Frank's International 934,000 7,743
Halliburton 456,000 19,476
Oceaneering International 592,700 13,537
SBM Offshore (EUR) 936,271 14,998
Schlumberger 414,550 27,294
Tenaris (EUR) 1,742,110 27,201
US Silica Holdings 461,000 16,361
218,573

Proof #4
T. Rowe Price New Era Fund
Shares/Par $ Value
(Cost and value in $000s)
19
Oil & Gas Refining & Marketing 2.9%
Marathon Petroleum 1,328,369 69,514
Murphy USA (1) 319,100 23,648
Tesoro Petroleum 74,290 6,953
100,115
Oil & Gas Storage & Transportation 2.9%
Enbridge 536,460 21,356
Koninklijke Vopak (EUR) 796,042 36,888
TransCanada 688,100 32,802
Venture Global LNG, Series C, Acquisition Date: 5/25/17 Cost $8,699 (1)(2)(3) 2,438 8,699
99,745
Total Energy Services & Processors 418,433
EXPLORATION & PRODUCTION 18.2%
Non-U.S. Oil & Gas Exploration & Production 6.1%
Advantage Oil & Gas (CAD) (1) 2,474,443 16,734
ARC Resources (CAD) 2,241,091 29,310
Cairn Energy (GBP) (1) 6,123,541 13,749
Canadian Natural Resources 619,800 17,875
Encana 2,731,800 24,040
Kelt Exploration (CAD) (1) 2,983,100 14,446
Kosmos Energy (1) 3,734,860 23,941
Lundin Petroleum (SEK) (1) 798,236 15,385
Seven Generations Energy, Class A (CAD) (1) 1,820,553 31,180
Woodside Petroleum (AUD) 1,000,625 22,953
209,613
U.S. Mixed Exploration & Production 0.1%
Comstock Resources (1) 561,307 3,968
3,968

Proof #4
T. Rowe Price New Era Fund
Shares/Par $ Value
(Cost and value in $000s)
20
U.S. Oil Exploration & Production 12.0%
Centennial Resource Development Acquisition Date: 12/28/16 - 6/8/17, Cost $1,031 (1)(2) 71,137 1,069
Centennial Resource Development, Class A (1) 1,743,983 27,590
Cimarex Energy 172,540 16,220
Concho Resources (1) 607,000 73,769
Continental Resources (1) 814,300 26,326
Diamondback Energy (1) 275,600 24,476
EOG Resources 974,072 88,173
Jagged Peak Energy (1) 1,213,600 16,202
Matador Resources (1) 730,653 15,614
Parsley Energy, Class A (1) 891,840 24,749
Pioneer Natural Resources 441,550 70,462
RSP Permian (1) 640,000 20,653
TPG Pace Energy Holdings, Equity Units (1) 854,200 8,918
414,221
Total Exploration & Production 627,802
INTEGRATEDS 13.9%
Integrated Oil & Gas 13.9%
Chevron 236,800 24,705
ExxonMobil 1,254,159 101,248
Galp Energia (EUR) 2,381,884 36,095
Hess 404,100 17,728
Occidental Petroleum 1,544,374 92,462
Royal Dutch Shell, B Shares (GBP) 1,131,146 30,367
Suncor Energy 768,100 22,429
Total (EUR) 3,107,769 154,291
Total Integrateds 479,325
METALS & MINING 7.4%
Diversified Metals & Mining 4.4%
Antofagasta (GBP) 1,480,236 15,443

Proof #4
T. Rowe Price New Era Fund
Shares/Par $ Value
(Cost and value in $000s)
21
Arconic 928,400 21,028
Boliden (SEK) 1,357,771 37,115
First Quantum Minerals (CAD) 1,127,200 9,535
Independence (AUD) 8,041,467 19,451
Lundin Mining (CAD) 2,877,243 16,352
Southern Copper 908,500 31,462
150,386
Precious Metals & Minerals 3.0%
Centamin (GBP) 4,602,635 9,297
Evolution Mining (AUD) 6,121,583 11,362
Franco-Nevada (CAD) 186,350 13,446
Fresnillo (GBP) 867,482 16,816
New Gold (1) 3,705,200 11,782
Osisko Gold Royalties (CAD) 891,200 10,893
Randgold Resources (GBP) 331,544 29,420
103,016
Total Metals & Mining 253,402
OTHER 1.8%
Paper & Forest Products 1.3%
Bemis 444,300 20,549
International Paper 127,978 7,245
Orora (AUD) 8,003,800 17,589
Weyerhaeuser, REIT 495,303 16,593
Total Other 61,976
UTILITIES 7.3%
Electric Utilities 2.3%
Edison International 442,100 34,568
Eversource Energy 172,700 10,485
Red Electrica (EUR) 1,362,748 28,509
Proof #4
T. Rowe Price New Era Fund
Shares/Par $ Value
(Cost and value in $000s)
22
Westar Energy 132,300 7,014
80,576
Gas Utilities 2.2%
Atmos Energy 765,734 63,518
Italgas (EUR) 2,194,295 11,066
74,584
Independent Power Producers & Energy Traders 0.2%
NRG Energy 437,200 7,529
7,529
Multi-Utilities 2.6%
CMS Energy 390,500 18,061
National Grid (GBP) 2,286,077 28,325
NiSource 760,700 19,291
PG&E 359,300 23,847
89,524
Water Utilities 0.0%
Western Water, Acquisition Date: 2/17/06, Cost $297 (1)(2)(3) 2,259 —
Western Water, Warrants, 9/1/17 Acquisition Date: 10/16/09 - 8/24/11, Cost $0 (1)(2)(3) 12,766 —
—
Total Utilities 252,213
Total Miscellaneous Common Stocks 3.1% (4) 107,880
Total Common Stocks (Cost $2,853,702) 3,331,350
PREFERRED STOCKS 0.5%
Total Miscellaneous Preferred Stocks 0.5% (4) 16,399
Total Preferred Stocks (Cost $16,807) 16,399

Proof #4
T. Rowe Price New Era Fund
Shares/Par $ Value
(Cost and value in $000s)
23
CONVERTIBLE PREFERRED STOCKS 1.2%
UTILITIES 1.2%
Electric Utilities 0.8%
NextEra Energy 532,827 28,198
28,198
Multi-Utilities 0.4%
DTE Energy 279,800 15,149
15,149
Total Utilities 43,347
Total Convertible Preferred Stocks (Cost $40,533) 43,347
CORPORATE BONDS 0.2%
CF Industries, 5.375%, 3/15/44 6,210,000 5,558
Total Corporate Bonds (Cost $5,246) 5,558
BANK LOANS 0.0% (5)
UTILITIES 0.0%
Western Water, VR, 10.00%, 9/1/17 (1)(3)(6) 2,200,476 —
Total Utilities —
Total Bank Loans (Cost $1,991) —

Proof #4
T. Rowe Price New Era Fund
Shares/Par $ Value
(Cost and value in $000s)
24
SHORT-TERM INVESTMENTS 0.9%
Money Market Funds 0.9%
T. Rowe Price Government Reserve Fund, 0.99% (7)(8) 29,862,895 29,863
Total Short-Term Investments (Cost $29,863) 29,863
Total Investments in Securities
99.6% of Net Assets (Cost $2,948,142) $ 3,426,517
‡ Shares/Par are denominated in U.S. dollars unless otherwise noted. (1) Non-income producing (2)
Security cannot be offered for public resale without first being registered under the Securities Act of 1933 and related rules ("restricted security"). Acquisition date represents the day on which an enforceable right to acquire such security is obtained and is presented along with related cost in the security description. The fund has registration rights for certain restricted securities. Any costs related to such registration are borne by the issuer. The aggregate value of restricted securities (excluding 144A holdings) at period-end amounts to $9,768 and represents 0.3% of net assets.
(3) Level 3 in fair value hierarchy. See Note 2. (4)
The identity of certain securities has been concealed to protect the fund while it completes a purchase or selling program for the securities.
(5)
Bank loan positions may involve multiple underlying tranches. In those instances, the position presented reflects the aggregate of those respective underlying tranches and the rate presented reflects their weighted average rate.
(6) In default with respect to payment of interest. (7) Affiliated Company (8) Seven-day yield
AUD Australian Dollar CAD Canadian Dollar DKK Danish Krone EUR Euro GBP British Pound NOK Norwegian Krone REIT
A domestic Real Estate Investment Trust whose distributions pass-through with original tax character to the shareholder
SEK Swedish Krona VR Variable Rate; rate shown is effective rate at period-end.

Proof #4
T. Rowe Price New Era Fund
25
The accompanying notes are an integral part of these financial statements.
Affiliated Companies
($000s)
The fund may invest in certain securities that are considered affiliated companies. As defined by the 1940 Act, an affiliated company is one in which the fund owns 5% or more of the outstanding voting securities, or a company which is under common ownership or control. The following securities were considered affiliated companies for all or some portion of the six months ended June 30, 2017. Purchase and sales cost and investment income reflect all activity for the period then ended.
Affiliate
PurchaseCost
SalesCost
InvestmentIncome
Value6/30/17
Value12/31/16
Comstock Resources $ — $ 2,669 $ — $ * $ 8,170T. Rowe Price Government Reserve Fund ¤ ¤ 105 29,863 40,154Totals $ 105 $ 29,863 $ 48,324
* On the date indicated, issuer was held but not considered an affiliated company
¤ Purchase and sale information not shown for cash management funds.
Amounts reflected on the accompanying financial statements include the following amounts related to affiliated companies:
Investment in securities, at cost $ 29,863
Dividend income 105 Interest income —
Investment income $ 105
Realized gain (loss) on securities $ (518)
Capital gain distributions from mutual funds $ —

Proof #4
26
T. Rowe Price New Era FundUnaudited June 30, 2017
The accompanying notes are an integral part of these financial statements.
($000s, except shares and per share amounts)
Statement of Assets and Liabilities
Assets
Investments in securities, at value (cost $2,948,142) $ 3,426,517
Receivable for shares sold 8,791
Foreign currency (cost $6,667) 6,755
Dividends and interest receivable 5,918
Receivable for investment securities sold 4,101
Other assets 8,987
Total assets 3,461,069
Liabilities
Payable for investment securities purchased 7,357
Payable for shares redeemed 2,396
Investment management fees payable 1,525
Due to affiliates 196
Payable to directors 4
Other liabilities 7,652
Total liabilities 19,130
NET ASSETS $ 3,441,939 Net Assets Consist of:
Undistributed net investment income $ 34,838
Accumulated undistributed net realized loss (290,161)
Net unrealized gain 478,497
Paid-in capital applicable to 104,732,008 shares of $1.00 par value capital stock outstanding; 300,000,000 shares authorized 3,218,765
NET ASSETS $ 3,441,939 NET ASSET VALUE PER SHARE
Investor Class ($2,448,075,651 / 74,501,904 shares outstanding) $ 32.86
I Class ($993,863,824 / 30,230,104 shares outstanding) $ 32.88
Proof #4
T. Rowe Price New Era FundUnaudited
($000s)
Statement of Operations
27
The accompanying notes are an integral part of these financial statements.
6 Months Ended
6/30/17Investment Income (Loss)
Income Dividend (net of foreign taxes of $2,624) $ 45,256 Interest 168 Securities lending 12 Other 7
Total income 45,443
Expenses Investment management 9,444 Shareholder servicing
Investor Class $ 1,641 I Class 5 1,646
Prospectus and shareholder reports Investor Class 59 I Class 3 62
Custody and accounting 194 Registration 73 Legal and audit 15 Directors 6 Miscellaneous 24
Total expenses 11,464
Net investment income 33,979
Realized and Unrealized Gain / Loss
Net realized gain (loss) Securities 84,056 Foreign currency transactions 191
Net realized gain 84,247
Change in net unrealized gain / loss
Securities (201,922) Other assets and liabilities denominated in foreign currencies 92
Change in net unrealized gain / loss (201,830)
Net realized and unrealized gain / loss (117,583)
DECREASE IN NET ASSETS FROM OPERATIONS $ (83,604)

Proof #4
T. Rowe Price New Era FundUnaudited
($000s)
28
Statement of Changes in Net Assets
6 Months Ended
6/30/17
Year Ended
12/31/16Increase (Decrease) in Net Assets
Operations Net investment income $ 33,979 $ 46,076 Net realized gain (loss) 84,247 (11,226) Change in net unrealized gain / loss (201,830) 667,283 Increase (decrease) in net assets from operations (83,604) 702,133
Distributions to shareholders
Net investment income Investor Class – (36,191) I Class – (10,145)
Decrease in net assets from distributions – (46,336)
Capital share transactions*
Shares sold Investor Class 171,112 488,572 I Class 268,332 760,938
Distributions reinvested Investor Class – 34,024 I Class – 9,576
Shares redeemed Investor Class (503,631) (993,736) I Class (35,943) (69,030)
Increase (decrease) in net assets from capital share transactions (100,130) 230,344
Net Assets
Increase (decrease) during period (183,734) 886,141 Beginning of period 3,625,673 2,739,532
End of period $ 3,441,939 $ 3,625,673

Proof #4
T. Rowe Price New Era FundUnaudited
($000s)
29
The accompanying notes are an integral part of these financial statements.
Statement of Changes in Net Assets
6 Months Ended
6/30/17
Year Ended
12/31/16 Undistributed net investment income 34,838 859
*Share information
Shares sold Investor Class 5,136 15,742 I Class 8,023 24,885
Distributions reinvested Investor Class – 1,009 I Class – 284
Shares redeemed Investor Class (15,048) (32,581) I Class (1,082) (2,114)
Increase (decrease) in shares outstanding (2,971) 7,225

Proof #4
30
T. Rowe Price New Era FundUnaudited June 30, 2017
Notes to Financial Statements
T. Rowe Price New Era Fund, Inc. (the fund), is registered under the Investment Company Act of 1940 (the 1940 Act) as a diversified, open-end management investment company. The fund seeks to provide long-term capital growth primarily through the common stock of companies that own or develop natural resources and other basic commodities, and also through the stocks of selected nonresource growth companies. The fund has two classes of shares: the New Era Fund (Investor Class) and the New Era Fund–I Class (I Class). I Class shares generally are available only to investors meeting a $1,000,000 minimum investment or certain other criteria. Each class has exclusive voting rights on matters related solely to that class; separate voting rights on matters that relate to both classes; and, in all other respects, the same rights and obligations as the other class.
NOTE 1 - SIGNIFICANT ACCOUNTING POLICIES
Basis of Preparation The fund is an investment company and follows accounting and reporting guidance in the Financial Accounting Standards Board (FASB) Accounting Standards Codification Topic 946 (ASC 946). The accompanying financial statements were prepared in accordance with accounting principles generally accepted in the United States of America (GAAP), including, but not limited to, ASC 946. GAAP requires the use of estimates made by management. Management believes that estimates and valuations are appropriate; however, actual results may differ from those estimates, and the valuations reflected in the accompanying financial statements may differ from the value ultimately realized upon sale or maturity.
Investment Transactions, Investment Income, and Distributions Income and expenses are recorded on the accrual basis. Premiums and discounts on debt securities are amortized for financial reporting purposes. Dividends received from mutual fund investments are reflected as dividend income; capital gain distributions are reflected as realized gain/loss. Dividend income and capital gain distributions are recorded on the ex-dividend date. Income tax-related interest and penalties, if incurred, would be recorded as income tax expense. Investment transactions are accounted for on the trade date. Realized gains and losses are reported on the identified cost basis. Distributions from REITs are initially recorded as dividend income and, to the extent such represent a

Proof #4
31
T. Rowe Price New Era Fund
return of capital or capital gain for tax purposes, are reclassified when such information becomes available. Income distributions are declared and paid by each class annually. Distributions to shareholders are recorded on the ex-dividend date. A capital gain distribution may also be declared and paid by the fund annually.
Currency Translation Assets, including investments, and liabilities denominated in foreign currencies are translated into U.S. dollar values each day at the prevailing exchange rate, using the mean of the bid and asked prices of such currencies against U.S. dollars as quoted by a major bank. Purchases and sales of securities, income, and expenses are translated into U.S. dollars at the prevailing exchange rate on the date of the transaction. The effect of changes in foreign currency exchange rates on realized and unrealized security gains and losses is reflected as a component of security gains and losses.
Class Accounting Shareholder servicing, prospectus, and shareholder report expenses incurred by each class are charged directly to the class to which they relate. Expenses common to both classes, investment income, and realized and unrealized gains and losses are allocated to the classes based upon the relative daily net assets of each class.
Rebates Subject to best execution, the fund may direct certain security trades to brokers who have agreed to rebate a portion of the related brokerage commission to the fund in cash. Commission rebates are reflected as realized gain on securities in the accompanying financial statements and totaled $68,000 for the six months ended June 30, 2017.
New Accounting Guidance In October 2016, the Securities and Exchange Commission (SEC) issued a new rule, Investment Company Reporting Modernization, which, among other provisions, amends Regulation S-X to require standardized, enhanced disclosures, particularly related to derivatives, in investment company financial statements. Compliance with the guidance is effective for financial statements related to periods ending on or after August 1, 2017; adoption will have no effect on the fund’s net assets or results of operations.

Proof #4
32
T. Rowe Price New Era Fund
NOTE 2 - VALUATION
The fund’s financial instruments are valued and each class’s net asset value (NAV) per share is computed at the close of the New York Stock Exchange (NYSE), normally 4 p.m. ET, each day the NYSE is open for business. However, the NAV per share may be calculated at a time other than the normal close of the NYSE if trading on the NYSE is restricted, if the NYSE closes earlier, or as may be permitted by the SEC.
Fair Value The fund’s financial instruments are reported at fair value, which GAAP defines as the price that would be received to sell an asset or paid to transfer a liability in an orderly transaction between market participants at the measurement date. The T. Rowe Price Valuation Committee (the Valuation Committee) is an internal committee that has been delegated certain respon-sibilities by the fund’s Board of Directors [or Trustees] (the Board) to ensure that financial instruments are appropriately priced at fair value in accordance with GAAP and the 1940 Act. Subject to oversight by the Board, the Valuation Committee develops and oversees pricing-related policies and procedures and approves all fair value determinations. Specifically, the Valuation Committee establishes procedures to value securities; determines pricing techniques, sources, and persons eligible to effect fair value pricing actions; oversees the selection, services, and performance of pricing vendors; oversees valuation-related business continuity practices; and provides guidance on internal controls and valuation-related matters. The Valuation Committee reports to the Board and has representation from legal, portfolio management and trading, operations, risk management, and the fund’s treasurer.
Various valuation techniques and inputs are used to determine the fair value of financial instruments. GAAP establishes the following fair value hierarchy that categorizes the inputs used to measure fair value:
Level 1 – quoted prices (unadjusted) in active markets for identical financial instruments that the fund can access at the reporting date
Level 2 – inputs other than Level 1 quoted prices that are observable, either directly or indirectly (including, but not limited to, quoted prices for similar financial instruments in active markets, quoted prices for identical or similar financial instruments in inactive markets, interest rates and yield curves, implied volatilities, and credit spreads)
Level 3 – unobservable inputs

Proof #4
33
T. Rowe Price New Era Fund
Observable inputs are developed using market data, such as publicly available information about actual events or transactions, and reflect the assumptions that market participants would use to price the financial instrument. Unobservable inputs are those for which market data are not available and are developed using the best information available about the assumptions that market participants would use to price the financial instrument. GAAP requires valuation techniques to maximize the use of relevant observable inputs and minimize the use of unobservable inputs. When multiple inputs are used to derive fair value, the financial instrument is assigned to the level within the fair value hierarchy based on the lowest-level input that is significant to the fair value of the financial instrument. Input levels are not necessarily an indication of the risk or liquidity associated with financial instruments at that level but rather the degree of judgment used in determining those values.
Valuation Techniques Equity securities listed or regularly traded on a securities exchange or in the over-the-counter (OTC) market are valued at the last quoted sale price or, for certain markets, the official closing price at the time the valuations are made. OTC Bulletin Board securities are valued at the mean of the closing bid and asked prices. A security that is listed or traded on more than one exchange is valued at the quotation on the exchange determined to be the primary market for such security. Listed securities not traded on a particular day are valued at the mean of the closing bid and asked prices for domestic securities and the last quoted sale or closing price for international securities.
For valuation purposes, the last quoted prices of non-U.S. equity securities may be adjusted to reflect the fair value of such securities at the close of the NYSE. If the fund determines that developments between the close of a foreign market and the close of the NYSE will affect the value of some or all of its portfolio securities, the fund will adjust the previous quoted prices to reflect what it believes to be the fair value of the securities as of the close of the NYSE. In deciding whether it is necessary to adjust quoted prices to reflect fair value, the fund reviews a variety of factors, including developments in foreign markets, the performance of U.S. securities markets, and the performance of instruments trading in U.S. markets that represent foreign securities and baskets of foreign securities. The fund may also fair value securities in other situations, such as when a particular foreign market is closed but the fund is open. The fund uses outside pricing services to provide it with quoted prices and information to

Proof #4
34
T. Rowe Price New Era Fund
evaluate or adjust those prices. The fund cannot predict how often it will use quoted prices and how often it will determine it necessary to adjust those prices to reflect fair value. As a means of evaluating its security valuation process, the fund routinely compares quoted prices, the next day’s opening prices in the same markets, and adjusted prices.
Actively traded equity securities listed on a domestic exchange generally are categorized in Level 1 of the fair value hierarchy. Non-U.S. equity securities generally are categorized in Level 2 of the fair value hierarchy despite the availability of quoted prices because, as described above, the fund evaluates and determines whether those quoted prices reflect fair value at the close of the NYSE or require adjustment. OTC Bulletin Board securities, certain preferred securities, and equity securities traded in inactive markets generally are categorized in Level 2 of the fair value hierarchy.
Debt securities generally are traded in the OTC market. Securities with remaining maturities of one year or more at the time of acquisition are valued at prices furnished by dealers who make markets in such securities or by an independent pricing service, which considers the yield or price of bonds of comparable quality, coupon, maturity, and type, as well as prices quoted by dealers who make markets in such securities. Generally, debt securities are categorized in Level 2 of the fair value hierarchy; however, to the extent the valuations include significant unobservable inputs, the securities would be categorized in Level 3.
Investments in mutual funds are valued at the mutual fund’s closing NAV per share on the day of valuation and are categorized in Level 1 of the fair value hierarchy. Assets and liabilities other than financial instruments, including short-term receivables and payables, are carried at cost, or estimated realizable value, if less, which approximates fair value.
Thinly traded financial instruments and those for which the above valuation procedures are inappropriate or are deemed not to reflect fair value are stated at fair value as determined in good faith by the Valuation Committee. The objective of any fair value pricing determination is to arrive at a price that could reasonably be expected from a current sale. Financial instruments fair valued by the Valuation Committee are primarily private placements, restricted securities, warrants, rights, and other securities that are not publicly traded.

Proof #4
35
T. Rowe Price New Era Fund
Subject to oversight by the Board, the Valuation Committee regularly makes good faith judgments to establish and adjust the fair valuations of certain securities as events occur and circumstances warrant. For instance, in determining the fair value of an equity investment with limited market activity, such as a private placement or a thinly traded public company stock, the Valuation Committee considers a variety of factors, which may include, but are not limited to, the issuer’s business prospects, its financial standing and performance, recent investment transactions in the issuer, new rounds of financing, negotiated transactions of significant size between other investors in the company, relevant market valuations of peer companies, strategic events affecting the company, market liquidity for the issuer, and general economic conditions and events. In consultation with the investment and pricing teams, the Valuation Committee will determine an appropriate valuation technique based on available information, which may include both observable and unobservable inputs. The Valuation Committee typically will afford greatest weight to actual prices in arm’s length transactions, to the extent they represent orderly transactions between market participants, transaction information can be reliably obtained, and prices are deemed representative of fair value. However, the Valuation Committee may also consider other valuation methods such as market-based valuation multiples; a discount or premium from market value of a similar, freely traded security of the same issuer; or some combination. Fair value determinations are reviewed on a regular basis and updated as information becomes available, including actual purchase and sale transactions of the issue. Because any fair value determination involves a significant amount of judgment, there is a degree of subjectivity inherent in such pricing decisions, and fair value prices determined by the Valuation Committee could differ from those of other market participants. Depending on the relative significance of unobservable inputs, including the valuation technique(s) used, fair valued securities may be categorized in Level 2 or 3 of the fair value hierarchy.

Proof #4
36
T. Rowe Price New Era Fund
Valuation Inputs The following table summarizes the fund’s financial instruments, based on the inputs used to determine their fair values on June 30, 2017:
($000s) Level 1 Level 2 Level 3 Total Value
Quoted Prices
Significant Observable
Inputs
Significant Unobservable
Inputs
InvestmentsinSecurities,except: $ 29,863 $ — $ — $ 29,863
CommonStocks 2,163,724 1,158,927 8,699 3,331,350
PreferredStocks — 16,399 — 16,399
ConvertiblePreferredStocks — 43,347 — 43,347
Corporatebonds — 5,558 — 5,558
Total $ 2,193,587 $ 1,224,231 $ 8,699 $ 3,426,517
There were no material transfers between Levels 1 and 2 during the six months ended June 30, 2017.
Following is a reconciliation of the fund’s Level 3 holdings for the six months ended June 30, 2017. Gain (loss) reflects both realized and change in unrealized gain/loss on Level 3 holdings during the period, if any, and is included on the accompanying Statement of Operations. The change in unrealized gain/loss on Level 3 instruments held at June 30, 2017, totaled $0 for the six months ended June 30, 2017.
($000s) BeginningBalance1/1/17
Gain (Loss)DuringPeriod
Total Purchases
EndingBalance
6/30/17
InvestmentsinSecurities
CommonStocks $ — $ — $ 8,699 $ 8,699

Proof #4
37
T. Rowe Price New Era Fund
NOTE 3 - OTHER INVESTMENT TRANSACTIONS
Consistent with its investment objective, the fund engages in the following practices to manage exposure to certain risks and/or to enhance performance. The investment objective, policies, program, and risk factors of the fund are described more fully in the fund’s prospectus and Statement of Additional Information.
Restricted Securities The fund may invest in securities that are subject to legal or contractual restrictions on resale. Prompt sale of such securities at an acceptable price may be difficult and may involve substantial delays and additional costs.
Bank Loans The fund may invest in bank loans, which represent an interest in amounts owed by a borrower to a syndicate of lenders. Bank loans are generally noninvestment grade and often involve borrowers whose financial condition is highly leveraged. Bank loans may be in the form of either assignments or participations. A loan assignment transfers all legal, beneficial, and economic rights to the buyer, and transfer typically requires consent of both the borrower and agent. In contrast, a loan participation generally entitles the buyer to receive the cash flows from principal, interest, and any fee payments on a portion of a loan; however, the seller continues to hold legal title to that portion of the loan. As a result, the buyer of a loan participation generally has no direct recourse against the borrower and is exposed to credit risk of both the borrower and seller of the participation. Bank loans often have extended settlement periods, usually may be repaid at any time at the option of the borrower, and may require additional principal to be funded at the borrowers’ discretion at a later date (unfunded commitments). Until settlement, the fund maintains liquid assets sufficient to settle its unfunded loan commitments. The fund reflects both the funded portion of a bank loan as well as its unfunded commitment in the Portfolio of Investments. However, if a credit agreement provides no initial funding of a tranche, and funding of the full commitment at a future date(s) is at the borrower’s discretion and considered uncertain, a loan is reflected in the Portfolio of Investments only if, and only to the extent that, the fund has actually settled a funding commitment.
Securities Lending The fund may lend its securities to approved brokers to earn additional income. Its securities lending activities are administered by a lending agent in accordance with a securities lending agreement. Security loans generally do not have stated maturity dates, and the fund may recall a security at any time. The fund receives collateral in the form of cash or U.S.

Proof #4
38
T. Rowe Price New Era Fund
government securities, valued at 102% to 105% of the value of the securities on loan. Collateral is maintained over the life of the loan in an amount not less than the value of loaned securities; any additional collateral required due to changes in security values is delivered to the fund the next business day. Cash collateral is invested by the lending agent(s) in accordance with investment guidelines approved by fund management. Additionally, the lending agent indemnifies the fund against losses resulting from borrower default. Although risk is mitigated by the collateral and indemnification, the fund could experi-ence a delay in recovering its securities and a possible loss of income or value if the borrower fails to return the securities, collateral investments decline in value, and the lending agent fails to perform. Securities lending revenue consists of earnings on invested collateral and borrowing fees, net of any rebates to the borrower, compensation to the lending agent, and other administrative costs. In accordance with GAAP, investments made with cash collateral are reflected in the accompanying financial statements, but collateral received in the form of securities is not. At June 30, 2017, there were no securities on loan.
Other Purchases and sales of portfolio securities other than short-term securities aggregated $987,256,000 and $1,037,975,000, respectively, for the six months ended June 30, 2017.
NOTE 4 - FEDERAL INCOME TAxES
No provision for federal income taxes is required since the fund intends to continue to qualify as a regulated investment company under Subchapter M of the Internal Revenue Code and distribute to shareholders all of its tax-able income and gains. Distributions determined in accordance with federal income tax regulations may differ in amount or character from net investment income and realized gains for financial reporting purposes. Financial reporting records are adjusted for permanent book/tax differences to reflect tax character but are not adjusted for temporary differences. The amount and character of tax-basis distributions and composition of net assets are finalized at fiscal year-end; accordingly, tax-basis balances have not been determined as of the date of this report.
The fund intends to retain realized gains to the extent of available capital loss carryforwards. Net realized capital losses may be carried forward indefinitely to offset future realized capital gains. As of December 31, 2016, the fund had $346,871,000 of available capital loss carryforwards.

Proof #4
39
T. Rowe Price New Era Fund
At June 30, 2017, the cost of investments for federal income tax purposes was $2,956,678,000. Net unrealized gain aggregated $460,961,000 at period-end, of which $621,466,000 related to appreciated investments and $160,505,000 related to depreciated investments.
NOTE 5 - FOREIGN TAxES
The fund is subject to foreign income taxes imposed by certain countries in which it invests. Additionally, certain foreign currency transactions are subject to tax, and capital gains realized upon disposition of securities issued in or by certain foreign countries are subject to capital gains tax imposed by those coun-tries. All taxes are computed in accordance with the applicable foreign tax law, and, to the extent permitted, capital losses are used to offset capital gains. Taxes attributable to income are accrued by the fund as a reduction of income. Taxes incurred on the purchase of foreign currencies are recorded as realized loss on foreign currency transactions. Current and deferred tax expense attributable to capital gains is reflected as a component of realized or change in unrealized gain/loss on securities in the accompanying financial statements. At June 30, 2017, the fund had no deferred tax liability attributable to foreign securities and no foreign capital loss carryforwards.
NOTE 6 - RELATED PARTY TRANSACTIONS
The fund is managed by T. Rowe Price Associates, Inc. (Price Associates), a wholly owned subsidiary of T. Rowe Price Group, Inc. (Price Group). Price Associates has entered into a sub-advisory agreement(s) with one or more of its wholly owned subsidiaries, to provide investment advisory services to the fund. The investment management agreement between the fund and Price Associates provides for an annual investment management fee, which is computed daily and paid monthly. The fee consists of an individual fund fee, equal to 0.25% of the fund’s average daily net assets, and a group fee. The group fee rate is calculated based on the combined net assets of certain mutual funds sponsored by Price Associates (the group) applied to a graduated fee schedule, with rates ranging from 0.48% for the first $1 billion of assets to 0.265% for assets in excess of $650 billion. The fund’s group fee is determined by applying the group fee rate to the fund’s average daily net assets. At June 30, 2017, the effective annual group fee rate was 0.29%.
Proof #4
40
T. Rowe Price New Era Fund
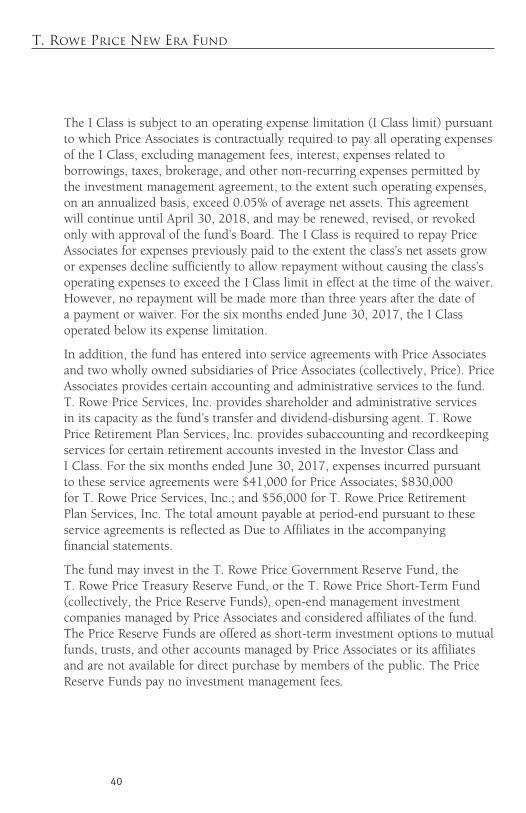
The I Class is subject to an operating expense limitation (I Class limit) pursuant to which Price Associates is contractually required to pay all operating expenses of the I Class, excluding management fees, interest, expenses related to borrowings, taxes, brokerage, and other non-recurring expenses permitted by the investment management agreement, to the extent such operating expenses, on an annualized basis, exceed 0.05% of average net assets. This agreement will continue until April 30, 2018, and may be renewed, revised, or revoked only with approval of the fund’s Board. The I Class is required to repay Price Associates for expenses previously paid to the extent the class’s net assets grow or expenses decline sufficiently to allow repayment without causing the class’s operating expenses to exceed the I Class limit in effect at the time of the waiver. However, no repayment will be made more than three years after the date of a payment or waiver. For the six months ended June 30, 2017, the I Class operated below its expense limitation.
In addition, the fund has entered into service agreements with Price Associates and two wholly owned subsidiaries of Price Associates (collectively, Price). Price Associates provides certain accounting and administrative services to the fund. T. Rowe Price Services, Inc. provides shareholder and administrative services in its capacity as the fund’s transfer and dividend-disbursing agent. T. Rowe Price Retirement Plan Services, Inc. provides subaccounting and recordkeeping services for certain retirement accounts invested in the Investor Class and I Class. For the six months ended June 30, 2017, expenses incurred pursuant to these service agreements were $41,000 for Price Associates; $830,000 for T. Rowe Price Services, Inc.; and $56,000 for T. Rowe Price Retirement Plan Services, Inc. The total amount payable at period-end pursuant to these service agreements is reflected as Due to Affiliates in the accompanying financial statements.
The fund may invest in the T. Rowe Price Government Reserve Fund, the T. Rowe Price Treasury Reserve Fund, or the T. Rowe Price Short-Term Fund (collectively, the Price Reserve Funds), open-end management investment companies managed by Price Associates and considered affiliates of the fund. The Price Reserve Funds are offered as short-term investment options to mutual funds, trusts, and other accounts managed by Price Associates or its affiliates and are not available for direct purchase by members of the public. The Price Reserve Funds pay no investment management fees.
Proof #4
41
T. Rowe Price New Era Fund
The fund may participate in securities purchase and sale transactions with other funds or accounts advised by Price Associates (cross trades), in accordance with procedures adopted by the fund’s Board and Securities and Exchange Commission rules, which require, among other things, that such purchase and sale cross trades be effected at the independent current market price of the security. During the six months ended June 30, 2017, the fund had no purchases or sales cross trades with other funds or accounts advised by Price Associates.

Proof #4
42
T. Rowe Price New Era Fund
Information on Proxy Voting Policies, Procedures, and Records
AdescriptionofthepoliciesandproceduresusedbyT.RowePricefundsandportfoliostodeterminehowtovoteproxiesrelatingtoportfoliosecuritiesisavailableineachfund’sStatementofAdditionalInformation.youmayrequestthisdocumentbycalling1-800-225-5132orbyaccessingtheSEC’swebsite,sec.gov.
Thedescriptionofourproxyvotingpoliciesandproceduresisalsoavailableonourcorporatewebsite.Toaccessit,pleasevisitthefollowingWebpage:
https://www3.troweprice.com/usis/corporate/en/utility/policies.html
Scrolldowntothesectionnearthebottomofthepagethatsays,“ProxyvotingPolicies.”ClickontheProxyvotingPolicieslinkintheshadedbox.
Eachfund’smostrecentannualproxyvotingrecordisavailableonourwebsiteandthroughtheSEC’swebsite.ToaccessitthroughT.RowePrice,visitthewebsitelocationshownabove,andscrolldowntothesectionnearthebottomofthepagethatsays,“ProxyvotingRecords.”ClickontheProxyvotingRecordslinkintheshadedbox.
How to Obtain Quarterly Portfolio Holdings
ThefundfilesacompletescheduleofportfolioholdingswiththeSecuritiesandExchangeCommissionforthefirstandthirdquartersofeachfiscalyearonFormN-Q.Thefund’sFormN-QisavailableelectronicallyontheSEC’swebsite(sec.gov);hardcopiesmaybereviewedandcopiedattheSEC’sPublicReferenceRoom,100FSt.N.E.,Washington,dC20549.FormoreinformationonthePublicReferenceRoom,call1-800-SEC-0330.

Proof #4
43
T. Rowe Price New Era Fund
Approval of Investment Management Agreement
Eachyear,thefund’sboardofdirectors(board)considersthecontinuationoftheinvestmentmanagementagreement(AdvisoryContract)betweenthefundanditsinvestmentadvisor,T.RowePriceAssociates,Inc.(Advisor).Inthatregard,atanin-personmeetingheldonMarch6–7,2017(Meeting),theboard,includingamajorityofthefund’sindependentdirectors,approvedthecontinuationofthefund’sAdvisoryContract.AttheMeeting,theboardconsideredthefactorsandreachedtheconclusionsdescribedbelowrelatingtotheselectionoftheAdvisorandtheapprovaloftheAdvisoryContract.TheindependentdirectorswereassistedintheirevaluationoftheAdvisoryContractbyindependentlegalcounselfromwhomtheyreceivedseparatelegaladviceandwithwhomtheymetseparately.
Inprovidinginformationtotheboard,theAdvisorwasguidedbyadetailedsetofrequestsforinformationsubmittedbyindependentlegalcounselonbehalfoftheindependentdirectors.InconsideringandapprovingtheAdvisoryContract,theboardconsideredtheinformationitbelievedwasrelevant,including,butnotlimitedto,theinformationdiscussedbelow.TheboardconsiderednotonlythespecificinformationpresentedinconnectionwiththeMeetingbutalsotheknowledgegainedovertimethroughinteractionwiththeAdvisoraboutvarioustopics.Theboardmeetsregularlyand,ateachofitsmeetings,coversanextensiveagendaoftopicsandmaterialsandconsidersfactorsthatarerelevanttoitsannualconsiderationoftherenewaloftheT.RowePricefunds’advisorycontracts,includingperformanceandtheservicesandsupportprovidedtothefundsandtheirshareholders.
Services Provided by the Advisor Theboardconsideredthenature,quality,andextentoftheservicesprovidedtothefundbytheAdvisor.Theseservicesincluded,butwerenotlimitedto,directingthefund’sinvestmentsinaccordancewithitsinvestmentprogramandtheoverallmanagementofthefund’sportfolio,aswellasavarietyofrelatedactivitiessuchasfinancial,investmentoperations,andadministrativeservices;compliance;maintainingthefund’srecordsandregistrations;andshareholdercommunications.TheboardalsoreviewedthebackgroundandexperienceoftheAdvisor’sseniormanagementteamandinvestmentpersonnelinvolvedinthemanagementofthefund,aswellastheAdvisor’scompliancerecord.Theboardconcludedthatitwassatisfiedwiththenature,quality,andextentoftheservicesprovidedbytheAdvisor.
Investment Performance of the Fund TheboardtookintoaccountdiscussionswiththeAdvisorandreportsthatitreceivesthroughouttheyearrelatingtofundperformance.InconnectionwiththeMeeting,theboardreviewedthefund’snetannualizedtotalreturnsforthe1-,2-,3-,4-,5-,and10-yearperiodsasofSeptember30,2016,andcomparedthesereturnswiththeperformanceofapeergroupoffundswithsimilarinvestmentprogramsandawidevarietyofotherpreviouslyagreed-uponcomparableperformancemeasuresandmarketdata,includingthosesuppliedbybroadridge,whichisanindependentproviderofmutualfunddata.

Proof #4
44
T. Rowe Price New Era Fund
Approval of Investment Management Agreement (continued)
Onthebasisofthisevaluationandtheboard’songoingreviewofinvestmentresults,andfactoringintherelativemarketconditionsduringcertainoftheperformanceperiods,theboardconcludedthatthefund’sperformancewassatisfactory.
Costs, Benefits, Profits, and Economies of ScaleTheboardrevieweddetailedinformationregardingtherevenuesreceivedbytheAdvisorundertheAdvisoryContractandotherbenefitsthattheAdvisor(anditsaffiliates)mayhaverealizedfromitsrelationshipwiththefund,includinganyresearchreceivedunder“softdollar”agreementsandcommission-sharingarrangementswithbroker-dealers.TheboardconsideredthattheAdvisormayreceivesomebenefitfromsoft-dollararrangementspursuanttowhichresearchisreceivedfrombroker-dealersthatexecutethefund’sportfoliotransactions.TheboardreceivedinformationontheestimatedcostsincurredandprofitsrealizedbytheAdvisorfrommanagingtheT.RowePricefunds.Theboardalsoreviewedestimatesoftheprofitsrealizedfrommanagingthefundinparticular,andtheboardconcludedthattheAdvisor’sprofitswerereasonableinlightoftheservicesprovidedtothefund.
TheboardalsoconsideredwhetherthefundbenefitsunderthefeelevelssetforthintheAdvisoryContractfromanyeconomiesofscalerealizedbytheAdvisor.UndertheAdvisoryContract,thefundpaysafeetotheAdvisorforinvestmentmanagementservicescomposedoftwocomponents—agroupfeeratebasedonthecombinedaveragenetassetsofmostoftheT.RowePricefunds(includingthefund)thatdeclinesatcertainassetlevelsandanindividualfundfeeratebasedonthefund’saveragedailynetassets—andthefundpaysitsownexpensesofoperations(subjecttoanexpenselimitationagreedtobytheAdvisorwithrespecttothefund’sIClass).AttheMeeting,theboardapprovedanadditional0.005%breakpointtothegroupfeeschedule,effectiveMay1,2017.Withthenewbreakpoint,thegroupfeeratewilldeclineto0.265%whenthecombinedaveragenetassetsoftheapplicableT.RowePricefundsexceed$650billion.Theboardconcludedthattheadvisoryfeestructureforthefundcontinuedtoprovideforareasonablesharingofbenefitsfromanyeconomiesofscalewiththefund’sinvestors.
Fees and ExpensesTheboardwasprovidedwithinformationregardingindustrytrendsinmanagementfeesandexpenses.Amongotherthings,theboardrevieweddataforpeergroupsthatwerecompiledbybroadridge,whichcompared:(i)contractualmanagementfees,totalexpenses,actualmanagementfees,andnon-managementexpensesoftheInvestorClassofthefundwithagroupofcompetitorfundsselectedbybroadridge(ExpenseGroup)and(ii)totalexpenses,actualmanagementfees,andnon-managementexpensesoftheInvestorClassofthefundwithabroadersetoffundswithintheLipperinvestmentclassification(ExpenseUniverse).Theboardconsideredthefund’scontractualmanagementfeerate,actualmanagementfeerate(whichreflectsthemanagementfeesactuallyreceivedfromthefundbytheAdvisorafteranyapplicablewaivers,reductions,orreimbursements),operatingexpenses,andtotalexpenses(whichreflectsthenettotal

Proof #4
45
T. Rowe Price New Era Fund
Approval of Investment Management Agreement (continued)
expenseratioofthefundafteranywaivers,reductions,orreimbursements)incomparisonwiththeinformationforthebroadridgepeergroups.broadridgegenerallyconstructedthepeergroupsbyseekingthemostcomparablefundsbasedonsimilarinvestmentclassificationsandobjectives,expensestructure,assetsize,andoperatingcomponentsandattributesandrankedfundsintoquintiles,withthefirstquintilerepresentingthefundswiththelowestrelativeexpensesandthefifthquintilerepresentingthefundswiththehighestrelativeexpenses.Theinformationprovidedtotheboardindicatedthatthefund’scontractualmanagementfeerankedinthefirstquintile(ExpenseGroup),thefund’sactualmanagementfeeraterankedinthefirstquintile(ExpenseGroupandExpenseUniverse),andthefund’stotalexpensesrankedinthefirstquintile(ExpenseGroupandExpenseUniverse).
TheboardalsoreviewedthefeeschedulesforinstitutionalaccountsandprivateaccountswithsimilarmandatesthatareadvisedorsubadvisedbytheAdvisoranditsaffiliates.ManagementprovidedtheboardwithinformationabouttheAdvisor’sresponsibilitiesandservicesprovidedtosubadvisoryandotherinstitutionalaccountclients,includinginformationabouthowtherequirementsandeconomicsoftheinstitutionalbusinessarefundamentallydifferentfromthoseofthemutualfundbusiness.TheboardconsideredinformationshowingthattheAdvisor’smutualfundbusinessisgenerallymorecomplexfromabusinessandcomplianceperspectivethanitsinstitutionalaccountbusinessandconsideredvariousrelevantfactors,suchasthebroaderscopeofoperationsandoversight,moreextensiveshareholdercommunicationinfrastructure,greaterassetflows,heightenedbusinessrisks,anddifferencesinapplicablelawsandregulationsassociatedwiththeAdvisor’sproprietarymutualfundbusiness.Inassessingthereasonablenessofthefund’smanagementfeerate,theboardconsideredthedifferencesinthenatureoftheservicesrequiredfortheAdvisortomanageitsmutualfundbusinessversusmanagingadiscretepoolofassetsasasubadvisortoanotherinstitution’smutualfundorforaninstitutionalaccountandthattheAdvisorgenerallyperformssignificantadditionalservicesandassumesgreaterriskinmanagingthefundandotherT.RowePricefundsthanitdoesforinstitutionalaccountclients.
Onthebasisoftheinformationprovidedandthefactorsconsidered,theboardconcludedthatthefeespaidbythefundundertheAdvisoryContractarereasonable.
Approval of the Advisory Contract Asnoted,theboardapprovedthecontinuationoftheAdvisoryContract.Nosinglefactorwasconsideredinisolationortobedeterminativetothedecision.Rather,theboardconcluded,inlightofaweightingandbalancingofallfactorsconsidered,thatitwasinthebestinterestsofthefundanditsshareholdersfortheboardtoapprovethecontinuationoftheAdvisoryContract(includingthefeestobechargedforservicesthereunder).
Proof #4
F41-051 8/17201708-229569
STOCK FUNDSDomestic Blue Chip GrowthCapital Appreciation‡
Capital OpportunityDiversified Mid-Cap GrowthDividend GrowthEquity IncomeEquity Index 500Extended Equity Market IndexFinancial ServicesGrowth & IncomeGrowth StockHealth Sciences‡
Media & TelecommunicationsMid-Cap Growth‡
Mid-Cap Value‡
New America GrowthNew EraNew Horizons‡
QM U.S. Small & Mid-Cap Core EquityQM U.S. Small-Cap Growth EquityQM U.S. Value EquityReal EstateScience & TechnologySmall-Cap Stock‡
Small-Cap ValueTax-Efficient Equity Total Equity Market IndexU.S. Large-Cap CoreValue
ASSET ALLOCATION FUNDSBalanced Global AllocationPersonal Strategy BalancedPersonal Strategy GrowthPersonal Strategy IncomeReal AssetsSpectrum GrowthSpectrum IncomeSpectrum InternationalTarget Date Fundsˆ
BOND FUNDSDomestic TaxableCorporate IncomeCredit OpportunitiesFloating RateGNMA High Yield‡
Inflation Protected BondLimited Duration Inflation
Focused BondNew IncomeShort-Term BondTotal ReturnUltra Short-Term BondU.S. Bond Enhanced IndexU.S. High YieldU.S. Treasury IntermediateU.S. Treasury Long-Term
Domestic Tax-FreeCalifornia Tax-Free BondGeorgia Tax-Free BondIntermediate Tax-Free High YieldMaryland Short-Term Tax-Free BondMaryland Tax-Free BondNew Jersey Tax-Free BondNew York Tax-Free BondSummit Municipal IncomeSummit Municipal IntermediateTax-Free High YieldTax-Free IncomeTax-Free Short-IntermediateVirginia Tax-Free Bond
MONEY MARKET FUNDSTaxableCash Reserves1
Government Money2
U.S. Treasury Money2
MONEY MARKET FUNDS (cont.)Tax-FreeCalifornia Tax-Free Money1
Maryland Tax-Free Money1
New York Tax-Free Money1
Summit Municipal Money Market1
Tax-Exempt Money1
INTERNATIONAL/GLOBAL FUNDSStockAfrica & Middle EastAsia OpportunitiesEmerging EuropeEmerging Markets StockEmerging Markets Value StockEuropean Stock Global ConsumerGlobal Growth StockGlobal IndustrialsGlobal Real EstateGlobal StockGlobal Technology‡‡
International Concentrated EquityInternational DiscoveryInternational Equity IndexInternational StockInternational Value EquityJapanLatin AmericaNew AsiaOverseas StockQM Global Equity
BondDynamic Global BondEmerging Markets BondEmerging Markets Corporate BondEmerging Markets Local Currency BondGlobal High Income BondGlobal Multi-Sector BondInternational BondInternational Bond (USD Hedged)
T.RowePriceInvestmentServices,Inc.100EastPrattStreetbaltimore,Md21202
Thispagecontainssupplementaryinformationthatisnotpartoftheshareholderreport.
T. Rowe Price Mutual Funds
Call 1-800-225-5132 to request a prospectus or summary prospectus; each includes investment objectives, risks, fees, expenses, and other information that you should read and consider carefully before investing. ‡Subjecttocertainexceptions,thefundiscurrentlyclosedtonewinvestorsandnewaccounts.‡‡EffectiveatthecloseofbusinessonFriday,September29,2017,thefundwillbeclosedtonewinvestorsandnewaccounts,subjecttocertainexceptions.
ˆTheTargetdateFundsareinclusiveoftheRetirementFunds,theTargetFunds,andtheRetirementbalancedFund.
1 Retail Funds: You could lose money by investing in the Fund. Although the Fund seeks to preserve the value of your investment at $1.00 per share, it cannot guarantee it will do so. Beginning October 14, 2016, the Fund may impose a fee upon the sale of your shares or may temporarily suspend your ability to sell shares if the Fund’s liquidity falls below required minimums because of market conditions or other factors. An investment in the Fund is not insured or guaranteed by the Federal Deposit Insurance Corporation or any other government agency. The Fund’s sponsor has no legal obligation to provide financial support to the Fund, and you should not expect that the sponsor will provide financial support to the Fund at any time.
2 Government Funds: You could lose money by investing in the Fund. Although the Fund seeks to preserve the value of your investment at $1.00 per share, it cannot guarantee it will do so. An investment in the Fund is not insured or guaranteed by the Federal Deposit Insurance Corporation or any other government agency. The Fund’s sponsor has no legal obligation to provide financial support to the Fund, and you should not expect that the sponsor will provide financial support to the Fund at any time.