prnhx new horizons fund prjix new horizons …individual.troweprice.com/gcfiles/pdf/arnhf.pdfproof...
TRANSCRIPT
Proof #4
December 31, 2017
PRNHX
PRJIX
ANNUALREPORT
New Horizons Fund
New Horizons Fund– I Class
T. Rowe PRICe
The fund invests in small-cap, emerging growth companies that are early in their corporate life cycles.
Proof #4
REPORTS ON THE WEB
Sign up for our Email Program, and you can begin to receive updated fund reports and prospectuses online rather than through the mail. Log in to your account at troweprice.com for more information.
HIGHLIGHTS
• Mostmajorstockindexesfinishedtheyearnearrecordlevelsamidexpectationsthatthenewtaxlawwouldliftcorporateearningsandaddtoeconomicgrowthin2018.
• TheNewHorizonsFundposteda31.49%returninthe12-monthreportingperiod,outperformingitsbenchmarkandLipperpeergroupindex.
• Inthisletter,weanalyzethekeydriversofthefund’sperformanceoverthepasteightyearsanddiscusshowourinvestmentprocesscanbeimprovedtodrivefutureperformance.
• Thecurrentenvironmentisseeminglyidealforequities,withsolidandimprovinggrowthpairedwithfiscalstimulusthatisencouraginginvestorstoacceptahigherlevelofrisk.Evenso,weareawarethatwearelateinthecycleandthatvaluationsarehighrelativetotraditionalmetrics.
T. Rowe Price New Horizons Fund
TheviewsandopinionsinthisreportwerecurrentasofDecember31,2017.They are not guarantees of performance or investment results andshouldnotbe takenas investmentadvice. Investmentdecisionsreflectavarietyof factors,and themanagers reserve the right tochange theirviews about individual stocks, sectors, and the markets at any time.As a result, the views expressed should not be relied upon as a fore-castof the fund’s future investment intent.Thereport iscertifiedunderthe Sarbanes-Oxley Act, which requiresmutual funds and other publiccompanies to affirm that, to the best of their knowledge, the informa-tionintheirfinancialreportsisfairlyandaccuratelystatedinallmaterialrespects.
Proof #4
T. Rowe Price New Horizons Fund
Manager’s Letter
1
Fellow Shareholders
Your fund solidly outperformed its benchmark and peer group and returned more
than 31% in the 12-month reporting period. Our performance is the result of our
philosophy and investment process throughout the years. In this letter, we will
seek to further illustrate our innovative approach to investing in private companies
and how we engage our early-stage growth companies in building a durable and
sustainable business.
PERfORmaNcE REvIEW
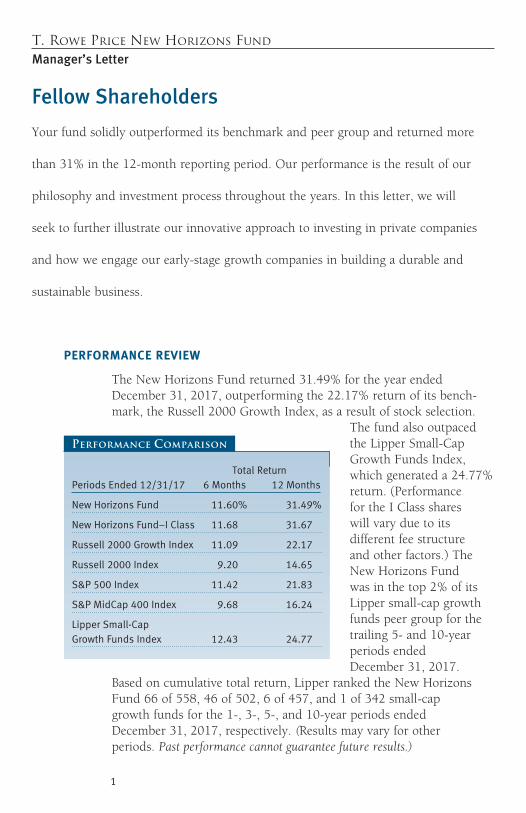
The New Horizons Fund returned 31.49% for the year ended December 31, 2017, outperforming the 22.17% return of its bench-mark, the Russell 2000 Growth Index, as a result of stock selection.
The fund also outpaced the Lipper Small-Cap Growth Funds Index, which generated a 24.77% return. (Performance for the I Class shares will vary due to its different fee structure and other factors.) The New Horizons Fund was in the top 2% of its Lipper small-cap growth funds peer group for the trailing 5- and 10-year periods ended December 31, 2017.
Based on cumulative total return, Lipper ranked the New Horizons Fund 66 of 558, 46 of 502, 6 of 457, and 1 of 342 small-cap growth funds for the 1-, 3-, 5-, and 10-year periods ended December 31, 2017, respectively. (Results may vary for other periods. Past performance cannot guarantee future results.)
TotalReturnPeriodsEnded12/31/17 6Months 12Months
NewHorizonsFund 11.60% 31.49%
NewHorizonsFund–IClass 11.68 31.67
Russell2000GrowthIndex 11.09 22.17
Russell2000Index 9.20 14.65
S&P500Index 11.42 21.83
S&PMidCap400Index 9.68 16.24
LipperSmall-CapGrowthFundsIndex 12.43 24.77
Performance Comparison
Proof #4
2
maRkET ENvIRONmENT
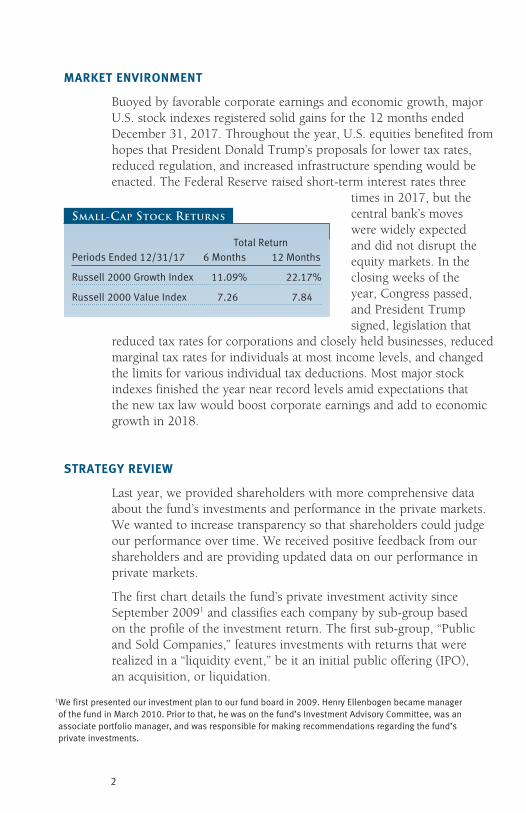
Buoyed by favorable corporate earnings and economic growth, major U.S. stock indexes registered solid gains for the 12 months ended December 31, 2017. Throughout the year, U.S. equities benefited from hopes that President Donald Trump’s proposals for lower tax rates, reduced regulation, and increased infrastructure spending would be enacted. The Federal Reserve raised short-term interest rates three
times in 2017, but the central bank’s moves were widely expected and did not disrupt the equity markets. In the closing weeks of the year, Congress passed, and President Trump signed, legislation that
reduced tax rates for corporations and closely held businesses, reduced marginal tax rates for individuals at most income levels, and changed the limits for various individual tax deductions. Most major stock indexes finished the year near record levels amid expectations that the new tax law would boost corporate earnings and add to economic growth in 2018.
STRaTEGy REvIEW
Last year, we provided shareholders with more comprehensive data about the fund’s investments and performance in the private markets. We wanted to increase transparency so that shareholders could judge our performance over time. We received positive feedback from our shareholders and are providing updated data on our performance in private markets.
The first chart details the fund’s private investment activity since September 20091 and classifies each company by sub-group based on the profile of the investment return. The first sub-group, “Public and Sold Companies,” features investments with returns that were realized in a “liquidity event,” be it an initial public offering (IPO), an acquisition, or liquidation.
1Wefirstpresentedourinvestmentplantoourfundboardin2009.HenryEllenbogenbecamemanagerofthefundinMarch2010.Priortothat,hewasonthefund’sInvestmentAdvisoryCommittee,wasanassociateportfoliomanager,andwasresponsibleformakingrecommendationsregardingthefund’sprivateinvestments.
TotalReturnPeriodsEnded12/31/17 6Months 12Months
Russell2000GrowthIndex 11.09% 22.17%
Russell2000ValueIndex 7.26 7.84
Small-Cap Stock Returns
Proof #4
3
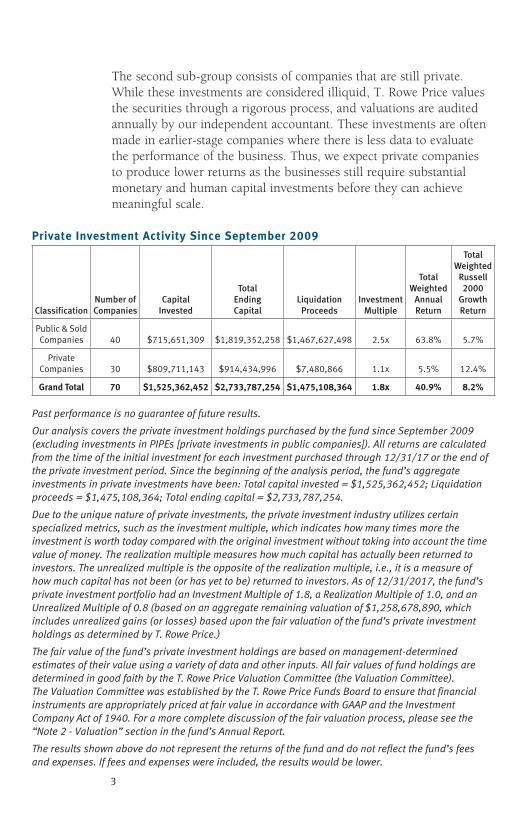
The second sub-group consists of companies that are still private. While these investments are considered illiquid, T. Rowe Price values the securities through a rigorous process, and valuations are audited annually by our independent accountant. These investments are often made in earlier-stage companies where there is less data to evaluate the performance of the business. Thus, we expect private companies to produce lower returns as the businesses still require substantial monetary and human capital investments before they can achieve meaningful scale.
Private Investment activity Since September 2009
ClassificationNumber of Companies
Capital Invested
Total Ending Capital
Liquidation Proceeds
Investment Multiple
Total Weighted
Annual Return
Total Weighted
Russell 2000
Growth Return
Public&SoldCompanies 40 $715,651,309 $1,819,352,258 $1,467,627,498 2.5x 63.8% 5.7%
PrivateCompanies 30 $809,711,143 $914,434,996 $7,480,866 1.1x 5.5% 12.4%
Grand Total 70 $1,525,362,452 $2,733,787,254 $1,475,108,364 1.8x 40.9% 8.2%
Past performance is no guarantee of future results.
Our analysis covers the private investment holdings purchased by the fund since September 2009 (excluding investments in PIPEs [private investments in public companies]). All returns are calculated from the time of the initial investment for each investment purchased through 12/31/17 or the end of the private investment period. Since the beginning of the analysis period, the fund’s aggregate investments in private investments have been: Total capital invested = $1,525,362,452; Liquidation proceeds = $1,475,108,364; Total ending capital = $2,733,787,254.
Due to the unique nature of private investments, the private investment industry utilizes certain specialized metrics, such as the investment multiple, which indicates how many times more the investment is worth today compared with the original investment without taking into account the time value of money. The realization multiple measures how much capital has actually been returned to investors. The unrealized multiple is the opposite of the realization multiple, i.e., it is a measure of how much capital has not been (or has yet to be) returned to investors. As of 12/31/2017, the fund’s private investment portfolio had an Investment Multiple of 1.8, a Realization Multiple of 1.0, and an Unrealized Multiple of 0.8 (based on an aggregate remaining valuation of $1,258,678,890, which includes unrealized gains (or losses) based upon the fair valuation of the fund’s private investment holdings as determined by T. Rowe Price.)
The fair value of the fund’s private investment holdings are based on management-determined estimates of their value using a variety of data and other inputs. All fair values of fund holdings are determined in good faith by the T. Rowe Price Valuation Committee (the Valuation Committee). The Valuation Committee was established by the T. Rowe Price Funds Board to ensure that financial instruments are appropriately priced at fair value in accordance with GAAP and the Investment Company Act of 1940. For a more complete discussion of the fair valuation process, please see the “Note 2 - Valuation” section in the fund’s Annual Report.
The results shown above do not represent the returns of the fund and do not reflect the fund’s fees and expenses. If fees and expenses were included, the results would be lower.
Proof #4
4
“Total Weighted Annual Return” represents the annualized returns of our private security holdings by evaluating the cash flows of the securities over the periods indicated: taking into account any drawdowns, distributions, income, or dividends; the timing of our investments; and the investment’s final value (if any). This is equivalent to a money-weighted daily internal rate of return (IRR).
“Total Weighted Russell 2000 Growth Return” represents the results of the Russell 2000 Growth Index adjusted to mirror the capital inflows and outflows of our private investments (money-weighted daily IRR). The adjustment is intended to make the comparison between our private investment activities and the Index more meaningful.
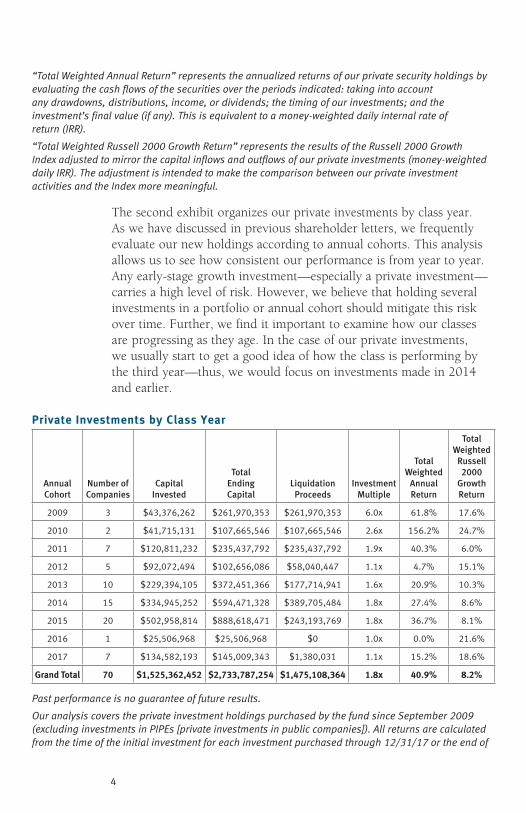
The second exhibit organizes our private investments by class year. As we have discussed in previous shareholder letters, we frequently evaluate our new holdings according to annual cohorts. This analysis allows us to see how consistent our performance is from year to year. Any early-stage growth investment—especially a private investment—carries a high level of risk. However, we believe that holding several investments in a portfolio or annual cohort should mitigate this risk over time. Further, we find it important to examine how our classes are progressing as they age. In the case of our private investments, we usually start to get a good idea of how the class is performing by the third year—thus, we would focus on investments made in 2014 and earlier.
Private Investments by class year
Annual Cohort
Number of Companies
Capital Invested
Total Ending Capital
Liquidation Proceeds
Investment Multiple
Total Weighted
Annual Return
Total Weighted
Russell 2000
Growth Return
2009 3 $43,376,262 $261,970,353 $261,970,353 6.0x 61.8% 17.6%
2010 2 $41,715,131 $107,665,546 $107,665,546 2.6x 156.2% 24.7%
2011 7 $120,811,232 $235,437,792 $235,437,792 1.9x 40.3% 6.0%
2012 5 $92,072,494 $102,656,086 $58,040,447 1.1x 4.7% 15.1%
2013 10 $229,394,105 $372,451,366 $177,714,941 1.6x 20.9% 10.3%
2014 15 $334,945,252 $594,471,328 $389,705,484 1.8x 27.4% 8.6%
2015 20 $502,958,814 $888,618,471 $243,193,769 1.8x 36.7% 8.1%
2016 1 $25,506,968 $25,506,968 $0 1.0x 0.0% 21.6%
2017 7 $134,582,193 $145,009,343 $1,380,031 1.1x 15.2% 18.6%
Grand Total 70 $1,525,362,452 $2,733,787,254 $1,475,108,364 1.8x 40.9% 8.2%
Past performance is no guarantee of future results.
Our analysis covers the private investment holdings purchased by the fund since September 2009 (excluding investments in PIPEs [private investments in public companies]). All returns are calculated from the time of the initial investment for each investment purchased through 12/31/17 or the end of
Proof #4
5
the private investment period. Since the beginning of the analysis period, the fund’s aggregate investments in private investments have been: Total capital invested = $1,525,362,452; Liquidation proceeds = $1,475,108,364; Total ending capital = $2,733,787,254.
Due to the unique nature of private investments, the private investment industry utilizes certain specialized metrics, such as the investment multiple, which indicates how many times more the investment is worth today compared with the original investment without taking into account the time value of money. The realization multiple measures how much capital has actually been returned to investors. The unrealized multiple is the opposite of the realization multiple, i.e., it is a measure of how much capital has not been (or has yet to be) returned to investors. As of 12/31/2017, the fund’s private investment portfolio had an Investment Multiple of 1.8, a Realization Multiple of 1.0, and an Unrealized Multiple of 0.8 (based on an aggregate remaining valuation of $1,258,678,890, which includes unrealized gains (or losses) based upon the fair valuation of the fund’s private investment holdings as determined by T. Rowe Price.)
The fair value of the fund’s private investment holdings are based on management-determined estimates of their value using a variety of data and other inputs. All fair values of fund holdings are determined in good faith by the T. Rowe Price Valuation Committee (the “Valuation Committee”). The Valuation Committee was established by the T. Rowe Price Funds Board to ensure that financial instruments are appropriately priced at fair value in accordance with GAAP and the Investment Company Act of 1940. For a more complete discussion of the fair valuation process, please see the “Note 2 - Valuation” section in the fund’s Annual Report.
The results shown above do not represent the returns of the fund and do not reflect the fund’s fees and expenses. If fees and expenses were included, the results would be lower.
“Total Weighted Annual Return” represents the annualized returns of our private security holdings by evaluating the cash flows of the securities over the periods indicated: taking into account any drawdowns, distributions, income, or dividends; the timing of our investments; and the investment’s final value (if any). This is equivalent to a money-weighted daily internal rate of return (IRR).
“Total Weighted Russell 2000 Growth Return” represents the results of the Russell 2000 Growth Index adjusted to mirror the capital inflows and outflows of our private investments (money-weighted daily IRR). The adjustment is intended to make the comparison between our private investment activities and the Index more meaningful.
As we have stated in the past, we view our private investing as an extension of our early-stage growth investing discipline and not as a distinct practice. In past shareholder letters, we discussed our Act I and Act II framework for early-stage growth investing. Our goal is to buy shares in our successful early-stage growth companies as their stock price is rising, but in our view, has not yet peaked. We call this “dollar cost averaging up.” One of the principal reasons we invest in private companies is to encourage them to think about scale in people, processes, or systems. Often, our best contribution is introducing companies to outside executives who understand the concept of scale. We have seen a number of situations in which companies decided to add these executives to their boards. Chewy, one of the fund’s leading performers in 2017, is a good example of this in practice. After our initial 2014 investment in Chewy, we introduced the company’s chief executive to an entrepreneur who had been directly involved with two
Proof #4
6
successful companies in which our fund had invested. The company later decided to bring him on as chairman. We believe this move contributed to Chewy’s success scaling its business and teams, which resulted in its $3.35 billion acquisition by PetSmart in mid-2017. (Please refer to the fund’s portfolio of investments for a complete list of holdings and the amount each represents in the portfolio.)
In 2017, three of the top 10 contributors to the fund’s performance were private investments, including CarGurus (class of 2015), GrubHub (class of 2014), and Atlassian (class of 2014). Of note, we generated substantially more value for shareholders by holding Atlassian and GrubHub as public companies than as private investments. We believe this is consistent with our philosophy of holding on to our winners.
When looking at the top contributors to the fund’s outperformance (alpha) versus the Russell 2000 Growth Index benchmark over the trailing five-year period, we found that the top 10 securities were responsible for 86% of our total alpha generation over the past five years, and the top 20 contributed 130%—meaning that the results of this group were partially offset by the performance of other holdings. The takeaway from the fund’s performance is clear—wealth creation is concentrated among a select few winners over long periods.
The study “Do Stocks Outperform Treasury Bills” by Hendrik Bessembinder of Arizona State University2 supports this notion, finding that the entire gain in the U.S. stock market since 19263 was attributable to fewer than the best-performing 4% of listed stocks and the average stock matched the return on the one-month Treasury bill. The idea of letting your winners run is more of an empirical fact than a heuristic for investing—the mathematical reality is that selling a scarce winner dramatically increases the probability that proceeds are deployed in lower-quality, lower-expected-return assets over time.
2Bessembinder,Hendrik,“DoStocksOutperformTreasuryBills”ArizonaStateUniversity(2017)p.20.3BasedontheCenterforResearchinSecurityPricesmonthlystockreturndatabase,whichcontainsallcommonlistedstocksontheNYSE,AMEX,andNASDAQexchangesfrom1926-2015.
Proof #4
7
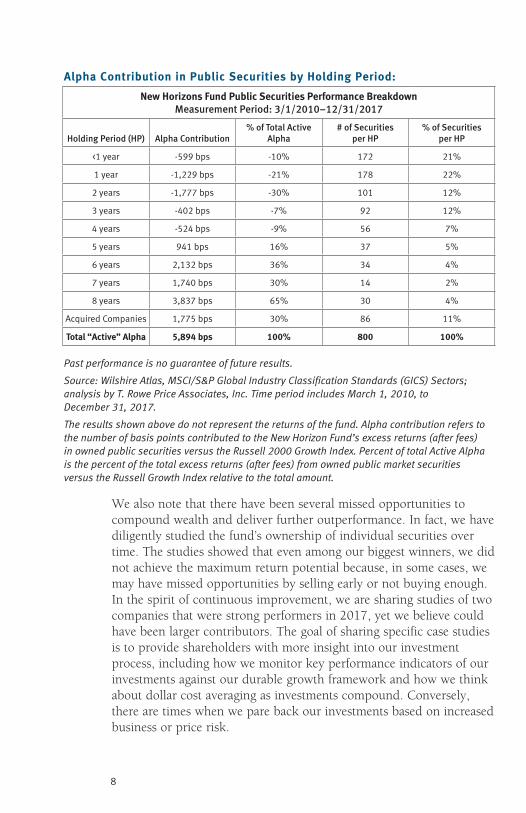
Next, we provide an analysis of the fund’s performance to quantify the importance of compounding returns since I began managing the fund. The chart delineates the performance of the individual public companies owned by the fund from March 1, 2010, to December 31, 2017, based on the length of our holding period for each investment. The maximum holding period is eight years, commensurate with my tenure as portfolio manager. Companies that were acquired are represented in the acquired company’s cohort as the holding periods were influenced by the sale rather than our decision to exit at that time.
We offer a few observations based on these data. First, we prune our holdings over time as we observe our companies develop and, as a result, we expect to own significantly fewer companies over the longer term. Second, as companies transition from early-stage growth to an Act II or prove themselves to be a durable growth company, we let compounding work in our favor by purchasing more stock at higher prices. Thus, we anticipate that our outperformance will be concentrated in holdings that we believe are worth owning for many years. Consistent with the academic literature cited above, we believe the best approach is to let compounding drive the best companies over time. For example, only 115 securities were held for a period of five years or more. This group of 115 securities contributed 147% of the fund’s excess return, after fees and versus its benchmark, generated in public securities over the period. We also note that there were 44 securities owned for seven years or more, and those contributed 95% of the fund’s excess return from public stock selection versus the benchmark.
Proof #4
8
alpha contribution in Public Securities by Holding Period:
New Horizons fund Public Securities Performance Breakdown Measurement Period: 3/1/2010–12/31/2017
Holding Period (HP) Alpha Contribution% of Total Active
Alpha# of Securities
per HP% of Securities
per HP
<1year -599bps -10% 172 21%
1year -1,229bps -21% 178 22%
2years -1,777bps -30% 101 12%
3years -402bps -7% 92 12%
4years -524bps -9% 56 7%
5years 941bps 16% 37 5%
6years 2,132bps 36% 34 4%
7years 1,740bps 30% 14 2%
8years 3,837bps 65% 30 4%
AcquiredCompanies 1,775bps 30% 86 11%
Total “active” alpha 5,894 bps 100% 800 100%
Past performance is no guarantee of future results.
Source: Wilshire Atlas, MSCI/S&P Global Industry Classification Standards (GICS) Sectors; analysis by T. Rowe Price Associates, Inc. Time period includes March 1, 2010, to December 31, 2017.
The results shown above do not represent the returns of the fund. Alpha contribution refers to the number of basis points contributed to the New Horizon Fund’s excess returns (after fees) in owned public securities versus the Russell 2000 Growth Index. Percent of total Active Alpha is the percent of the total excess returns (after fees) from owned public market securities versus the Russell Growth Index relative to the total amount.
We also note that there have been several missed opportunities to compound wealth and deliver further outperformance. In fact, we have diligently studied the fund’s ownership of individual securities over time. The studies showed that even among our biggest winners, we did not achieve the maximum return potential because, in some cases, we may have missed opportunities by selling early or not buying enough. In the spirit of continuous improvement, we are sharing studies of two companies that were strong performers in 2017, yet we believe could have been larger contributors. The goal of sharing specific case studies is to provide shareholders with more insight into our investment process, including how we monitor key performance indicators of our investments against our durable growth framework and how we think about dollar cost averaging as investments compound. Conversely, there are times when we pare back our investments based on increased business or price risk.
Proof #4
9
Vail Resorts was the top holding at the end of 2017 as well as a top contributor to the fund’s performance for the period ended December 31, 2017. We initiated our position in Vail Resorts between 2010 and 2012 believing that Vail offered a unique investment opportunity that could benefit from a cyclical recovery in skier visits. The company had introduced an attractive season pass program that was allowing it to gain local and regional market share. By 2014, the stock had nearly doubled, and we opted to sell about 10% of our position, following an unexpectedly strong earnings report and an announcement that Vail would acquire Park City Mountain Resort. It is easy to be critical of those stock sales with the benefit of hindsight. First, the 2014 fiscal year results showed that season pass sales had stabilized Vail’s financial performance despite a historically weak ski season in Tahoe, where Vail has two ski resorts. Second, the acquisition of Park City expanded Vail’s ski network, which made the season pass even more attractive to customers.
Over the following year, we did further due diligence. Our work showed that when Vail reported its results for 2015—the first year Park City was included in the network—season pass sales growth accelerated. Furthermore, the company gained more scale against its fixed costs to improve margins, increase the customer experience, and improve return on invested capital for shareholders. Following this bottom-up analysis, the fund increased its position in Vail by about 15% at an average cost of $125, or more than triple our historical average purchase price, and separately acquired about a 10% ownership stake in Whistler Blackcomb. We believed that Vail could pay a substantial premium to Whistler’s prevailing share price and still generate an attractive return for shareholders. Vail acquired Whistler Blackcomb in 2016 for cash and stock, which further increased our ownership stake in Vail by about 17%.
Fortunately, we didn’t miss the opportunity to create value through dollar cost averaging up with this stock. We learned two valuable lessons from the Vail acquisition. First, we need to anticipate events and potential outcomes. Second, we should recognize that changes and improvements can be nonlinear, especially when buying into a network. As to the first point, we weren’t well prepared to analyze the Park City acquisition but sharpened our focus in anticipation of Vail’s purchase of Whistler. Regarding the second point, we learned that when a company has taken steps to improve its network and monetize assets in new ways, its durability can improve.
Proof #4
10
The fund initially invested in GrubHub through a private placement in mid-2013 before its IPO in late 2014. GrubHub was a top 15 position at the end of 2017, and it was a top five contributor to the fund’s performance over the past year.
We invested in GrubHub because we expected the food delivery market was poised for strong growth over the next several years and was also essential for growth in the restaurant market. While restaurants were facing numerous headwinds—including flat or declining same-store sales growth in 2018 and rising labor costs—we believed that online food ordering and delivery would be an area of continued strong secular growth. What was occurring in the broader food delivery market was akin to what happened to the pizza industry in the 1980s. Over the next decade, pizza delivery increased tenfold.
Following the IPO, the fund materially increased its position in GrubHub. We expected that the company would perform well in a large market with strong secular tailwinds, that the service would become more attractive to customers after it added more restaurants, and that there would be significant margin improvement as the business grew over time. In 2015, GrubHub invested in its Act II as the company recognized the need to offer delivery services and more restaurant selection for its customers. Under its legacy business model, GrubHub had focused on connecting customers and restaurants but not the delivery element. GrubHub invested about $20 million in 2015 to build out local delivery networks in major cities. But the company’s ability to create such a network from scratch was far from certain given the number of well-funded companies already aggressively competing in this space. As a result, GrubHub’s stock price remained under pressure.
Our challenge was to balance our fundamental conviction that the food delivery space was poised for rapid growth with our assessment of GrubHub’s ability to successfully transition to its Act II. In early 2017, we gained conviction that GrubHub had navigated this transition. As a result, we materially increased our investment, and subsequently, GrubHub further added value by acquiring marketplace competitors that were unable to make the transition to delivery.
This example demonstrates the need for early-stage growth companies to continuously invest in the business. The market is typically skeptical of these investment periods in which there is greater uncertainty about the potential outcomes. While we remain positive about our GrubHub investment thesis, we must continue to track our assumptions and be able to dispassionately process new information when making the next investment decision.
Proof #4
11
PORTfOLIO REvIEW
Our top contributor in 2017 was CBOE Global Markets, which operates the largest U.S. options exchange. CBOE’s acquisition of BATS Global Markets brought CBOE’s culture of innovation and proprietary products, including volatility and S&P 500 contracts, under the same roof with BATS’ strong technology culture. After thorough due diligence following the acquisition, we came to believe the combination of CBOE and BATS was a unique acquisition that increased value above the combination of two platforms. Our experience is that the best deals happen when the acquisition renders the whole company more valuable. We felt the BATS product and technology skills would improve the combined company. In late 2017, the market recognized this powerful combination and rewarded the stock throughout the year.
Burlington Stores was a meaningful contributor to the fund’s performance. The off-price retailer is in the early innings of refining its business model by improving its systems and store base. We believe Burlington is on the right side of a powerful secular trend as traffic and available inventory flows migrate from department stores and traditional retailers to the off-price channel. There are clear threats from Amazon and other e-commerce retailers, but the Burlington business model should prove to be relatively insulated given lower order costs, fast inventory turnover, and average selling prices that are lower than those of similar products at Amazon. We believe Burlington can sustain its current pace of new-store growth. Burlington is also positioned to benefit from the continued wave of bankruptcies and store closures across the brick-and-mortar retail space, which will allow Burlington to negotiate lower rents and improved terms.
O’Reilly Automotive was a detractor from performance as the auto parts retailer endured a challenging year. The first three quarters of 2017 were mixed due to execution issues, a broad industry slowdown, and concerns over irrational competition and heightened terminal value risk regarding the secular shift online. The disruption created by online retailers became more apparent across the industry as comparable same-store sales growth decelerated. Despite this secular backdrop, we remain positive on the company’s superior service culture, the inventory required to meet customer demands, the need for immediate delivery in the commercial business-to-business market, and the positive financial characteristics of the business. We continue to monitor our thesis for this company, and for all of our holdings, as new information becomes available.
Proof #4
12
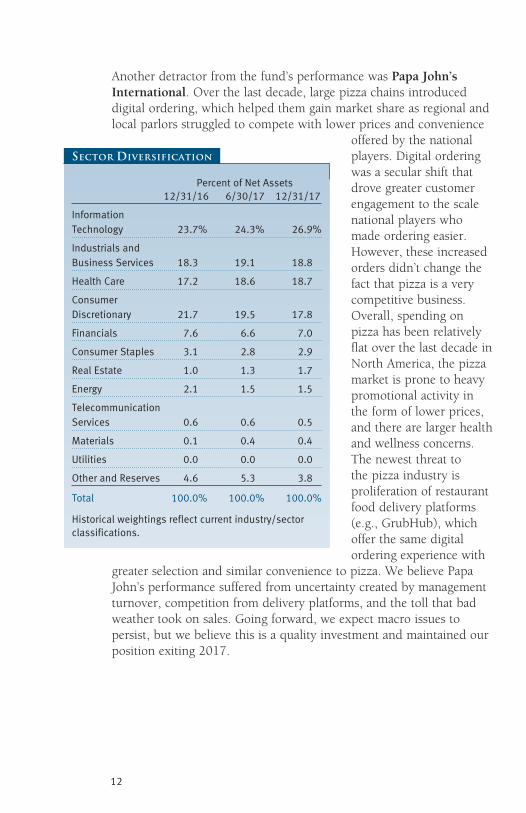
Another detractor from the fund’s performance was Papa John’s International. Over the last decade, large pizza chains introduced digital ordering, which helped them gain market share as regional and local parlors struggled to compete with lower prices and convenience
offered by the national players. Digital ordering was a secular shift that drove greater customer engagement to the scale national players who made ordering easier. However, these increased orders didn’t change the fact that pizza is a very competitive business. Overall, spending on pizza has been relatively flat over the last decade in North America, the pizza market is prone to heavy promotional activity in the form of lower prices, and there are larger health and wellness concerns. The newest threat to the pizza industry is proliferation of restaurant food delivery platforms (e.g., GrubHub), which offer the same digital ordering experience with
greater selection and similar convenience to pizza. We believe Papa John’s performance suffered from uncertainty created by management turnover, competition from delivery platforms, and the toll that bad weather took on sales. Going forward, we expect macro issues to persist, but we believe this is a quality investment and maintained our position exiting 2017.
PercentofNetAssets 12/31/16 6/30/17 12/31/17
InformationTechnology 23.7% 24.3% 26.9%
IndustrialsandBusinessServices 18.3 19.1 18.8
HealthCare 17.2 18.6 18.7
ConsumerDiscretionary 21.7 19.5 17.8
Financials 7.6 6.6 7.0
ConsumerStaples 3.1 2.8 2.9
RealEstate 1.0 1.3 1.7
Energy 2.1 1.5 1.5
TelecommunicationServices 0.6 0.6 0.5
Materials 0.1 0.4 0.4
Utilities 0.0 0.0 0.0
OtherandReserves 4.6 5.3 3.8
Total 100.0% 100.0% 100.0%
Historicalweightingsreflectcurrentindustry/sectorclassifications.
Sector Diversification
Proof #4
13
OuTLOOk
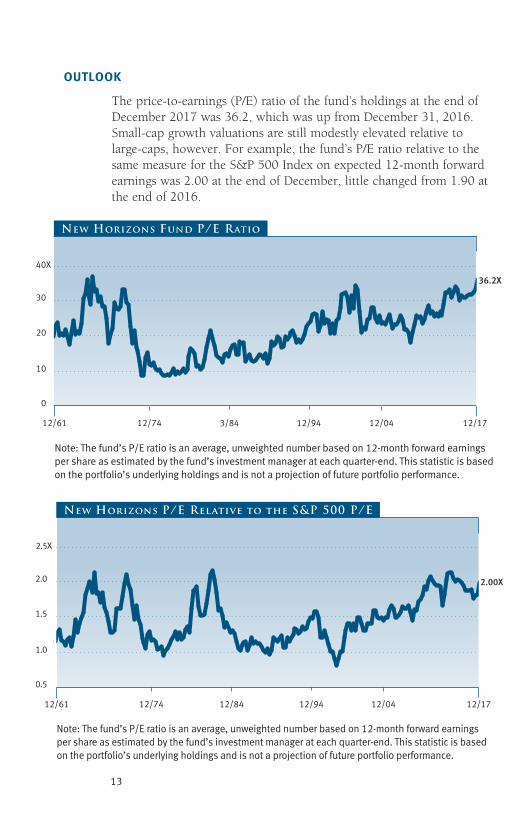
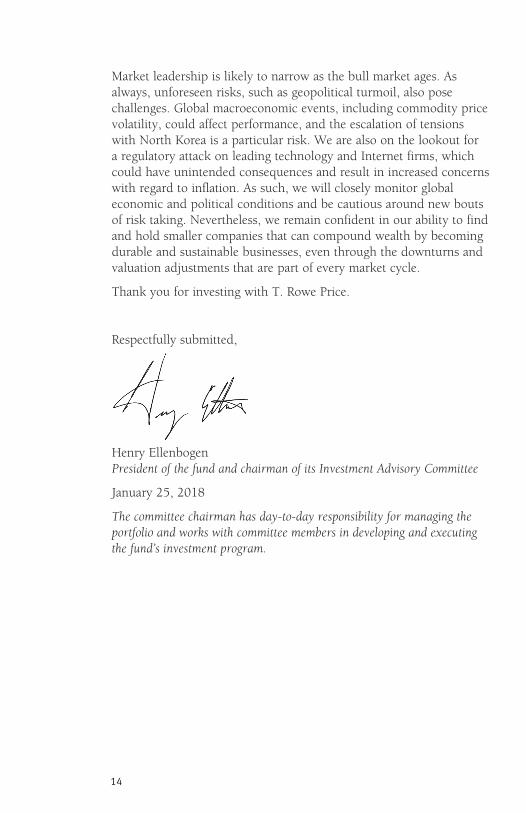
The price-to-earnings (P/E) ratio of the fund’s holdings at the end of December 2017 was 36.2, which was up from December 31, 2016. Small-cap growth valuations are still modestly elevated relative to large-caps, however. For example, the fund’s P/E ratio relative to the same measure for the S&P 500 Index on expected 12-month forward earnings was 2.00 at the end of December, little changed from 1.90 at the end of 2016.
12/61 12/1712/74 3/84 12/94 12/04
20
10
0
30
40X
New Horizons Fund P/E Ratio
Note: The fund’s P/E ratio is an average, unweighted number based on 12-month forward earnings per share as estimated by the fund’s investment manager at each quarter-end. This statistic is based on the portfolio’s underlying holdings and is not a projection of future portfolio performance.
36.2X
12/61 12/1712/74 12/84 12/94 12/04
1.5
1.0
0.5
2.0
2.5X
New Horizons P/E Relative to the S&P 500 P/E
Note: The fund’s P/E ratio is an average, unweighted number based on 12-month forward earnings per share as estimated by the fund’s investment manager at each quarter-end. This statistic is based on the portfolio’s underlying holdings and is not a projection of future portfolio performance.
2.00X
Proof #4
14
Market leadership is likely to narrow as the bull market ages. As always, unforeseen risks, such as geopolitical turmoil, also pose challenges. Global macroeconomic events, including commodity price volatility, could affect performance, and the escalation of tensions with North Korea is a particular risk. We are also on the lookout for a regulatory attack on leading technology and Internet firms, which could have unintended consequences and result in increased concerns with regard to inflation. As such, we will closely monitor global economic and political conditions and be cautious around new bouts of risk taking. Nevertheless, we remain confident in our ability to find and hold smaller companies that can compound wealth by becoming durable and sustainable businesses, even through the downturns and valuation adjustments that are part of every market cycle.
Thank you for investing with T. Rowe Price.
Respectfully submitted,
Henry EllenbogenPresident of the fund and chairman of its Investment Advisory Committee
January 25, 2018
The committee chairman has day-to-day responsibility for managing the portfolio and works with committee members in developing and executing the fund’s investment program.
Proof #4
15
T. Rowe Price New Horizons Fund
Risks of Investing
Aswithallstockandbondmutualfunds,eachfund’ssharepricecanfallbecauseofweaknessinthestockorbondmarkets,aparticularindustry,orspecificholdings.Stockmarketscandeclineformanyreasons,includingadversepoliticaloreconomicdevelopments,changesininvestorpsychology,orheavyinstitutionalselling.Theprospectsforanindustryorcompanymaydeterioratebecauseofavarietyoffactors,includingdisappointingearningsorchangesinthecompetitiveenvironment.Inaddition,theinvestmentmanager’sassessmentofcompaniesheldinafundmayproveincorrect,resultinginlossesorpoorperformanceeveninrisingmarkets.
Investinginsmallcompaniesinvolvesgreaterriskthaniscustomarilyassociatedwithlargercompanies.Stocksofsmallcompaniesaresubjecttomoreabruptorerraticpricemovementsthanlarger-companystocks.Smallcompaniesoftenhavelimitedproductlines,markets,orfinancialresources,andtheirmanagementsmaylackdepthandexperience.Suchcompaniesseldompaysignificantdividendsthatcouldcushionreturnsinafallingmarket.
Glossary
alpha:Excessreturnabovethatofthebenchmark.
Dollar cost averaging:Aninvestmenttechniqueofbuyingafixeddollaramountofaparticularinvestmentonaregularschedule,regardlessoftheshareprice.
Initial public offering:Thefirstsaleofstocktothepublicbyaformerlyprivatecompany.
Lipper indexes:Fundbenchmarksthatconsistofasmallnumber(10to30)ofthelargestmutualfundsinaparticularcategoryastrackedbyLipperInc.
Price/book ratio:Avaluationmeasurethatcomparesastock’smarketpricewithitsbookvalue;i.e.,thecompany’snetworthdividedbythenumberofoutstandingshares.
Price/earnings (P/E) ratio:Avaluationmeasurecalculatedbydividingthepriceofastockbyitscurrentorprojectedearningspershare.Theratioisameasureofhowmuchinvestorsarewillingtopayforthecompany’searnings.
Russell 2000 Growth Index:Anindexthattrackstheperformanceofsmall-capstockswithhigherprice-to-bookratiosandhigherforecastgrowthvalues.
Russell 2000 Index:Anunmanagedindexthattracksthestocksof2,000smallU.S.companies.
Proof #4
16
T. Rowe Price New Horizons Fund
Glossary (continued)
Russell 2000 value Index:Anindexthattrackstheperformanceofsmall-capstockswithlowerprice-to-bookratiosandlowerforecastgrowthvalues.
S&P 500 Index:Anunmanagedindexthattracksthestocksof500primarilylarge-capU.S.companies.
S&P midcap 400 Index:Anunmanagedindexthattrackstheperformanceof400U.S.mid-capcompanies.
Note:RussellInvestmentGroupisthesourceandownerofthetrademarks,servicemarks,andcopyrightsrelatedtotheRussellindexes.Russell®isatrademarkofRussellInvestmentGroup.
Proof #4
17
T. Rowe Price New Horizons Fund
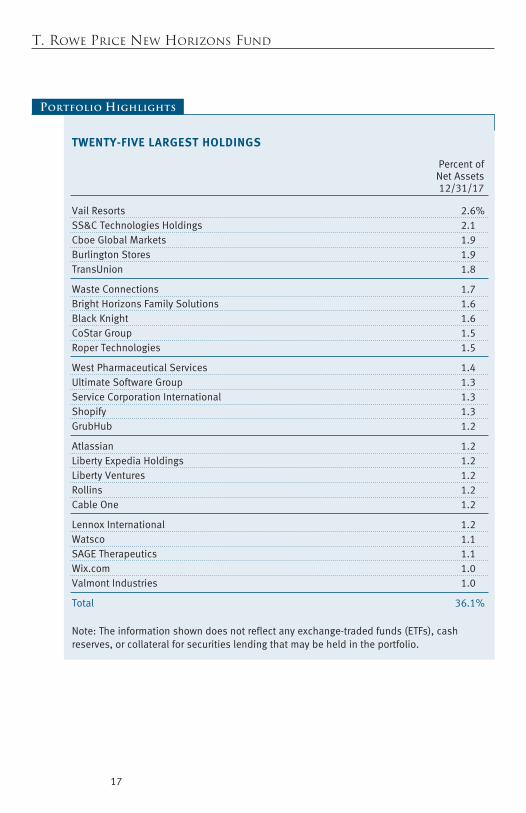
TWENTy-fIvE LaRGEST HOLDINGS
Percentof NetAssets 12/31/17
VailResorts 2.6%SS&CTechnologiesHoldings 2.1CboeGlobalMarkets 1.9BurlingtonStores 1.9TransUnion 1.8
WasteConnections 1.7BrightHorizonsFamilySolutions 1.6BlackKnight 1.6CoStarGroup 1.5RoperTechnologies 1.5
WestPharmaceuticalServices 1.4UltimateSoftwareGroup 1.3ServiceCorporationInternational 1.3Shopify 1.3GrubHub 1.2
Atlassian 1.2LibertyExpediaHoldings 1.2LibertyVentures 1.2Rollins 1.2CableOne 1.2
LennoxInternational 1.2Watsco 1.1SAGETherapeutics 1.1Wix.com 1.0ValmontIndustries 1.0
Total 36.1%
Note:Theinformationshowndoesnotreflectanyexchange-tradedfunds(ETFs),cashreserves,orcollateralforsecuritieslendingthatmaybeheldintheportfolio.
Portfolio Highlights
Proof #4
18
T. Rowe Price New Horizons Fund
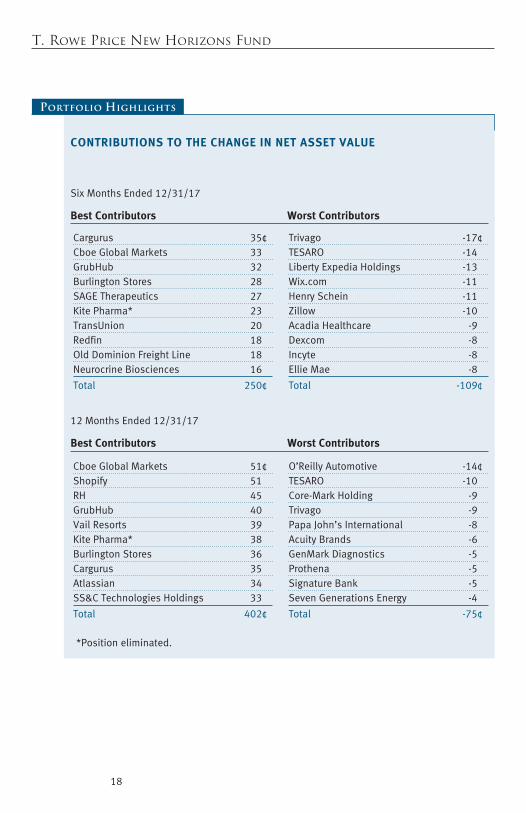
cONTRIBuTIONS TO THE cHaNGE IN NET aSSET vaLuE
SixMonthsEnded12/31/17
Best contributors Worst contributors
Cargurus 35¢CboeGlobalMarkets 33GrubHub 32BurlingtonStores 28SAGETherapeutics 27KitePharma* 23TransUnion 20Redfin 18OldDominionFreightLine 18NeurocrineBiosciences 16
Total 250¢
Trivago -17¢TESARO -14LibertyExpediaHoldings -13Wix.com -11HenrySchein -11Zillow -10AcadiaHealthcare -9Dexcom -8Incyte -8EllieMae -8
Total -109¢
12MonthsEnded12/31/17
Best contributors Worst contributors
CboeGlobalMarkets 51¢Shopify 51RH 45GrubHub 40VailResorts 39KitePharma* 38BurlingtonStores 36Cargurus 35Atlassian 34SS&CTechnologiesHoldings 33
Total 402¢
O’ReillyAutomotive -14¢TESARO -10Core-MarkHolding -9Trivago -9PapaJohn’sInternational -8AcuityBrands -6GenMarkDiagnostics -5Prothena -5SignatureBank -5SevenGenerationsEnergy -4
Total -75¢
*Positioneliminated.
Portfolio Highlights
Proof #4
19
T. Rowe Price New Horizons Fund
Performance and Expenses
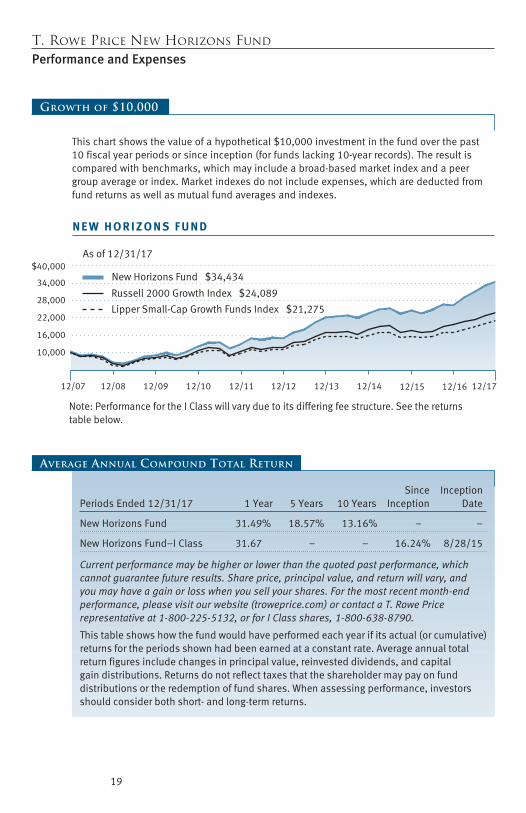
Russell 2000 Growth Index $24,089
New Horizons Fund $34,434
As of 12/31/17
12/07 12/1312/1212/1112/1012/0912/08 12/1712/14
N E W H O R I Z O N S F U N D
Lipper Small-Cap Growth Funds Index $21,275
10,000
16,000
22,000
28,000
34,000
$40,000
12/15 12/16
Note: Performance for the I Class will vary due to its differing fee structure. See the returnstable below.
Growth of $10,000
Thischartshowsthevalueofahypothetical$10,000investmentinthefundoverthepast10fiscalyearperiodsorsinceinception(forfundslacking10-yearrecords).Theresultiscomparedwithbenchmarks,whichmayincludeabroad-basedmarketindexandapeergroupaverageorindex.Marketindexesdonotincludeexpenses,whicharedeductedfromfundreturnsaswellasmutualfundaveragesandindexes.
Since InceptionPeriodsEnded12/31/17 1Year 5Years 10Years Inception Date
NewHorizonsFund 31.49% 18.57% 13.16% – –
NewHorizonsFund–IClass 31.67 – – 16.24% 8/28/15
Current performance may be higher or lower than the quoted past performance, which cannot guarantee future results. Share price, principal value, and return will vary, and you may have a gain or loss when you sell your shares. For the most recent month-end performance, please visit our website (troweprice.com) or contact a T. Rowe Price representative at 1-800-225-5132, or for I Class shares, 1-800-638-8790.
Thistableshowshowthefundwouldhaveperformedeachyearifitsactual(orcumulative)returnsfortheperiodsshownhadbeenearnedataconstantrate.Averageannualtotalreturnfiguresincludechangesinprincipalvalue,reinvesteddividends,andcapitalgaindistributions.Returnsdonotreflecttaxesthattheshareholdermaypayonfunddistributionsortheredemptionoffundshares.Whenassessingperformance,investorsshouldconsiderbothshort-andlong-termreturns.
Average Annual Compound Total Return
Proof #4
20
T. Rowe Price New Horizons Fund
Fund Expense Example
Asamutualfundshareholder,youmayincurtwotypesofcosts:(1)transactioncosts,suchasredemptionfeesorsalesloads,and(2)ongoingcosts,includingmanagementfees,distributionandservice(12b-1)fees,andotherfundexpenses.Thefollowingexampleisintendedtohelpyouunderstandyourongoingcosts(indollars)ofinvestinginthefundandtocomparethesecostswiththeongoingcostsofinvestinginothermutualfunds.Theexampleisbasedonaninvestmentof$1,000investedatthebeginningofthemostrecentsix-monthperiodandheldfortheentireperiod.
Pleasenotethatthefundhastwoshareclasses:Theoriginalshareclass(InvestorClass)chargesnodistributionandservice(12b-1)fee,andtheIClasssharesarealsoavailabletoinstitutionallyorientedclientsandimposeno12b-1oradministrativefeepayment.Eachshareclassispresentedseparatelyinthetable.
actual ExpensesThefirstlineofthefollowingtable(Actual)providesinformationaboutactualaccountvaluesandexpensesbasedonthefund’sactualreturns.Youmayusetheinformationonthisline,togetherwithyouraccountbalance,toestimatetheexpensesthatyoupaidovertheperiod.Simplydivideyouraccountvalueby$1,000(forexample,an$8,600accountvaluedividedby$1,000=8.6),thenmultiplytheresultbythenumberonthefirstlineundertheheading“ExpensesPaidDuringPeriod”toestimatetheexpensesyoupaidonyouraccountduringthisperiod.
Hypothetical Example for comparison PurposesTheinformationonthesecondlineofthetable(Hypothetical)isbasedonhypotheticalaccountvaluesandexpensesderivedfromthefund’sactualexpenseratioandanassumed5%peryearrateofreturnbeforeexpenses(notthefund’sactualreturn).Youmaycomparetheongoingcostsofinvestinginthefundwithotherfundsbycontrastingthis5%hypotheticalexampleandthe5%hypotheticalexamplesthatappearintheshareholderreportsoftheotherfunds.Thehypotheticalaccountvaluesandexpensesmaynotbeusedtoestimatetheactualendingaccountbalanceorexpensesyoupaidfortheperiod.
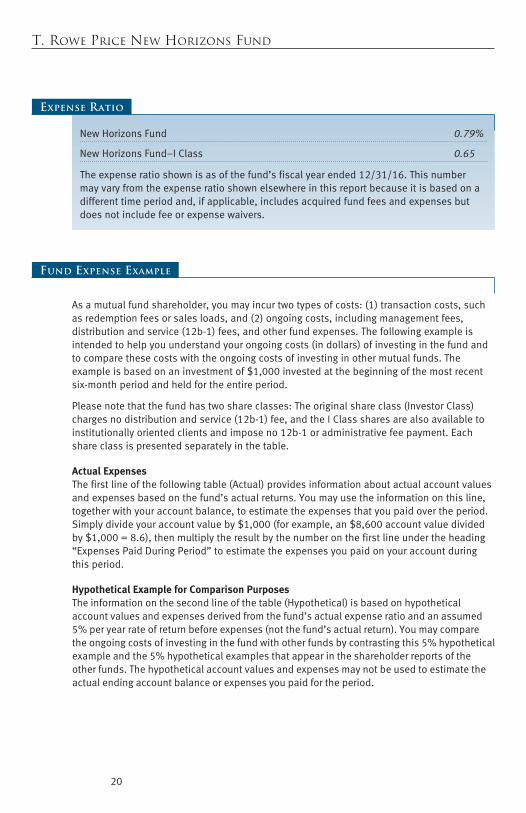
NewHorizonsFund 0.79%
NewHorizonsFund–IClass 0.65
Theexpenseratioshownisasofthefund’sfiscalyearended12/31/16.Thisnumbermayvaryfromtheexpenseratioshownelsewhereinthisreportbecauseitisbasedonadifferenttimeperiodand,ifapplicable,includesacquiredfundfeesandexpensesbutdoesnotincludefeeorexpensewaivers.
Expense Ratio
Proof #4
21
T. Rowe Price New Horizons Fund
Fund Expense Example (continued)
Note:T.RowePricechargesanannualaccountservicefeeof$20,generallyforaccountswithlessthan$10,000.ThefeeiswaivedforanyinvestorwhoseT.RowePricemutualfundaccountstotal$50,000ormore;accountselectingtoreceiveelectronicdeliveryofaccountstatements,transactionconfirmations,prospectuses,andshareholderreports;oraccountsofaninvestorwhoisaT.RowePricePersonalServicesorEnhancedPersonalServicesclient(enrollmentintheseprogramsgenerallyrequiresT.RowePriceassetsofatleast$250,000).Thisfeeisnotincludedintheaccompanyingtable.Ifyouaresubjecttothefee,keepitinmindwhenyouareestimatingtheongoingexpensesofinvestinginthefundandwhencomparingtheexpensesofthisfundwithotherfunds.
Youshouldalsobeawarethattheexpensesshowninthetablehighlightonlyyourongoingcostsanddonotreflectanytransactioncosts,suchasredemptionfeesorsalesloads.Therefore,thesecondlineofthetableisusefulincomparingongoingcostsonlyandwillnothelpyoudeterminetherelativetotalcostsofowningdifferentfunds.Totheextentafundchargestransactioncosts,however,thetotalcostofowningthatfundishigher.
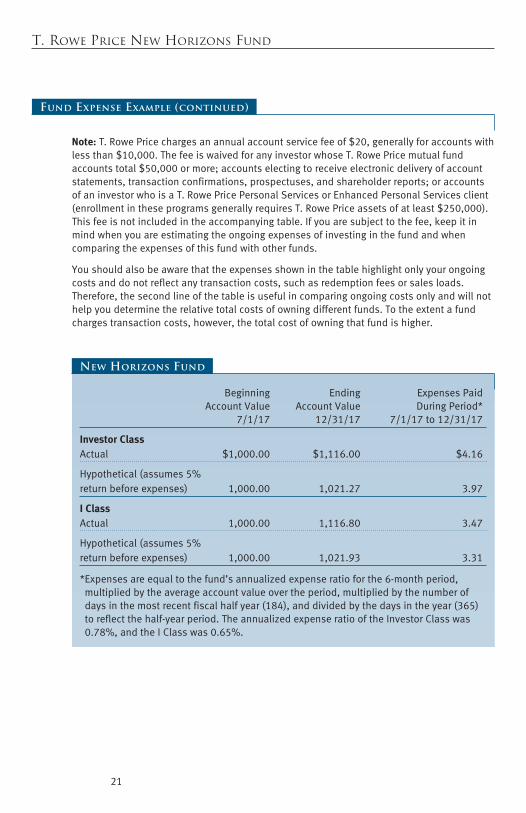
Beginning Ending ExpensesPaid AccountValue AccountValue DuringPeriod* 7/1/17 12/31/17 7/1/17to12/31/17
Investor classActual $1,000.00 $1,116.00 $4.16
Hypothetical(assumes5%returnbeforeexpenses) 1,000.00 1,021.27 3.97
I classActual 1,000.00 1,116.80 3.47
Hypothetical(assumes5%returnbeforeexpenses) 1,000.00 1,021.93 3.31
*Expensesareequaltothefund’sannualizedexpenseratioforthe6-monthperiod,multipliedbytheaverageaccountvalueovertheperiod,multipliedbythenumberofdaysinthemostrecentfiscalhalfyear(184),anddividedbythedaysintheyear(365)toreflectthehalf-yearperiod.TheannualizedexpenseratiooftheInvestorClasswas0.78%,andtheIClasswas0.65%.
New Horizons Fund
Proof #4
22
T. Rowe Price New Horizons Fund
Financial Highlights For a share outstanding throughout each period
The accompanying notes are an integral part of these financial statements.
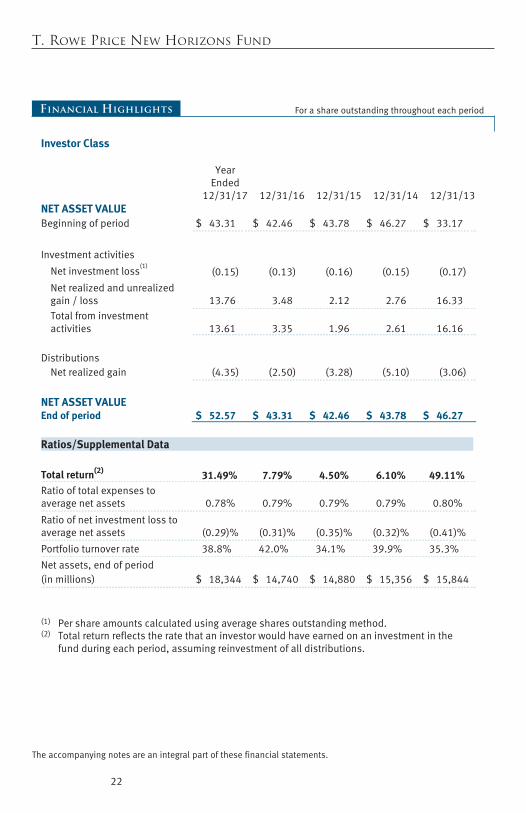
Investor Class
Year Ended
12/31/17
12/31/16
12/31/15
12/31/14
12/31/13
NET ASSET VALUE
Beginning of period
$ 43.31
$ 42.46
$ 43.78
$ 46.27
$ 33.17
Investment activities
Net investment loss(1)
(0.15)
(0.13)
(0.16)
(0.15)
(0.17)
Net realized and unrealized gain / loss
13.76
3.48
2.12
2.76
16.33
Total from investment activities
13.61
3.35
1.96
2.61
16.16
Distributions
Net realized gain
(4.35)
(2.50)
(3.28)
(5.10)
(3.06)
NET ASSET VALUE
End of period $ 52.57 $ 43.31 $ 42.46 $ 43.78 $ 46.27
Ratios/Supplemental Data Total return(2) 31.49% 7.79% 4.50% 6.10% 49.11%
Ratio of total expenses to average net assets
0.78%
0.79%
0.79%
0.79%
0.80%
Ratio of net investment loss to average net assets
(0.29)%
(0.31)%
(0.35)%
(0.32)%
(0.41)%
Portfolio turnover rate
38.8%
42.0%
34.1%
39.9%
35.3%
Net assets, end of period
(in millions)
$ 18,344
$ 14,740
$ 14,880
$ 15,356
$ 15,844
(1) Per share amounts calculated using average shares outstanding method. (2) Total return reflects the rate that an investor would have earned on an investment in the
fund during each period, assuming reinvestment of all distributions.
Proof #4
23
T. Rowe Price New Horizons Fund
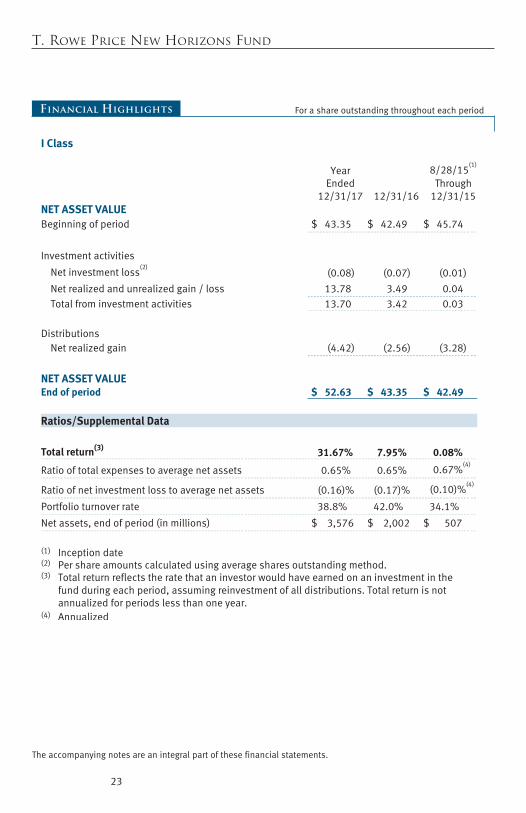
Financial Highlights For a share outstanding throughout each period
The accompanying notes are an integral part of these financial statements.
I Class
Year Ended
12/31/17
12/31/16
8/28/15(1)
Through 12/31/15
NET ASSET VALUE
Beginning of period
$ 43.35
$ 42.49
$ 45.74
Investment activities
Net investment loss(2)
(0.08)
(0.07)
(0.01)
Net realized and unrealized gain / loss
13.78
3.49
0.04
Total from investment activities
13.70
3.42
0.03
Distributions
Net realized gain
(4.42)
(2.56)
(3.28)
NET ASSET VALUE
End of period $ 52.63 $ 43.35 $ 42.49
Ratios/Supplemental Data Total return(3) 31.67% 7.95% 0.08%
Ratio of total expenses to average net assets
0.65%
0.65%
0.67%(4)
Ratio of net investment loss to average net assets
(0.16)%
(0.17)%
(0.10)%(4)
Portfolio turnover rate
38.8%
42.0%
34.1%
Net assets, end of period (in millions)
$ 3,576
$ 2,002
$ 507
(1) Inception date (2) Per share amounts calculated using average shares outstanding method. (3) Total return reflects the rate that an investor would have earned on an investment in the
fund during each period, assuming reinvestment of all distributions. Total return is not annualized for periods less than one year.
(4) Annualized
Proof #4
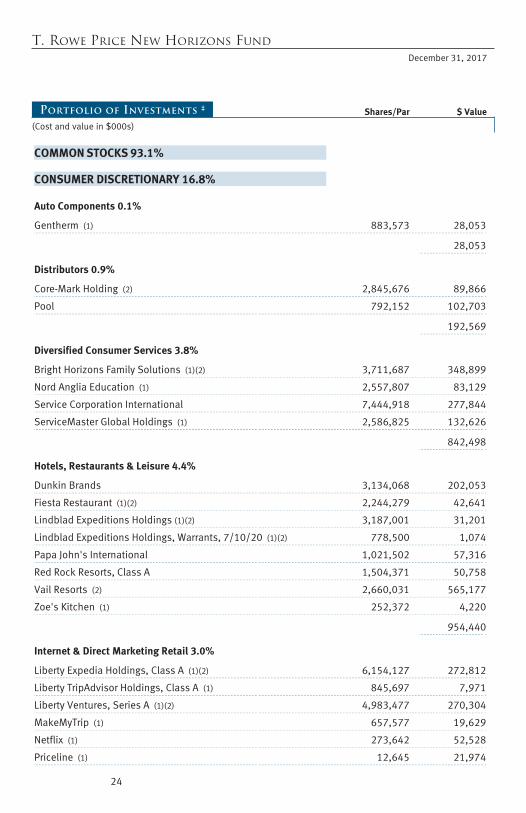
T. Rowe Price New Horizons Fund December 31, 2017
Portfolio of Investments ‡ Shares/Par $ Value
(Cost and value in $000s)
24
First Page Footer
COMMON STOCKS 93.1%
CONSUMER DISCRETIONARY 16.8%
Auto Components 0.1%
Gentherm (1) 883,573 28,053
28,053
Distributors 0.9%
Core-Mark Holding (2) 2,845,676 89,866
Pool 792,152 102,703
192,569
Diversified Consumer Services 3.8%
Bright Horizons Family Solutions (1)(2) 3,711,687 348,899
Nord Anglia Education (1) 2,557,807 83,129
Service Corporation International 7,444,918 277,844
ServiceMaster Global Holdings (1) 2,586,825 132,626
842,498
Hotels, Restaurants & Leisure 4.4%
Dunkin Brands 3,134,068 202,053
Fiesta Restaurant (1)(2) 2,244,279 42,641
Lindblad Expeditions Holdings (1)(2) 3,187,001 31,201
Lindblad Expeditions Holdings, Warrants, 7/10/20 (1)(2) 778,500 1,074
Papa John's International 1,021,502 57,316
Red Rock Resorts, Class A 1,504,371 50,758
Vail Resorts (2) 2,660,031 565,177
Zoe's Kitchen (1) 252,372 4,220
954,440
Internet & Direct Marketing Retail 3.0%
Liberty Expedia Holdings, Class A (1)(2) 6,154,127 272,812
Liberty TripAdvisor Holdings, Class A (1) 845,697 7,971
Liberty Ventures, Series A (1)(2) 4,983,477 270,304
MakeMyTrip (1) 657,577 19,629
Netflix (1) 273,642 52,528
Priceline (1) 12,645 21,974
Proof #4
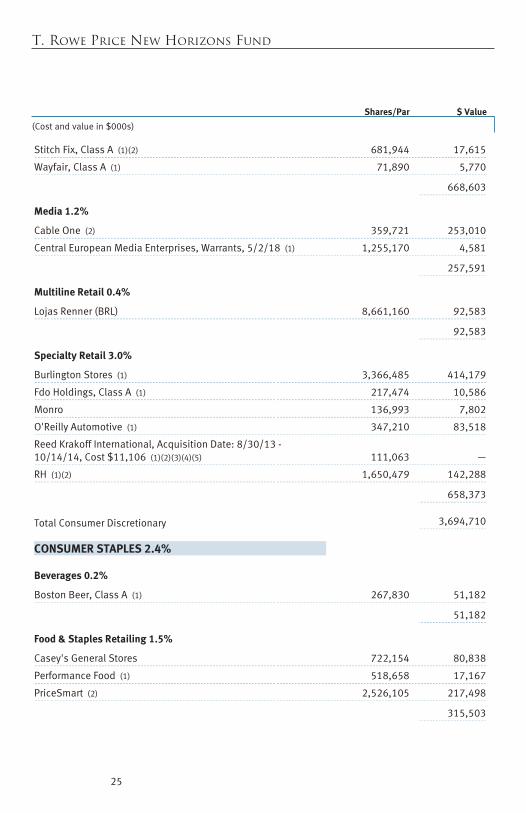
T. Rowe Price New Horizons Fund
Shares/Par $ Value
(Cost and value in $000s)
25
Stitch Fix, Class A (1)(2) 681,944 17,615
Wayfair, Class A (1) 71,890 5,770
668,603
Media 1.2%
Cable One (2) 359,721 253,010
Central European Media Enterprises, Warrants, 5/2/18 (1) 1,255,170 4,581
257,591
Multiline Retail 0.4%
Lojas Renner (BRL) 8,661,160 92,583
92,583
Specialty Retail 3.0%
Burlington Stores (1) 3,366,485 414,179
Fdo Holdings, Class A (1) 217,474 10,586
Monro 136,993 7,802
O'Reilly Automotive (1) 347,210 83,518
Reed Krakoff International, Acquisition Date: 8/30/13 - 10/14/14, Cost $11,106 (1)(2)(3)(4)(5) 111,063 —
RH (1)(2) 1,650,479 142,288
658,373
Total Consumer Discretionary 3,694,710
CONSUMER STAPLES 2.4%
Beverages 0.2%
Boston Beer, Class A (1) 267,830 51,182
51,182
Food & Staples Retailing 1.5%
Casey's General Stores 722,154 80,838
Performance Food (1) 518,658 17,167
PriceSmart (2) 2,526,105 217,498
315,503
Proof #4
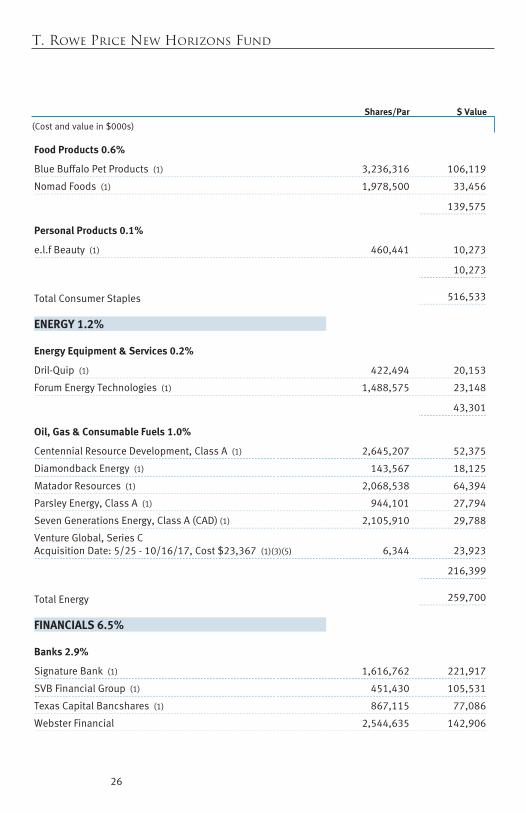
T. Rowe Price New Horizons Fund
Shares/Par $ Value
(Cost and value in $000s)
26
Food Products 0.6%
Blue Buffalo Pet Products (1) 3,236,316 106,119
Nomad Foods (1) 1,978,500 33,456
139,575
Personal Products 0.1%
e.l.f Beauty (1) 460,441 10,273
10,273
Total Consumer Staples 516,533
ENERGY 1.2%
Energy Equipment & Services 0.2%
Dril-Quip (1) 422,494 20,153
Forum Energy Technologies (1) 1,488,575 23,148
43,301
Oil, Gas & Consumable Fuels 1.0%
Centennial Resource Development, Class A (1) 2,645,207 52,375
Diamondback Energy (1) 143,567 18,125
Matador Resources (1) 2,068,538 64,394
Parsley Energy, Class A (1) 944,101 27,794
Seven Generations Energy, Class A (CAD) (1) 2,105,910 29,788
Venture Global, Series C Acquisition Date: 5/25 - 10/16/17, Cost $23,367 (1)(3)(5) 6,344 23,923
216,399
Total Energy 259,700
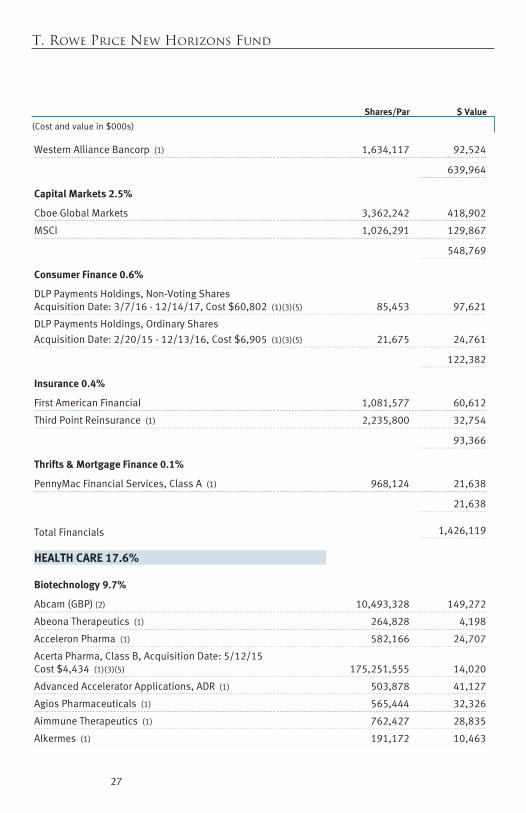
FINANCIALS 6.5%
Banks 2.9%
Signature Bank (1) 1,616,762 221,917
SVB Financial Group (1) 451,430 105,531
Texas Capital Bancshares (1) 867,115 77,086
Webster Financial 2,544,635 142,906
Proof #4
T. Rowe Price New Horizons Fund
Shares/Par $ Value
(Cost and value in $000s)
27
Western Alliance Bancorp (1) 1,634,117 92,524
639,964
Capital Markets 2.5%
Cboe Global Markets 3,362,242 418,902
MSCI 1,026,291 129,867
548,769
Consumer Finance 0.6%
DLP Payments Holdings, Non-Voting Shares Acquisition Date: 3/7/16 - 12/14/17, Cost $60,802 (1)(3)(5) 85,453 97,621
DLP Payments Holdings, Ordinary Shares Acquisition Date: 2/20/15 - 12/13/16, Cost $6,905 (1)(3)(5) 21,675 24,761
122,382
Insurance 0.4%
First American Financial 1,081,577 60,612
Third Point Reinsurance (1) 2,235,800 32,754
93,366
Thrifts & Mortgage Finance 0.1%
PennyMac Financial Services, Class A (1) 968,124 21,638
21,638
Total Financials 1,426,119
HEALTH CARE 17.6%
Biotechnology 9.7%
Abcam (GBP) (2) 10,493,328 149,272
Abeona Therapeutics (1) 264,828 4,198
Acceleron Pharma (1) 582,166 24,707
Acerta Pharma, Class B, Acquisition Date: 5/12/15 Cost $4,434 (1)(3)(5) 175,251,555 14,020
Advanced Accelerator Applications, ADR (1) 503,878 41,127
Agios Pharmaceuticals (1) 565,444 32,326
Aimmune Therapeutics (1) 762,427 28,835
Alkermes (1) 191,172 10,463
Proof #4
T. Rowe Price New Horizons Fund
Shares/Par $ Value
(Cost and value in $000s)
28
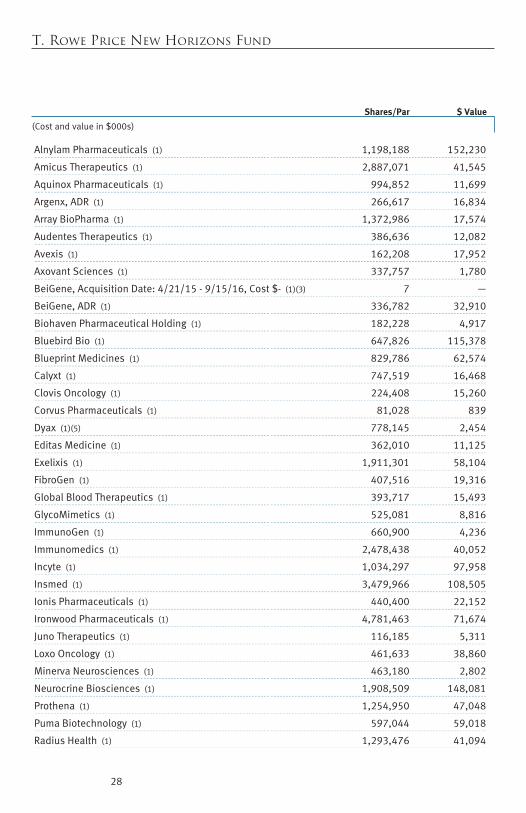
Alnylam Pharmaceuticals (1) 1,198,188 152,230
Amicus Therapeutics (1) 2,887,071 41,545
Aquinox Pharmaceuticals (1) 994,852 11,699
Argenx, ADR (1) 266,617 16,834
Array BioPharma (1) 1,372,986 17,574
Audentes Therapeutics (1) 386,636 12,082
Avexis (1) 162,208 17,952
Axovant Sciences (1) 337,757 1,780
BeiGene, Acquisition Date: 4/21/15 - 9/15/16, Cost $- (1)(3) 7 —
BeiGene, ADR (1) 336,782 32,910
Biohaven Pharmaceutical Holding (1) 182,228 4,917
Bluebird Bio (1) 647,826 115,378
Blueprint Medicines (1) 829,786 62,574
Calyxt (1) 747,519 16,468
Clovis Oncology (1) 224,408 15,260
Corvus Pharmaceuticals (1) 81,028 839
Dyax (1)(5) 778,145 2,454
Editas Medicine (1) 362,010 11,125
Exelixis (1) 1,911,301 58,104
FibroGen (1) 407,516 19,316
Global Blood Therapeutics (1) 393,717 15,493
GlycoMimetics (1) 525,081 8,816
ImmunoGen (1) 660,900 4,236
Immunomedics (1) 2,478,438 40,052
Incyte (1) 1,034,297 97,958
Insmed (1) 3,479,966 108,505
Ionis Pharmaceuticals (1) 440,400 22,152
Ironwood Pharmaceuticals (1) 4,781,463 71,674
Juno Therapeutics (1) 116,185 5,311
Loxo Oncology (1) 461,633 38,860
Minerva Neurosciences (1) 463,180 2,802
Neurocrine Biosciences (1) 1,908,509 148,081
Prothena (1) 1,254,950 47,048
Puma Biotechnology (1) 597,044 59,018
Radius Health (1) 1,293,476 41,094
Proof #4
T. Rowe Price New Horizons Fund
Shares/Par $ Value
(Cost and value in $000s)
29
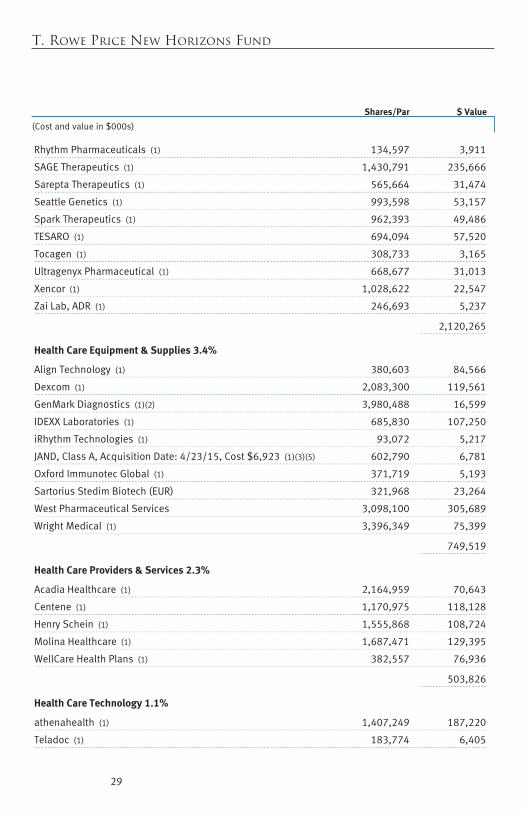
Rhythm Pharmaceuticals (1) 134,597 3,911
SAGE Therapeutics (1) 1,430,791 235,666
Sarepta Therapeutics (1) 565,664 31,474
Seattle Genetics (1) 993,598 53,157
Spark Therapeutics (1) 962,393 49,486
TESARO (1) 694,094 57,520
Tocagen (1) 308,733 3,165
Ultragenyx Pharmaceutical (1) 668,677 31,013
Xencor (1) 1,028,622 22,547
Zai Lab, ADR (1) 246,693 5,237
2,120,265
Health Care Equipment & Supplies 3.4%
Align Technology (1) 380,603 84,566
Dexcom (1) 2,083,300 119,561
GenMark Diagnostics (1)(2) 3,980,488 16,599
IDEXX Laboratories (1) 685,830 107,250
iRhythm Technologies (1) 93,072 5,217
JAND, Class A, Acquisition Date: 4/23/15, Cost $6,923 (1)(3)(5) 602,790 6,781
Oxford Immunotec Global (1) 371,719 5,193
Sartorius Stedim Biotech (EUR) 321,968 23,264
West Pharmaceutical Services 3,098,100 305,689
Wright Medical (1) 3,396,349 75,399
749,519
Health Care Providers & Services 2.3%
Acadia Healthcare (1) 2,164,959 70,643
Centene (1) 1,170,975 118,128
Henry Schein (1) 1,555,868 108,724
Molina Healthcare (1) 1,687,471 129,395
WellCare Health Plans (1) 382,557 76,936
503,826
Health Care Technology 1.1%
athenahealth (1) 1,407,249 187,220
Teladoc (1) 183,774 6,405
Proof #4
T. Rowe Price New Horizons Fund
Shares/Par $ Value
(Cost and value in $000s)
30
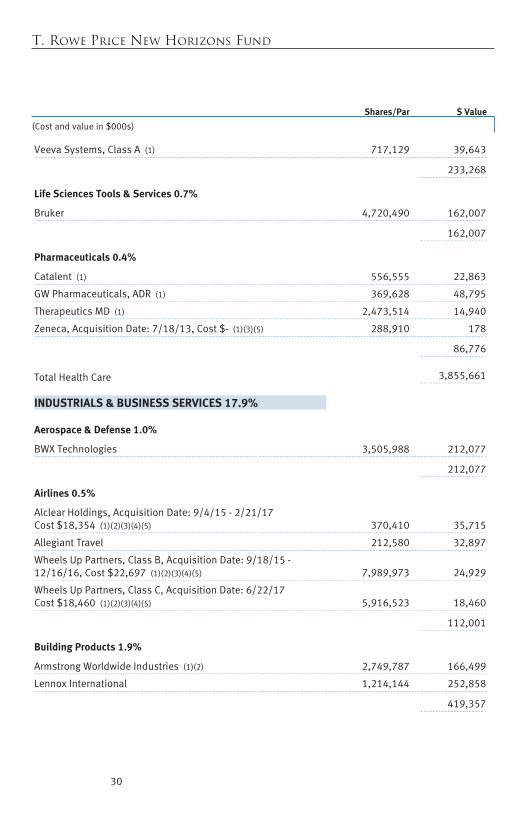
Veeva Systems, Class A (1) 717,129 39,643
233,268
Life Sciences Tools & Services 0.7%
Bruker 4,720,490 162,007
162,007
Pharmaceuticals 0.4%
Catalent (1) 556,555 22,863
GW Pharmaceuticals, ADR (1) 369,628 48,795
Therapeutics MD (1) 2,473,514 14,940
Zeneca, Acquisition Date: 7/18/13, Cost $- (1)(3)(5) 288,910 178
86,776
Total Health Care 3,855,661
INDUSTRIALS & BUSINESS SERVICES 17.9%
Aerospace & Defense 1.0%
BWX Technologies 3,505,988 212,077
212,077
Airlines 0.5%
Alclear Holdings, Acquisition Date: 9/4/15 - 2/21/17 Cost $18,354 (1)(2)(3)(4)(5) 370,410 35,715
Allegiant Travel 212,580 32,897
Wheels Up Partners, Class B, Acquisition Date: 9/18/15 - 12/16/16, Cost $22,697 (1)(2)(3)(4)(5) 7,989,973 24,929
Wheels Up Partners, Class C, Acquisition Date: 6/22/17 Cost $18,460 (1)(2)(3)(4)(5) 5,916,523 18,460
112,001
Building Products 1.9%
Armstrong Worldwide Industries (1)(2) 2,749,787 166,499
Lennox International 1,214,144 252,858
419,357
Proof #4
T. Rowe Price New Horizons Fund
Shares/Par $ Value
(Cost and value in $000s)
31
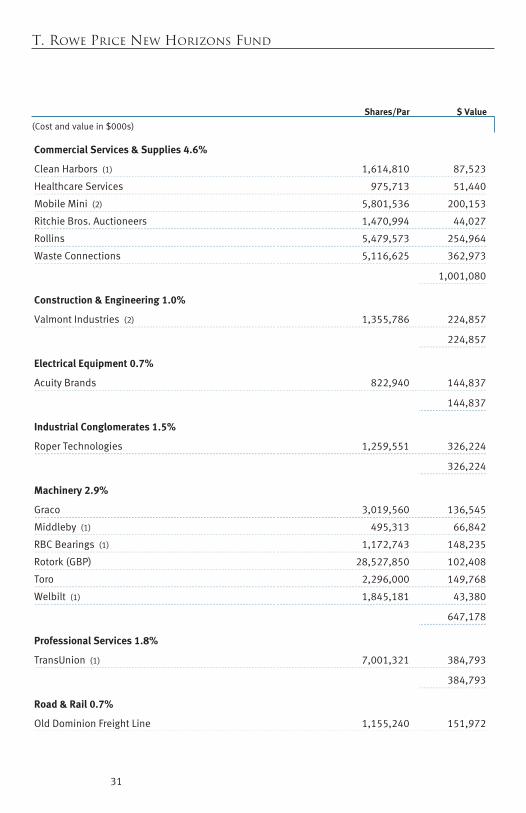
Commercial Services & Supplies 4.6%
Clean Harbors (1) 1,614,810 87,523
Healthcare Services 975,713 51,440
Mobile Mini (2) 5,801,536 200,153
Ritchie Bros. Auctioneers 1,470,994 44,027
Rollins 5,479,573 254,964
Waste Connections 5,116,625 362,973
1,001,080
Construction & Engineering 1.0%
Valmont Industries (2) 1,355,786 224,857
224,857
Electrical Equipment 0.7%
Acuity Brands 822,940 144,837
144,837
Industrial Conglomerates 1.5%
Roper Technologies 1,259,551 326,224
326,224
Machinery 2.9%
Graco 3,019,560 136,545
Middleby (1) 495,313 66,842
RBC Bearings (1) 1,172,743 148,235
Rotork (GBP) 28,527,850 102,408
Toro 2,296,000 149,768
Welbilt (1) 1,845,181 43,380
647,178
Professional Services 1.8%
TransUnion (1) 7,001,321 384,793
384,793
Road & Rail 0.7%
Old Dominion Freight Line 1,155,240 151,972
Proof #4
T. Rowe Price New Horizons Fund
Shares/Par $ Value
(Cost and value in $000s)
32
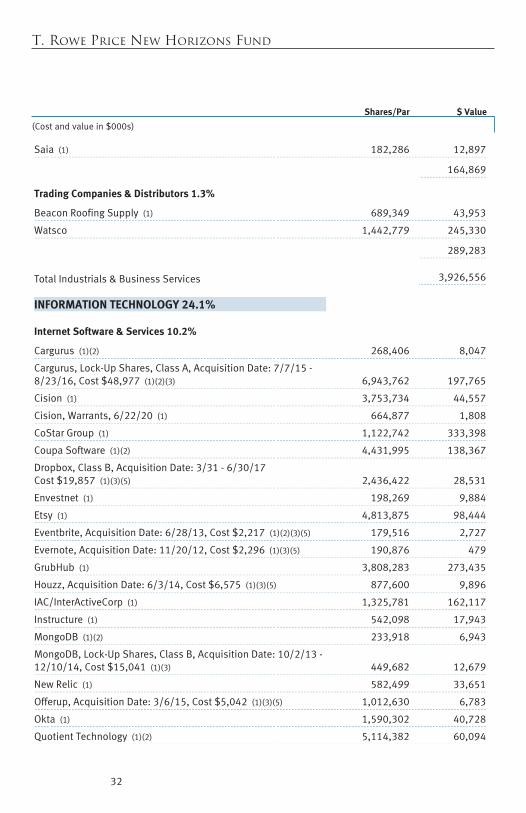
Saia (1) 182,286 12,897
164,869
Trading Companies & Distributors 1.3%
Beacon Roofing Supply (1) 689,349 43,953
Watsco 1,442,779 245,330
289,283
Total Industrials & Business Services 3,926,556
INFORMATION TECHNOLOGY 24.1%
Internet Software & Services 10.2%
Cargurus (1)(2) 268,406 8,047
Cargurus, Lock-Up Shares, Class A, Acquisition Date: 7/7/15 - 8/23/16, Cost $48,977 (1)(2)(3) 6,943,762 197,765
Cision (1) 3,753,734 44,557
Cision, Warrants, 6/22/20 (1) 664,877 1,808
CoStar Group (1) 1,122,742 333,398
Coupa Software (1)(2) 4,431,995 138,367
Dropbox, Class B, Acquisition Date: 3/31 - 6/30/17 Cost $19,857 (1)(3)(5) 2,436,422 28,531
Envestnet (1) 198,269 9,884
Etsy (1) 4,813,875 98,444
Eventbrite, Acquisition Date: 6/28/13, Cost $2,217 (1)(2)(3)(5) 179,516 2,727
Evernote, Acquisition Date: 11/20/12, Cost $2,296 (1)(3)(5) 190,876 479
GrubHub (1) 3,808,283 273,435
Houzz, Acquisition Date: 6/3/14, Cost $6,575 (1)(3)(5) 877,600 9,896
IAC/InterActiveCorp (1) 1,325,781 162,117
Instructure (1) 542,098 17,943
MongoDB (1)(2) 233,918 6,943
MongoDB, Lock-Up Shares, Class B, Acquisition Date: 10/2/13 - 12/10/14, Cost $15,041 (1)(3) 449,682 12,679
New Relic (1) 582,499 33,651
Offerup, Acquisition Date: 3/6/15, Cost $5,042 (1)(3)(5) 1,012,630 6,783
Okta (1) 1,590,302 40,728
Quotient Technology (1)(2) 5,114,382 60,094
Proof #4
T. Rowe Price New Horizons Fund
Shares/Par $ Value
(Cost and value in $000s)
33
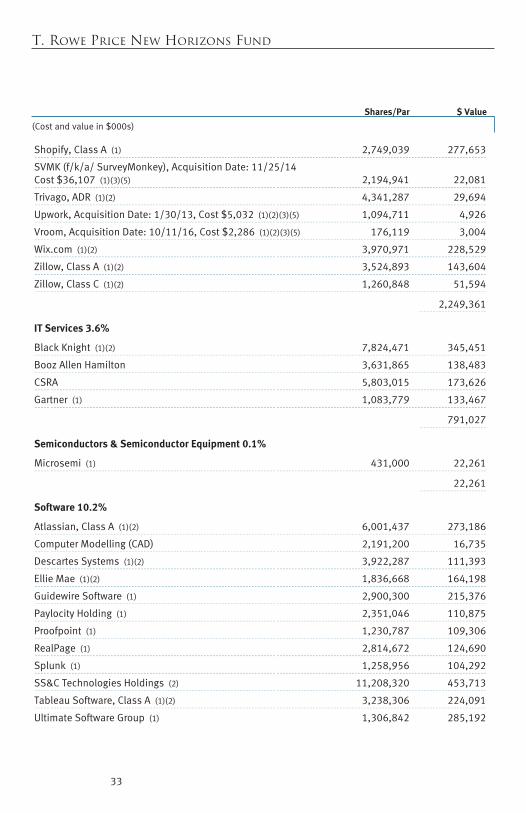
Shopify, Class A (1) 2,749,039 277,653
SVMK (f/k/a/ SurveyMonkey), Acquisition Date: 11/25/14 Cost $36,107 (1)(3)(5) 2,194,941 22,081
Trivago, ADR (1)(2) 4,341,287 29,694
Upwork, Acquisition Date: 1/30/13, Cost $5,032 (1)(2)(3)(5) 1,094,711 4,926
Vroom, Acquisition Date: 10/11/16, Cost $2,286 (1)(2)(3)(5) 176,119 3,004
Wix.com (1)(2) 3,970,971 228,529
Zillow, Class A (1)(2) 3,524,893 143,604
Zillow, Class C (1)(2) 1,260,848 51,594
2,249,361
IT Services 3.6%
Black Knight (1)(2) 7,824,471 345,451
Booz Allen Hamilton 3,631,865 138,483
CSRA 5,803,015 173,626
Gartner (1) 1,083,779 133,467
791,027
Semiconductors & Semiconductor Equipment 0.1%
Microsemi (1) 431,000 22,261
22,261
Software 10.2%
Atlassian, Class A (1)(2) 6,001,437 273,186
Computer Modelling (CAD) 2,191,200 16,735
Descartes Systems (1)(2) 3,922,287 111,393
Ellie Mae (1)(2) 1,836,668 164,198
Guidewire Software (1) 2,900,300 215,376
Paylocity Holding (1) 2,351,046 110,875
Proofpoint (1) 1,230,787 109,306
RealPage (1) 2,814,672 124,690
Splunk (1) 1,258,956 104,292
SS&C Technologies Holdings (2) 11,208,320 453,713
Tableau Software, Class A (1)(2) 3,238,306 224,091
Ultimate Software Group (1) 1,306,842 285,192
Proof #4
T. Rowe Price New Horizons Fund
Shares/Par $ Value
(Cost and value in $000s)
34
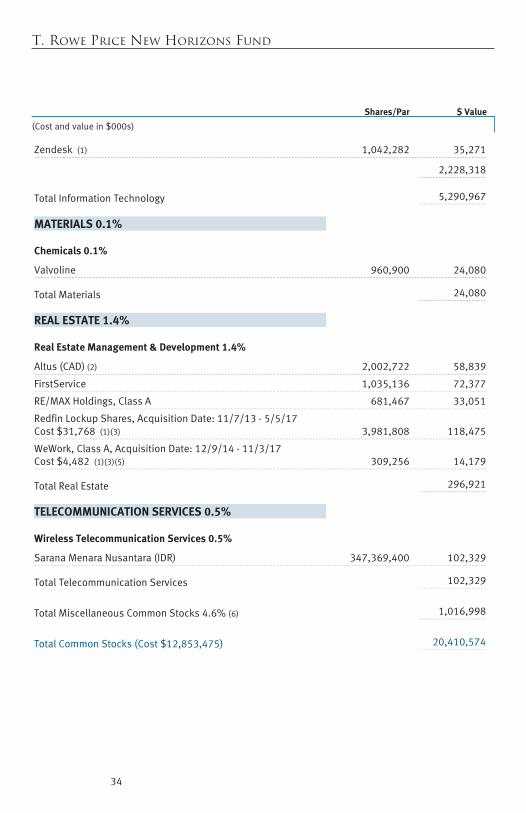
Zendesk (1) 1,042,282 35,271
2,228,318
Total Information Technology 5,290,967
MATERIALS 0.1%
Chemicals 0.1%
Valvoline 960,900 24,080
Total Materials 24,080
REAL ESTATE 1.4%
Real Estate Management & Development 1.4%
Altus (CAD) (2) 2,002,722 58,839
FirstService 1,035,136 72,377
RE/MAX Holdings, Class A 681,467 33,051
Redfin Lockup Shares, Acquisition Date: 11/7/13 - 5/5/17 Cost $31,768 (1)(3) 3,981,808 118,475
WeWork, Class A, Acquisition Date: 12/9/14 - 11/3/17 Cost $4,482 (1)(3)(5) 309,256 14,179
Total Real Estate 296,921
TELECOMMUNICATION SERVICES 0.5%
Wireless Telecommunication Services 0.5%
Sarana Menara Nusantara (IDR) 347,369,400 102,329
Total Telecommunication Services 102,329
Total Miscellaneous Common Stocks 4.6% (6) 1,016,998
Total Common Stocks (Cost $12,853,475) 20,410,574
Proof #4
T. Rowe Price New Horizons Fund
Shares/Par $ Value
(Cost and value in $000s)
35
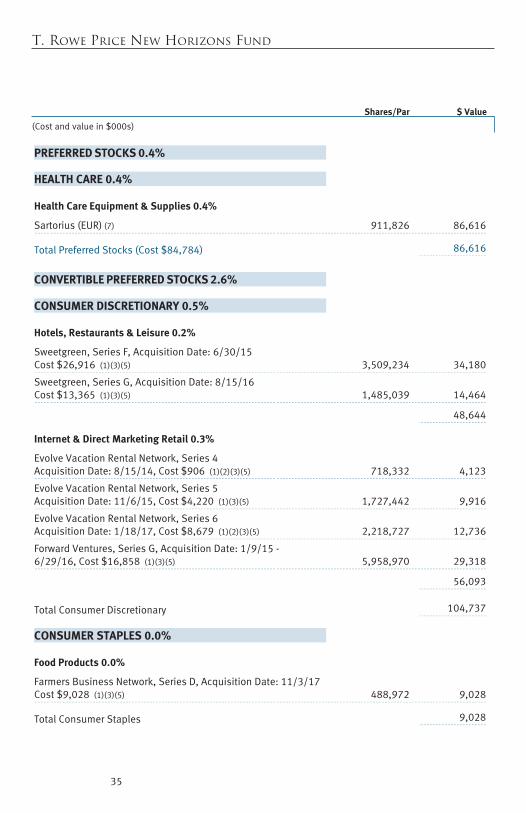
PREFERRED STOCKS 0.4%
HEALTH CARE 0.4%
Health Care Equipment & Supplies 0.4%
Sartorius (EUR) (7) 911,826 86,616
Total Preferred Stocks (Cost $84,784) 86,616
CONVERTIBLE PREFERRED STOCKS 2.6%
CONSUMER DISCRETIONARY 0.5%
Hotels, Restaurants & Leisure 0.2%
Sweetgreen, Series F, Acquisition Date: 6/30/15 Cost $26,916 (1)(3)(5) 3,509,234 34,180
Sweetgreen, Series G, Acquisition Date: 8/15/16 Cost $13,365 (1)(3)(5) 1,485,039 14,464
48,644
Internet & Direct Marketing Retail 0.3%
Evolve Vacation Rental Network, Series 4 Acquisition Date: 8/15/14, Cost $906 (1)(2)(3)(5) 718,332 4,123
Evolve Vacation Rental Network, Series 5 Acquisition Date: 11/6/15, Cost $4,220 (1)(3)(5) 1,727,442 9,916
Evolve Vacation Rental Network, Series 6 Acquisition Date: 1/18/17, Cost $8,679 (1)(2)(3)(5) 2,218,727 12,736
Forward Ventures, Series G, Acquisition Date: 1/9/15 - 6/29/16, Cost $16,858 (1)(3)(5) 5,958,970 29,318
56,093
Total Consumer Discretionary 104,737
CONSUMER STAPLES 0.0%
Food Products 0.0%
Farmers Business Network, Series D, Acquisition Date: 11/3/17 Cost $9,028 (1)(3)(5) 488,972 9,028
Total Consumer Staples 9,028
Proof #4
T. Rowe Price New Horizons Fund
Shares/Par $ Value
(Cost and value in $000s)
36
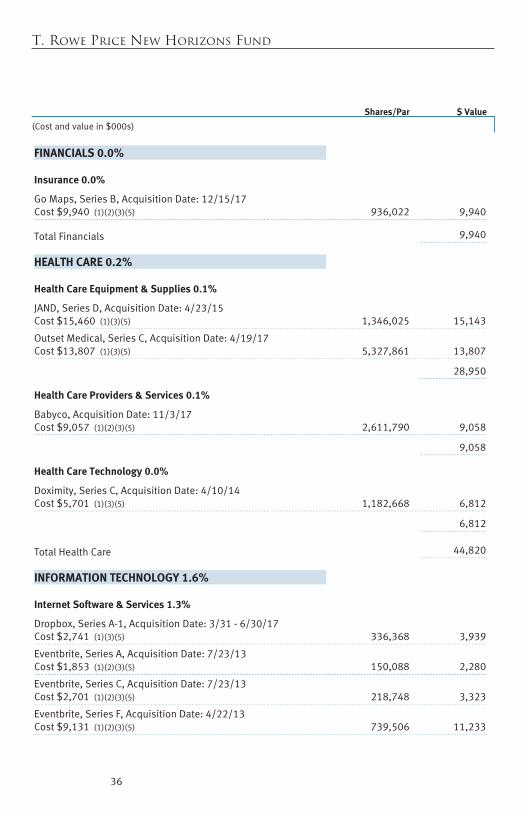
FINANCIALS 0.0%
Insurance 0.0%
Go Maps, Series B, Acquisition Date: 12/15/17 Cost $9,940 (1)(2)(3)(5) 936,022 9,940
Total Financials 9,940
HEALTH CARE 0.2%
Health Care Equipment & Supplies 0.1%
JAND, Series D, Acquisition Date: 4/23/15 Cost $15,460 (1)(3)(5) 1,346,025 15,143
Outset Medical, Series C, Acquisition Date: 4/19/17 Cost $13,807 (1)(3)(5) 5,327,861 13,807
28,950
Health Care Providers & Services 0.1%
Babyco, Acquisition Date: 11/3/17 Cost $9,057 (1)(2)(3)(5) 2,611,790 9,058
9,058
Health Care Technology 0.0%
Doximity, Series C, Acquisition Date: 4/10/14 Cost $5,701 (1)(3)(5) 1,182,668 6,812
6,812
Total Health Care 44,820
INFORMATION TECHNOLOGY 1.6%
Internet Software & Services 1.3%
Dropbox, Series A-1, Acquisition Date: 3/31 - 6/30/17 Cost $2,741 (1)(3)(5) 336,368 3,939
Eventbrite, Series A, Acquisition Date: 7/23/13 Cost $1,853 (1)(2)(3)(5) 150,088 2,280
Eventbrite, Series C, Acquisition Date: 7/23/13 Cost $2,701 (1)(2)(3)(5) 218,748 3,323
Eventbrite, Series F, Acquisition Date: 4/22/13 Cost $9,131 (1)(2)(3)(5) 739,506 11,233
Proof #4
T. Rowe Price New Horizons Fund
Shares/Par $ Value
(Cost and value in $000s)
37
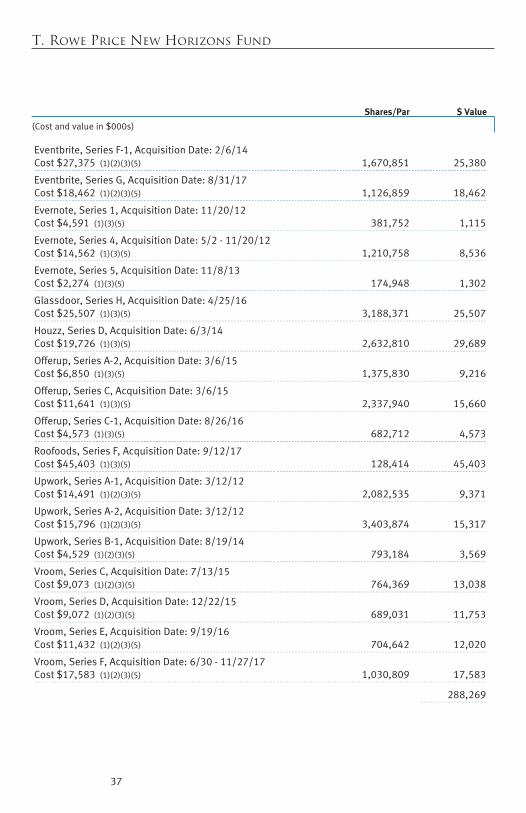
Eventbrite, Series F-1, Acquisition Date: 2/6/14 Cost $27,375 (1)(2)(3)(5) 1,670,851 25,380
Eventbrite, Series G, Acquisition Date: 8/31/17 Cost $18,462 (1)(2)(3)(5) 1,126,859 18,462
Evernote, Series 1, Acquisition Date: 11/20/12 Cost $4,591 (1)(3)(5) 381,752 1,115
Evernote, Series 4, Acquisition Date: 5/2 - 11/20/12 Cost $14,562 (1)(3)(5) 1,210,758 8,536
Evernote, Series 5, Acquisition Date: 11/8/13 Cost $2,274 (1)(3)(5) 174,948 1,302
Glassdoor, Series H, Acquisition Date: 4/25/16 Cost $25,507 (1)(3)(5) 3,188,371 25,507
Houzz, Series D, Acquisition Date: 6/3/14 Cost $19,726 (1)(3)(5) 2,632,810 29,689
Offerup, Series A-2, Acquisition Date: 3/6/15 Cost $6,850 (1)(3)(5) 1,375,830 9,216
Offerup, Series C, Acquisition Date: 3/6/15 Cost $11,641 (1)(3)(5) 2,337,940 15,660
Offerup, Series C-1, Acquisition Date: 8/26/16 Cost $4,573 (1)(3)(5) 682,712 4,573
Roofoods, Series F, Acquisition Date: 9/12/17 Cost $45,403 (1)(3)(5) 128,414 45,403
Upwork, Series A-1, Acquisition Date: 3/12/12 Cost $14,491 (1)(2)(3)(5) 2,082,535 9,371
Upwork, Series A-2, Acquisition Date: 3/12/12 Cost $15,796 (1)(2)(3)(5) 3,403,874 15,317
Upwork, Series B-1, Acquisition Date: 8/19/14 Cost $4,529 (1)(2)(3)(5) 793,184 3,569
Vroom, Series C, Acquisition Date: 7/13/15 Cost $9,073 (1)(2)(3)(5) 764,369 13,038
Vroom, Series D, Acquisition Date: 12/22/15 Cost $9,072 (1)(2)(3)(5) 689,031 11,753
Vroom, Series E, Acquisition Date: 9/19/16 Cost $11,432 (1)(2)(3)(5) 704,642 12,020
Vroom, Series F, Acquisition Date: 6/30 - 11/27/17 Cost $17,583 (1)(2)(3)(5) 1,030,809 17,583
288,269
Proof #4
T. Rowe Price New Horizons Fund
Shares/Par $ Value
(Cost and value in $000s)
38
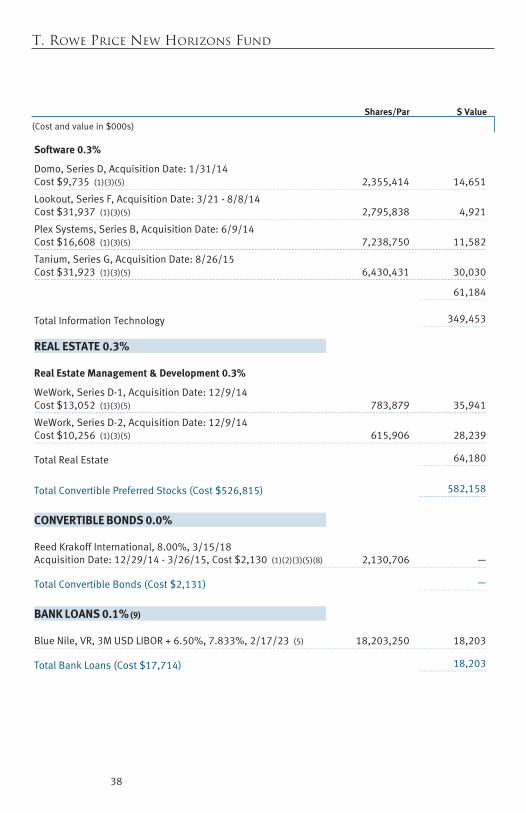
Software 0.3%
Domo, Series D, Acquisition Date: 1/31/14 Cost $9,735 (1)(3)(5) 2,355,414 14,651
Lookout, Series F, Acquisition Date: 3/21 - 8/8/14 Cost $31,937 (1)(3)(5) 2,795,838 4,921
Plex Systems, Series B, Acquisition Date: 6/9/14 Cost $16,608 (1)(3)(5) 7,238,750 11,582
Tanium, Series G, Acquisition Date: 8/26/15 Cost $31,923 (1)(3)(5) 6,430,431 30,030
61,184
Total Information Technology 349,453
REAL ESTATE 0.3%
Real Estate Management & Development 0.3%
WeWork, Series D-1, Acquisition Date: 12/9/14 Cost $13,052 (1)(3)(5) 783,879 35,941
WeWork, Series D-2, Acquisition Date: 12/9/14 Cost $10,256 (1)(3)(5) 615,906 28,239
Total Real Estate 64,180
Total Convertible Preferred Stocks (Cost $526,815) 582,158
CONVERTIBLE BONDS 0.0%
Reed Krakoff International, 8.00%, 3/15/18 Acquisition Date: 12/29/14 - 3/26/15, Cost $2,130 (1)(2)(3)(5)(8) 2,130,706 —
Total Convertible Bonds (Cost $2,131) —
BANK LOANS 0.1% (9)
Blue Nile, VR, 3M USD LIBOR + 6.50%, 7.833%, 2/17/23 (5) 18,203,250 18,203
Total Bank Loans (Cost $17,714) 18,203
Proof #4
T. Rowe Price New Horizons Fund
Shares/Par $ Value
(Cost and value in $000s)
39
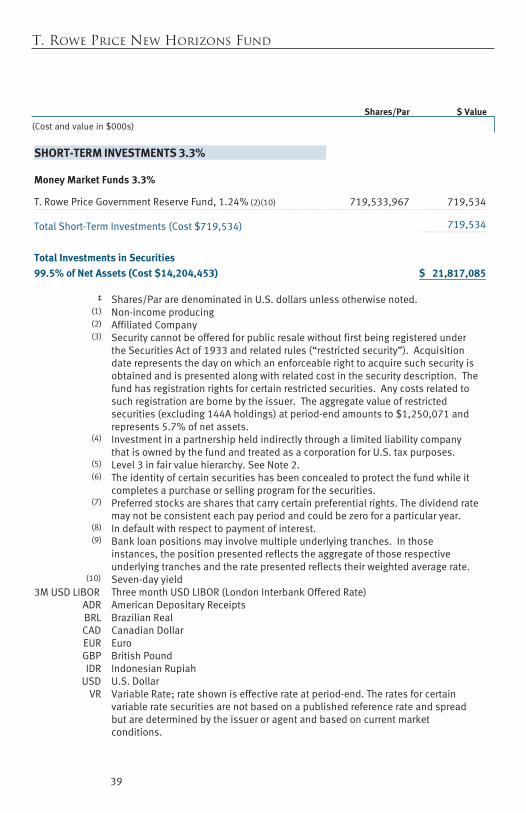
SHORT-TERM INVESTMENTS 3.3%
Money Market Funds 3.3%
T. Rowe Price Government Reserve Fund, 1.24% (2)(10) 719,533,967 719,534
Total Short-Term Investments (Cost $719,534) 719,534
Total Investments in Securities
99.5% of Net Assets (Cost $14,204,453) $ 21,817,085
‡ Shares/Par are denominated in U.S. dollars unless otherwise noted. (1) Non-income producing (2) Affiliated Company (3)
Security cannot be offered for public resale without first being registered under the Securities Act of 1933 and related rules (“restricted security”). Acquisition date represents the day on which an enforceable right to acquire such security is obtained and is presented along with related cost in the security description. The fund has registration rights for certain restricted securities. Any costs related to such registration are borne by the issuer. The aggregate value of restricted securities (excluding 144A holdings) at period-end amounts to $1,250,071 and represents 5.7% of net assets.
(4)
Investment in a partnership held indirectly through a limited liability company that is owned by the fund and treated as a corporation for U.S. tax purposes.
(5) Level 3 in fair value hierarchy. See Note 2. (6)
The identity of certain securities has been concealed to protect the fund while it completes a purchase or selling program for the securities.
(7)
Preferred stocks are shares that carry certain preferential rights. The dividend rate may not be consistent each pay period and could be zero for a particular year.
(8) In default with respect to payment of interest. (9)
Bank loan positions may involve multiple underlying tranches. In those instances, the position presented reflects the aggregate of those respective underlying tranches and the rate presented reflects their weighted average rate.
(10) Seven-day yield 3M USD LIBOR Three month USD LIBOR (London Interbank Offered Rate)
ADR American Depositary Receipts BRL Brazilian Real CAD Canadian Dollar EUR Euro GBP British Pound IDR Indonesian Rupiah
USD U.S. Dollar VR
Variable Rate; rate shown is effective rate at period-end. The rates for certain variable rate securities are not based on a published reference rate and spread but are determined by the issuer or agent and based on current market conditions.
Proof #4
T. Rowe Price New Horizons Fund
40
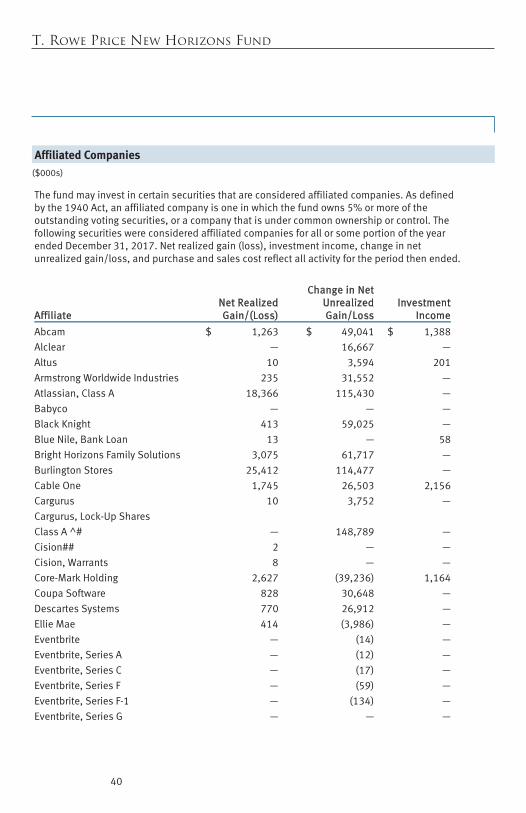
Affiliated Companies
($000s) The fund may invest in certain securities that are considered affiliated companies. As defined by the 1940 Act, an affiliated company is one in which the fund owns 5% or more of the outstanding voting securities, or a company that is under common ownership or control. The following securities were considered affiliated companies for all or some portion of the year ended December 31, 2017. Net realized gain (loss), investment income, change in net unrealized gain/loss, and purchase and sales cost reflect all activity for the period then ended.
Affiliate
Net RealizedGain/(Loss)
Change in NetUnrealizedGain/Loss
InvestmentIncome
Abcam $ 1,263 $ 49,041 $ 1,388 Alclear — 16,667 — Altus 10 3,594 201 Armstrong Worldwide Industries 235 31,552 — Atlassian, Class A 18,366 115,430 — Babyco — — — Black Knight 413 59,025 — Blue Nile, Bank Loan 13 — 58 Bright Horizons Family Solutions 3,075 61,717 — Burlington Stores 25,412 114,477 — Cable One 1,745 26,503 2,156 Cargurus 10 3,752 — Cargurus, Lock-Up Shares Class A ^# — 148,789 — Cision## 2 — — Cision, Warrants 8 — — Core-Mark Holding 2,627 (39,236) 1,164 Coupa Software 828 30,648 — Descartes Systems 770 26,912 — Ellie Mae 414 (3,986) — Eventbrite — (14) — Eventbrite, Series A — (12) — Eventbrite, Series C — (17) — Eventbrite, Series F — (59) — Eventbrite, Series F-1 — (134) — Eventbrite, Series G — — —
Proof #4
T. Rowe Price New Horizons Fund
41
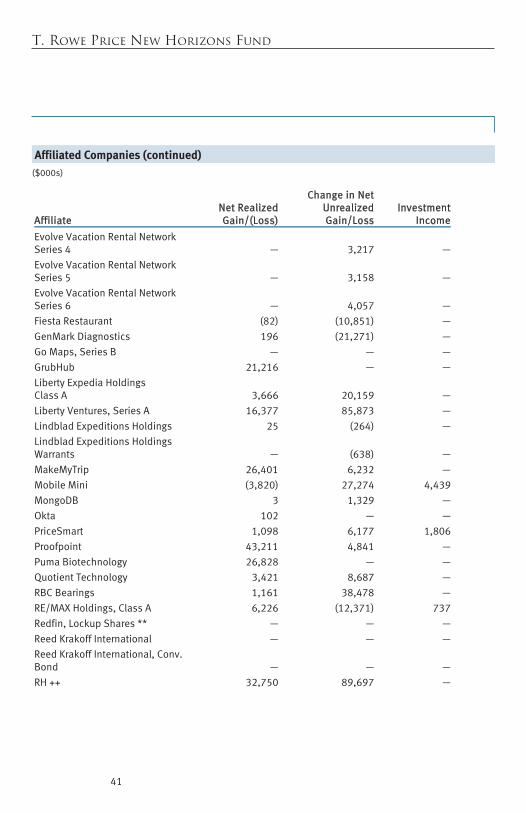
Affiliated Companies
($000s)
Affiliate
Net RealizedGain/(Loss)
Change in NetUnrealizedGain/Loss
InvestmentIncome
Evolve Vacation Rental Network Series 4 — 3,217 — Evolve Vacation Rental Network Series 5 — 3,158 — Evolve Vacation Rental Network Series 6 — 4,057 — Fiesta Restaurant (82) (10,851) — GenMark Diagnostics 196 (21,271) — Go Maps, Series B — — — GrubHub 21,216 — — Liberty Expedia Holdings Class A 3,666 20,159 — Liberty Ventures, Series A 16,377 85,873 — Lindblad Expeditions Holdings 25 (264) — Lindblad Expeditions Holdings Warrants — (638) — MakeMyTrip 26,401 6,232 — Mobile Mini (3,820) 27,274 4,439 MongoDB 3 1,329 — Okta 102 — — PriceSmart 1,098 6,177 1,806 Proofpoint 43,211 4,841 — Puma Biotechnology 26,828 — — Quotient Technology 3,421 8,687 — RBC Bearings 1,161 38,478 — RE/MAX Holdings, Class A 6,226 (12,371) 737 Redfin, Lockup Shares ** — — — Reed Krakoff International — — — Reed Krakoff International, Conv. Bond — — — RH ++ 32,750 89,697 —
affiliated companies (continued)
Proof #4
T. Rowe Price New Horizons Fund
42
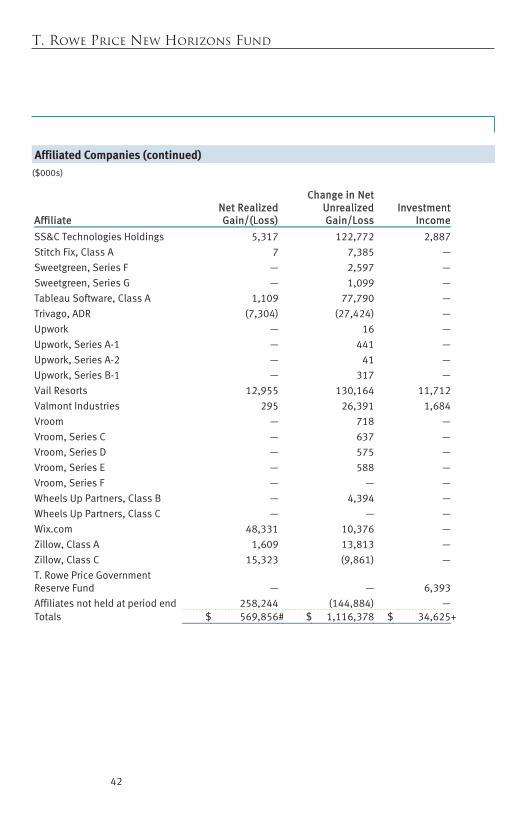
Affiliated Companies
($000s) Affiliate
Net RealizedGain/(Loss)
Change in NetUnrealizedGain/Loss
InvestmentIncome
SS&C Technologies Holdings 5,317 122,772 2,887 Stitch Fix, Class A 7 7,385 — Sweetgreen, Series F — 2,597 — Sweetgreen, Series G — 1,099 — Tableau Software, Class A 1,109 77,790 — Trivago, ADR (7,304) (27,424) — Upwork — 16 — Upwork, Series A-1 — 441 — Upwork, Series A-2 — 41 — Upwork, Series B-1 — 317 — Vail Resorts 12,955 130,164 11,712 Valmont Industries 295 26,391 1,684 Vroom — 718 — Vroom, Series C — 637 — Vroom, Series D — 575 — Vroom, Series E — 588 — Vroom, Series F — — — Wheels Up Partners, Class B — 4,394 — Wheels Up Partners, Class C — — — Wix.com 48,331 10,376 — Zillow, Class A 1,609 13,813 — Zillow, Class C 15,323 (9,861) — T. Rowe Price Government Reserve Fund — — 6,393 Affiliates not held at period end 258,244 (144,884) — Totals $ 569,856# $ 1,116,378 $ 34,625+
affiliated companies (continued)
Proof #4
T. Rowe Price New Horizons Fund
43
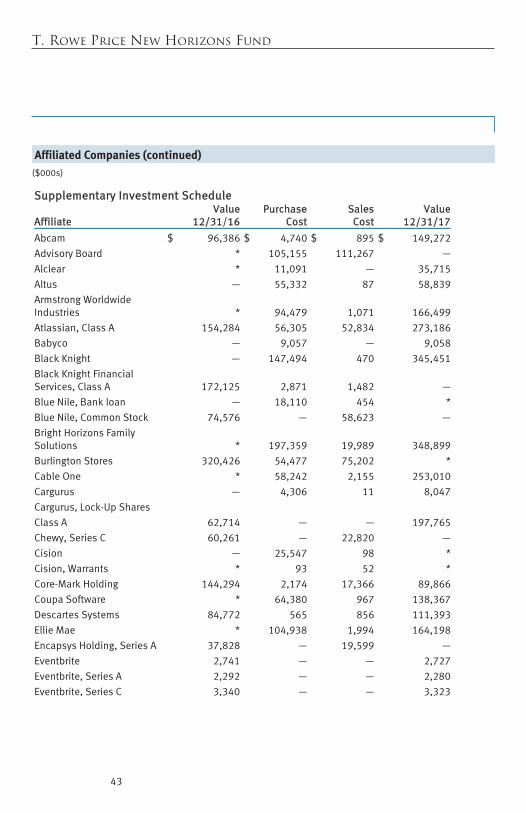
Affiliated Companies
($000s)
Supplementary Investment Schedule Affiliate
Value12/31/16
PurchaseCost
SalesCost
Value12/31/17
Abcam $ 96,386 $ 4,740 $ 895 $ 149,272 Advisory Board * 105,155 111,267 — Alclear * 11,091 — 35,715 Altus — 55,332 87 58,839 Armstrong Worldwide Industries * 94,479 1,071 166,499 Atlassian, Class A 154,284 56,305 52,834 273,186 Babyco — 9,057 — 9,058 Black Knight — 147,494 470 345,451 Black Knight Financial Services, Class A 172,125 2,871 1,482 — Blue Nile, Bank loan — 18,110 454 * Blue Nile, Common Stock 74,576 — 58,623 — Bright Horizons Family Solutions * 197,359 19,989 348,899 Burlington Stores 320,426 54,477 75,202 * Cable One * 58,242 2,155 253,010 Cargurus — 4,306 11 8,047 Cargurus, Lock-Up Shares Class A 62,714 — — 197,765 Chewy, Series C 60,261 — 22,820 — Cision — 25,547 98 * Cision, Warrants * 93 52 * Core-Mark Holding 144,294 2,174 17,366 89,866 Coupa Software * 64,380 967 138,367 Descartes Systems 84,772 565 856 111,393 Ellie Mae * 104,938 1,994 164,198 Encapsys Holding, Series A 37,828 — 19,599 — Eventbrite 2,741 — — 2,727 Eventbrite, Series A 2,292 — — 2,280 Eventbrite, Series C 3,340 — — 3,323
affiliated companies (continued)
Proof #4
T. Rowe Price New Horizons Fund
44
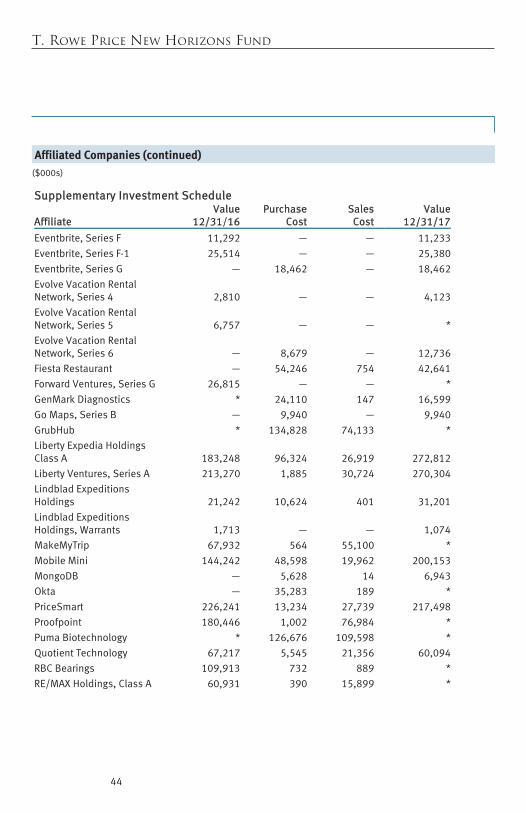
Affiliated Companies
($000s) Supplementary Investment Schedule Affiliate
Value12/31/16
PurchaseCost
SalesCost
Value12/31/17
Eventbrite, Series F 11,292 — — 11,233 Eventbrite, Series F-1 25,514 — — 25,380 Eventbrite, Series G — 18,462 — 18,462 Evolve Vacation Rental Network, Series 4 2,810 — — 4,123 Evolve Vacation Rental Network, Series 5 6,757 — — * Evolve Vacation Rental Network, Series 6 — 8,679 — 12,736 Fiesta Restaurant — 54,246 754 42,641 Forward Ventures, Series G 26,815 — — * GenMark Diagnostics * 24,110 147 16,599 Go Maps, Series B — 9,940 — 9,940 GrubHub * 134,828 74,133 * Liberty Expedia Holdings Class A 183,248 96,324 26,919 272,812 Liberty Ventures, Series A 213,270 1,885 30,724 270,304 Lindblad Expeditions Holdings 21,242 10,624 401 31,201 Lindblad Expeditions Holdings, Warrants 1,713 — — 1,074 MakeMyTrip 67,932 564 55,100 * Mobile Mini 144,242 48,598 19,962 200,153 MongoDB — 5,628 14 6,943 Okta — 35,283 189 * PriceSmart 226,241 13,234 27,739 217,498 Proofpoint 180,446 1,002 76,984 * Puma Biotechnology * 126,676 109,598 * Quotient Technology 67,217 5,545 21,356 60,094 RBC Bearings 109,913 732 889 * RE/MAX Holdings, Class A 60,931 390 15,899 *
affiliated companies (continued)
Proof #4
T. Rowe Price New Horizons Fund
45
Affiliated Companies
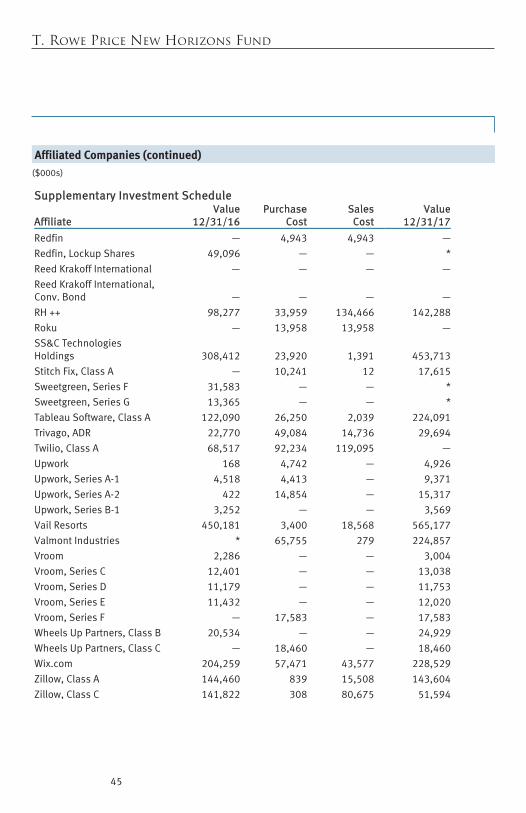
($000s)
Supplementary Investment Schedule Affiliate
Value12/31/16
PurchaseCost
SalesCost
Value12/31/17
Redfin — 4,943 4,943 — Redfin, Lockup Shares 49,096 — — * Reed Krakoff International — — — — Reed Krakoff International, Conv. Bond — — — — RH ++ 98,277 33,959 134,466 142,288 Roku — 13,958 13,958 — SS&C Technologies Holdings 308,412 23,920 1,391 453,713 Stitch Fix, Class A — 10,241 12 17,615 Sweetgreen, Series F 31,583 — — * Sweetgreen, Series G 13,365 — — * Tableau Software, Class A 122,090 26,250 2,039 224,091 Trivago, ADR 22,770 49,084 14,736 29,694 Twilio, Class A 68,517 92,234 119,095 — Upwork 168 4,742 — 4,926 Upwork, Series A-1 4,518 4,413 — 9,371 Upwork, Series A-2 422 14,854 — 15,317 Upwork, Series B-1 3,252 — — 3,569 Vail Resorts 450,181 3,400 18,568 565,177 Valmont Industries * 65,755 279 224,857 Vroom 2,286 — — 3,004 Vroom, Series C 12,401 — — 13,038 Vroom, Series D 11,179 — — 11,753 Vroom, Series E 11,432 — — 12,020 Vroom, Series F — 17,583 — 17,583 Wheels Up Partners, Class B 20,534 — — 24,929 Wheels Up Partners, Class C — 18,460 — 18,460 Wix.com 204,259 57,471 43,577 228,529 Zillow, Class A 144,460 839 15,508 143,604 Zillow, Class C 141,822 308 80,675 51,594
affiliated companies (continued)
Proof #4
T. Rowe Price New Horizons Fund
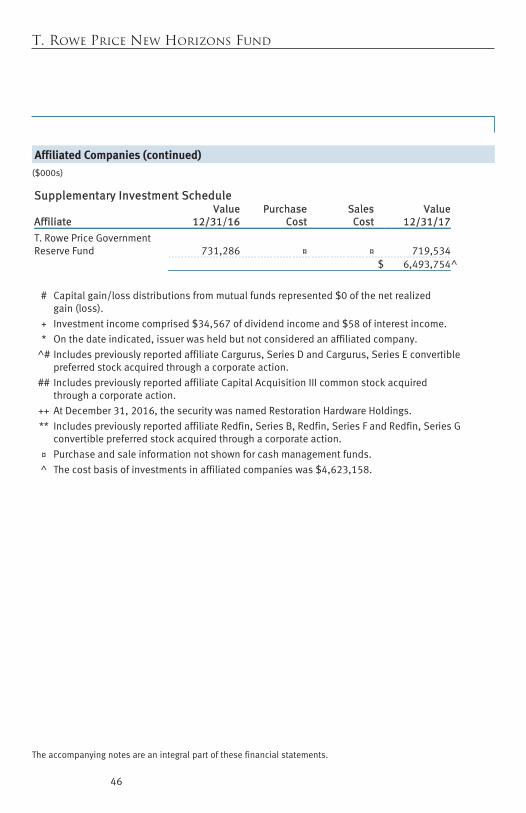
46
The accompanying notes are an integral part of these financial statements.
($000s)
affiliated companies (continued)
Supplementary Investment Schedule Affiliate
Value12/31/16
PurchaseCost
SalesCost
Value12/31/17
T. Rowe Price Government Reserve Fund 731,286 ¤ ¤ 719,534 $ 6,493,754^
# Capital gain/loss distributions from mutual funds represented $0 of the net realized
gain (loss). + Investment income comprised $34,567 of dividend income and $58 of interest income. * On the date indicated, issuer was held but not considered an affiliated company.
^# Includes previously reported affiliate Cargurus, Series D and Cargurus, Series E convertible preferred stock acquired through a corporate action.
## Includes previously reported affiliate Capital Acquisition III common stock acquired through a corporate action.
++ At December 31, 2016, the security was named Restoration Hardware Holdings. ** Includes previously reported affiliate Redfin, Series B, Redfin, Series F and Redfin, Series G
convertible preferred stock acquired through a corporate action. ¤ Purchase and sale information not shown for cash management funds. ^ The cost basis of investments in affiliated companies was $4,623,158.
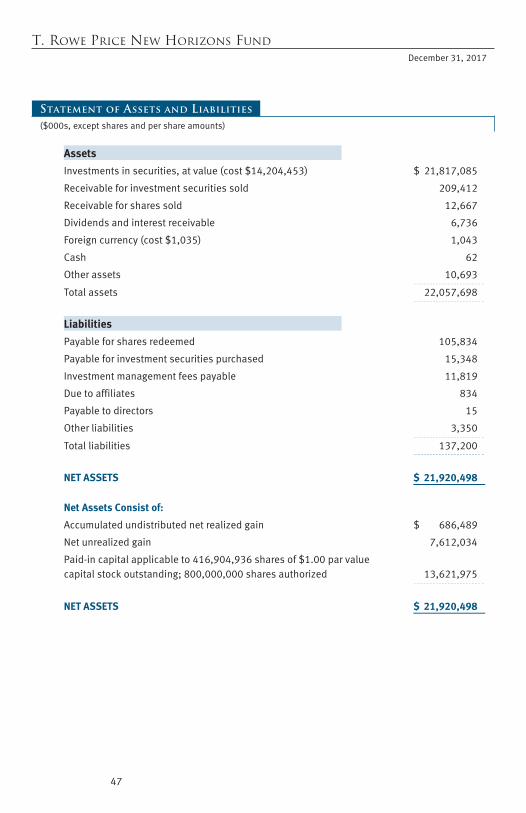
Proof #4
47
T. Rowe Price New Horizons Fund December 31, 2017
($000s, except shares and per share amounts)
Statement of Assets and Liabilities
Assets
Investments in securities, at value (cost $14,204,453) $ 21,817,085
Receivable for investment securities sold 209,412
Receivable for shares sold 12,667
Dividends and interest receivable 6,736
Foreign currency (cost $1,035) 1,043
Cash 62
Other assets 10,693
Total assets 22,057,698
Liabilities
Payable for shares redeemed 105,834
Payable for investment securities purchased 15,348
Investment management fees payable 11,819
Due to affiliates 834
Payable to directors 15
Other liabilities 3,350
Total liabilities 137,200
NET ASSETS $ 21,920,498 Net Assets Consist of:
Accumulated undistributed net realized gain $ 686,489
Net unrealized gain 7,612,034
Paid-in capital applicable to 416,904,936 shares of $1.00 par value capital stock outstanding; 800,000,000 shares authorized 13,621,975
NET ASSETS $ 21,920,498
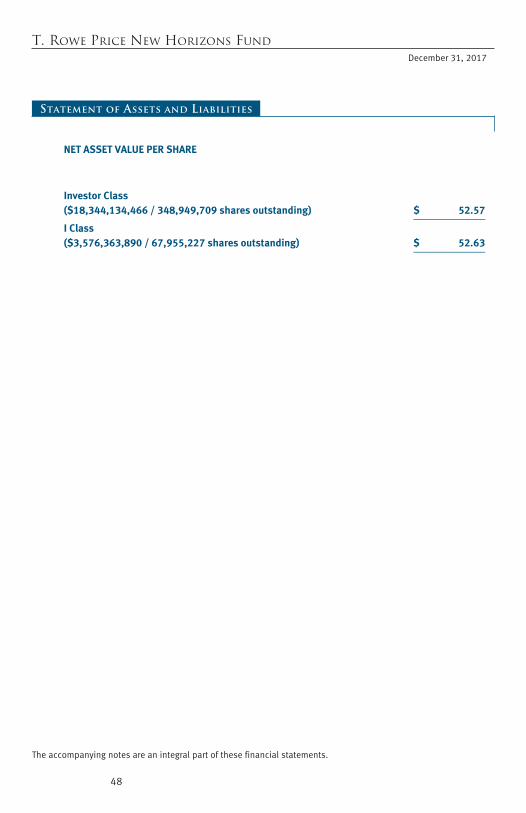
Proof #4
48
T. Rowe Price New Horizons Fund December 31, 2017
The accompanying notes are an integral part of these financial statements.
Statement of Assets and Liabilities
NET ASSET VALUE PER SHARE
Investor Class ($18,344,134,466 / 348,949,709 shares outstanding) $ 52.57
I Class ($3,576,363,890 / 67,955,227 shares outstanding) $ 52.63
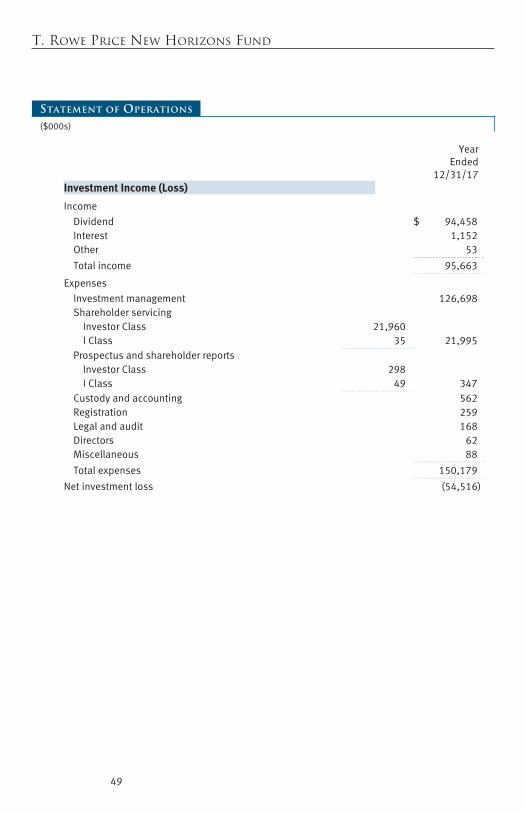
Proof #4
T. Rowe Price New Horizons Fund
($000s)
Statement of Operations
49
Year Ended
12/31/17Investment Income (Loss)
Income Dividend $ 94,458 Interest 1,152 Other 53
Total income 95,663
Expenses Investment management 126,698 Shareholder servicing
Investor Class 21,960 I Class 35 21,995
Prospectus and shareholder reports Investor Class 298 I Class 49 347
Custody and accounting 562 Registration 259 Legal and audit 168 Directors 62 Miscellaneous 88
Total expenses 150,179
Net investment loss (54,516)
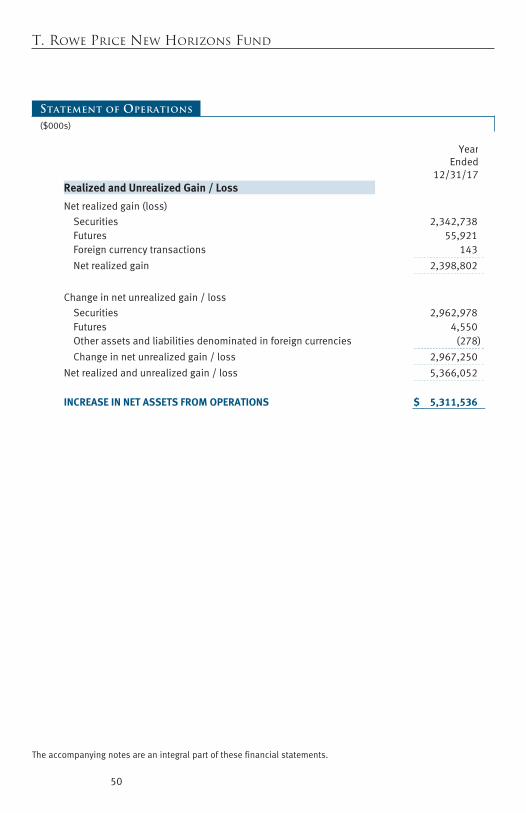
Proof #4
T. Rowe Price New Horizons Fund
($000s)
Statement of Operations
50
The accompanying notes are an integral part of these financial statements.
Year Ended
12/31/17Realized and Unrealized Gain / Loss
Net realized gain (loss) Securities 2,342,738 Futures 55,921 Foreign currency transactions 143
Net realized gain 2,398,802
Change in net unrealized gain / loss
Securities 2,962,978 Futures 4,550 Other assets and liabilities denominated in foreign currencies (278)
Change in net unrealized gain / loss 2,967,250
Net realized and unrealized gain / loss 5,366,052
INCREASE IN NET ASSETS FROM OPERATIONS $ 5,311,536
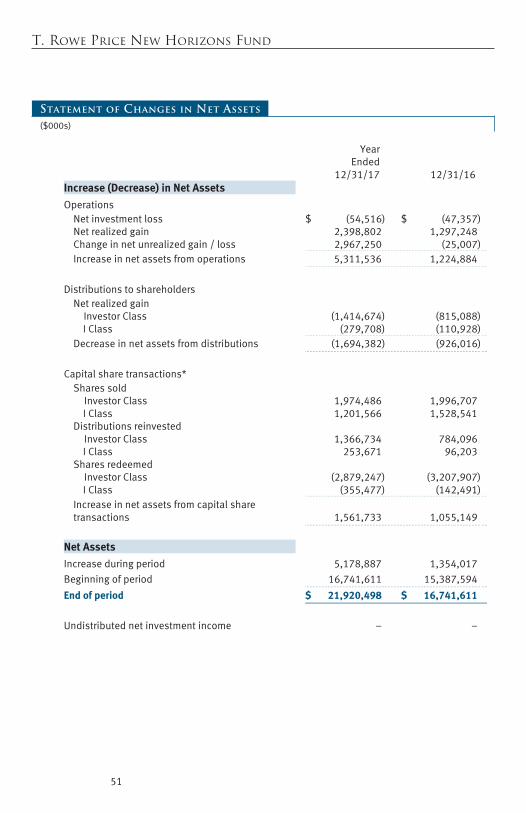
Proof #4
T. Rowe Price New Horizons Fund
($000s)
51
Statement of Changes in Net Assets
Year Ended
12/31/17 12/31/16Increase (Decrease) in Net Assets
Operations Net investment loss $ (54,516) $ (47,357) Net realized gain 2,398,802 1,297,248 Change in net unrealized gain / loss 2,967,250 (25,007) Increase in net assets from operations 5,311,536 1,224,884
Distributions to shareholders
Net realized gain Investor Class (1,414,674) (815,088) I Class (279,708) (110,928)
Decrease in net assets from distributions (1,694,382) (926,016)
Capital share transactions*
Shares sold Investor Class 1,974,486 1,996,707 I Class 1,201,566 1,528,541
Distributions reinvested Investor Class 1,366,734 784,096 I Class 253,671 96,203
Shares redeemed Investor Class (2,879,247) (3,207,907) I Class (355,477) (142,491)
Increase in net assets from capital share transactions 1,561,733 1,055,149
Net Assets
Increase during period 5,178,887 1,354,017 Beginning of period 16,741,611 15,387,594
End of period $ 21,920,498 $ 16,741,611
Undistributed net investment income – –
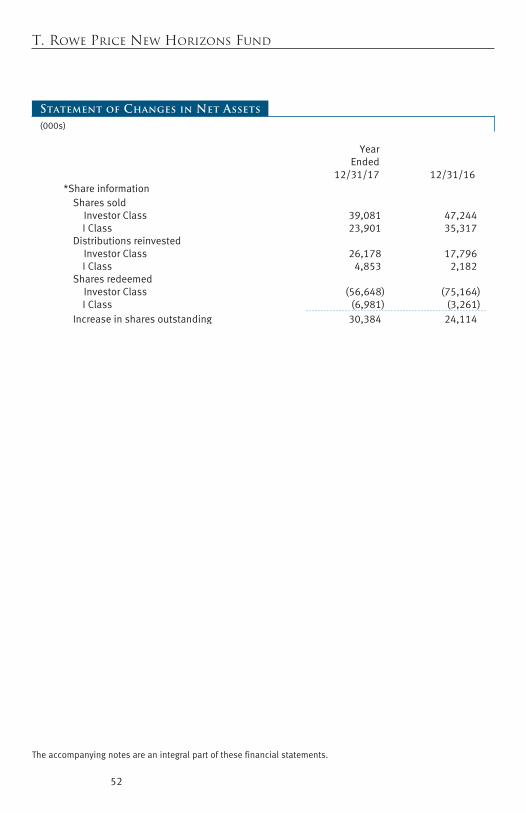
Proof #4
T. Rowe Price New Horizons Fund
52
The accompanying notes are an integral part of these financial statements.
Statement of Changes in Net Assets
(000s)
Year Ended
12/31/17 12/31/16*Share information
Shares sold Investor Class 39,081 47,244 I Class 23,901 35,317
Distributions reinvested Investor Class 26,178 17,796 I Class 4,853 2,182
Shares redeemed Investor Class (56,648) (75,164) I Class (6,981) (3,261)
Increase in shares outstanding 30,384 24,114
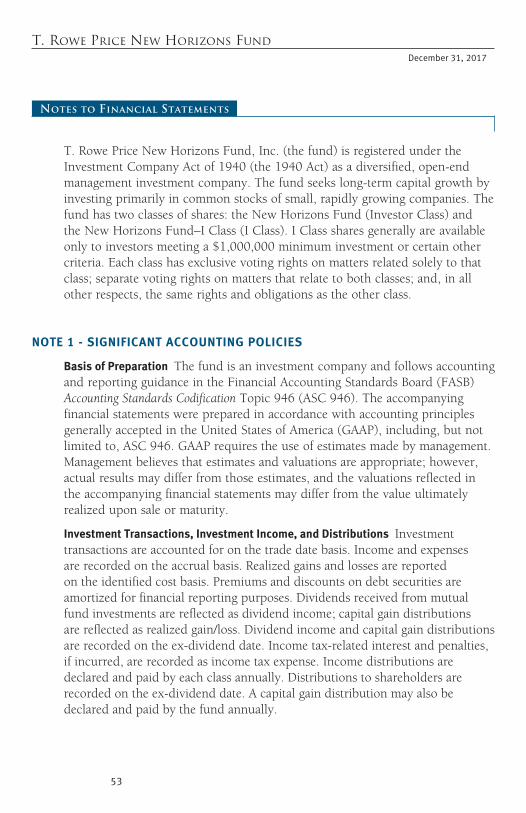
Proof #4
53
T. Rowe Price New Horizons Fund December 31, 2017
Notes to Financial Statements
T. Rowe Price New Horizons Fund, Inc. (the fund) is registered under the Investment Company Act of 1940 (the 1940 Act) as a diversified, open-end management investment company. The fund seeks long-term capital growth by investing primarily in common stocks of small, rapidly growing companies. The fund has two classes of shares: the New Horizons Fund (Investor Class) and the New Horizons Fund–I Class (I Class). I Class shares generally are available only to investors meeting a $1,000,000 minimum investment or certain other criteria. Each class has exclusive voting rights on matters related solely to that class; separate voting rights on matters that relate to both classes; and, in all other respects, the same rights and obligations as the other class.
NOTE 1 - SIGNIfIcaNT accOuNTING POLIcIES
Basis of Preparation The fund is an investment company and follows accounting and reporting guidance in the Financial Accounting Standards Board (FASB) Accounting Standards Codification Topic 946 (ASC 946). The accompanying financial statements were prepared in accordance with accounting principles generally accepted in the United States of America (GAAP), including, but not limited to, ASC 946. GAAP requires the use of estimates made by management. Management believes that estimates and valuations are appropriate; however, actual results may differ from those estimates, and the valuations reflected in the accompanying financial statements may differ from the value ultimately realized upon sale or maturity.
Investment Transactions, Investment Income, and Distributions Investment transactions are accounted for on the trade date basis. Income and expenses are recorded on the accrual basis. Realized gains and losses are reported on the identified cost basis. Premiums and discounts on debt securities are amortized for financial reporting purposes. Dividends received from mutual fund investments are reflected as dividend income; capital gain distributions are reflected as realized gain/loss. Dividend income and capital gain distributions are recorded on the ex-dividend date. Income tax-related interest and penalties, if incurred, are recorded as income tax expense. Income distributions are declared and paid by each class annually. Distributions to shareholders are recorded on the ex-dividend date. A capital gain distribution may also be declared and paid by the fund annually.
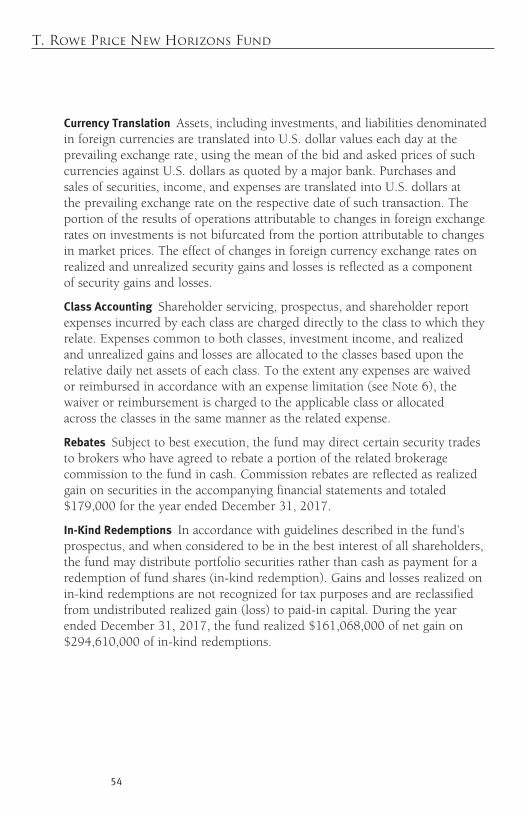
Proof #4
54
T. Rowe Price New Horizons Fund
currency Translation Assets, including investments, and liabilities denominated in foreign currencies are translated into U.S. dollar values each day at the prevailing exchange rate, using the mean of the bid and asked prices of such currencies against U.S. dollars as quoted by a major bank. Purchases and sales of securities, income, and expenses are translated into U.S. dollars at the prevailing exchange rate on the respective date of such transaction. The portion of the results of operations attributable to changes in foreign exchange rates on investments is not bifurcated from the portion attributable to changes in market prices. The effect of changes in foreign currency exchange rates on realized and unrealized security gains and losses is reflected as a component of security gains and losses.
class accounting Shareholder servicing, prospectus, and shareholder report expenses incurred by each class are charged directly to the class to which they relate. Expenses common to both classes, investment income, and realized and unrealized gains and losses are allocated to the classes based upon the relative daily net assets of each class. To the extent any expenses are waived or reimbursed in accordance with an expense limitation (see Note 6), the waiver or reimbursement is charged to the applicable class or allocated across the classes in the same manner as the related expense.
Rebates Subject to best execution, the fund may direct certain security trades to brokers who have agreed to rebate a portion of the related brokerage commission to the fund in cash. Commission rebates are reflected as realized gain on securities in the accompanying financial statements and totaled $179,000 for the year ended December 31, 2017.
In-kind Redemptions In accordance with guidelines described in the fund’s prospectus, and when considered to be in the best interest of all shareholders, the fund may distribute portfolio securities rather than cash as payment for a redemption of fund shares (in-kind redemption). Gains and losses realized on in-kind redemptions are not recognized for tax purposes and are reclassified from undistributed realized gain (loss) to paid-in capital. During the year ended December 31, 2017, the fund realized $161,068,000 of net gain on $294,610,000 of in-kind redemptions.
Proof #4
55
T. Rowe Price New Horizons Fund
New accounting Guidance In March 2017, the FASB issued amended guidance to shorten the amortization period for certain callable debt securities, held at a premium. The guidance is effective for fiscal years and interim periods beginning after December 15, 2018. Adoption will have no effect on the fund’s net assets or results of operations.
On August 1, 2017, the fund implemented amendments to Regulation S-X, issued by the Securities and Exchange Commission, which require standardized, enhanced disclosures, particularly related to derivatives, in investment company financial statements. Adoption had no effect on the fund’s net assets or results of operations.
Indemnification In the normal course of business, the fund may provide indemnification in connection with its officers and directors, service providers, and/or private company investments. The fund’s maximum exposure under these arrangements is unknown; however, the risk of material loss is currently considered to be remote.
NOTE 2 - vaLuaTION
The fund’s financial instruments are valued and each class’s net asset value (NAV) per share is computed at the close of the New York Stock Exchange (NYSE), normally 4 p.m. ET, each day the NYSE is open for business. However, the NAV per share may be calculated at a time other than the normal close of the NYSE if trading on the NYSE is restricted, if the NYSE closes earlier, or as may be permitted by the SEC.
fair value The fund’s financial instruments are reported at fair value, which GAAP defines as the price that would be received to sell an asset or paid to transfer a liability in an orderly transaction between market participants at the measurement date. The T. Rowe Price Valuation Committee (the Valuation Committee) is an internal committee that has been delegated certain responsibilities by the fund’s Board of Directors (the Board) to ensure that financial instruments are appropriately priced at fair value in accordance with GAAP and the 1940 Act. Subject to oversight by the Board, the Valuation Committee develops and oversees pricing-related policies and procedures and approves all fair value determinations. Specifically, the
Proof #4
56
T. Rowe Price New Horizons Fund
Valuation Committee establishes procedures to value securities; determines pricing techniques, sources, and persons eligible to effect fair value pricing actions; oversees the selection, services, and performance of pricing vendors; oversees valuation-related business continuity practices; and provides guidance on internal controls and valuation-related matters. The Valuation Committee reports to the Board and has representation from legal, portfolio management and trading, operations, risk management, and the fund’s treasurer.
Various valuation techniques and inputs are used to determine the fair value of financial instruments. GAAP establishes the following fair value hierarchy that categorizes the inputs used to measure fair value:
Level 1 – quoted prices (unadjusted) in active markets for identical financial instruments that the fund can access at the reporting date
Level 2 – inputs other than Level 1 quoted prices that are observable, either directly or indirectly (including, but not limited to, quoted prices for similar financial instruments in active markets, quoted prices for identical or similar financial instruments in inactive markets, interest rates and yield curves, implied volatilities, and credit spreads)
Level 3 – unobservable inputs
Observable inputs are developed using market data, such as publicly available information about actual events or transactions, and reflect the assumptions that market participants would use to price the financial instrument. Unobservable inputs are those for which market data are not available and are developed using the best information available about the assumptions that market participants would use to price the financial instrument. GAAP requires valuation techniques to maximize the use of relevant observable inputs and minimize the use of unobservable inputs. When multiple inputs are used to derive fair value, the financial instrument is assigned to the level within the fair value hierarchy based on the lowest-level input that is significant to the fair value of the financial instrument. Input levels are not necessarily an indication of the risk or liquidity associated with financial instruments at that level but rather the degree of judgment used in determining those values.
Proof #4
57
T. Rowe Price New Horizons Fund
valuation Techniques Equity securities listed or regularly traded on a securities exchange or in the over-the-counter (OTC) market are valued at the last quoted sale price or, for certain markets, the official closing price at the time the valuations are made. OTC Bulletin Board securities are valued at the mean of the closing bid and asked prices. A security that is listed or traded on more than one exchange is valued at the quotation on the exchange determined to be the primary market for such security. Listed securities not traded on a particular day are valued at the mean of the closing bid and asked prices for domestic securities and the last quoted sale or closing price for international securities.
For valuation purposes, the last quoted prices of non-U.S. equity securities may be adjusted to reflect the fair value of such securities at the close of the NYSE. If the fund determines that developments between the close of a foreign market and the close of the NYSE will affect the value of some or all of its portfolio securities, the fund will adjust the previous quoted prices to reflect what it believes to be the fair value of the securities as of the close of the NYSE. In deciding whether it is necessary to adjust quoted prices to reflect fair value, the fund reviews a variety of factors, including developments in foreign markets, the performance of U.S. securities markets, and the performance of instruments trading in U.S. markets that represent foreign securities and baskets of foreign securities. The fund may also fair value securities in other situations, such as when a particular foreign market is closed but the fund is open. The fund uses outside pricing services to provide it with quoted prices and information to evaluate or adjust those prices. The fund cannot predict how often it will use quoted prices and how often it will determine it necessary to adjust those prices to reflect fair value. As a means of evaluating its security valuation process, the fund routinely compares quoted prices, the next day’s opening prices in the same markets, and adjusted prices.
Actively traded equity securities listed on a domestic exchange generally are categorized in Level 1 of the fair value hierarchy. Non-U.S. equity securities generally are categorized in Level 2 of the fair value hierarchy despite the availability of quoted prices because, as described above, the fund evaluates and determines whether those quoted prices reflect fair value at the close of the NYSE or require adjustment. OTC Bulletin Board securities, certain preferred securities, and equity securities traded in inactive markets generally are categorized in Level 2 of the fair value hierarchy.
Proof #4
58
T. Rowe Price New Horizons Fund
Debt securities generally are traded in the OTC market. Securities with remaining maturities of one year or more at the time of acquisition are valued at prices furnished by dealers who make markets in such securities or by an independent pricing service, which considers the yield or price of bonds of comparable quality, coupon, maturity, and type, as well as prices quoted by dealers who make markets in such securities. Generally, debt securities are categorized in Level 2 of the fair value hierarchy; however, to the extent the valuations include significant unobservable inputs, the securities would be categorized in Level 3.
Investments in mutual funds are valued at the mutual fund’s closing NAV per share on the day of valuation and are categorized in Level 1 of the fair value hierarchy. Assets and liabilities other than financial instruments, including short-term receivables and payables, are carried at cost, or estimated realizable value, if less, which approximates fair value.
Thinly traded financial instruments and those for which the above valuation procedures are inappropriate or are deemed not to reflect fair value are stated at fair value as determined in good faith by the Valuation Committee. The objective of any fair value pricing determination is to arrive at a price that could reasonably be expected from a current sale. Financial instruments fair valued by the Valuation Committee are primarily private placements, restricted securities, warrants, rights, and other securities that are not publicly traded.
Subject to oversight by the Board, the Valuation Committee regularly makes good faith judgments to establish and adjust the fair valuations of certain securities as events occur and circumstances warrant. For instance, in determining the fair value of an equity investment with limited market activity, such as a private placement or a thinly traded public company stock, the Valuation Committee considers a variety of factors, which may include, but are not limited to, the issuer’s business prospects, its financial standing and performance, recent investment transactions in the issuer, new rounds of financing, negotiated transactions of significant size between other investors in the company, relevant market valuations of peer companies, strategic events affecting the company, market liquidity for the issuer, and general economic conditions and events. In consultation with the investment and pricing teams, the Valuation Committee will determine an appropriate valuation technique based on available information, which may include both observable and unobservable inputs. The Valuation Committee typically will afford greatest
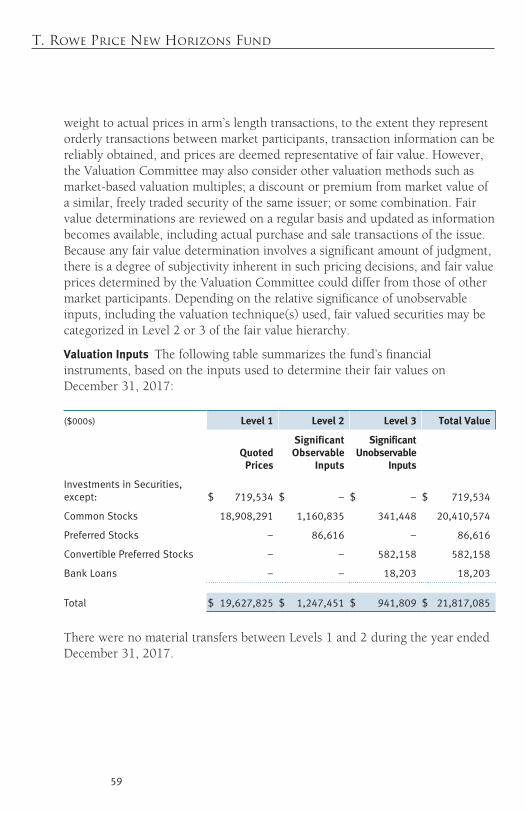
Proof #4
59
T. Rowe Price New Horizons Fund
weight to actual prices in arm’s length transactions, to the extent they represent orderly transactions between market participants, transaction information can be reliably obtained, and prices are deemed representative of fair value. However, the Valuation Committee may also consider other valuation methods such as market-based valuation multiples; a discount or premium from market value of a similar, freely traded security of the same issuer; or some combination. Fair value determinations are reviewed on a regular basis and updated as information becomes available, including actual purchase and sale transactions of the issue. Because any fair value determination involves a significant amount of judgment, there is a degree of subjectivity inherent in such pricing decisions, and fair value prices determined by the Valuation Committee could differ from those of other market participants. Depending on the relative significance of unobservable inputs, including the valuation technique(s) used, fair valued securities may be categorized in Level 2 or 3 of the fair value hierarchy.
valuation Inputs The following table summarizes the fund’s financial instruments, based on the inputs used to determine their fair values on December 31, 2017:
($000s) Level 1 Level 2 Level 3 Total value
Quoted Prices
Significant Observable
Inputs
Significant unobservable
Inputs
InvestmentsinSecurities,except: $ 719,534 $ – $ – $ 719,534
CommonStocks 18,908,291 1,160,835 341,448 20,410,574
PreferredStocks – 86,616 – 86,616
ConvertiblePreferredStocks – – 582,158 582,158
BankLoans – – 18,203 18,203
Total $ 19,627,825 $ 1,247,451 $ 941,809 $ 21,817,085
There were no material transfers between Levels 1 and 2 during the year ended December 31, 2017.
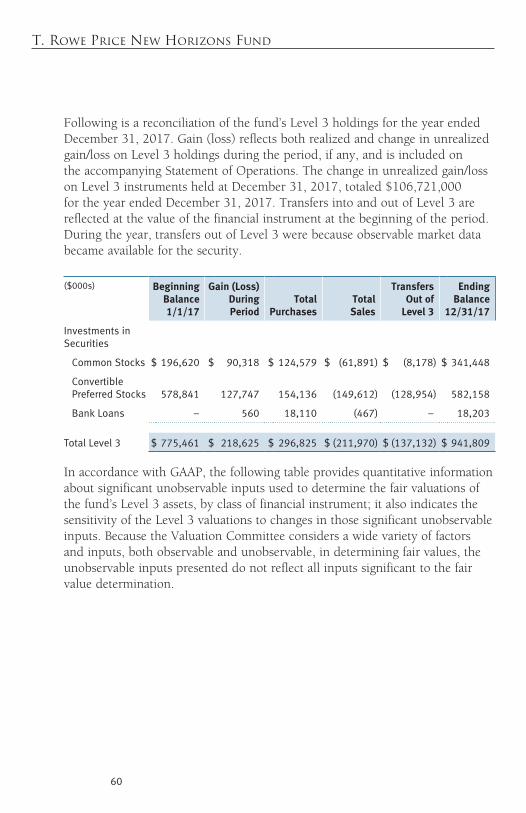
Proof #4
60
T. Rowe Price New Horizons Fund
Following is a reconciliation of the fund’s Level 3 holdings for the year ended December 31, 2017. Gain (loss) reflects both realized and change in unrealized gain/loss on Level 3 holdings during the period, if any, and is included on the accompanying Statement of Operations. The change in unrealized gain/loss on Level 3 instruments held at December 31, 2017, totaled $106,721,000 for the year ended December 31, 2017. Transfers into and out of Level 3 are reflected at the value of the financial instrument at the beginning of the period. During the year, transfers out of Level 3 were because observable market data became available for the security.
($000s) Beginning Balance 1/1/17
Gain (Loss) During Period
Total Purchases
Total Sales
Transfers Out of
Level 3
Ending Balance
12/31/17
InvestmentsinSecurities
CommonStocks $ 196,620 $ 90,318 $ 124,579 $ (61,891) $ (8,178) $ 341,448
ConvertiblePreferredStocks 578,841 127,747 154,136 (149,612) (128,954) 582,158
BankLoans – 560 18,110 (467) – 18,203
TotalLevel3 $ 775,461 $ 218,625 $ 296,825 $ (211,970) $ (137,132) $ 941,809
In accordance with GAAP, the following table provides quantitative information about significant unobservable inputs used to determine the fair valuations of the fund’s Level 3 assets, by class of financial instrument; it also indicates the sensitivity of the Level 3 valuations to changes in those significant unobservable inputs. Because the Valuation Committee considers a wide variety of factors and inputs, both observable and unobservable, in determining fair values, the unobservable inputs presented do not reflect all inputs significant to the fair value determination.
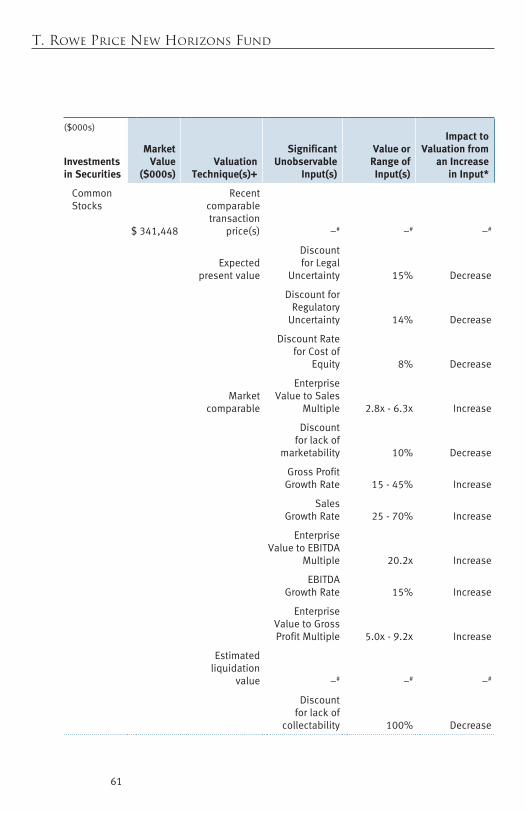
Proof #4
61
T. Rowe Price New Horizons Fund
($000s)
Investments in Securities
market value
($000s)valuation
Technique(s)+
Significant unobservable
Input(s)
value or Range of Input(s)
Impact to valuation from
an Increase in Input*
CommonStocks
$ 341,448
Recentcomparabletransaction
price(s) –# –# –#
Expected
presentvalue
DiscountforLegal
Uncertainty 15% Decrease
DiscountforRegulatory
Uncertainty 14% Decrease
DiscountRateforCostof
Equity 8% Decrease
Market
comparable
EnterpriseValuetoSales
Multiple 2.8x-6.3x Increase
Discountforlackof
marketability 10% Decrease
GrossProfitGrowthRate 15-45% Increase
SalesGrowthRate 25-70% Increase
EnterpriseValuetoEBITDA
Multiple 20.2x Increase
EBITDAGrowthRate 15% Increase
EnterpriseValuetoGrossProfitMultiple 5.0x-9.2x Increase
Estimatedliquidation
value –# –# –#
Discountforlackof
collectability 100% Decrease
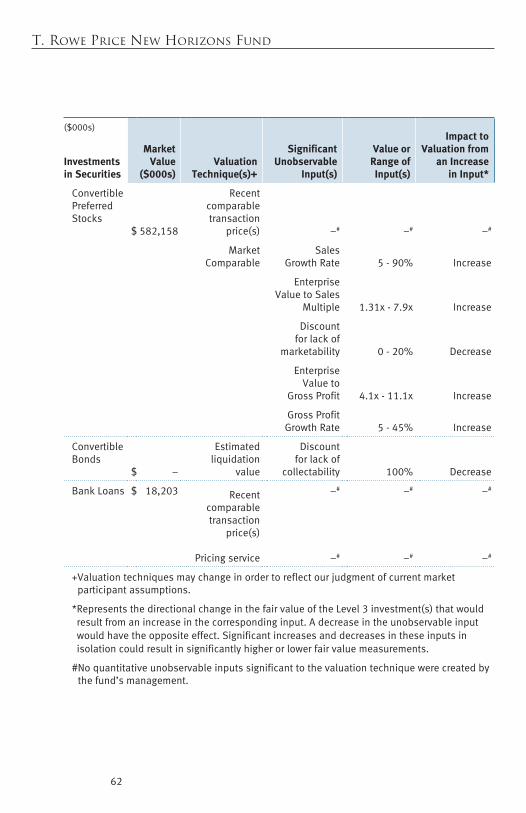
Proof #4
62
T. Rowe Price New Horizons Fund
($000s)
Investments in Securities
market value
($000s)valuation
Technique(s)+
Significant unobservable
Input(s)
value or Range of Input(s)
Impact to valuation from
an Increase in Input*
ConvertiblePreferredStocks
$ 582,158
Recentcomparabletransaction
price(s) –# –# –#
MarketComparable
SalesGrowthRate 5-90% Increase
EnterpriseValuetoSales
Multiple 1.31x-7.9x Increase
Discountforlackof
marketability 0-20% Decrease
EnterpriseValueto
GrossProfit 4.1x-11.1x Increase
GrossProfitGrowthRate 5-45% Increase
ConvertibleBonds
$ –
Estimatedliquidation
value
Discountforlackof
collectability 100% Decrease
BankLoans $ 18,203 Recentcomparabletransaction
price(s)
Pricingservice
–#
–#
–#
–#
–#
–#
+Valuationtechniquesmaychangeinordertoreflectourjudgmentofcurrentmarketparticipantassumptions.
*RepresentsthedirectionalchangeinthefairvalueoftheLevel3investment(s)thatwouldresultfromanincreaseinthecorrespondinginput.Adecreaseintheunobservableinputwouldhavetheoppositeeffect.Significantincreasesanddecreasesintheseinputsinisolationcouldresultinsignificantlyhigherorlowerfairvaluemeasurements.
#Noquantitativeunobservableinputssignificanttothevaluationtechniquewerecreatedbythefund’smanagement.
Proof #4
63
T. Rowe Price New Horizons Fund
NOTE 3 - DERIvaTIvE INSTRumENTS
During the year ended December 31, 2017, the fund invested in derivative instruments. As defined by GAAP, a derivative is a financial instrument whose value is derived from an underlying security price, foreign exchange rate, interest rate, index of prices or rates, or other variable; it requires little or no initial investment and permits or requires net settlement. The fund invests in derivatives only if the expected risks and rewards are consistent with its investment objectives, policies, and overall risk profile, as described in its prospectus and Statement of Additional Information. The fund may use derivatives for a variety of purposes, such as seeking to hedge against declines in principal value, increase yield, invest in an asset with greater efficiency and at a lower cost than is possible through direct investment, or to adjust credit exposure. The risks associated with the use of derivatives are different from, and potentially much greater than, the risks associated with investing directly in the instruments on which the derivatives are based. The fund at all times maintains sufficient cash reserves, liquid assets, or other SEC-permitted asset types to cover its settlement obligations under open derivative contracts.
The fund values its derivatives at fair value and recognizes changes in fair value currently in its results of operations. Accordingly, the fund does not follow hedge accounting, even for derivatives employed as economic hedges. Generally, the fund accounts for its derivatives on a gross basis. It does not offset the fair value of derivative liabilities against the fair value of derivative assets on its financial statements, nor does it offset the fair value of derivative instruments against the right to reclaim or obligation to return collateral. As of December 31, 2017, the fund held no derivative instruments.
Additionally, during the year ended December 31, 2017, the fund recognized $55,921,000 of realized gain on Futures and a $4,550,000 change in unrealized gain/loss on Futures related to its investments in equity derivatives; such amounts are included on the accompanying Statement of Operations.
futures contracts The fund is subject to equity price risk in the normal course of pursuing its investment objectives and uses futures contracts to help manage such risk. The fund may enter into futures contracts to manage exposure to interest rates, security prices, foreign currencies, and credit quality; as an efficient means of adjusting exposure to all or part of a target market; to enhance income; as a cash management tool; or to adjust credit exposure. A futures contract provides for the future sale by one party and purchase by another of a specified amount of a specific underlying financial instrument at
Proof #4
64
T. Rowe Price New Horizons Fund
an agreed-upon price, date, time, and place. The fund currently invests only in exchange-traded futures, which generally are standardized as to maturity date, underlying financial instrument, and other contract terms. Payments are made or received by the fund each day to settle daily fluctuations in the value of the contract (variation margin), which reflect changes in the value of the underlying financial instrument. Variation margin is recorded as unrealized gain or loss until the contract is closed. The value of a futures contract included in net assets is the amount of unsettled variation margin; net variation margin receivable is reflected as an asset and net variation margin payable is reflected as a liability on the accompanying Statement of Assets and Liabilities. Risks related to the use of futures contracts include possible illiquidity of the futures markets, contract prices that can be highly volatile and imperfectly correlated to movements in hedged security values, and potential losses in excess of the fund’s initial investment. During the year ended December 31, 2017, the volume of the fund’s activity in futures, based on underlying notional amounts, was generally between 0% and 4% of net assets.
NOTE 4 - OTHER INvESTmENT TRaNSacTIONS
Consistent with its investment objective, the fund engages in the following practices to manage exposure to certain risks and/or to enhance performance. The investment objective, policies, program, and risk factors of the fund are described more fully in the fund’s prospectus and Statement of Additional Information.
Restricted Securities The fund may invest in securities that are subject to legal or contractual restrictions on resale. Prompt sale of such securities at an acceptable price may be difficult and may involve substantial delays and additional costs.
Bank Loans The fund may invest in bank loans, which represent an interest in amounts owed by a borrower to a syndicate of lenders. Bank loans are generally noninvestment grade and often involve borrowers whose financial condition is highly leveraged. Bank loans may be in the form of either assignments or participations. A loan assignment transfers all legal, beneficial, and economic rights to the buyer, and transfer typically requires consent of both the borrower and agent. In contrast, a loan participation generally entitles the buyer to receive
Proof #4
65
T. Rowe Price New Horizons Fund
the cash flows from principal, interest, and any fee payments on a portion of a loan; however, the seller continues to hold legal title to that portion of the loan. As a result, the buyer of a loan participation generally has no direct recourse against the borrower and is exposed to credit risk of both the borrower and seller of the participation. Bank loans often have extended settlement periods, generally may be repaid at any time at the option of the borrower, and may require additional principal to be funded at the borrowers’ discretion at a later date (e.g., unfunded commitments and revolving debt instruments). Until settlement, the fund maintains liquid assets sufficient to settle its unfunded loan commitments. The fund reflects both the funded portion of a bank loan as well as its unfunded commitment in the Portfolio of Investments. However, if a credit agreement provides no initial funding of a tranche, and funding of the full commitment at a future date(s) is at the borrower’s discretion and considered uncertain, a loan is reflected in the Portfolio of Investments only if, and only to the extent that, the fund has actually settled a funding commitment.
Other Purchases and sales of portfolio securities other than short-term securities aggregated $7,378,142,000 and $7,586,161,000, respectively, for the year ended December 31, 2017.
NOTE 5 - fEDERaL INcOmE TaxES
No provision for federal income taxes is required since the fund intends to continue to qualify as a regulated investment company under Subchapter M of the Internal Revenue Code and distribute to shareholders all of its taxable income and gains. Distributions determined in accordance with federal income tax regulations may differ in amount or character from net investment income and realized gains for financial reporting purposes. Financial reporting records are adjusted for permanent book/tax differences to reflect tax character but are not adjusted for temporary differences.
The fund files U.S. federal, state, and local tax returns as required. The fund’s tax returns are subject to examination by the relevant tax authorities until expiration of the applicable statute of limitations, which is generally three years after the filing of the tax return but which can be extended to six years in certain circumstances. Tax returns for open years have incorporated no uncertain tax positions that require a provision for income taxes.
Proof #4
66
T. Rowe Price New Horizons Fund
Reclassifications to paid-in capital relate primarily to redemptions in kind or a tax practice that treats a portion of the proceeds from each redemption of capital shares as a distribution of taxable net investment income or realized capital gain. Reclassifications between income and gain relate primarily to the offset of the current net operating loss against realized gains. For the year ended December 31, 2017, the following reclassifications were recorded to reflect tax character (there was no impact on results of operations or net assets):
Undistributednetinvestmentincome $ 54,516
Undistributednetrealizedgain (345,727)
Paid-incapital 291,211
($000s)
Distributions during the years ended December 31, 2017 and December 31, 2016, were characterized for tax purposes as follows:
($000s)
December 312017 2016
Ordinaryincome $ 389,026 $ 61,695
Long-termcapitalgain 1,305,356 864,321
Totaldistributions $ 1,694,382 $ 926,016
At December 31, 2017, the tax-basis cost of investments, including derivatives, and components of net assets were as follows:
Costofinvestments $ 14,271,599
Unrealizedappreciation $ 7,854,886
Unrealizeddepreciation (309,998)
Netunrealizedappreciation(depreciation) 7,544,888
Undistributedordinaryincome 105,096
Undistributedlong-termcapitalgain 648,539
Paid-incapital 13,621,975
Netassets $ 21,920,498
($000s)
Proof #4
67
T. Rowe Price New Horizons Fund
The difference between book-basis and tax-basis net unrealized appreciation (depreciation) is attributable to the deferral of losses from wash sales and the realization of gains/losses on passive foreign investment companies for tax purposes.
NOTE 6 - RELaTED PaRTy TRaNSacTIONS
The fund is managed by T. Rowe Price Associates, Inc. (Price Associates), a wholly owned subsidiary of T. Rowe Price Group, Inc. (Price Group). The investment management agreement between the fund and Price Associates provides for an annual investment management fee, which is computed daily and paid monthly. The fee consists of an individual fund fee, equal to 0.35% of the fund’s average daily net assets, and a group fee. The group fee rate is calculated based on the combined net assets of certain mutual funds sponsored by Price Associates (the group) applied to a graduated fee schedule, with rates ranging from 0.48% for the first $1 billion of assets to 0.265% for assets in excess of $650 billion. The fund’s group fee is determined by applying the group fee rate to the fund’s average daily net assets. At December 31, 2017, the effective annual group fee rate was 0.29%.
The I Class is subject to an operating expense limitation (I Class limit) pursuant to which Price Associates is contractually required to pay all operating expenses of the I Class, excluding management fees, interest, expenses related to borrowings, taxes, brokerage, and other non-recurring expenses permitted by the investment management agreement, to the extent such operating expenses, on an annualized basis, exceed 0.05% of average net assets. This agreement will continue until April 30, 2018, and may be renewed, revised, or revoked only with approval of the fund’s Board. The I Class is required to repay Price Associates for expenses previously paid to the extent the class’s net assets grow or expenses decline sufficiently to allow repayment without causing the class’s operating expenses (after the repayment is taken into account) to exceed both: (1) the expense limitation in place at the time such amounts were paid; and (2) the class’s current expense limitation. However, no repayment will be made more than three years after the date of a payment or waiver. For the year ended December 31, 2017, the I Class operated below its expense limitation.
Proof #4
68
T. Rowe Price New Horizons Fund
In addition, the fund has entered into service agreements with Price Associates and two wholly owned subsidiaries of Price Associates (collectively, Price). Price Associates provides certain accounting and administrative services to the fund. T. Rowe Price Services, Inc. provides shareholder and administrative services in its capacity as the fund’s transfer and dividend-disbursing agent. T. Rowe Price Retirement Plan Services, Inc. provides subaccounting and recordkeeping services for certain retirement accounts invested in the Investor Class and I Class. For the year ended December 31, 2017, expenses incurred pursuant to these service agreements were $86,000 for Price Associates; $2,876,000 for T. Rowe Price Services, Inc.; and $4,225,000 for T. Rowe Price Retirement Plan Services, Inc. The total amount payable at period-end pursuant to these service agreements is reflected as Due to Affiliates in the accompanying financial statements.
Additionally, the fund is one of several mutual funds in which certain college savings plans managed by Price Associates may invest. As approved by the fund’s Board of Directors, shareholder servicing costs associated with each college savings plan are borne by the fund in proportion to the average daily value of its shares owned by the college savings plan. For the year ended December 31, 2017, the fund was charged $287,000 for shareholder servicing costs related to the college savings plans, of which $187,000 was for services provided by Price. The amount payable at period-end pursuant to this agreement is reflected as Due to Affiliates in the accompanying financial statements. At December 31, 2017, less than 1% of the outstanding shares of the Investor Class were held by college savings plans.
The fund is also one of several mutual funds sponsored by Price Associates (underlying Price funds) in which the T. Rowe Price Spectrum Funds (Spectrum Funds) and T. Rowe Price Retirement Funds (Retirement Funds) may invest. None of the Spectrum Funds or Retirement Funds invest in the underlying Price funds for the purpose of exercising management or control. Pursuant to special servicing agreements, expenses associated with the operation of the Spectrum Funds and Retirement Funds are borne by each underlying Price fund to the extent of estimated savings to it and in proportion to the average daily value of its shares owned by the Spectrum Funds and Retirement Funds. Expenses allocated under these special servicing agreements are reflected as shareholder servicing expense in the accompanying financial statements. For the year ended December 31, 2017, the fund was allocated $113,000 of Spectrum Funds’ expenses and $4,301,000 of Retirement Funds’ expenses. Of these amounts,
Proof #4
69
T. Rowe Price New Horizons Fund
$1,627,000 related to services provided by Price. At period-end, the amount payable to Price pursuant to these special servicing agreements is reflected as Due to Affiliates in the accompanying financial statements. At December 31, 2017, approximately 17% of the outstanding shares of the Investor Class were held by the Spectrum Funds and Retirement Funds.
In addition, other mutual funds, trusts, and other accounts managed by Price Associates or its affiliates (collectively, Price funds and accounts) may invest in the fund and are not subject to the special servicing agreements disclosed above. No Price fund or account may invest for the purpose of exercising management or control over the fund. At December 31, 2017, approximately 10% of the I Class’s outstanding shares were held by Price funds and accounts.
The fund may invest its cash reserves in certain open-end management investment companies managed by Price Associates and considered affiliates of the fund: the T. Rowe Price Government Reserve Fund or the T. Rowe Price Treasury Reserve Fund, organized as money market funds, or the T. Rowe Price Short-Term Fund, a short-term bond fund (collectively, the Price Reserve Funds). The Price Reserve Funds are offered as short-term investment options to mutual funds, trusts, and other accounts managed by Price Associates or its affiliates and are not available for direct purchase by members of the public. Cash collateral from securities lending is invested in the T. Rowe Price Short-Term Fund. The Price Reserve Funds pay no investment management fees.
The fund may participate in securities purchase and sale transactions with other funds or accounts advised by Price Associates (cross trades), in accordance with procedures adopted by the fund’s Board and Securities and Exchange Commission rules, which require, among other things, that such purchase and sale cross trades be effected at the independent current market price of the security. During the year ended December 31, 2017, the aggregate value of purchases and sales cross trades with other funds or accounts advised by Price Associates was less than 1% of the fund’s net assets as of December 31, 2017.
Proof #4
70
T. Rowe Price New Horizons Fund
Report of Independent Registered Public Accounting Firm
To the Board of Directors and Shareholders of T. Rowe Price New Horizons fund, Inc.
Opinion on the Financial Statements
We have audited the accompanying statement of assets and liabilities, including the portfolio of investments, of T. Rowe Price New Horizons Fund, Inc. (the “Fund”) as of December 31, 2017, the related statement of operations for the year ended December 31, 2017, the statement of changes in net assets for each of the two years in the period ended December 31, 2017, including the related notes, and the financial highlights for each of the periods indicated therein (collectively referred to as the “financial statements”). In our opinion, the financial statements present fairly, in all material respects, the financial position of the Fund as of December 31, 2017, the results of its operations for the year then ended, the changes in its net assets for each of the two years in the period ended December 31, 2017 and the financial highlights for each of the periods indicated therein, in conformity with accounting principles generally accepted in the United States of America.
Basis for Opinion
These financial statements are the responsibility of the Fund’s management. Our responsibility is to express an opinion on the Fund’s financial statements based on our audits. We are a public accounting firm registered with the Public Company Accounting Oversight Board (United States) (“PCAOB”) and are required to be independent with respect to the Fund in accordance with the U.S. federal securities laws and the applicable rules and regulations of the Securities and Exchange Commission and the PCAOB.
We conducted our audits of these financial statements in accordance with the standards of the PCAOB. Those standards require that we plan and perform the audit to obtain reasonable assurance about whether the financial statements are free of material misstatement, whether due to error or fraud.
Proof #4
71
T. Rowe Price New Horizons Fund
Report of Independent Registered Public Accounting Firm (continued)
Our audits included performing procedures to assess the risks of material misstatement of the financial statements, whether due to error or fraud, and performing procedures that respond to those risks. Such procedures included examining, on a test basis, evidence regarding the amounts and disclosures in the financial statements. Our audits also included evaluating the accounting principles used and significant estimates made by management, as well as evaluating the overall presentation of the financial statements. Our procedures included confirmation of securities owned as of December 31, 2017 by correspondence with the custodians, transfer agent and brokers; when replies were not received from brokers, we performed other auditing procedures. We believe that our audits provide a reasonable basis for our opinion.
PricewaterhouseCoopers LLP Baltimore, Maryland February 15, 2018
We have served as the auditor of one or more investment companies in the T. Rowe Price group of investment companies since 1973.
Proof #4
72
T. Rowe Price New Horizons Fund
Tax Information (Unaudited) for the Tax Year Ended 12/31/17
WeareprovidingthisinformationasrequiredbytheInternalRevenueCode.Theamountsshownmaydifferfromthoseelsewhereinthisreportbecauseofdifferencesbetweentaxandfinancialreportingrequirements.
Thefund’sdistributionstoshareholdersincluded:
• $418,265,000fromshort-termcapitalgains.
• $1,406,905,000fromlong-termcapitalgains,subjecttoalong-termcapitalgainstaxrateofnotgreaterthan20%.
Fortaxablenon-corporateshareholders,$85,290,000ofthefund’sincomerepresentsqualifieddividendincomesubjecttoalong-termcapitalgainstaxrateofnotgreaterthan20%.
Forcorporateshareholders,$76,338,000ofthefund’sincomequalifiesforthedividends-receiveddeduction.
AdescriptionofthepoliciesandproceduresusedbyT.RowePricefundsandportfoliostodeterminehowtovoteproxiesrelatingtoportfoliosecuritiesisavailableineachfund’sStatementofAdditionalInformation.Youmayrequestthisdocumentbycalling1-800-225-5132orbyaccessingtheSEC’swebsite,sec.gov.
Thedescriptionofourproxyvotingpoliciesandproceduresisalsoavailableonourcorporatewebsite.Toaccessit,pleasevisitthefollowingWebpage:
https://www3.troweprice.com/usis/corporate/en/utility/policies.html
Scrolldowntothesectionnearthebottomofthepagethatsays,“ProxyVotingPolicies.”ClickontheProxyVotingPolicieslinkintheshadedbox.
Eachfund’smostrecentannualproxyvotingrecordisavailableonourwebsiteandthroughtheSEC’swebsite.ToaccessitthroughT.RowePrice,visitthewebsitelocationshownabove,andscrolldowntothesectionnearthebottomofthepagethatsays,“ProxyVotingRecords.”ClickontheProxyVotingRecordslinkintheshadedbox.
Information on Proxy Voting Policies, Procedures, and Records
ThefundfilesacompletescheduleofportfolioholdingswiththeSecuritiesandExchangeCommissionforthefirstandthirdquartersofeachfiscalyearonFormN-Q.Thefund’sFormN-QisavailableelectronicallyontheSEC’swebsite(sec.gov);hardcopiesmaybereviewedandcopiedattheSEC’sPublicReferenceRoom,100FSt.N.E.,Washington,DC20549.FormoreinformationonthePublicReferenceRoom,call1-800-SEC-0330.
How to Obtain Quarterly Portfolio Holdings
Proof #4
73
T. Rowe Price New Horizons Fund
About the Fund’s Directors and Officers
YourfundisoverseenbyaBoardofDirectors(Board)thatmeetsregularlytoreviewawidevarietyofmattersaffectingorpotentiallyaffectingthefund,includingperformance,investmentprograms,compliancematters,advisoryfeesandexpenses,serviceproviders,andbusinessandregulatoryaffairs.TheBoardelectsthefund’sofficers,whoarelistedinthefinaltable.Atleast75%oftheBoard’smembersareindependentofT.RowePriceAssociates,Inc.(T.RowePrice),anditsaffiliates;“inside”or“interested”directorsareemployeesorofficersofT.RowePrice.Thebusinessaddressofeachdirectorandofficeris100EastPrattStreet,Baltimore,Maryland21202.TheStatementofAdditionalInformationincludesadditionalinformationaboutthefunddirectorsandisavailablewithoutchargebycallingaT.RowePricerepresentativeat1-800-638-5660.
Independent Directors
Name(year of Birth)year Elected*[Number of T. Rowe PricePortfolios Overseen]
Principal Occupation(s) and Directorships of Public companies and Other Investment companies During the Past five years
BruceW.Duncan(1951)2013[191]
ChiefExecutiveOfficerandDirector(2009toDecember2016),ChairmanoftheBoard(January2016topresent),andPresident(2009toSeptember2016),FirstIndustrialRealtyTrust,anownerandoperatorofindustrialproperties;ChairmanoftheBoard(2005toSeptember2016)andDirector(1999toSeptember2016),StarwoodHotels&Resorts,ahotelandleisurecompany;Director,BostonProperties(May2016topresent);Director,MarriottInternational,Inc.(September2016topresent)
RobertJ.Gerrard,Jr.(1952)2012[191]
AdvisoryBoardMember,PipelineCrisis/WinningStrategies,acollaborativeworkingtoimproveopportunitiesforyoungAfricanAmericans(1997topresent)
PaulF.McBride(1956)2013[191]
AdvisoryBoardMember,VizziaTechnologies(2015topresent)
*Eachindependentdirectorservesuntilretirement,resignation,orelectionofasuccessor.
Proof #4
74
T. Rowe Price New Horizons Fund
Independent Directors (continued)
Name(year of Birth)year Elected*[Number of T. Rowe PricePortfolios Overseen]
Principal Occupation(s) and Directorships of Public companies and Other Investment companies During the Past five years
CeciliaE.Rouse,Ph.D.(1963)2012[191]
Dean,WoodrowWilsonSchool(2012topresent);ProfessorandResearcher,PrincetonUniversity(1992topresent);MemberofNationalAcademyofEducation(2010topresent);Director,MDRC,anonprofiteducationandsocialpolicyresearchorganization(2011topresent);ResearchAssociateofLaborStudiesProgram(2011to2015)andBoardMember(2015topresent),NationalBureauofEconomicResearch(2011topresent);ChairofCommitteeontheStatusofMinorityGroupsintheEconomicProfession(2012topresent);VicePresident(2015topresent),AmericanEconomicAssociation
JohnG.Schreiber(1946)2001[191]
Owner/President,CentaurCapitalPartners,Inc.,arealestateinvestmentcompany(1991topresent);Cofounder,Partner,andCochairmanoftheInvestmentCommittee,BlackstoneRealEstateAdvisors,L.P.(1992to2015);Director,GeneralGrowthProperties,Inc.(2010to2013);Director,BlackstoneMortgageTrust,arealestatefinancecompany(2012to2016);DirectorandChairmanoftheBoard,BrixmorPropertyGroup,Inc.(2013topresent);Director,HiltonWorldwide(2013topresent);Director,HudsonPacificProperties(2014to2016)
MarkR.Tercek(1957)2009[191]
PresidentandChiefExecutiveOfficer,TheNatureConservancy(2008topresent)
*Eachindependentdirectorservesuntilretirement,resignation,orelectionofasuccessor.
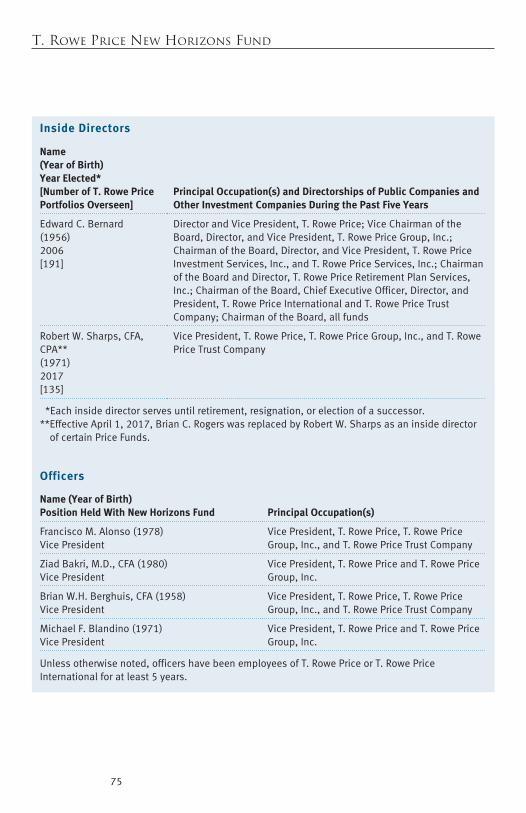
Proof #4
75
T. Rowe Price New Horizons Fund
Inside Directors
Name(year of Birth)year Elected*[Number of T. Rowe Price Portfolios Overseen]
Principal Occupation(s) and Directorships of Public companies and Other Investment companies During the Past five years
EdwardC.Bernard(1956)2006[191]
DirectorandVicePresident,T.RowePrice;ViceChairmanoftheBoard,Director,andVicePresident,T.RowePriceGroup,Inc.;ChairmanoftheBoard,Director,andVicePresident,T.RowePriceInvestmentServices,Inc.,andT.RowePriceServices,Inc.;ChairmanoftheBoardandDirector,T.RowePriceRetirementPlanServices,Inc.;ChairmanoftheBoard,ChiefExecutiveOfficer,Director,andPresident,T.RowePriceInternationalandT.RowePriceTrustCompany;ChairmanoftheBoard,allfunds
RobertW.Sharps,CFA,CPA**(1971)2017[135]
VicePresident,T.RowePrice,T.RowePriceGroup,Inc.,andT.RowePriceTrustCompany
*Eachinsidedirectorservesuntilretirement,resignation,orelectionofasuccessor.**EffectiveApril1,2017,BrianC.RogerswasreplacedbyRobertW.Sharpsasaninsidedirector
ofcertainPriceFunds.
Officers
Name (year of Birth)Position Held With New Horizons fund Principal Occupation(s)
FranciscoM.Alonso(1978)VicePresident
VicePresident,T.RowePrice,T.RowePriceGroup,Inc.,andT.RowePriceTrustCompany
ZiadBakri,M.D.,CFA(1980)VicePresident
VicePresident,T.RowePriceandT.RowePriceGroup,Inc.
BrianW.H.Berghuis,CFA(1958)VicePresident
VicePresident,T.RowePrice,T.RowePriceGroup,Inc.,andT.RowePriceTrustCompany
MichaelF.Blandino(1971)VicePresident
VicePresident,T.RowePriceandT.RowePriceGroup,Inc.
Unlessotherwisenoted,officershavebeenemployeesofT.RowePriceorT.RowePriceInternationalforatleast5years.
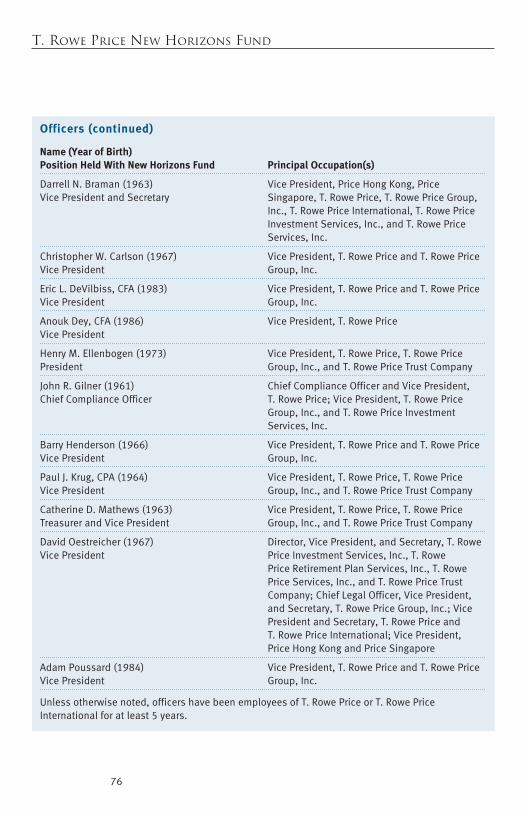
Proof #4
76
T. Rowe Price New Horizons Fund
Officers (continued)
Name (year of Birth)Position Held With New Horizons fund Principal Occupation(s)
DarrellN.Braman(1963)VicePresidentandSecretary
VicePresident,PriceHongKong,PriceSingapore,T.RowePrice,T.RowePriceGroup,Inc.,T.RowePriceInternational,T.RowePriceInvestmentServices,Inc.,andT.RowePriceServices,Inc.
ChristopherW.Carlson(1967)VicePresident
VicePresident,T.RowePriceandT.RowePriceGroup,Inc.
EricL.DeVilbiss,CFA(1983)VicePresident
VicePresident,T.RowePriceandT.RowePriceGroup,Inc.
AnoukDey,CFA(1986)VicePresident
VicePresident,T.RowePrice
HenryM.Ellenbogen(1973)President
VicePresident,T.RowePrice,T.RowePriceGroup,Inc.,andT.RowePriceTrustCompany
JohnR.Gilner(1961)ChiefComplianceOfficer
ChiefComplianceOfficerandVicePresident,T.RowePrice;VicePresident,T.RowePriceGroup,Inc.,andT.RowePriceInvestmentServices,Inc.
BarryHenderson(1966)VicePresident
VicePresident,T.RowePriceandT.RowePriceGroup,Inc.
PaulJ.Krug,CPA(1964)VicePresident
VicePresident,T.RowePrice,T.RowePriceGroup,Inc.,andT.RowePriceTrustCompany
CatherineD.Mathews(1963)TreasurerandVicePresident
VicePresident,T.RowePrice,T.RowePriceGroup,Inc.,andT.RowePriceTrustCompany
DavidOestreicher(1967)VicePresident
Director,VicePresident,andSecretary,T.RowePriceInvestmentServices,Inc.,T.RowePriceRetirementPlanServices,Inc.,T.RowePriceServices,Inc.,andT.RowePriceTrustCompany;ChiefLegalOfficer,VicePresident,andSecretary,T.RowePriceGroup,Inc.;VicePresidentandSecretary,T.RowePriceandT.RowePriceInternational;VicePresident,PriceHongKongandPriceSingapore
AdamPoussard(1984)VicePresident
VicePresident,T.RowePriceandT.RowePriceGroup,Inc.
Unlessotherwisenoted,officershavebeenemployeesofT.RowePriceorT.RowePriceInternationalforatleast5years.
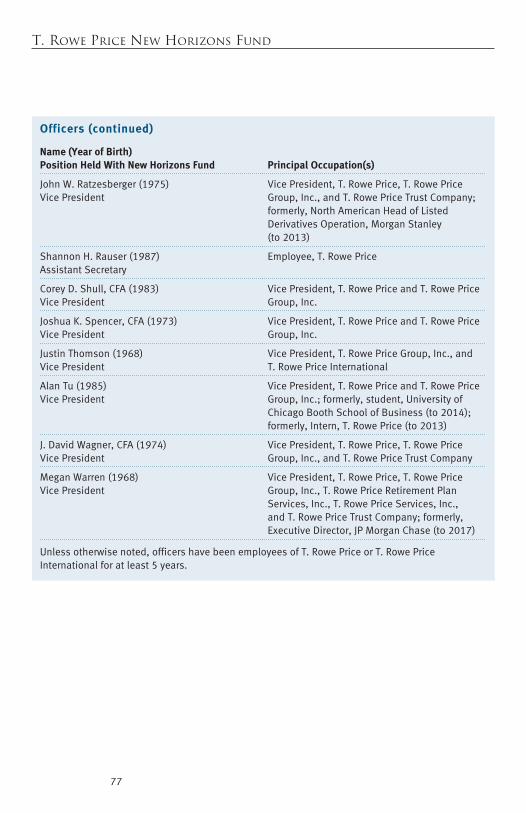
Proof #4
77
T. Rowe Price New Horizons Fund
Officers (continued)
Name (year of Birth)Position Held With New Horizons fund Principal Occupation(s)
JohnW.Ratzesberger(1975)VicePresident
VicePresident,T.RowePrice,T.RowePriceGroup,Inc.,andT.RowePriceTrustCompany;formerly,NorthAmericanHeadofListedDerivativesOperation,MorganStanley(to2013)
ShannonH.Rauser(1987)AssistantSecretary
Employee,T.RowePrice
CoreyD.Shull,CFA(1983)VicePresident
VicePresident,T.RowePriceandT.RowePriceGroup,Inc.
JoshuaK.Spencer,CFA(1973)VicePresident
VicePresident,T.RowePriceandT.RowePriceGroup,Inc.
JustinThomson(1968)VicePresident
VicePresident,T.RowePriceGroup,Inc.,andT.RowePriceInternational
AlanTu(1985)VicePresident
VicePresident,T.RowePriceandT.RowePriceGroup,Inc.;formerly,student,UniversityofChicagoBoothSchoolofBusiness(to2014);formerly,Intern,T.RowePrice(to2013)
J.DavidWagner,CFA(1974)VicePresident
VicePresident,T.RowePrice,T.RowePriceGroup,Inc.,andT.RowePriceTrustCompany
MeganWarren(1968)VicePresident
VicePresident,T.RowePrice,T.RowePriceGroup,Inc.,T.RowePriceRetirementPlanServices,Inc.,T.RowePriceServices,Inc.,andT.RowePriceTrustCompany;formerly,ExecutiveDirector,JPMorganChase(to2017)
Unlessotherwisenoted,officershavebeenemployeesofT.RowePriceorT.RowePriceInternationalforatleast5years.
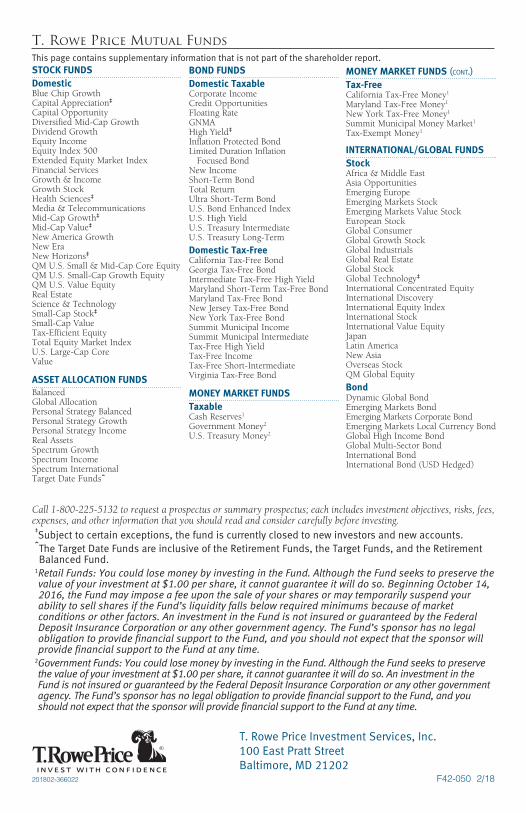
Proof #4
F42-050 2/18
STOck fuNDSDomestic Blue Chip GrowthCapital Appreciation‡
Capital OpportunityDiversified Mid-Cap GrowthDividend GrowthEquity IncomeEquity Index 500Extended Equity Market IndexFinancial ServicesGrowth & IncomeGrowth StockHealth Sciences‡
Media & TelecommunicationsMid-Cap Growth‡
Mid-Cap Value‡
New America GrowthNew EraNew Horizons‡
QM U.S. Small & Mid-Cap Core EquityQM U.S. Small-Cap Growth EquityQM U.S. Value EquityReal EstateScience & TechnologySmall-Cap Stock‡
Small-Cap ValueTax-Efficient Equity Total Equity Market IndexU.S. Large-Cap CoreValue
aSSET aLLOcaTION fuNDSBalanced Global AllocationPersonal Strategy BalancedPersonal Strategy GrowthPersonal Strategy IncomeReal AssetsSpectrum GrowthSpectrum IncomeSpectrum InternationalTarget Date Fundsˆ
BOND fuNDSDomestic TaxableCorporate IncomeCredit OpportunitiesFloating RateGNMA High Yield‡
Inflation Protected BondLimited Duration Inflation
Focused BondNew IncomeShort-Term BondTotal ReturnUltra Short-Term BondU.S. Bond Enhanced IndexU.S. High YieldU.S. Treasury IntermediateU.S. Treasury Long-Term
Domestic Tax-freeCalifornia Tax-Free BondGeorgia Tax-Free BondIntermediate Tax-Free High YieldMaryland Short-Term Tax-Free BondMaryland Tax-Free BondNew Jersey Tax-Free BondNew York Tax-Free BondSummit Municipal IncomeSummit Municipal IntermediateTax-Free High YieldTax-Free IncomeTax-Free Short-IntermediateVirginia Tax-Free Bond
mONEy maRkET fuNDSTaxableCash Reserves1
Government Money2
U.S. Treasury Money2
mONEy maRkET fuNDS (cont.)Tax-freeCalifornia Tax-Free Money1
Maryland Tax-Free Money1
New York Tax-Free Money1
Summit Municipal Money Market1
Tax-Exempt Money1
INTERNaTIONaL/GLOBaL fuNDSStockAfrica & Middle EastAsia OpportunitiesEmerging EuropeEmerging Markets StockEmerging Markets Value StockEuropean Stock Global ConsumerGlobal Growth StockGlobal IndustrialsGlobal Real EstateGlobal StockGlobal Technology‡
International Concentrated EquityInternational DiscoveryInternational Equity IndexInternational StockInternational Value EquityJapanLatin AmericaNew AsiaOverseas StockQM Global Equity
BondDynamic Global BondEmerging Markets BondEmerging Markets Corporate BondEmerging Markets Local Currency BondGlobal High Income BondGlobal Multi-Sector BondInternational BondInternational Bond (USD Hedged)
T.RowePriceInvestmentServices,Inc.100EastPrattStreetBaltimore,MD21202
Thispagecontainssupplementaryinformationthatisnotpartoftheshareholderreport.
T. Rowe Price Mutual Funds
201802-366022
Call 1-800-225-5132 to request a prospectus or summary prospectus; each includes investment objectives, risks, fees, expenses, and other information that you should read and consider carefully before investing. ‡Subjecttocertainexceptions,thefundiscurrentlyclosedtonewinvestorsandnewaccounts.
ˆTheTargetDateFundsareinclusiveoftheRetirementFunds,theTargetFunds,andtheRetirementBalancedFund.
1 Retail Funds: You could lose money by investing in the Fund. Although the Fund seeks to preserve the value of your investment at $1.00 per share, it cannot guarantee it will do so. Beginning October 14, 2016, the Fund may impose a fee upon the sale of your shares or may temporarily suspend your ability to sell shares if the Fund’s liquidity falls below required minimums because of market conditions or other factors. An investment in the Fund is not insured or guaranteed by the Federal Deposit Insurance Corporation or any other government agency. The Fund’s sponsor has no legal obligation to provide financial support to the Fund, and you should not expect that the sponsor will provide financial support to the Fund at any time.
2 Government Funds: You could lose money by investing in the Fund. Although the Fund seeks to preserve the value of your investment at $1.00 per share, it cannot guarantee it will do so. An investment in the Fund is not insured or guaranteed by the Federal Deposit Insurance Corporation or any other government agency. The Fund’s sponsor has no legal obligation to provide financial support to the Fund, and you should not expect that the sponsor will provide financial support to the Fund at any time.