t medieval ecline of d , m p -f - university of toronto · this thesis, a ‘feudal reaction’ of...
TRANSCRIPT

The late Medieval Decline of english Demesne Agriculture:
Demographic, Monetary, and Political-Fiscal Factors
John Munro*
During the later fourteenth and early fifteenth centuries, a majority of english manorial landlords, lay and ecclesiastical, experienced a significant contraction of their demesne holdings: sometimes by sale
or partial abandonment, but more often by leasing them to tenants. J. M. Bean states that ‘there is a general consensus that the crucial years in this process were between 1380 and 1420’, and his view is supported by a number of studies of ecclesiastical estates.1 Thus, Ambrose raftis contends that a dramatic ‘collapse’ of the direct management of demesnes on the ramsey Abbey estates took place during and just after the 1390s.2 Barbara harvey, having examined the accounts of westminster Abbey’s large number of manors in southern and central england, similarly concluded that ‘the turn of the tide may be placed around the year 1390’.3 Christopher Dyer also found, on the estates of the bishop of worcester, that ‘the main break [the shift to leasing] came with [Bishop] wakefield’s death in 1395’.4 in his analysis of the manors of the Archbishop of Canterbury, F. r. h. Du Boulay found that ‘by 1400 most of the demesnes, and by 1450, all of them were being leased out’.5
1 Bean, ‘landlords’, pp. 526–86.2 raftis, ‘Peasants and the Collapse of the Manorial economy’, p. 196.3 harvey, Westminster Abbey and its Estates, p. 268.4 Dyer, Lords and Peasants in a Changing Society, p. 147.5 Du Boulay, ‘who were Farming the english Demesnes?’, pp. 445–46.
* John Munro is Professor emeritus of economics, university of Toronto.
Town and Countryside in the Age of the Black Death, ed. by Mark Bailey and stephen rigby, (Turnhout: Brepols, 2012), 299–348 BrePols PuBlishers 10.1484/M.TMC-eB.1.100565

300 John Munro
in the view of most historians, the contraction of demesne holdings was fun-damentally the consequence of population decline: perhaps by some forty per cent, or even more, by the later fifteenth century.6 Demographic factors alone, however, cannot fully explain the phenomenon of leasing or ‘farming’ the demesnes itself, so that other economic changes, including monetary forces and fiscal policies, must also be examined for a fuller understanding of what was truly a momentous change in the economy and society of later medieval england.
The Ricardian Demographic Model for the Decline of Demesne Agriculture and of Villeinage
in explaining agricultural change in the later Middle Ages, in particular the leas-ing of manorial demesnes, we should first consider the standard demographic model, one that is based on ricardo’s economics. The essential argument is that population decline inevitably led to falling grain prices, and thus to falling eco-nomic rents (as determined by grain prices), and also to rising real wages, in so far as the alteration of the land:labour ratio (fewer workers per acre of arable) increased labour productivity. This labour scarcity became all the worse, driv-ing up wages even more, as many cottars and landless labourers took up vacated tenancies, at much lower rents, and frequently with few or no obligations to perform ‘customary’ labour services on the demesne. Thus manorial landlords became victims of a vicious price-cost squeeze and falling incomes that ultimately forced them to abandon direct cultivation and to lease demesnes lands to peas-ant tenants, on the best possible terms that the peasants would accept. however, whether this model fits all the historical facts, in particular those concerning the actual timing of this transformation, remains to be seen.
‘Mind the Gap’: The Time-Lag between the Black Death and the Commencement of Leasing
if the Black Death of 1348–52 was indeed the major demographic catastrophe of the fourteenth century, and yet the first major phase of demesne leasing did not begin until the 1380s, how can we explain this time lag of thirty years or more? A. r. Bridbury offered one intriguing solution in contending that england had been so grossly overpopulated that the Black Death was ‘more purgative than toxic’, in eliminating an excess labour force that constituted ‘disguised unemploy-
6 see hatcher, Plague, Population, and the English Economy, pp. 11–73; hatcher, ‘Mortality in the Fifteenth Century’.

The Late Medieval Decline of English Demesne Agriculture 301
ment’, so that only by the later 1370s had ongoing demographic decline become sufficiently severe to bring about the economic changes predicted in the ricardo model.7 Few, if any, historians have accepted his thesis, which Bridbury himself subsequently contradicted in an article contending that england was far from being overpopulated on the eve of the Black Death.8
Another more promising explanation for this ‘time lag’ between the Black Death and the onset of demesne leasing is the supposed ‘feudal reaction’ that immediately followed the Black Death and then endured for the next three dec-ades.9 The essential argument is that many manorial lords reacted to the threat of labour scarcity and rising wages, not so much by ‘reimposing’ villeinage (serfdom) in areas where it had waned, but rather by intensifying their exactions of custom-ary villein labour services on their demesnes. while there is some evidence for this thesis, a ‘feudal reaction’ of this nature is very difficult to substantiate as a widespread phenomenon: i.e., sufficiently powerful to repress the changing mar-ket forces in both land and labour. The most substantial support for the ‘feudal reaction’ thesis is the oppressive parliamentary labour legislation imposed to fix maximum wages, evidently at the behest of landlords, immediately after the Black Death, namely the ordinance of labourers (1349) and the statute of labourers (1351). The final major measure was the statute of Cambridge (1388). The debate over the effectiveness of this legislation has generated a vast literature that cannot be considered here.10 one may observe, however, that, despite substantial evidence of prosecutions for statute violations (chiefly of employees, not employ-ers), to the 1380s, manorial wages for both agricultural and industrial workers did rise in the two decades following the statute, far above the permitted rates. For example, by the 1360s and 1370s, and constantly thereafter to the 1390s, the prevailing daily wage rate for carpenters on various winchester manors was four pence (4d.), occasionally 5d.: one-third higher than the 3d. rate prescribed in the 1351 statute.11 That rate was all the more difficult to enforce, because it was an
7 Bridbury, ‘The Black Death’, pp. 557–92.8 Bridbury, ‘Before the Black Death’.9 see in particular Britnell, ‘Feudal reaction after the Black Death’; hilton, The Decline of
Serfdom, pp. 26–59; Bolton, The Medieval English Economy, pp. 214–21; rigby, English Society in the Later Middle Ages, pp. 104–27.
10 The classic study is Putnam, The Enforcement of the Statue of Labourers. see also Given-wilson, ‘labour in the Context of the english Government’; Penn and Dyer, ‘wages and earnings in late Medieval england’; Poos, ‘The social Context of statute of labourers enforcement’; hatcher, ‘england in the Aftermath’.
11 lse Archives, Beveridge, Boxes A.30–33: for ecchinswell, esher, Taunton, witney, and

302 John Munro
unusually low rate that had only temporarily prevailed, just before the plague, in the deflationary 1340s (Tables 20B and 21A).12
wycombe. see also Table 21A below, for Farmer’s ‘national’ means of carpenters’ wages: with a mean of 4.194d. in the 1370s.
12 see Munro, ‘wage-stickiness’, pp. 207–11; Munro, ‘Before and After the Black Death’.
Table 18. Price indexes for the Phelps Brown and hopkins ‘Basket of Consumables’ and for the prices of grains, meat, dairy products, and english wools (mean of 1451–75 = 100), 1331–35 to 1446–50
Year
Phelps Brown & Hopkins
Composite Price Index (Revised)
Total grains: wheat, rye, barley, peas Price Index
Meat products: beef, mutton,
swine Price Index
Dairy products: butter and
cheese Price Index
Wools: better
qualities: Price Index
base value in pence (d.) 112.801d.
base value in d.
21.799d.
base value in d.
23.950d.
base value in d.
15.579d.
base value in pounds (£)
£4.8544
1331–35 109.108 110.302 110.021 95.281 110.6141336–40 89.256 84.730 96.346 94.622 95.6991341–45 85.533 81.356 89.666 88.547 101.9101346–50 100.064 101.499 94.572 97.299 97.0931351–55 126.472 131.100 113.987 102.921 91.5771356–60 118.092 115.863 108.455 112.790 108.0091361–65 137.976 130.413 131.419 104.738 115.4741366–70 136.460 150.487 131.607 106.830 137.7991371–75 127.345 133.638 143.653 107.403 162.6371376–80 109.891 96.219 118.580 105.066 155.2431381–85 113.190 104.029 110.890 105.709 123.4941386–90 101.233 83.336 108.055 96.590 104.4631391–95 103.953 96.639 106.471 73.130 102.0391396–1400 110.648 105.084 111.064 100.898 107.9661401–05 112.653 117.530 110.071 102.790 117.4551406–10 109.927 108.229 106.555 106.878 128.1141411–15 108.261 91.411 105.599 110.132 122.6511416–20 113.598 114.066 103.055 107.879 94.5861421–25 103.740 94.999 93.213 91.331 108.5381426–30 112.610 107.222 99.581 104.979 103.2981431–35 109.122 110.106 106.078 106.810 115.6341436-40 124.218 148.525 109.585 110.342 109.6271441-45 92.574 75.504 96.624 97.290 107.1451446-50 101.241 97.399 106.245 106.978 110.796

The Late Medieval Decline of English Demesne Agriculture 303
The Role of Deflation in the Decline of Manorial Demesne Agriculture during the ‘bullion famine’ of c. 1370– c. 1420
A more effective solution to the problem of the ‘time-lag’ may be found by resorting to a combined monetary and a related fiscal model, to supplement the demographic model. The essential thesis is that england’s manorial economic crisis commenced only with the onset of another severe, prolonged deflation, from the later 1370s to the 1420s, during which not only the Consumer Price index (CPi) but the prices of all agricultural commodities fell, whereas most agricultural costs did not, thus creating the well-known ‘price scissors’.13 The related fiscal part of the model is that deflation (including the fall of wool prices) exacerbated the very onerous burden of the wool-export taxes, thereby producing a severe contraction in wool exports, and, presumably, in the demand for manorial (and peasant) wools. The deflation itself was the product of a severe, european-wide monetary contraction, the so-called ‘bullion famine’ (during this same era), which brought to an abrupt end the three-decade long inflation that had followed the Black Death. The evidence that monetary factors were essentially responsible for this deflation have been set forth in so many of publications by so many historians (including the present author) that they need not be presented here.14
13 see Munro, ‘wage-stickiness’, pp. 185–297; Munro, ‘Before and After the Black Death’.14 see Day, ‘The Great Bullion Famine’; Miskimin, ‘Monetary Movements and Market
Sources for Table 18. Wool prices: lloyd, The Movement of Wool Prices, pp. 35–51.
Other commodity prices: based upon the Phelps Brown and hopkins ‘Basket of Consumables’ Price index: lse Archives, Phelps Brown, Box ia:324, lse Archives, Phelps Brown, Box J.iV.2.a. These archives contain Phelps Brown’s original hand-written working papers, with prices for individual commodities contained in the Phelps Brown and hopkins ‘basket of consumables’ price index, which they had presented in Phelps Brown and hopkins, ‘seven Centuries of the Prices of Consumables’ (with price indexes not in the original).
Apart from correcting hundreds of computational errors in their original series, i constructed an entirely new index based on actual prices rather than their index numbers. using the data in their work-sheets, for each commodity, i first calculated the annual prices for all the commodities in the basket. The using their commodity weights, i calculated the sum value of those commodities, to calculate the annual value of the basket. i then constructed the price index, with their base, 1451–75 = 100, from the values of the basket for each year in that twenty-five-year base period.
while the original PB&h commodity basket consisted of fixed commodity weights throughout the entire series — so that, for example, grain prices always account for twenty per cent of the total weight in the basket, the commodity weights, in my revised version, change with changes in relative prices. The commodity price weights for the basket are thus fixed only for the base period: 1451–75 = 100.
304 John Munro
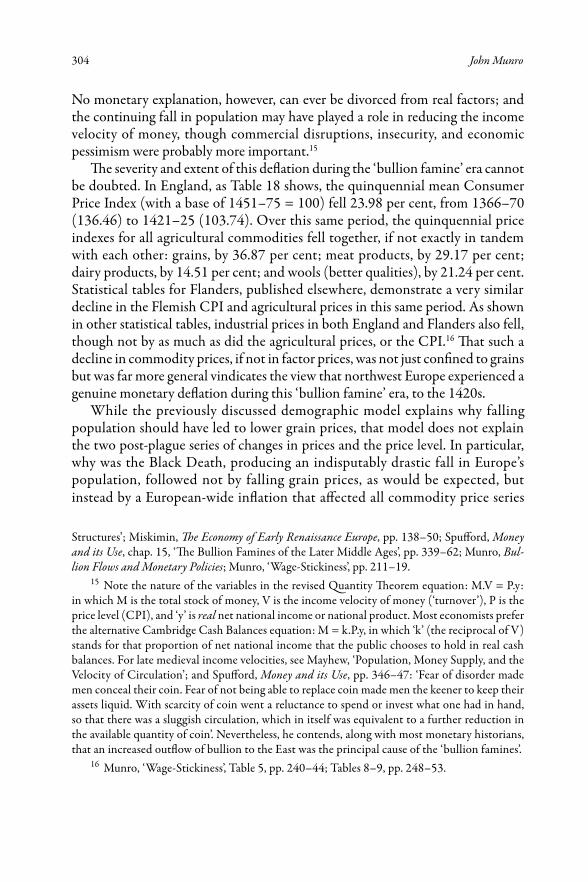
no monetary explanation, however, can ever be divorced from real factors; and the continuing fall in population may have played a role in reducing the income velocity of money, though commercial disruptions, insecurity, and economic pessimism were probably more important.15
The severity and extent of this deflation during the ‘bullion famine’ era cannot be doubted. in england, as Table 18 shows, the quinquennial mean Consumer Price index (with a base of 1451–75 = 100) fell 23.98 per cent, from 1366–70 (136.46) to 1421–25 (103.74). over this same period, the quinquennial price indexes for all agricultural commodities fell together, if not exactly in tandem with each other: grains, by 36.87 per cent; meat products, by 29.17 per cent; dairy products, by 14.51 per cent; and wools (better qualities), by 21.24 per cent. statistical tables for Flanders, published elsewhere, demonstrate a very similar decline in the Flemish CPi and agricultural prices in this same period. As shown in other statistical tables, industrial prices in both england and Flanders also fell, though not by as much as did the agricultural prices, or the CPi.16 That such a decline in commodity prices, if not in factor prices, was not just confined to grains but was far more general vindicates the view that northwest europe experienced a genuine monetary deflation during this ‘bullion famine’ era, to the 1420s.
while the previously discussed demographic model explains why falling population should have led to lower grain prices, that model does not explain the two post-plague series of changes in prices and the price level. in particular, why was the Black Death, producing an indisputably drastic fall in europe’s population, followed not by falling grain prices, as would be expected, but instead by a european-wide inflation that affected all commodity price series
structures’; Miskimin, The Economy of Early Renaissance Europe, pp. 138–50; spufford, Money and its Use, chap. 15, ‘The Bullion Famines of the later Middle Ages’, pp. 339–62; Munro, Bul-lion Flows and Monetary Policies; Munro, ‘wage-stickiness’, pp. 211–19.
15 note the nature of the variables in the revised Quantity Theorem equation: M.V = P.y: in which M is the total stock of money, V is the income velocity of money (‘turnover’), P is the price level (CPi), and ‘y’ is real net national income or national product. Most economists prefer the alternative Cambridge Cash Balances equation: M = k.P.y, in which ‘k’ (the reciprocal of V) stands for that proportion of net national income that the public chooses to hold in real cash balances. For late medieval income velocities, see Mayhew, ‘Population, Money supply, and the Velocity of Circulation’; and spufford, Money and its Use, pp. 346–47: ‘Fear of disorder made men conceal their coin. Fear of not being able to replace coin made men the keener to keep their assets liquid. with scarcity of coin went a reluctance to spend or invest what one had in hand, so that there was a sluggish circulation, which in itself was equivalent to a further reduction in the available quantity of coin’. nevertheless, he contends, along with most monetary historians, that an increased outflow of bullion to the east was the principal cause of the ‘bullion famines’.
16 Munro, ‘wage-stickiness’, Table 5, pp. 240–44; Tables 8–9, pp. 248–53.

The Late Medieval Decline of English Demesne Agriculture 305
(including grain prices) and one that lasted for thirty years?17 why did this post-plague inflationary era come to end in the 1370s, and why was that inflation then followed by the prolonged half-century deflation just described? such problems in population-based explanations indicate that monetary factors, affecting both money stocks and flows, cannot be ignored.
The Behaviour of Relative Prices for Grains and Livestock Products in Late Medieval England
in answering such questions about changes in prices, we must always distinguish carefully between changes in the price level and changes in the relative prices of various individual commodities. Though monetary factors may have been predominant in determining the overall price level (CPi), a wide variety of real factors, including demographic, and their interactions, especially in their real income effects, together determined the constantly fluctuating changes in relative prices: for example, changes in grain prices compared to changes in meat and dairy prices. in later medieval england, cereal grains accounted for a large share of household expenditures, on both food and drink, for the majority of society (Table 27); and grains had a low price- and income-elasticity of demand, the more so, as their prices fell. under such circumstances, a steep fall in grain prices that exceeded the fall in the overall CPi and thus the decline in other commodity prices should have liberated substantial household income to be spent on other commodities. such a shift in household demand would have led to an increase in the relative prices of livestock and industrial products, even when their nominal prices were also falling.
The conditions of and changes in supply also, of course, played an important role. in general, historically, grain prices fluctuate up and down far more than do other agricultural prices, especially prices for livestock products, which in turn fluctuate more than do industrial prices. To a considerable extent, differences in their respective long-term supply schedules help explain these differences in price changes. The supply schedules for various grains are generally very steeply sloped (highly inelastic), thus helping to explain the sharp decline in their real prices with falling aggregate demand. Those for industrial products are only gently sloped (very elastic: with more or less constant-cost production functions); and those for livestock products usually lie in between these two sets of commodities.
17 For a monetary explanation of the post-plague inflation (c. 1350–c. 1375), see the sources cited in nn. 12, 14, above, in particular Munro, ‘wage-stickiness’, pp. 211–17.

306 John Munro
in late medieval england, much evidence indicates that the agricultural sector underwent a relative shift from the production of grains to the production of various livestock commodities (though not wool, for reasons to be explored later). we should not, however, expect that such changes in the supplies of agricultural commodities would have made their longer-term supply schedules any less elastic; and those supply changes would not likely have offset the ‘income effects’ from falling real grain prices. Tables 18 and 19 clearly confirm the foregoing prediction: that the prices for meat and dairy products and for wools fell to a lesser extent than did grain prices, so that (again) their relative commodity prices rose in relation to grain prices.
For most manorial landlords in late medieval england, from the 1370s to the 1420s, the fall in all nominal agricultural prices, in comparison with agricultural costs, obviously posed severe problems. The plight was the more severe for those who continued to pursue a traditional demesne economy based on both grain and wool, rather than on other livestock products, for reasons that are set out below. For grain producers, engaged in a very labour-intensive form of production, in contrast to the far less labour-intensive and more land extensive forms of livestock production, the equally important concern was the behaviour of factor prices, especially wages for hired labour on the demesnes.
The Behaviour of Factor Prices and the Problem of ‘Stickiness’
The related aspect of the monetary model is that, while these agricultural commodity prices fell steeply, the factor costs of production generally did not fall in nominal terms, and indeed rose in real terms. The principal costs to be considered are interest and wages. while they are indeed ‘prices’, for the use of capital and labour, historically they have never behaved in the same fashion as commodity prices; and they are not included in any consumer price indexes. it is thus a fallacy to believe that all prices must move together during periods of either inflation of deflation. The primary reason why factor prices generally did not move in tandem with commodity prices is factor-price ‘stickiness’, a phenomenon well known in Keynesian economics.18 Although this problem has not yet been well studied for interest rates, the most obvious reason lies in the nature of loan contracts, ‘recognizances’, mortgages, and related legal instruments used in borrowing money. in virtually all such contracts, the annual interest payments were fixed for the duration of the written agreements. To the extent that manorial
18 Keynes, The General Theory, pp. 4–22, 257–79.
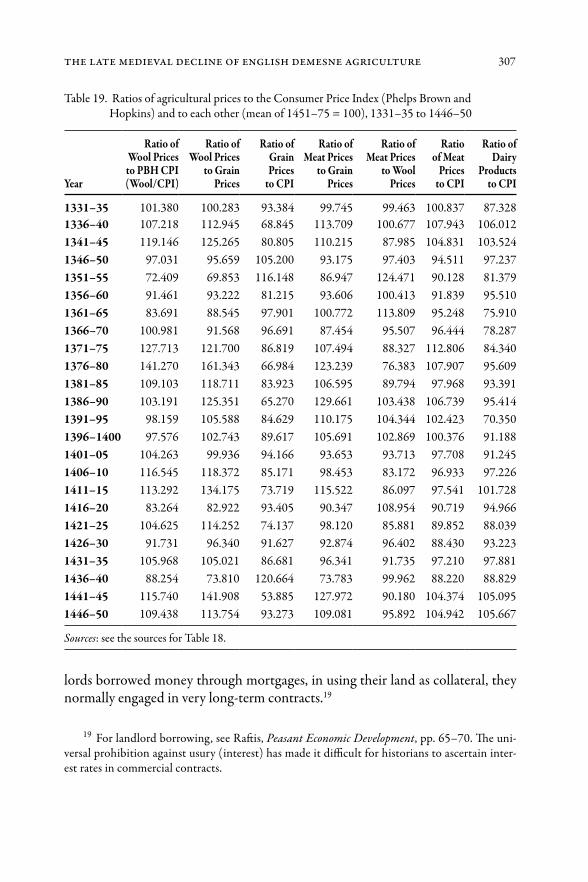
Table 19. ratios of agricultural prices to the Consumer Price index (Phelps Brown and hopkins) and to each other (mean of 1451–75 = 100), 1331–35 to 1446–50
Year
Ratio of Wool Prices to PBH CPI (Wool/CPI)
Ratio of Wool Prices
to Grain Prices
Ratio of Grain Prices
to CPI
Ratio of Meat Prices
to Grain Prices
Ratio of Meat Prices
to Wool Prices
Ratio of Meat
Prices to CPI
Ratio of Dairy
Products to CPI
1331–35 101.380 100.283 93.384 99.745 99.463 100.837 87.3281336–40 107.218 112.945 68.845 113.709 100.677 107.943 106.0121341–45 119.146 125.265 80.805 110.215 87.985 104.831 103.5241346–50 97.031 95.659 105.200 93.175 97.403 94.511 97.2371351–55 72.409 69.853 116.148 86.947 124.471 90.128 81.3791356–60 91.461 93.222 81.215 93.606 100.413 91.839 95.5101361–65 83.691 88.545 97.901 100.772 113.809 95.248 75.9101366–70 100.981 91.568 96.691 87.454 95.507 96.444 78.2871371–75 127.713 121.700 86.819 107.494 88.327 112.806 84.3401376–80 141.270 161.343 66.984 123.239 76.383 107.907 95.6091381–85 109.103 118.711 83.923 106.595 89.794 97.968 93.3911386–90 103.191 125.351 65.270 129.661 103.438 106.739 95.4141391–95 98.159 105.588 84.629 110.175 104.344 102.423 70.3501396–1400 97.576 102.743 89.617 105.691 102.869 100.376 91.1881401–05 104.263 99.936 94.166 93.653 93.713 97.708 91.2451406–10 116.545 118.372 85.171 98.453 83.172 96.933 97.2261411–15 113.292 134.175 73.719 115.522 86.097 97.541 101.7281416–20 83.264 82.922 93.405 90.347 108.954 90.719 94.9661421–25 104.625 114.252 74.137 98.120 85.881 89.852 88.0391426–30 91.731 96.340 91.627 92.874 96.402 88.430 93.2231431–35 105.968 105.021 86.681 96.341 91.735 97.210 97.8811436–40 88.254 73.810 120.664 73.783 99.962 88.220 88.8291441–45 115.740 141.908 53.885 127.972 90.180 104.374 105.0951446–50 109.438 113.754 93.273 109.081 95.892 104.942 105.667
Sources: see the sources for Table 18.
The Late Medieval Decline of English Demesne Agriculture 307
lords borrowed money through mortgages, in using their land as collateral, they normally engaged in very long-term contracts.19
19 For landlord borrowing, see raftis, Peasant Economic Development, pp. 65–70. The uni-versal prohibition against usury (interest) has made it difficult for historians to ascertain inter-est rates in commercial contracts.
in late medieval england, much evidence indicates that the agricultural sector underwent a relative shift from the production of grains to the production of various livestock commodities (though not wool, for reasons to be explored later). we should not, however, expect that such changes in the supplies of agricultural commodities would have made their longer-term supply schedules any less elastic; and those supply changes would not likely have offset the ‘income effects’ from falling real grain prices. Tables 18 and 19 clearly confirm the foregoing prediction: that the prices for meat and dairy products and for wools fell to a lesser extent than did grain prices, so that (again) their relative commodity prices rose in relation to grain prices.
For most manorial landlords in late medieval england, from the 1370s to the 1420s, the fall in all nominal agricultural prices, in comparison with agricultural costs, obviously posed severe problems. The plight was the more severe for those who continued to pursue a traditional demesne economy based on both grain and wool, rather than on other livestock products, for reasons that are set out below. For grain producers, engaged in a very labour-intensive form of production, in contrast to the far less labour-intensive and more land extensive forms of livestock production, the equally important concern was the behaviour of factor prices, especially wages for hired labour on the demesnes.
The Behaviour of Factor Prices and the Problem of ‘Stickiness’
The related aspect of the monetary model is that, while these agricultural commodity prices fell steeply, the factor costs of production generally did not fall in nominal terms, and indeed rose in real terms. The principal costs to be considered are interest and wages. while they are indeed ‘prices’, for the use of capital and labour, historically they have never behaved in the same fashion as commodity prices; and they are not included in any consumer price indexes. it is thus a fallacy to believe that all prices must move together during periods of either inflation of deflation. The primary reason why factor prices generally did not move in tandem with commodity prices is factor-price ‘stickiness’, a phenomenon well known in Keynesian economics.18 Although this problem has not yet been well studied for interest rates, the most obvious reason lies in the nature of loan contracts, ‘recognizances’, mortgages, and related legal instruments used in borrowing money. in virtually all such contracts, the annual interest payments were fixed for the duration of the written agreements. To the extent that manorial
18 Keynes, The General Theory, pp. 4–22, 257–79.
Table 19. ratios of agricultural prices to the Consumer Price index (Phelps Brown and hopkins) and to each other (mean of 1451–75 = 100), 1331–35 to 1446–50
Year
Ratio of Wool Prices to PBH CPI (Wool/CPI)
Ratio of Wool Prices
to Grain Prices
Ratio of Grain Prices
to CPI
Ratio of Meat Prices
to Grain Prices
Ratio of Meat Prices
to Wool Prices
Ratio of Meat
Prices to CPI
Ratio of Dairy
Products to CPI
1331–35 101.380 100.283 93.384 99.745 99.463 100.837 87.3281336–40 107.218 112.945 68.845 113.709 100.677 107.943 106.0121341–45 119.146 125.265 80.805 110.215 87.985 104.831 103.5241346–50 97.031 95.659 105.200 93.175 97.403 94.511 97.2371351–55 72.409 69.853 116.148 86.947 124.471 90.128 81.3791356–60 91.461 93.222 81.215 93.606 100.413 91.839 95.5101361–65 83.691 88.545 97.901 100.772 113.809 95.248 75.9101366–70 100.981 91.568 96.691 87.454 95.507 96.444 78.2871371–75 127.713 121.700 86.819 107.494 88.327 112.806 84.3401376–80 141.270 161.343 66.984 123.239 76.383 107.907 95.6091381–85 109.103 118.711 83.923 106.595 89.794 97.968 93.3911386–90 103.191 125.351 65.270 129.661 103.438 106.739 95.4141391–95 98.159 105.588 84.629 110.175 104.344 102.423 70.3501396–1400 97.576 102.743 89.617 105.691 102.869 100.376 91.1881401–05 104.263 99.936 94.166 93.653 93.713 97.708 91.2451406–10 116.545 118.372 85.171 98.453 83.172 96.933 97.2261411–15 113.292 134.175 73.719 115.522 86.097 97.541 101.7281416–20 83.264 82.922 93.405 90.347 108.954 90.719 94.9661421–25 104.625 114.252 74.137 98.120 85.881 89.852 88.0391426–30 91.731 96.340 91.627 92.874 96.402 88.430 93.2231431–35 105.968 105.021 86.681 96.341 91.735 97.210 97.8811436–40 88.254 73.810 120.664 73.783 99.962 88.220 88.8291441–45 115.740 141.908 53.885 127.972 90.180 104.374 105.0951446–50 109.438 113.754 93.273 109.081 95.892 104.942 105.667
Sources: see the sources for Table 18.

308 John Munro
The primary problem that concerned late medieval manorial lords in using cap-ital (for example, that invested in livestock herds) was not nominal but real inter-est rates. The real interest rate is the nominal rate minus the annual rate of inflation (percentage annual change in the Consumer Price index); or, for the period con-cerned here, the nominal interest rate plus the annual rate of deflation. Thus, the deflation of the late fourteenth and early fifteenth centuries inexorably increased the real burdens of the manorial lords’ annual interest payments, especially in rela-tion to the much lower prices fetched for the sales of agricultural products. indeed, raftis depicts the growing plight of the ramsey Abbey estates in the 1370s and 1380s as ‘a period of lower prices and increasing capital costs on the demesne’.20
The Novel Problem of Nominal ‘Wage Stickiness’ in Late Fourteenth-Century England
in relation to money wages, the problem of ‘stickiness’ is all the more complex. The flexibility of long-term wage movements depends upon the nature of the prevailing price movements. During periods of inflation, in medieval and early modern europe, money wages generally did rise, but sluggishly, with significant time lags, and thus almost never in pace with the rise of commodity prices. Therefore, real wages necessarily fell during most periods of inflation, according to the standard formula, expressed in index numbers: rwi = nwi/CPi (the real wage index = the nominal money wage index divided by the Consumer Price index). in later medieval and early modern europe, during periods of deflation, wages were far more rigid, so that real wages rose directly with falling prices. in this respect, what is now called ‘downward wage-stickiness’ is clearly related to monetary phenomena, in so far as they determine changes in the Consumer Price index.
henry Phelps Brown and sheila hopkins were amongst the first historians to call attention to this particular ‘wage-stickiness’ phenomenon, though they called it the ‘elbow-joint’ or ‘ratchet effect’. They also contended that it was a new phe-nomenon in england, dating only from the later fourteenth century, but one that continued to prevail during subsequent periods of deflation, until the 1920s.21 As they noted, and as did Beveridge and Bridbury, the 1370s marked the first time that money wages did not fall with the Consumer Price index, as they had done earlier, in the deflationary 1330s and 1340s.22 The same patterns of nominal wage-
20 raftis, Peasant Economic Development, p. 68.21 Phelps Brown and hopkins, ‘seven Centuries of Building wages’, pp. 7–8.22 Phelps Brown and hopkins, ‘seven Centuries of Building wages’, pp. 8–10. see in par-

The Late Medieval Decline of English Demesne Agriculture 309
stickiness during deflationary periods can also be demonstrated for the late medi-eval and early modern low Countries.23 Keynes observed that, while an inflation-induced fall in real wages rarely provokes hostile responses from organized labour, during deflationary periods, ‘every trade union will put up some resistance to a cut in money-wages, however small’, generally for fear that such losses may never be fully recouped.24 John langdon’s recent study on this issue confirms patterns of wage-stickiness in medieval england, but even before the Black Death.25 The complex reasons for wage-stickiness, which cannot be the focus of this study, have been explored at length in several of my recent publications.26
The Evidence of Manorial Wages in Later Medieval England
The collected evidence for manorial wages, both agricultural and industrial, in later fourteenth- and early fifteenth-century england is presented in Tables 20A–B to 21A–B. only those purely money rates for labour alone, paid in silver pence, have been utilized, so that any wage payments that combined money and kind (food, drink, clothing) have been deliberately excluded.27 The most important series are those for such seasonal agricultural workers as threshers and winnowers, reapers and binders, and mowers, presented in Table 20A, in five-year means. They are based the annual index-number data that David Farmer published in two volumes of the Agrarian History of England and Wales.28 Farmer’s data have
ticular Beveridge, ‘westminster wages in the Manorial era’, p. 31. see also Bridbury, ‘The Black Death’, p. 582.
23 Munro, ‘wage-stickiness’, pp. 185–97; Munro, ‘Money, Prices, wages, and “Profit inflation”’.24 Keynes, The General Theory, p. 15. The late medieval low Countries provide examples of
labour strikes (textile guilds) and civic revolts when authorities attempted to cut money-wages, during deflationary periods, even though real wages were then rising. see Munro, ‘Gold, Guilds, and Government’.
25 langdon, ‘waged Building employment in Medieval england’.26 see in particular Munro, ‘wage-stickiness’; Munro, ‘Before and After the Black Death’.27 Farmer, ‘Prices and wages’, pp. 760–78, 811–17; and Farmer, ‘Prices and wages, 1350–
1500’, pp. 467–90, 516–24; Phelps Brown and hopkins, ‘seven Centuries of Building wages’, pp. 8–12; Beveridge, ‘wages in the winchester Manors’, pp. 22–43: ‘in the winchester manors there is no reason for suspecting any general practice of supplementation’ of money wages, when food payments are not specified’. when they are, they differ from the money-wage alone ‘as a rule by 2d. per day’ (pp. 36–37). see also Munro, ‘wage-stickiness’, pp. 194–212, and esp. pp. 202–04, and n. 48 (p. 275), for a critique of the view that supplementary wage-payments in kind were used to thwart the wage ordinances: as recently argued in hatcher, ‘england in the Aftermath’.
28 see also his earlier study: Farmer, ‘Crop yields, Prices and wages’.

310 John Munro
been converted into both silver pence and index numbers for both nominal and real wages, with the Phelps Brown and hopkins base (1451–75 = 100), which is used in all other tables in this study. The ‘real wage’ calculations in Tables 20A and 20B are based not on his price index but on my revised Phelps Brown and hopkins ‘Basket of Consumable’ index used in the other tables (see Table 27).
The wage data for medieval english agricultural workers are highly problematic, in two respects. in the first place, these are piece-work wages: payments for the quantity of work done, without any reference to the time taken to fulfil these tasks. rising piece rates might have meant less work done per day, though of course they still represented a higher labour cost for manorial lords, especially if, in contradiction to traditional economic theory, rising real wages did not represent increased productivity.29 in the second place, the annual fluctuations of these piece-work wages do not clearly demonstrate the phenomenon of wage-stickiness, especially downward wage-stickiness during deflation. The problem here lies in the compilation of the data as ‘national averages’ by a method that suffers from ‘compositional’ errors. Because of both frequent annual gaps in the manorial data and regional wage variations, the calculations of the mean wage for each class of agricultural worker each year do not necessarily reflect actual wage changes in each and every region but changes in the composition of the data, so that the absence of either higher or lower wage manors in any given year skews the results. Furthermore, the piece rates varied according to the type of grain that was threshed and winnowed (wheat, barley, and oats); and not all were consistently recorded. Thus, even within each manor, annual changes in the composition of the piece-work wage group by such grains would also have skewed the results and produced spurious fluctuations.30
Taking account of all these caveats, we observe from Table 20A that the nomi-nal piece-work wages of threshers and winnowers (in index numbers) did indeed rise, as expected, after the Black Death: by 23.51 per cent from 1341–45 to 1366–70. That increase in nominal wage rates did not, however, match the infla-tionary rise in the Consumer Price index, so that the real wage index actually fell
29 recently, Gregory Clark has sought a remedy for this vexing problem by using regres-sion analysis (based on other wage data) to convert english agrarian piece work wages into daily wages (again, on a ‘national means’ basis); but his results are so strikingly at variance with the evi-dence produced here that they cannot reasonably be used in this study. Clark, ‘The long March of history’, p. 101 and Table 1 at pp. 99–100.
30 Munro, ‘wage-stickiness’, pp. 196–97. For varying rates according to the type of grain threshed (not made clear in Farmer), see Beveridge, ‘wages in the winchester Manors’, Table ii, p. 39.
Table 20A. national means of manorial agricultural wages in england: Piece-work rates for process-ing agricultural commodities (threshing and winnowing; reaping and binding) in sil-ver pence and in index numbers (base: 1451–75 = 100) with calculations of real wages based on the Phelps Brown and hopkins Consumer Price index, 1331–35 to 1446–50
THRESHING AND WINNOWING GRAINS
Piece rates per razed quarter (8 bushels)
REAPING AND BINDING GRAINS
per acre of grains
Years 5-year period
CPI
: bas
ed on
Ph
elps B
rown
Hop
kins
(r
evise
d)
Thre
shin
g & W
inno
wing
ra
zed
quar
ter o
f gra
ins
(P
ence
)
Thre
shin
g & W
inno
wing
ra
zed
quar
ter
of gr
ains
In
dex:
145
1–75
= 10
0
RWI =
NW
I/C
PI
1451
–75
= 10
0 ha
rmon
ic m
eans
Reap
ing &
Bin
ding
pe
r acr
e of
grai
ns
(Pen
ce)
Reap
ing &
Bin
ding
pe
r acr
e of
grai
ns
Inde
x: 1
451–
75 =
100
RWI =
NW
I/C
PI
1451
–75 =
100
ha
rmon
ic m
eans
1331–35 109.108 5.358 51.692 46.586 6.402 64.242 58.7301336–40 89.256 5.358 51.692 57.893 5.919 59.394 66.7101341–45 85.533 5.402 52.107 60.912 6.076 60.970 71.2771346–50 100.064 5.832 56.259 55.738 7.055 70.788 66.3311351–55 126.472 6.262 60.411 46.468 7.876 79.030 62.2731356–60 118.092 5.746 55.429 46.704 6.572 65.939 55.7411361–65 137.976 6.252 60.307 43.542 8.033 80.606 58.2911366–70 136.460 6.671 64.355 46.566 8.299 83.273 60.7761371–75 127.345 7.414 71.518 55.280 8.480 85.091 65.8911376–80 109.891 7.704 74.320 67.418 9.954 99.879 90.9251381–85 113.190 8.038 77.538 68.007 9.072 91.030 78.9861386–90 101.233 7.500 72.348 71.425 9.205 92.364 91.2441391–95 103.953 7.414 71.518 68.700 8.734 87.636 83.4731396–1400 110.648 7.962 76.811 69.165 8.734 87.636 77.9341401–05 112.653 8.436 81.378 69.795 9.241 92.727 82.4301406–10 109.927 8.726 84.181 76.101 9.918 99.515 90.5501411–15 108.261 7.812 75.358 69.618 10.038 100.727 93.0091416–20 113.598 8.920 86.049 74.925 9.857 98.909 86.9181421–25 103.740 8.317 80.237 77.243 9.362 93.939 90.0091426–30 112.610 8.221 79.302 70.570 9.048 90.788 79.8841431–35 109.122 8.070 77.849 71.231 9.386 94.182 86.2651436–40 124.218 10.254 98.920 77.342 9.561 95.939 77.5961441–45 92.574 9.415 90.824 97.297 10.981 110.182 118.8321446–50 101.241 8.920 86.049 84.038 9.942 99.758 98.561
Sources: Consumer Prices: see the sources for Table 18. Wages: Farmer, ‘Prices and wages’, pp. 760–78, 811–17; Farmer, ‘Prices and wages, 1350–1500’, pp. 467–90, 516–24. For the Phelps Brown and Hopkins CPI: see the sources for Table 18.

The Late Medieval Decline of English Demesne Agriculture 311
been converted into both silver pence and index numbers for both nominal and real wages, with the Phelps Brown and hopkins base (1451–75 = 100), which is used in all other tables in this study. The ‘real wage’ calculations in Tables 20A and 20B are based not on his price index but on my revised Phelps Brown and hopkins ‘Basket of Consumable’ index used in the other tables (see Table 27).
The wage data for medieval english agricultural workers are highly problematic, in two respects. in the first place, these are piece-work wages: payments for the quantity of work done, without any reference to the time taken to fulfil these tasks. rising piece rates might have meant less work done per day, though of course they still represented a higher labour cost for manorial lords, especially if, in contradiction to traditional economic theory, rising real wages did not represent increased productivity.29 in the second place, the annual fluctuations of these piece-work wages do not clearly demonstrate the phenomenon of wage-stickiness, especially downward wage-stickiness during deflation. The problem here lies in the compilation of the data as ‘national averages’ by a method that suffers from ‘compositional’ errors. Because of both frequent annual gaps in the manorial data and regional wage variations, the calculations of the mean wage for each class of agricultural worker each year do not necessarily reflect actual wage changes in each and every region but changes in the composition of the data, so that the absence of either higher or lower wage manors in any given year skews the results. Furthermore, the piece rates varied according to the type of grain that was threshed and winnowed (wheat, barley, and oats); and not all were consistently recorded. Thus, even within each manor, annual changes in the composition of the piece-work wage group by such grains would also have skewed the results and produced spurious fluctuations.30
Taking account of all these caveats, we observe from Table 20A that the nomi-nal piece-work wages of threshers and winnowers (in index numbers) did indeed rise, as expected, after the Black Death: by 23.51 per cent from 1341–45 to 1366–70. That increase in nominal wage rates did not, however, match the infla-tionary rise in the Consumer Price index, so that the real wage index actually fell
29 recently, Gregory Clark has sought a remedy for this vexing problem by using regres-sion analysis (based on other wage data) to convert english agrarian piece work wages into daily wages (again, on a ‘national means’ basis); but his results are so strikingly at variance with the evi-dence produced here that they cannot reasonably be used in this study. Clark, ‘The long March of history’, p. 101 and Table 1 at pp. 99–100.
30 Munro, ‘wage-stickiness’, pp. 196–97. For varying rates according to the type of grain threshed (not made clear in Farmer), see Beveridge, ‘wages in the winchester Manors’, Table ii, p. 39.
Table 20A. national means of manorial agricultural wages in england: Piece-work rates for process-ing agricultural commodities (threshing and winnowing; reaping and binding) in sil-ver pence and in index numbers (base: 1451–75 = 100) with calculations of real wages based on the Phelps Brown and hopkins Consumer Price index, 1331–35 to 1446–50
THRESHING AND WINNOWING GRAINS
Piece rates per razed quarter (8 bushels)
REAPING AND BINDING GRAINS
per acre of grains
Years 5-year period
CPI
: bas
ed on
Ph
elps B
rown
Hop
kins
(r
evise
d)
Thre
shin
g & W
inno
wing
ra
zed
quar
ter o
f gra
ins
(P
ence
)
Thre
shin
g & W
inno
wing
ra
zed
quar
ter
of gr
ains
In
dex:
145
1–75
= 10
0
RWI =
NW
I/C
PI
1451
–75
= 10
0 ha
rmon
ic m
eans
Reap
ing &
Bin
ding
pe
r acr
e of
grai
ns
(Pen
ce)
Reap
ing &
Bin
ding
pe
r acr
e of
grai
ns
Inde
x: 1
451–
75 =
100
RWI =
NW
I/C
PI
1451
–75 =
100
ha
rmon
ic m
eans
1331–35 109.108 5.358 51.692 46.586 6.402 64.242 58.7301336–40 89.256 5.358 51.692 57.893 5.919 59.394 66.7101341–45 85.533 5.402 52.107 60.912 6.076 60.970 71.2771346–50 100.064 5.832 56.259 55.738 7.055 70.788 66.3311351–55 126.472 6.262 60.411 46.468 7.876 79.030 62.2731356–60 118.092 5.746 55.429 46.704 6.572 65.939 55.7411361–65 137.976 6.252 60.307 43.542 8.033 80.606 58.2911366–70 136.460 6.671 64.355 46.566 8.299 83.273 60.7761371–75 127.345 7.414 71.518 55.280 8.480 85.091 65.8911376–80 109.891 7.704 74.320 67.418 9.954 99.879 90.9251381–85 113.190 8.038 77.538 68.007 9.072 91.030 78.9861386–90 101.233 7.500 72.348 71.425 9.205 92.364 91.2441391–95 103.953 7.414 71.518 68.700 8.734 87.636 83.4731396–1400 110.648 7.962 76.811 69.165 8.734 87.636 77.9341401–05 112.653 8.436 81.378 69.795 9.241 92.727 82.4301406–10 109.927 8.726 84.181 76.101 9.918 99.515 90.5501411–15 108.261 7.812 75.358 69.618 10.038 100.727 93.0091416–20 113.598 8.920 86.049 74.925 9.857 98.909 86.9181421–25 103.740 8.317 80.237 77.243 9.362 93.939 90.0091426–30 112.610 8.221 79.302 70.570 9.048 90.788 79.8841431–35 109.122 8.070 77.849 71.231 9.386 94.182 86.2651436–40 124.218 10.254 98.920 77.342 9.561 95.939 77.5961441–45 92.574 9.415 90.824 97.297 10.981 110.182 118.8321446–50 101.241 8.920 86.049 84.038 9.942 99.758 98.561
Sources: Consumer Prices: see the sources for Table 18. Wages: Farmer, ‘Prices and wages’, pp. 760–78, 811–17; Farmer, ‘Prices and wages, 1350–1500’, pp. 467–90, 516–24. For the Phelps Brown and Hopkins CPI: see the sources for Table 18.

312 John Munro
by a striking 23.55 per cent over this same period, as a mirror image. reapers and binders experienced a steeper rise in their nominal wages in this period: a mean of 36.58 per cent, from 1341–45 to 1366–70, though also with a temporary decline in 1356–60; and again, nominal wages rose by only by only 5.36 per cent from 1351–55 to 1366–70. similarly their real wages also fell after the Black Death: by 21.80 per cent, from 1341–45 to the trough of 1356–60; and, though rising thereafter, their real wages in 1366–70 were still only 85.37 per cent of what they had earned in the early 1340s. Thus we may thus assume that the rise in nominal wages was largely a monetary phenomenon, as part of the post-plague inflations.31
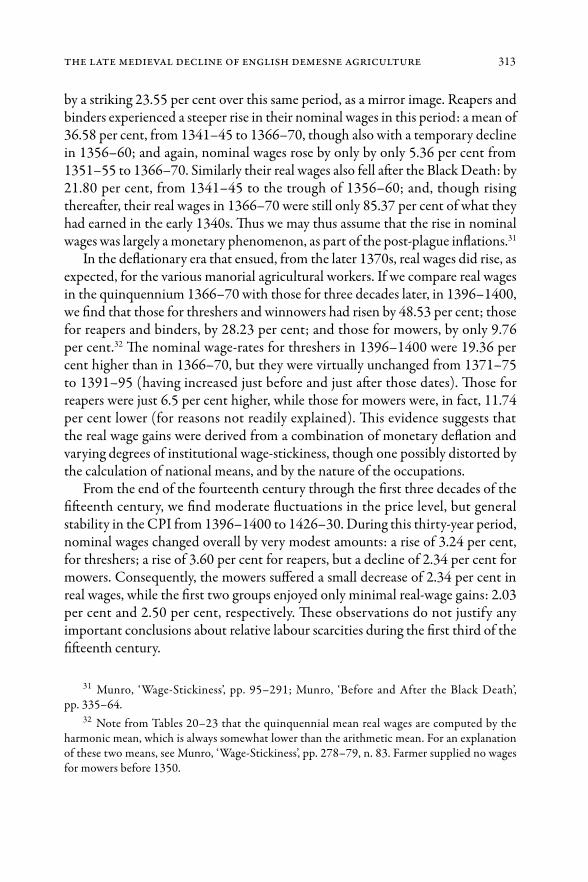
in the deflationary era that ensued, from the later 1370s, real wages did rise, as expected, for the various manorial agricultural workers. if we compare real wages in the quinquennium 1366–70 with those for three decades later, in 1396–1400, we find that those for threshers and winnowers had risen by 48.53 per cent; those for reapers and binders, by 28.23 per cent; and those for mowers, by only 9.76 per cent.32 The nominal wage-rates for threshers in 1396–1400 were 19.36 per cent higher than in 1366–70, but they were virtually unchanged from 1371–75 to 1391–95 (having increased just before and just after those dates). Those for reapers were just 6.5 per cent higher, while those for mowers were, in fact, 11.74 per cent lower (for reasons not readily explained). This evidence suggests that the real wage gains were derived from a combination of monetary deflation and varying degrees of institutional wage-stickiness, though one possibly distorted by the calculation of national means, and by the nature of the occupations.
From the end of the fourteenth century through the first three decades of the fifteenth century, we find moderate fluctuations in the price level, but general stability in the CPi from 1396–1400 to 1426–30. During this thirty-year period, nominal wages changed overall by very modest amounts: a rise of 3.24 per cent, for threshers; a rise of 3.60 per cent for reapers, but a decline of 2.34 per cent for mowers. Consequently, the mowers suffered a small decrease of 2.34 per cent in real wages, while the first two groups enjoyed only minimal real-wage gains: 2.03 per cent and 2.50 per cent, respectively. These observations do not justify any important conclusions about relative labour scarcities during the first third of the fifteenth century.
31 Munro, ‘wage-stickiness’, pp. 95–291; Munro, ‘Before and After the Black Death’, pp. 335–64.
32 note from Tables 20–23 that the quinquennial mean real wages are computed by the harmonic mean, which is always somewhat lower than the arithmetic mean. For an explanation of these two means, see Munro, ‘wage-stickiness’, pp. 278–79, n. 83. Farmer supplied no wages for mowers before 1350.
Table 20B. national means of manorial agricultural wages in england: Piece-work rates for pro-cessing agricultural commodities (mowing and spreading) in silver pence and in index numbers (base: 1451–75 = 100) with calculations of real wages based on the Phelps Brown and hopkins Consumer Price index, 1331–35 to 1446–50
MOWING AND SPREADING PER ACRE OF PASTURE per acre of meadow lands
Years 5-year period
CPI: based on
Phelps Brown Hopkins (revised)
Mowing & Spreading per acre of
meadow Pence
Mowing & Spreading per
acre of meadow Index:
1451–75 = 100
RWI = NWI/ CPI
1451–75 = 100 Harmonic
means
1331–35 109.108
1336–40 89.2561341–45 85.5331346–50 100.0641351–55 126.472 6.452 97.486 76.7881356–60 118.092 6.181 93.381 78.6891361–65 137.976 6.328 95.605 68.7431366–70 136.460 7.618 115.102 83.4811371–75 127.345 7.641 115.444 89.9961376–80 109.891 7.505 113.391 103.1941381–85 113.190 7.811 118.009 104.1731386–90 101.233 7.392 111.681 110.1931391–95 103.953 6.883 103.985 99.5521396–1400 110.648 6.724 101.591 91.6301401–05 112.653 6.764 102.189 89.6731406–10 109.927 7.273 109.885 99.9231411–15 108.261 6.962 105.182 95.7921416–20 113.598 6.735 101.762 89.3071421–25 103.740 7.200 108.774 104.6261426–30 112.610 6.684 100.992 89.4871431–35 109.122 6.226 94.065 86.1101436–40 124.218 6.764 102.189 82.0981441–45 92.574 6.407 96.802 104.5801446–50 101.241 6.305 95.263 93.925
Sources: Consumer Prices: see the sources for Table 18. Wages: Farmer, ‘Prices and wages’, pp. 760–78, 811–17; Farmer, ‘Prices and wages, 1350–1500’, pp. 467–90, 516–24. For the Phelps Brown and Hopkins CPI: see the sources for Table 18.
The Late Medieval Decline of English Demesne Agriculture 313
by a striking 23.55 per cent over this same period, as a mirror image. reapers and binders experienced a steeper rise in their nominal wages in this period: a mean of 36.58 per cent, from 1341–45 to 1366–70, though also with a temporary decline in 1356–60; and again, nominal wages rose by only by only 5.36 per cent from 1351–55 to 1366–70. similarly their real wages also fell after the Black Death: by 21.80 per cent, from 1341–45 to the trough of 1356–60; and, though rising thereafter, their real wages in 1366–70 were still only 85.37 per cent of what they had earned in the early 1340s. Thus we may thus assume that the rise in nominal wages was largely a monetary phenomenon, as part of the post-plague inflations.31
in the deflationary era that ensued, from the later 1370s, real wages did rise, as expected, for the various manorial agricultural workers. if we compare real wages in the quinquennium 1366–70 with those for three decades later, in 1396–1400, we find that those for threshers and winnowers had risen by 48.53 per cent; those for reapers and binders, by 28.23 per cent; and those for mowers, by only 9.76 per cent.32 The nominal wage-rates for threshers in 1396–1400 were 19.36 per cent higher than in 1366–70, but they were virtually unchanged from 1371–75 to 1391–95 (having increased just before and just after those dates). Those for reapers were just 6.5 per cent higher, while those for mowers were, in fact, 11.74 per cent lower (for reasons not readily explained). This evidence suggests that the real wage gains were derived from a combination of monetary deflation and varying degrees of institutional wage-stickiness, though one possibly distorted by the calculation of national means, and by the nature of the occupations.
From the end of the fourteenth century through the first three decades of the fifteenth century, we find moderate fluctuations in the price level, but general stability in the CPi from 1396–1400 to 1426–30. During this thirty-year period, nominal wages changed overall by very modest amounts: a rise of 3.24 per cent, for threshers; a rise of 3.60 per cent for reapers, but a decline of 2.34 per cent for mowers. Consequently, the mowers suffered a small decrease of 2.34 per cent in real wages, while the first two groups enjoyed only minimal real-wage gains: 2.03 per cent and 2.50 per cent, respectively. These observations do not justify any important conclusions about relative labour scarcities during the first third of the fifteenth century.
31 Munro, ‘wage-stickiness’, pp. 95–291; Munro, ‘Before and After the Black Death’, pp. 335–64.
32 note from Tables 20–23 that the quinquennial mean real wages are computed by the harmonic mean, which is always somewhat lower than the arithmetic mean. For an explanation of these two means, see Munro, ‘wage-stickiness’, pp. 278–79, n. 83. Farmer supplied no wages for mowers before 1350.
Table 20B. national means of manorial agricultural wages in england: Piece-work rates for pro-cessing agricultural commodities (mowing and spreading) in silver pence and in index numbers (base: 1451–75 = 100) with calculations of real wages based on the Phelps Brown and hopkins Consumer Price index, 1331–35 to 1446–50
MOWING AND SPREADING PER ACRE OF PASTURE per acre of meadow lands
Years 5-year period
CPI: based on
Phelps Brown Hopkins (revised)
Mowing & Spreading per acre of
meadow Pence
Mowing & Spreading per
acre of meadow Index:
1451–75 = 100
RWI = NWI/ CPI
1451–75 = 100 Harmonic
means
1331–35 109.108
1336–40 89.2561341–45 85.5331346–50 100.0641351–55 126.472 6.452 97.486 76.7881356–60 118.092 6.181 93.381 78.6891361–65 137.976 6.328 95.605 68.7431366–70 136.460 7.618 115.102 83.4811371–75 127.345 7.641 115.444 89.9961376–80 109.891 7.505 113.391 103.1941381–85 113.190 7.811 118.009 104.1731386–90 101.233 7.392 111.681 110.1931391–95 103.953 6.883 103.985 99.5521396–1400 110.648 6.724 101.591 91.6301401–05 112.653 6.764 102.189 89.6731406–10 109.927 7.273 109.885 99.9231411–15 108.261 6.962 105.182 95.7921416–20 113.598 6.735 101.762 89.3071421–25 103.740 7.200 108.774 104.6261426–30 112.610 6.684 100.992 89.4871431–35 109.122 6.226 94.065 86.1101436–40 124.218 6.764 102.189 82.0981441–45 92.574 6.407 96.802 104.5801446–50 101.241 6.305 95.263 93.925
Sources: Consumer Prices: see the sources for Table 18. Wages: Farmer, ‘Prices and wages’, pp. 760–78, 811–17; Farmer, ‘Prices and wages, 1350–1500’, pp. 467–90, 516–24. For the Phelps Brown and Hopkins CPI: see the sources for Table 18.

314 John Munro
some useful comparisons may be made with the piece-work wage data that lord Beveridge published so long ago for threshing and winnowing on eight winchester manors, though regrettably only in decennial means.33 For the thirty-year period from 1340–49 to 1360–69, the threshers’ piece-work wages rose, on average, by 21.27 per cent, from 5.03d. to 6.10d. per quarter (= 8 bushels), and thus by less than half the rate of inflation: a 48.40 rise in the CPi. over the same period, Farmer’s ‘national wage data’ for threshers rose somewhat less: by 15.03 per cent (from 5.62 d to 6.46 d per quarter). The Beveridge wage data for threshers also continued to rise after the inflation had ceased. if we examine the threshing rates for the individual winchester manors we find that threshing rates had peaked at 7.25d. per quarter at Downton in 1370–79, at Meon in 1380–89, and at both overton and ecchinswell (itchingswell) in 1400–09. They had peaked at the higher rate of 7.50d. in wycombe in 1370–79, and at both wargrave and Farnham in 1380–89. Thereafter, those threshing rates remained fixed in all these manors until the Beveridge data terminate in the 1450s. Thus they demonstrate the same wage stickiness found in english (and Flemish) industrial wages during prolonged deflation.34
The Evidence of Manorial and Urban Wage Data for Building Craftsmen
The ‘national mean’ daily wage rates for manorial building craftsmen are pre-sented in Table 21A, but only for masters (carpenters, masons, thatcher, and tilers/ slaters). This wage-rate series is again based on Farmer’s published data, which are subject to similar caveats previously noted.35 if we focus only on car-penters, we do find the expected rise in nominal daily wages after the Black Death: by 44.47 per cent from the mean of 1341–45 (3.00d.) to the mean of 1366–70 (4.33d.); and this table also reveals the same fall in real wages, because the CPi had risen so much more during this period. while these ‘national’ wage data do not portray the same wage-stickiness found elsewhere, they do reveal a remarkable stability in nominal wages, from the early 1360s to the late 1390s, never varying by more than 1.40 per cent from the mean wage of 4.247d. for these three decades. if, however, we examine the annual wage data for carpenters
33 Beveridge, ‘wages in the winchester Manors’, pp. 22–43. Data are missing for witney and esher manors in the later fourteenth and fifteenth centuries; but the esher data are excluded from the Beveridge mean.
34 Munro, ‘wage-stickiness’, Table 6, pp. 243–44; Tables 10–15, pp. 252–63.35 see above pp. 309–11 and n. 27.
Table 21A. national means of manorial building wages in england: Daily wages for master carpen-ters and thatchers (and mates) in silver pence and in index numbers (base: 1451–75 = 100) with calculations of real wages based on the Phelps Brown and hopkins Con-sumer Price index, 1331–35 to 1446–50
CARPENTERS: MANORIAL in pence per day
THATCHER & MATES: MANORIAL in pence per day
Year
Mic
haelm
as
Five
-yea
r per
iod
Phelp
s Bro
wn
& H
opki
ns C
PI
(Rev
ised)
Car
pent
er so
lo p
er d
ay
Penc
e
Car
pent
er so
lo p
er d
ay
Inde
x: 14
51–7
5 = 10
0
Real
Wag
e Ind
ex R
WI
= N
WI/
CPI
ha
rmon
ic m
eans
That
cher
& m
ate p
er d
ay
Penc
e
That
cher
& m
ate p
er d
ay
Inde
x: 14
51–7
5 = 10
0
Real
Wag
e Ind
ex
RWI =
NW
I/C
PI
harm
onic
mea
ns
1331–35 109.108 3.243 58.877 54.050 3.792 41.639 38.0301336–40 89.256 3.136 56.945 63.373 3.882 42.625 47.8341341–45 85.533 2.999 54.444 63.364 3.553 39.011 45.5601346–50 100.064 3.293 59.786 59.090 4.204 46.156 45.1801351–55 126.472 3.524 63.992 50.181 4.682 51.413 40.6261356–60 118.092 3.956 71.835 60.774 4.608 50.591 42.6871361–65 137.976 4.188 76.040 55.102 5.333 58.558 42.3891366–70 136.460 4.332 78.654 57.697 5.685 62.418 45.7981371–75 127.345 4.194 76.154 59.602 5.887 64.635 50.7311376–80 109.891 4.194 76.154 69.304 6.066 66.606 60.7471381–85 113.190 4.319 78.427 69.095 6.171 67.756 59.6761386–90 101.233 4.207 76.381 75.388 6.119 67.181 66.2931391–95 103.953 4.269 77.518 74.465 6.313 69.317 66.2401396–1400 110.648 4.276 77.631 70.193 6.253 68.660 62.0101401–05 112.653 4.639 84.224 74.644 6.567 72.109 63.6131406–10 109.927 4.733 85.929 77.377 6.829 74.984 67.9381411–15 108.261 4.344 78.882 72.716 6.552 71.945 66.1241416–20 113.598 4.582 83.201 73.118 6.882 75.558 66.4451421–25 103.740 4.657 84.565 81.328 6.171 67.756 65.0381426–30 112.610 4.970 90.248 80.267 7.667 84.182 74.5151431–35 109.122 4.826 87.634 79.953 7.443 81.718 74.7361436–40 124.218 5.396 97.977 79.105 8.774 96.337 77.1131441–45 92.574 5.064 91.953 99.365 8.767 96.255 102.6141446–50 101.241 5.283 95.931 94.597 8.804 96.666 95.316
Sources: Consumer Prices: see the sources for Table 18. Wages: Farmer, ‘Prices and wages’, pp. 760–78, 811–17; Farmer, ‘Prices and wages, 1350–1500’, pp. 467–90, 516–24. For the Phelps Brown and Hopkins CPI: see the sources for Table 18.

The Late Medieval Decline of English Demesne Agriculture 315
some useful comparisons may be made with the piece-work wage data that lord Beveridge published so long ago for threshing and winnowing on eight winchester manors, though regrettably only in decennial means.33 For the thirty-year period from 1340–49 to 1360–69, the threshers’ piece-work wages rose, on average, by 21.27 per cent, from 5.03d. to 6.10d. per quarter (= 8 bushels), and thus by less than half the rate of inflation: a 48.40 rise in the CPi. over the same period, Farmer’s ‘national wage data’ for threshers rose somewhat less: by 15.03 per cent (from 5.62 d to 6.46 d per quarter). The Beveridge wage data for threshers also continued to rise after the inflation had ceased. if we examine the threshing rates for the individual winchester manors we find that threshing rates had peaked at 7.25d. per quarter at Downton in 1370–79, at Meon in 1380–89, and at both overton and ecchinswell (itchingswell) in 1400–09. They had peaked at the higher rate of 7.50d. in wycombe in 1370–79, and at both wargrave and Farnham in 1380–89. Thereafter, those threshing rates remained fixed in all these manors until the Beveridge data terminate in the 1450s. Thus they demonstrate the same wage stickiness found in english (and Flemish) industrial wages during prolonged deflation.34
The Evidence of Manorial and Urban Wage Data for Building Craftsmen
The ‘national mean’ daily wage rates for manorial building craftsmen are pre-sented in Table 21A, but only for masters (carpenters, masons, thatcher, and tilers/ slaters). This wage-rate series is again based on Farmer’s published data, which are subject to similar caveats previously noted.35 if we focus only on car-penters, we do find the expected rise in nominal daily wages after the Black Death: by 44.47 per cent from the mean of 1341–45 (3.00d.) to the mean of 1366–70 (4.33d.); and this table also reveals the same fall in real wages, because the CPi had risen so much more during this period. while these ‘national’ wage data do not portray the same wage-stickiness found elsewhere, they do reveal a remarkable stability in nominal wages, from the early 1360s to the late 1390s, never varying by more than 1.40 per cent from the mean wage of 4.247d. for these three decades. if, however, we examine the annual wage data for carpenters
33 Beveridge, ‘wages in the winchester Manors’, pp. 22–43. Data are missing for witney and esher manors in the later fourteenth and fifteenth centuries; but the esher data are excluded from the Beveridge mean.
34 Munro, ‘wage-stickiness’, Table 6, pp. 243–44; Tables 10–15, pp. 252–63.35 see above pp. 309–11 and n. 27.
Table 21A. national means of manorial building wages in england: Daily wages for master carpen-ters and thatchers (and mates) in silver pence and in index numbers (base: 1451–75 = 100) with calculations of real wages based on the Phelps Brown and hopkins Con-sumer Price index, 1331–35 to 1446–50
CARPENTERS: MANORIAL in pence per day
THATCHER & MATES: MANORIAL in pence per day
Year
Mic
haelm
as
Five
-yea
r per
iod
Phelp
s Bro
wn
& H
opki
ns C
PI
(Rev
ised)
Car
pent
er so
lo p
er d
ay
Penc
e
Car
pent
er so
lo p
er d
ay
Inde
x: 14
51–7
5 = 10
0
Real
Wag
e Ind
ex R
WI
= N
WI/
CPI
ha
rmon
ic m
eans
That
cher
& m
ate p
er d
ay
Penc
e
That
cher
& m
ate p
er d
ay
Inde
x: 14
51–7
5 = 10
0
Real
Wag
e Ind
ex
RWI =
NW
I/C
PI
harm
onic
mea
ns
1331–35 109.108 3.243 58.877 54.050 3.792 41.639 38.0301336–40 89.256 3.136 56.945 63.373 3.882 42.625 47.8341341–45 85.533 2.999 54.444 63.364 3.553 39.011 45.5601346–50 100.064 3.293 59.786 59.090 4.204 46.156 45.1801351–55 126.472 3.524 63.992 50.181 4.682 51.413 40.6261356–60 118.092 3.956 71.835 60.774 4.608 50.591 42.6871361–65 137.976 4.188 76.040 55.102 5.333 58.558 42.3891366–70 136.460 4.332 78.654 57.697 5.685 62.418 45.7981371–75 127.345 4.194 76.154 59.602 5.887 64.635 50.7311376–80 109.891 4.194 76.154 69.304 6.066 66.606 60.7471381–85 113.190 4.319 78.427 69.095 6.171 67.756 59.6761386–90 101.233 4.207 76.381 75.388 6.119 67.181 66.2931391–95 103.953 4.269 77.518 74.465 6.313 69.317 66.2401396–1400 110.648 4.276 77.631 70.193 6.253 68.660 62.0101401–05 112.653 4.639 84.224 74.644 6.567 72.109 63.6131406–10 109.927 4.733 85.929 77.377 6.829 74.984 67.9381411–15 108.261 4.344 78.882 72.716 6.552 71.945 66.1241416–20 113.598 4.582 83.201 73.118 6.882 75.558 66.4451421–25 103.740 4.657 84.565 81.328 6.171 67.756 65.0381426–30 112.610 4.970 90.248 80.267 7.667 84.182 74.5151431–35 109.122 4.826 87.634 79.953 7.443 81.718 74.7361436–40 124.218 5.396 97.977 79.105 8.774 96.337 77.1131441–45 92.574 5.064 91.953 99.365 8.767 96.255 102.6141446–50 101.241 5.283 95.931 94.597 8.804 96.666 95.316
Sources: Consumer Prices: see the sources for Table 18. Wages: Farmer, ‘Prices and wages’, pp. 760–78, 811–17; Farmer, ‘Prices and wages, 1350–1500’, pp. 467–90, 516–24. For the Phelps Brown and Hopkins CPI: see the sources for Table 18.

316 John Munro
on individual winchester manors we do indeed find that expected ‘wage-sticki-ness’: carpenters’ wages that are constantly at 4d. from the 1370s to the 1390s at ecchinswell, Taunton, witney (some at 5d.), and wycombe; and constantly at 5d. at esher, for these same three decades.36
in Farmer’s ‘national’ wage means for carpenters for the fifteenth century, we find another rise in nominal wages during the first-quarter: overall, by 8.91 per cent, from a mean of 4.276d. in 1396–1400 to one of 4.657d. in 1421–25. That rise parallels the rise shown in Tables 21A/B for urban carpenters. Thereafter, however, unlike these urban wage data, the ‘national’ means of nominal manorial industrial wages continue to rise (despite two quinquennial declines), reaching a mean, for carpenters, of 5.283d. in 1446–50, when they are 23.57 per cent higher than the nominal wages of the late 1390s. over this same half-century period, the real wage index (for carpenters) also rose — and even more — by 34.77 per cent.37
in nominal money values, Farmer’s ‘national’ average daily wage for manorial master carpenters in the base period 1451–75 was 5.508d., which is 91.8 per cent of the Phelps Brown and hopkins mean wage for small–town master carpenters: 6.000d. (Table 21A). At the end of the fourteenth century, Farmer’s ‘national’ average daily money wage for manorial carpenters (4.276d. in 1396–1400) was 85.52 per cent of the urban daily wage (5.000d.). earlier, in 1361–65, the gap had been even wider: 83.76 per cent (Tables 20B and 21A). This growing convergence of manorial and urban industrial wages may reflect one or even both of the following possibilities. The first possibility is a growing relative labour scarcity in rural areas, possibly in response to urban industrial competition, aided by an enhanced rural labour mobility — itself a reflection of manorial economic decline.38 The second but speculative possibility to explain this growing wage convergence is the continual abandonment of direct demesne cultivation from the 1370s to the 1420s; for that may have left only fewer and possibly more profitable manorial and higher wage-paying demesnes to record wage payments, in documents that are indeed very sparse by the mid-century.
Finally, we may supplement Farmer’s and Beveridge’s ‘wage means’, presented in Tables 22 and 23, with annual data extracted from several individual manorial accounts: for the Battle Abbey manors, westminster Abbey, Bury st edmunds Abbey manor of redgrave (suffolk), Croyland Abbey, and for eight of the winchester manors (Downton, ecchinswell, esher, ivinghoe, overton, Taunton,
36 lse Archives, Beveridge, Boxes A.30–33.37 see Table 21A: the percentage changes are calculated by the index numbers.38 see raftis, Tenure and Mobility.
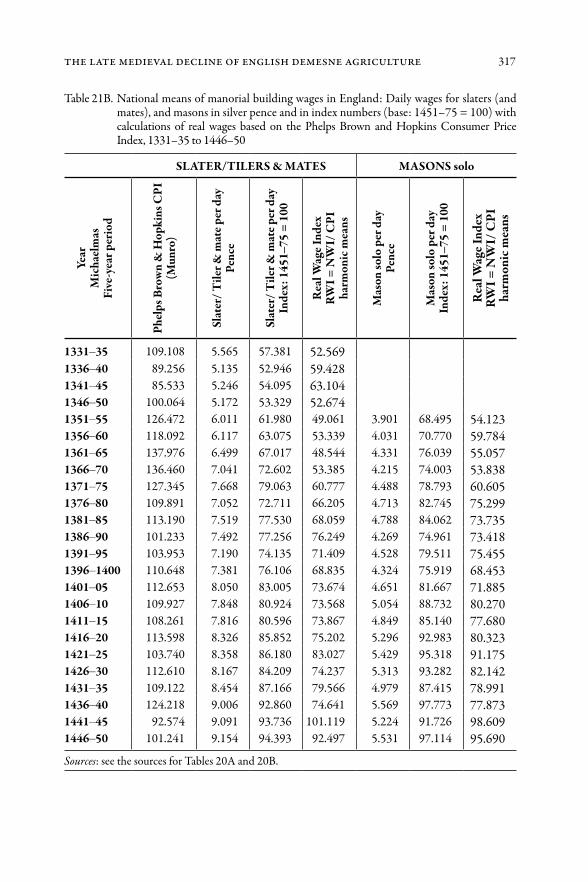
Table 21B. national means of manorial building wages in england: Daily wages for slaters (and mates), and masons in silver pence and in index numbers (base: 1451–75 = 100) with calculations of real wages based on the Phelps Brown and hopkins Consumer Price index, 1331–35 to 1446–50
SLATER/TILERS & MATES MASONS solo
Year
M
icha
elm
as
Five
-yea
r per
iod
Phel
ps B
row
n &
Hop
kins
CPI
(M
unro
)
Slat
er/ T
iler &
mat
e per
day
Pe
nce
Slat
er/ T
iler &
mat
e per
day
In
dex:
145
1–75
= 1
00
Rea
l Wag
e Ind
ex
RWI =
NW
I/ C
PI
harm
onic
mea
ns
Mas
on so
lo p
er d
ay
Penc
e
Mas
on so
lo p
er d
ay
Inde
x: 1
451–
75 =
100
Rea
l Wag
e Ind
ex
RWI =
NW
I/ C
PI
harm
onic
mea
ns
1331–35 109.108 5.565 57.381 52.5691336–40 89.256 5.135 52.946 59.4281341–45 85.533 5.246 54.095 63.1041346–50 100.064 5.172 53.329 52.6741351–55 126.472 6.011 61.980 49.061 3.901 68.495 54.1231356–60 118.092 6.117 63.075 53.339 4.031 70.770 59.7841361–65 137.976 6.499 67.017 48.544 4.331 76.039 55.0571366–70 136.460 7.041 72.602 53.385 4.215 74.003 53.8381371–75 127.345 7.668 79.063 60.777 4.488 78.793 60.6051376–80 109.891 7.052 72.711 66.205 4.713 82.745 75.2991381–85 113.190 7.519 77.530 68.059 4.788 84.062 73.7351386–90 101.233 7.492 77.256 76.249 4.269 74.961 73.4181391–95 103.953 7.190 74.135 71.409 4.528 79.511 75.4551396–1400 110.648 7.381 76.106 68.835 4.324 75.919 68.4531401–05 112.653 8.050 83.005 73.674 4.651 81.667 71.8851406–10 109.927 7.848 80.924 73.568 5.054 88.732 80.2701411–15 108.261 7.816 80.596 73.867 4.849 85.140 77.6801416–20 113.598 8.326 85.852 75.202 5.296 92.983 80.3231421–25 103.740 8.358 86.180 83.027 5.429 95.318 91.1751426–30 112.610 8.167 84.209 74.237 5.313 93.282 82.1421431–35 109.122 8.454 87.166 79.566 4.979 87.415 78.9911436–40 124.218 9.006 92.860 74.641 5.569 97.773 77.8731441–45 92.574 9.091 93.736 101.119 5.224 91.726 98.6091446–50 101.241 9.154 94.393 92.497 5.531 97.114 95.690
Sources: see the sources for Tables 20A and 20B.
The Late Medieval Decline of English Demesne Agriculture 317
on individual winchester manors we do indeed find that expected ‘wage-sticki-ness’: carpenters’ wages that are constantly at 4d. from the 1370s to the 1390s at ecchinswell, Taunton, witney (some at 5d.), and wycombe; and constantly at 5d. at esher, for these same three decades.36
in Farmer’s ‘national’ wage means for carpenters for the fifteenth century, we find another rise in nominal wages during the first-quarter: overall, by 8.91 per cent, from a mean of 4.276d. in 1396–1400 to one of 4.657d. in 1421–25. That rise parallels the rise shown in Tables 21A/B for urban carpenters. Thereafter, however, unlike these urban wage data, the ‘national’ means of nominal manorial industrial wages continue to rise (despite two quinquennial declines), reaching a mean, for carpenters, of 5.283d. in 1446–50, when they are 23.57 per cent higher than the nominal wages of the late 1390s. over this same half-century period, the real wage index (for carpenters) also rose — and even more — by 34.77 per cent.37
in nominal money values, Farmer’s ‘national’ average daily wage for manorial master carpenters in the base period 1451–75 was 5.508d., which is 91.8 per cent of the Phelps Brown and hopkins mean wage for small–town master carpenters: 6.000d. (Table 21A). At the end of the fourteenth century, Farmer’s ‘national’ average daily money wage for manorial carpenters (4.276d. in 1396–1400) was 85.52 per cent of the urban daily wage (5.000d.). earlier, in 1361–65, the gap had been even wider: 83.76 per cent (Tables 20B and 21A). This growing convergence of manorial and urban industrial wages may reflect one or even both of the following possibilities. The first possibility is a growing relative labour scarcity in rural areas, possibly in response to urban industrial competition, aided by an enhanced rural labour mobility — itself a reflection of manorial economic decline.38 The second but speculative possibility to explain this growing wage convergence is the continual abandonment of direct demesne cultivation from the 1370s to the 1420s; for that may have left only fewer and possibly more profitable manorial and higher wage-paying demesnes to record wage payments, in documents that are indeed very sparse by the mid-century.
Finally, we may supplement Farmer’s and Beveridge’s ‘wage means’, presented in Tables 22 and 23, with annual data extracted from several individual manorial accounts: for the Battle Abbey manors, westminster Abbey, Bury st edmunds Abbey manor of redgrave (suffolk), Croyland Abbey, and for eight of the winchester manors (Downton, ecchinswell, esher, ivinghoe, overton, Taunton,
36 lse Archives, Beveridge, Boxes A.30–33.37 see Table 21A: the percentage changes are calculated by the index numbers.38 see raftis, Tenure and Mobility.
Table 21B. national means of manorial building wages in england: Daily wages for slaters (and mates), and masons in silver pence and in index numbers (base: 1451–75 = 100) with calculations of real wages based on the Phelps Brown and hopkins Consumer Price index, 1331–35 to 1446–50
SLATER/TILERS & MATES MASONS solo
Year
M
icha
elm
as
Five
-yea
r per
iod
Phel
ps B
row
n &
Hop
kins
CPI
(M
unro
)
Slat
er/ T
iler &
mat
e per
day
Pe
nce
Slat
er/ T
iler &
mat
e per
day
In
dex:
145
1–75
= 1
00
Rea
l Wag
e Ind
ex
RWI =
NW
I/ C
PI
harm
onic
mea
ns
Mas
on so
lo p
er d
ay
Penc
e
Mas
on so
lo p
er d
ay
Inde
x: 1
451–
75 =
100
Rea
l Wag
e Ind
ex
RWI =
NW
I/ C
PI
harm
onic
mea
ns
1331–35 109.108 5.565 57.381 52.5691336–40 89.256 5.135 52.946 59.4281341–45 85.533 5.246 54.095 63.1041346–50 100.064 5.172 53.329 52.6741351–55 126.472 6.011 61.980 49.061 3.901 68.495 54.1231356–60 118.092 6.117 63.075 53.339 4.031 70.770 59.7841361–65 137.976 6.499 67.017 48.544 4.331 76.039 55.0571366–70 136.460 7.041 72.602 53.385 4.215 74.003 53.8381371–75 127.345 7.668 79.063 60.777 4.488 78.793 60.6051376–80 109.891 7.052 72.711 66.205 4.713 82.745 75.2991381–85 113.190 7.519 77.530 68.059 4.788 84.062 73.7351386–90 101.233 7.492 77.256 76.249 4.269 74.961 73.4181391–95 103.953 7.190 74.135 71.409 4.528 79.511 75.4551396–1400 110.648 7.381 76.106 68.835 4.324 75.919 68.4531401–05 112.653 8.050 83.005 73.674 4.651 81.667 71.8851406–10 109.927 7.848 80.924 73.568 5.054 88.732 80.2701411–15 108.261 7.816 80.596 73.867 4.849 85.140 77.6801416–20 113.598 8.326 85.852 75.202 5.296 92.983 80.3231421–25 103.740 8.358 86.180 83.027 5.429 95.318 91.1751426–30 112.610 8.167 84.209 74.237 5.313 93.282 82.1421431–35 109.122 8.454 87.166 79.566 4.979 87.415 78.9911436–40 124.218 9.006 92.860 74.641 5.569 97.773 77.8731441–45 92.574 9.091 93.736 101.119 5.224 91.726 98.6091446–50 101.241 9.154 94.393 92.497 5.531 97.114 95.690
Sources: see the sources for Tables 20A and 20B.

318 John Munro
witney, wycombe).39 For the period immediately following the Black Death, all extant manorial accounts indicate a rise in the daily money wages for master carpenters, masons, and other building craftsmen (daubers, tilers, thatchers) from about 3d. (or less) to 4d.; but, as just noted, 4d. had been the prevailing daily money wage in the 1330s (at redgrave, Croyland Abbey, westminster, and overton — though not at wycombe and ecchinswell). By the later fourteenth or early fifteenth century, the prevailing daily money wage for maser carpenters on these manors had risen from 4d. to 5d. For the 1450s (when the winchester manorial wage accounts cease), Beveridge has computed a decennial mean average daily wage of 5.23d. for carpenters on eight winchester manors.40 The analysis of the aforesaid individual various manorial accounts indicates that the following were the prevailing daily wage rates for carpenters in the 1440s and 1450s: 5d. and sometimes 6d., at ecchinswell, esher, ivinghoe, witney, and wycombe; 5d., at overton and Taunton; 5d. or 6d., at winchester College; 5d., at oakington (Croyland Abbey); 5d., at redgrave; 4d., 5d., or even 6d., at Battle Abbey (but many at 3d. or 4d. with food).41 in so far as the very sparse subsequent manorial evidence indicates, these rates prevailed into the early sixteenth century.
The overall picture of late fourteenth- and early fifteenth-century agrarian wages is quite clear. Despite the evidence for wage-stickiness and despite evidence for some periodic if modest declines in other agrarian wage data, previously cited, the costs of employing labour on english demesnes had generally risen to a very high level by the early fifteenth century, while the prices of the primary agricultural commodities (along with the consumer price index) continued to fall, sometimes sharply, during the first quarter of this century, as may be clearly seen in Tables 18 and 19. hence, the price-cost scissors was becoming even worse for so many manorial lords.
The Debate about Real Wages and Labour Productivity
while the ‘price-cost scissors’ theorem is expressed in terms of purely nominal prices and wages, the vexing question of real wages still has considerable relevance for this debate, in so far as it also concerns the important issue of changes in labour productivity. The evidence for the real-wage changes are presented in
39 lse Archives, Beveridge, Box A.33 (winchester Manors); lse Archives, Beveridge, Box F.8 (winchester College); lse Archives, Beveridge, Box G.10 (Croyland); lse Archives, Beveridge, Box G.14 (redgrave); lse Archives, Beveridge, Box h.10 (Battle Abbey).
40 Beveridge, ‘wages in the winchester Manors’, Table iii at p. 40.41 see n. 39 above.
Table 22. wages for master building craftsmen (masons and carpenters) in small towns of southern england (excluding london) compared with the Phelps Brown and hopkins (revised) Consumer Price index and with the value of the annual real wage income expressed in PBh ‘Consumer Baskets’. From 1331–35 to 1446–50 in quinquennial means (arith-metic and harmonic) rwi = nwi/CPi: real wage index = nominal wage index/Consumer Price index (base: 1451–75 = 100)
5-Year Mean
Total
Value
of P
BH B
aske
t in
penc
e (d.
ster
ling)
A
rithm
etic
PBH
Price
s Con
sum
er Pr
ice
Inde
x Mun
ro ve
rsion
14
51-7
5 = 10
0 Arit
hmeti
c
Mas
ter N
omin
al Da
y Wag
e in
penc
e (d.
ster
ling)
Ar
ithm
etic
Mas
ter M
ason
: Nom
inal
Wag
e In
dex 1
451–
75 =
100
[= 6d
. dail
y] Ar
ithm
etic
Mast
er M
ason:
Rea
l Wag
e Ind
ex
(Mun
ro) 1
451–
75 =
100
Arith
meti
c
Mast
er M
ason:
Rea
l Wag
e Ind
ex
(Mun
ro) 1
451–
75 =
100
Har
mon
ic
Mas
ter R
WI N
o. of
Bas
kets
Cons
umed
in on
e yea
r (21
0 day
s) H
arm
onic
1331–35 123.074 109.108 4.000 66.667 62.454 61.102 6.8251336–40 100.682 89.256 3.600 60.000 68.025 66.986 7.4821341–45 96.482 85.533 3.000 50.000 58.586 58.457 6.5301346–50 112.873 100.064 3.000 50.000 50.478 49.968 5.5821351–55 142.661 126.472 3.600 60.000 48.657 46.552 5.2001356–60 133.209 118.092 4.600 76.667 64.902 64.611 7.2171361–65 155.637 137.976 5.000 83.333 60.609 60.397 6.7461366–70 153.928 136.460 5.000 83.333 62.159 61.068 6.8211371–75 143.646 127.345 5.000 83.333 65.966 65.439 7.3101376–80 123.958 109.891 5.000 83.333 76.871 75.832 8.4711381–85 127.679 113.190 5.000 83.333 73.729 73.622 8.2241386–90 114.191 101.233 5.000 83.333 82.501 82.319 9.1951391–95 117.259 103.953 5.000 83.333 81.269 80.165 8.9551396–1400 124.812 110.648 5.000 83.333 75.701 75.314 8.4131401–05 127.073 112.653 5.100 85.000 76.605 75.156 8.3951406–10 123.998 109.927 5.800 96.667 88.612 88.115 9.8431411–15 122.119 108.261 6.000 100.000 92.491 92.369 10.3181416–20 128.139 113.598 6.000 100.000 88.744 88.030 9.8331421–25 117.020 103.740 6.000 100.000 96.599 96.395 10.7671426–30 127.025 112.610 6.000 100.000 90.703 88.802 9.9191431–35 123.090 109.122 6.000 100.000 91.801 91.641 10.2361436–40 140.118 124.218 6.000 100.000 84.039 80.504 8.9921441–45 104.424 92.574 6.000 100.000 108.344 108.022 12.0661446–50 114.200 101.241 6.000 100.000 98.912 98.774 11.033Sources: English consumer prices: see the sources for Table 18. Wages for building craftsmen (masters and labourers): Phelps Brown and hopkins, ‘seven Centuries of Building wages’; Munro, ‘Builders’ wages in southern england and the southern low Countries’.

The Late Medieval Decline of English Demesne Agriculture 319
witney, wycombe).39 For the period immediately following the Black Death, all extant manorial accounts indicate a rise in the daily money wages for master carpenters, masons, and other building craftsmen (daubers, tilers, thatchers) from about 3d. (or less) to 4d.; but, as just noted, 4d. had been the prevailing daily money wage in the 1330s (at redgrave, Croyland Abbey, westminster, and overton — though not at wycombe and ecchinswell). By the later fourteenth or early fifteenth century, the prevailing daily money wage for maser carpenters on these manors had risen from 4d. to 5d. For the 1450s (when the winchester manorial wage accounts cease), Beveridge has computed a decennial mean average daily wage of 5.23d. for carpenters on eight winchester manors.40 The analysis of the aforesaid individual various manorial accounts indicates that the following were the prevailing daily wage rates for carpenters in the 1440s and 1450s: 5d. and sometimes 6d., at ecchinswell, esher, ivinghoe, witney, and wycombe; 5d., at overton and Taunton; 5d. or 6d., at winchester College; 5d., at oakington (Croyland Abbey); 5d., at redgrave; 4d., 5d., or even 6d., at Battle Abbey (but many at 3d. or 4d. with food).41 in so far as the very sparse subsequent manorial evidence indicates, these rates prevailed into the early sixteenth century.
The overall picture of late fourteenth- and early fifteenth-century agrarian wages is quite clear. Despite the evidence for wage-stickiness and despite evidence for some periodic if modest declines in other agrarian wage data, previously cited, the costs of employing labour on english demesnes had generally risen to a very high level by the early fifteenth century, while the prices of the primary agricultural commodities (along with the consumer price index) continued to fall, sometimes sharply, during the first quarter of this century, as may be clearly seen in Tables 18 and 19. hence, the price-cost scissors was becoming even worse for so many manorial lords.
The Debate about Real Wages and Labour Productivity
while the ‘price-cost scissors’ theorem is expressed in terms of purely nominal prices and wages, the vexing question of real wages still has considerable relevance for this debate, in so far as it also concerns the important issue of changes in labour productivity. The evidence for the real-wage changes are presented in
39 lse Archives, Beveridge, Box A.33 (winchester Manors); lse Archives, Beveridge, Box F.8 (winchester College); lse Archives, Beveridge, Box G.10 (Croyland); lse Archives, Beveridge, Box G.14 (redgrave); lse Archives, Beveridge, Box h.10 (Battle Abbey).
40 Beveridge, ‘wages in the winchester Manors’, Table iii at p. 40.41 see n. 39 above.
Table 22. wages for master building craftsmen (masons and carpenters) in small towns of southern england (excluding london) compared with the Phelps Brown and hopkins (revised) Consumer Price index and with the value of the annual real wage income expressed in PBh ‘Consumer Baskets’. From 1331–35 to 1446–50 in quinquennial means (arith-metic and harmonic) rwi = nwi/CPi: real wage index = nominal wage index/Consumer Price index (base: 1451–75 = 100)
5-Year Mean
Total
Value
of P
BH B
aske
t in
penc
e (d.
ster
ling)
A
rithm
etic
PBH
Price
s Con
sum
er Pr
ice
Inde
x Mun
ro ve
rsion
14
51-7
5 = 10
0 Arit
hmeti
c
Mas
ter N
omin
al Da
y Wag
e in
penc
e (d.
ster
ling)
Ar
ithm
etic
Mas
ter M
ason
: Nom
inal
Wag
e In
dex 1
451–
75 =
100
[= 6d
. dail
y] Ar
ithm
etic
Mast
er M
ason:
Rea
l Wag
e Ind
ex
(Mun
ro) 1
451–
75 =
100
Arith
meti
c
Mast
er M
ason:
Rea
l Wag
e Ind
ex
(Mun
ro) 1
451–
75 =
100
Har
mon
ic
Mas
ter R
WI N
o. of
Bas
kets
Cons
umed
in on
e yea
r (21
0 day
s) H
arm
onic
1331–35 123.074 109.108 4.000 66.667 62.454 61.102 6.8251336–40 100.682 89.256 3.600 60.000 68.025 66.986 7.4821341–45 96.482 85.533 3.000 50.000 58.586 58.457 6.5301346–50 112.873 100.064 3.000 50.000 50.478 49.968 5.5821351–55 142.661 126.472 3.600 60.000 48.657 46.552 5.2001356–60 133.209 118.092 4.600 76.667 64.902 64.611 7.2171361–65 155.637 137.976 5.000 83.333 60.609 60.397 6.7461366–70 153.928 136.460 5.000 83.333 62.159 61.068 6.8211371–75 143.646 127.345 5.000 83.333 65.966 65.439 7.3101376–80 123.958 109.891 5.000 83.333 76.871 75.832 8.4711381–85 127.679 113.190 5.000 83.333 73.729 73.622 8.2241386–90 114.191 101.233 5.000 83.333 82.501 82.319 9.1951391–95 117.259 103.953 5.000 83.333 81.269 80.165 8.9551396–1400 124.812 110.648 5.000 83.333 75.701 75.314 8.4131401–05 127.073 112.653 5.100 85.000 76.605 75.156 8.3951406–10 123.998 109.927 5.800 96.667 88.612 88.115 9.8431411–15 122.119 108.261 6.000 100.000 92.491 92.369 10.3181416–20 128.139 113.598 6.000 100.000 88.744 88.030 9.8331421–25 117.020 103.740 6.000 100.000 96.599 96.395 10.7671426–30 127.025 112.610 6.000 100.000 90.703 88.802 9.9191431–35 123.090 109.122 6.000 100.000 91.801 91.641 10.2361436–40 140.118 124.218 6.000 100.000 84.039 80.504 8.9921441–45 104.424 92.574 6.000 100.000 108.344 108.022 12.0661446–50 114.200 101.241 6.000 100.000 98.912 98.774 11.033Sources: English consumer prices: see the sources for Table 18. Wages for building craftsmen (masters and labourers): Phelps Brown and hopkins, ‘seven Centuries of Building wages’; Munro, ‘Builders’ wages in southern england and the southern low Countries’.

320 John Munro
Tables 20–23.42 The previously advanced thesis (that the rise of real wages from the 1370s to about 1400 was due essentially to a combination of monetary deflation and downward wage-stickiness) fails, however, to explain the early fifteenth-century rise in real wages for industrial craftsmen, both manorial and urban. why did their nominal wages rise even more, without any significant adjustments in the Consumer Price index? As noted earlier, however, the evidence for purely agricultural manorial workers (threshers, reapers, mowers) is mixed, without any consistent overall trend in either nominal or real wages.43 we may well ask how the english economy produced and maintained or justified any sustained rise in nominal wages in and from the early fifteenth century. was it primarily a question of increased labour productivity, or of Total Factor Productivity (combining land, labour, and capital)? For one answer (but not a definitive one), we may revert to the alternative formula of the real wage, which now must be properly defined as: rw = MrPl: that is, the real wage is a function of the Marginal Revenue Product of Labour. Thus, if the worker’s labour productivity rose but the real market value of his output fell, the expected increase in his real wage would have been indeterminate (or even negative).
in this respect, we should reconsider the ricardian argument advanced earlier in this study, and the one that most economic historians continue to favour: namely, that the post-plague fall in population and the consequent alteration of the land:labour ratio necessarily led to a sharp rise in labour productivity. indeed, Gregory Clark, in a recent article, stoutly defending the Malthusian-ricardian approach to european economic history, has presented two dramatic graphs on this issue. The first shows a tripling of labour productivity in english agriculture, apparent from immediately after the Black Death, reaching its peak in the mid-fifteenth century; and the second shows a comparable tripling in agricultural real wages over this same period.44 The evidence presented in this study, while certainly substantiating the view that real agrarian wages ultimately did rise (from the 1370s), does not support Clark’s conclusion that they ‘tripled’.45
There are two major problems in using the ricardian ‘real wage’ model on ris-ing labour productivity to explain a price-cost squeeze, and specifically one that led to the abandonment of manorial demesne cultivation. The first is theoretical.
42 see Munro, ‘wage-stickiness’, pp. 185–297.43 see above, pp. 312–13. Downward wage-stickiness once again became important during
the second deflationary ‘bullion famine’ from the 1440s to the 1470s, for both england and the low Countries. see Munro, ‘wage-stickiness’, pp. 217–30.
44 Clark, ‘The long March of history’, Figure 2, p. 104; Figure 3, p. 106; and Figure 4, p. 109.45 see above, pp. 315–19.
Table 23. wages for labourers of master building craftsmen in small towns of southern england (excluding london). Compared with the revised Phelps Brown and hopkins ‘ Basket of Consumables’ Consumer Price index and with the annual real wage income expressed in PBh ‘Consumer Baskets’ in quinquennial means (arithmetic and harmonic), 1331–35 to 1446–50, base: 1451–75=100 rwi = nwi/CPi: real wage index = nominal wage index/Consumer Price index
5-Year Means
PBH
Pric
es C
onsu
mer
Pric
e In
dex R
evise
d ve
rsio
n
1451
–75 =
100 A
rithm
etic
Labo
urer
Nom
inal
Day
W
age i
n pe
nce (
d. st
erlin
g)
Arith
met
ic
Labo
urer
’s W
age
as P
erce
ntag
e of M
aste
r Ar
ithm
etic
Mas
on L
abou
rer N
omin
al
Wag
e Ind
ex 14
51–7
5 = 10
0 [=
4d. d
aily
] Arit
hmet
ic
Mas
on L
abou
rer R
eal
Wag
e Ind
ex (M
unro
) 14
51–7
5 = 10
0 Arit
hmet
ic
Mas
on L
abou
rer R
eal
Wag
e Ind
ex (M
unro
) 14
51–7
5 = 10
0 Har
mon
ic
Labo
urer
RW
I N
o. o
f Bas
kets
Con
sum
ed in
on
e yea
r (21
0 day
s) H
arm
onic
1331–35 109.108 2.000 50.00% 50.000 46.841 45.826 3.4131336–40 89.256 1.800 50.00% 45.000 51.019 50.239 3.7411341–45 85.533 1.500 50.00% 37.500 43.939 43.843 3.2651346–50 100.064 1.500 50.00% 37.500 37.858 37.476 2.7911351–55 126.472 1.800 50.00% 45.000 36.492 34.914 2.6001356–60 118.092 2.600 56.22% 65.000 54.943 54.039 4.0241361–65 137.976 3.000 60.00% 75.000 54.548 54.357 4.0481366–70 136.460 3.000 60.00% 75.000 55.943 54.961 4.0931371–75 127.345 3.000 60.00% 75.000 59.369 58.895 4.3861376–80 109.891 3.000 60.00% 75.000 69.184 68.249 5.0821381–85 113.190 3.000 60.00% 75.000 66.357 66.260 4.9341386–90 101.233 3.000 60.00% 75.000 74.251 74.087 5.5171391–95 103.953 3.000 60.00% 75.000 73.142 72.148 5.3731396–1400 110.648 3.000 60.00% 75.000 68.131 67.782 5.0481401–05 112.653 3.200 62.73% 80.000 72.499 70.065 5.2181406–10 109.927 3.800 65.45% 95.000 86.910 86.562 6.4461411–15 108.261 4.000 66.67% 100.000 92.491 92.369 6.8791416–20 113.598 4.000 66.67% 100.000 88.744 88.030 6.5551421–25 103.740 4.000 66.67% 100.000 96.599 96.395 7.1781426–30 112.610 4.000 66.67% 100.000 90.703 88.802 6.6131431–35 109.122 4.000 66.67% 100.000 91.801 91.801 6.8241436–40 124.218 4.000 66.67% 100.000 84.039 80.504 5.9951441–45 92.574 4.000 66.67% 100.000 108.344 108.022 8.0441446–50 101.241 4.000 66.67% 100.000 98.912 98.774 7.356
Sources: see the sources for Table 22.

The Late Medieval Decline of English Demesne Agriculture 321
Tables 20–23.42 The previously advanced thesis (that the rise of real wages from the 1370s to about 1400 was due essentially to a combination of monetary deflation and downward wage-stickiness) fails, however, to explain the early fifteenth-century rise in real wages for industrial craftsmen, both manorial and urban. why did their nominal wages rise even more, without any significant adjustments in the Consumer Price index? As noted earlier, however, the evidence for purely agricultural manorial workers (threshers, reapers, mowers) is mixed, without any consistent overall trend in either nominal or real wages.43 we may well ask how the english economy produced and maintained or justified any sustained rise in nominal wages in and from the early fifteenth century. was it primarily a question of increased labour productivity, or of Total Factor Productivity (combining land, labour, and capital)? For one answer (but not a definitive one), we may revert to the alternative formula of the real wage, which now must be properly defined as: rw = MrPl: that is, the real wage is a function of the Marginal Revenue Product of Labour. Thus, if the worker’s labour productivity rose but the real market value of his output fell, the expected increase in his real wage would have been indeterminate (or even negative).
in this respect, we should reconsider the ricardian argument advanced earlier in this study, and the one that most economic historians continue to favour: namely, that the post-plague fall in population and the consequent alteration of the land:labour ratio necessarily led to a sharp rise in labour productivity. indeed, Gregory Clark, in a recent article, stoutly defending the Malthusian-ricardian approach to european economic history, has presented two dramatic graphs on this issue. The first shows a tripling of labour productivity in english agriculture, apparent from immediately after the Black Death, reaching its peak in the mid-fifteenth century; and the second shows a comparable tripling in agricultural real wages over this same period.44 The evidence presented in this study, while certainly substantiating the view that real agrarian wages ultimately did rise (from the 1370s), does not support Clark’s conclusion that they ‘tripled’.45
There are two major problems in using the ricardian ‘real wage’ model on ris-ing labour productivity to explain a price-cost squeeze, and specifically one that led to the abandonment of manorial demesne cultivation. The first is theoretical.
42 see Munro, ‘wage-stickiness’, pp. 185–297.43 see above, pp. 312–13. Downward wage-stickiness once again became important during
the second deflationary ‘bullion famine’ from the 1440s to the 1470s, for both england and the low Countries. see Munro, ‘wage-stickiness’, pp. 217–30.
44 Clark, ‘The long March of history’, Figure 2, p. 104; Figure 3, p. 106; and Figure 4, p. 109.45 see above, pp. 315–19.
Table 23. wages for labourers of master building craftsmen in small towns of southern england (excluding london). Compared with the revised Phelps Brown and hopkins ‘ Basket of Consumables’ Consumer Price index and with the annual real wage income expressed in PBh ‘Consumer Baskets’ in quinquennial means (arithmetic and harmonic), 1331–35 to 1446–50, base: 1451–75=100 rwi = nwi/CPi: real wage index = nominal wage index/Consumer Price index
5-Year Means
PBH
Pric
es C
onsu
mer
Pric
e In
dex R
evise
d ve
rsio
n
1451
–75 =
100 A
rithm
etic
Labo
urer
Nom
inal
Day
W
age i
n pe
nce (
d. st
erlin
g)
Arith
met
ic
Labo
urer
’s W
age
as P
erce
ntag
e of M
aste
r Ar
ithm
etic
Mas
on L
abou
rer N
omin
al
Wag
e Ind
ex 14
51–7
5 = 10
0 [=
4d. d
aily
] Arit
hmet
ic
Mas
on L
abou
rer R
eal
Wag
e Ind
ex (M
unro
) 14
51–7
5 = 10
0 Arit
hmet
ic
Mas
on L
abou
rer R
eal
Wag
e Ind
ex (M
unro
) 14
51–7
5 = 10
0 Har
mon
ic
Labo
urer
RW
I N
o. o
f Bas
kets
Con
sum
ed in
on
e yea
r (21
0 day
s) H
arm
onic
1331–35 109.108 2.000 50.00% 50.000 46.841 45.826 3.4131336–40 89.256 1.800 50.00% 45.000 51.019 50.239 3.7411341–45 85.533 1.500 50.00% 37.500 43.939 43.843 3.2651346–50 100.064 1.500 50.00% 37.500 37.858 37.476 2.7911351–55 126.472 1.800 50.00% 45.000 36.492 34.914 2.6001356–60 118.092 2.600 56.22% 65.000 54.943 54.039 4.0241361–65 137.976 3.000 60.00% 75.000 54.548 54.357 4.0481366–70 136.460 3.000 60.00% 75.000 55.943 54.961 4.0931371–75 127.345 3.000 60.00% 75.000 59.369 58.895 4.3861376–80 109.891 3.000 60.00% 75.000 69.184 68.249 5.0821381–85 113.190 3.000 60.00% 75.000 66.357 66.260 4.9341386–90 101.233 3.000 60.00% 75.000 74.251 74.087 5.5171391–95 103.953 3.000 60.00% 75.000 73.142 72.148 5.3731396–1400 110.648 3.000 60.00% 75.000 68.131 67.782 5.0481401–05 112.653 3.200 62.73% 80.000 72.499 70.065 5.2181406–10 109.927 3.800 65.45% 95.000 86.910 86.562 6.4461411–15 108.261 4.000 66.67% 100.000 92.491 92.369 6.8791416–20 113.598 4.000 66.67% 100.000 88.744 88.030 6.5551421–25 103.740 4.000 66.67% 100.000 96.599 96.395 7.1781426–30 112.610 4.000 66.67% 100.000 90.703 88.802 6.6131431–35 109.122 4.000 66.67% 100.000 91.801 91.801 6.8241436–40 124.218 4.000 66.67% 100.000 84.039 80.504 5.9951441–45 92.574 4.000 66.67% 100.000 108.344 108.022 8.0441446–50 101.241 4.000 66.67% 100.000 98.912 98.774 7.356
Sources: see the sources for Table 22.

322 John Munro
if rising ‘real’ wages had been the product of an increasing marginal productivity of labour, with a much smaller quantity of more efficient labour working far better residual lands, why would manorial landlords have been concerned? For their total wage bill, with fewer workers per arable acre, might have decreased, not increased. Furthermore, why would any medieval english landlord have been concerned if his hired labourers earned a higher ‘real’ wage because their cost of living had fallen, with so much cheaper foodstuffs? To be sure, in accordance with ricardian theory, the economic rent (‘ricardian surplus’) on his demesne lands would have declined over time, but we may doubt that such manorial lords would have gained any more by leasing such lands at a presumably lower annual rental income. Answers to this first problem may be found in an examination of the second problem.
The second problem concerns the evidence on arable labour productivity, evidence that Clark neglected to consider. several recent studies indicate that labour productivity in arable agriculture very likely fell, not rose, from the Black Death to the late fourteenth century, though they do not explain this paradox.46 one possible solution is revealed in earlier studies of Bruce Campbell. he had utilized esther Boserup’s well known demographic-agrarian thesis to contend that, in the later thirteenth and early fourteenth centuries, growing population pressures on relatively inelastic supplies of arable land had provided the requisite spur for innovations that led to productivity increases, especially in multiple-course crop rotations designed to reduce the proportion of land in fallow.47 The subsequent fall in population, especially after the Black Death, resulting (as already noted) in more abundant supplies of land and falling grain prices, thus evidently removed the incentives to use the more advanced fallow-reducing techniques. At the same time, many of those techniques were labour intensive, so that labour scarcities may have prevented their proper implementation.
Tables in Campbell’s recent publications clearly demonstrate a steady decline in crop yields and thus in agricultural productivity (Total Factor Productivity), following the Black Death, and well into the fifteenth century. in norfolk, the weighted annual cereal yields fell from a mean of 11.9 bushels per acre in 1325–49 to one of 8.0 bushels per acre in 1400–24.48 Various other various studies (raftis,
46 raftis, ‘Peasants and the Collapse of the Manorial economy’, pp. 191–206; Farmer, ‘The Famuli’. see also: stone, ‘Medieval Farm Management and Technological Mentalities’; stone, ‘The Productivity of hired and Customary labour’; stone, ‘The Productivity and Management of sheep’; stone, Decision-Making in Medieval Agriculture.
47 Boserup, Population and Technological Change; Campbell, ‘Agricultural Progress in Medieval england’; Campbell, ‘Arable Productivity in Medieval england’; and Campbell, ‘Progressiveness and Backwardness’.
48 Campbell and overton, ‘A new Perspective’, esp. Table 5, p. 70; Campbell, English

The Late Medieval Decline of English Demesne Agriculture 323
Farmer, stone, Dyer) on arable productivity in post-Plague english agriculture also indicate, however, a corresponding rise in labour productivity in pastoral or livestock agriculture, in that fewer persons were employed to look after a given flock of sheep or herd of cattle.49
The Shift from Manorial Arable to Pastoral (Livestock) Agriculture: Price Incentives and Evidence
Changes in relative agricultural prices in the later fourteenth century further explain why many manorial landlords, in retaining their demesnes, shifted more and more from arable to pastoral agriculture, though not necessarily in the form of wool-growing. As previously noted, and as may be seen again in Table 19, relative commodity prices clearly moved in favour of livestock products, especially meats and dairy products, though that favourable movement did not persist into the fifteenth century, except briefly for dairy products.50 Furthermore, Christopher Dyer has contended that the sustained rise of real wages, by the later fourteenth century, had led to a substantial increase in the consumption of meat and dairy products.51
To substantiate this thesis of a shift from arable to pastoral agriculture, we may cite Bruce Campbell’s abundant evidence on the use of manorial demesne lands for arable and livestock agriculture. he found that arable sown areas fell from a mean of 172.10 acres (or 69.65 hectares) per demesne (‘retained in hand’) in 1300–49 to a one of 147.10 acres in 1350–99 and then to one of 142.80 acres in 1400–50: an overall decline of 17.02 per cent. over these same three periods, the percentage sown in grain (as opposed to legumes, etc.) fell from 90.47 per cent to 82.21 per cent of total sown acreage. For those ‘home’ counties servicing the
Seigniorial Agriculture, Table 7.13, p. 374; Campbell, ‘Matching supply to Demand’, Tables 4–5, pp. 837, 840.
49 see sources cited in n. 46 above; and see also Dyer, Lords and Peasants in a Changing Society, pp. 150–51: noting that, on the worcester manors, in 1449–50, one shepherd managed flocks of 400–500 sheep, compared to a ratio of one shepherd to 250–300 sheep on these manors in the late 1380s.
50 in these commodity price ratios the price-index for the commodity being considered is the numerator, and that for the product being compared is the denominator. if the ratio moves above 100, the change favours the first product (numerator), if the ratio falls below 100, the change favours the other product (denominator).
51 Dyer, ‘english Diet’; Dyer, ‘Changes in Diet’; Dyer, Standards of Living, especially chaps 5–8; Dyer, ‘The Consumer and the Market’. see Revolution and Consumption, ed. by hicks.

324 John Munro
london market, during a different set of comparisons periods, 1288–1315 and 1375–99, the mean cropped or sown arable demesne areas fell even more: 23.21 per cent, from a mean of 224.0 acres to one of 172.0 acres.52 Campbell’s other tables make clear that a corresponding shift to livestock raising had taken place on the surviving demesnes. From the first half of the fourteenth century through the first half of the fifteenth, mean livestock units, per 100 grain acres in demesne, increased from 64.80 units to 89.30 units.53 Finally, his statistical tables also demonstrate a relative shift in manorial demesne incomes from their arable to their livestock sectors, between the late thirteenth and late fourteenth centuries. in the period 1288–1315, in the counties servicing the london market, manorial demesne revenues from arable lands constituted 64.40 per cent of the total, and livestock for the remaining 35.60 per cent. For 1375–1400, the proportions were almost reversed: only 47.80 per cent of incomes came from arable agriculture and the remaining 52.20 per cent came from livestock raising.54
The Economics of Wool Production and of Wool Exports in the Fourteenth Century
nevertheless, the relative shift from arable to pastoral farming, even in the classic Midlands manorial zone of ‘sheep-corn’ husbandry, had not necessarily favoured wool production per se. rather, as Tables 19 and 24 indicate, changes in the relative prices ratios, from the 1380s, became more favourable to meat and to dairy products than to wools. of much more concern for many manorial land-
52 Campbell, ‘Matching supply to Demand’, Tables 4–5, pp. 837, 840; Campbell, English Seigniorial Agriculture, Table 4.07, pp. 174–75.
53 Campbell, English Seigniorial Agriculture, Table 4.07, pp. 174–75. ‘All national means are the weighted product of six regional means: norfolk, eastern counties, southeast, midlands, south-west, and the north: 41 counties and districts’. The livestock units are: horses = 1.0; oxen and adult cattle = 1.2; immature cattle = 0.8; sheep and swine = 0.1.
54 Campbell, English Seigniorial Agriculture, Table 4.10, pp. 184–85.
Table 24. Prices and price indexes for wools, livestock products and the Phelps Brown and hopkins Composite Price index, and wool export taxes, in quinquennial means, from 1331–35 to 1446–50 (base: 1451–75 = 100)
Year
5-
year
mea
ns
All W
ools:
Mea
n Pric
es
per S
ack£
ster
ling
Woo
l Pric
e Ind
ex:
1451
–75 =
100
£3.4
917
Bette
r Woo
ls:* M
ean P
rice
per s
ack £
ster
ling
Bette
r Woo
ls:* P
rice I
ndex
14
51–7
5 = 10
0 £4
.854
4
CPI:
Phelp
s Bro
wn &
Hop
kins
14
51–7
5 = 10
0
Den
izen E
xpor
t Dut
ies
on W
ool S
acks
shill
ings
Den
izen E
xpor
t Dut
ies as
Per
cen -
tage
of P
rices
for B
ette
r Woo
ls
Alien
Exp
ort D
uties
on W
ool
Sack
s shi
lling
s
Alien
Exp
ort D
uties
as P
erce
ntag
e of
Pric
es fo
r Bet
ter W
ools
1331–35 5.031 144.080 5.370 110.610 109.108 10.373 9.66% 14.559 13.56%1336–40 4.264 122.110 4.646 95.700 89.256 29.556 31.81% 41.501 44.67%1341–45 4.498 128.830 4.947 101.910 85.533 40.247 40.68% 43.333 43.80%1346–50 4.222 120.910 4.713 97.090 100.064 40.000 42.43% 43.333 45.97%1351–55 3.923 112.360 4.446 91.580 126.472 40.000 44.99% 43.333 48.74%1356–60 4.050 116.000 5.243 108.010 118.092 40.000 38.14% 43.333 41.32%1361–65 4.306 123.310 5.606 115.470 137.976 44.110 39.34% 46.110 41.13%1366–70 5.624 161.080 6.689 137.800 136.460 49.650 37.11% 50.000 37.37%1371–75 6.422 183.920 7.895 162.640 127.345 51.584 32.67% 53.333 33.78%1376–80 6.582 188.490 7.536 155.240 109.891 51.584 34.22% 53.333 35.38%1381–85 5.097 145.960 5.995 123.490 113.190 51.584 43.02% 53.333 44.48%1386–90 4.111 117.740 5.071 104.460 101.233 50.100 49.40% 52.166 51.43%1391–95 4.266 122.170 4.953 102.040 103.953 51.414 51.90% 53.163 53.66%1396–1400 4.814 137.860 5.241 107.970 110.648 51.584 49.21% 56.555 53.95%1401–05 5.065 145.050 5.702 117.460 112.653 52.771 46.28% 61.187 53.66%1406–10 4.974 142.440 6.219 128.114 109.927 51.584 41.47% 60.000 48.24%1411–15 5.426 155.380 5.954 122.650 108.261 51.584 43.32% 60.000 50.39%1416–20 4.155 119.000 4.592 94.590 113.598 51.584 56.17% 68.000 74.05%1421–25 4.205 120.420 5.269 108.540 103.740 45.425 43.11% 62.658 59.46%1426–30 4.613 132.110 5.015 103.300 112.610 51.584 41.46% 53.333 53.18%1431–35 4.928 141.130 5.613 115.630 109.122 41.584 37.04% 57.103 50.86%1436–40 4.440 127.160 5.322 109.630 124.218 41.584 39.07% 62.267 58.50%1441–45 4.188 119.930 5.201 107.150 92.574 41.584 39.97% 63.333 60.88%1446–50 4.119 117.960 5.379 110.800 101.241 41.584 38.66% 63.333 58.88%
* Prices for wools from wiltshire, hampshire, and st swithin’s manors (all of the bishop of winchester’s manors), wiltshire and the Berkshire Downs, the Vale of white horse to Thames Valley; oxfordshire, Berkshire, and adjacent parts of wiltshire; worcestershire, the Cotswolds (oxfordshire, Gloucestershire, and adjacent parts of wiltshire); the Chilterns (oxfordshire, Buckinghamshire, hertfordshire); north-east oxfordshire and north Buckinghamshire.
Sources for Table 24: English Wood Prices: lloyd, The Movement of Wool Prices, statistical Appendix, pp. 35–51, cols 2–5, 10–13; English Wool Export Duties, including the Calais duty on denizen exports to Calais (from 1363): Calendar of the Fine Rolls, iv (Edward II, 1327–1337) to xxi (Edward IV, Edward V, Richard III, 1471–1485); Rotuli parliamentorum, ii–v; Barnes, ‘The Taxation of wool’; Gras, The Early English Customs System, pp. 75–80; Carus-wilson and Coleman, England’s Export Trade, pp. 194–96; ormrod, ‘The Crown and the english economy’. Comsumer Prices (based upon the Phelps Brown and Hopkins ‘Basket of Consumables’ Price Index: lse Archives, Phelps Brown, Box ia:324, lse Archives, Phelps Brown, Box J.iV.2.a. see also the sources for Table 18.

The Late Medieval Decline of English Demesne Agriculture 325
london market, during a different set of comparisons periods, 1288–1315 and 1375–99, the mean cropped or sown arable demesne areas fell even more: 23.21 per cent, from a mean of 224.0 acres to one of 172.0 acres.52 Campbell’s other tables make clear that a corresponding shift to livestock raising had taken place on the surviving demesnes. From the first half of the fourteenth century through the first half of the fifteenth, mean livestock units, per 100 grain acres in demesne, increased from 64.80 units to 89.30 units.53 Finally, his statistical tables also demonstrate a relative shift in manorial demesne incomes from their arable to their livestock sectors, between the late thirteenth and late fourteenth centuries. in the period 1288–1315, in the counties servicing the london market, manorial demesne revenues from arable lands constituted 64.40 per cent of the total, and livestock for the remaining 35.60 per cent. For 1375–1400, the proportions were almost reversed: only 47.80 per cent of incomes came from arable agriculture and the remaining 52.20 per cent came from livestock raising.54
The Economics of Wool Production and of Wool Exports in the Fourteenth Century
nevertheless, the relative shift from arable to pastoral farming, even in the classic Midlands manorial zone of ‘sheep-corn’ husbandry, had not necessarily favoured wool production per se. rather, as Tables 19 and 24 indicate, changes in the relative prices ratios, from the 1380s, became more favourable to meat and to dairy products than to wools. of much more concern for many manorial land-
52 Campbell, ‘Matching supply to Demand’, Tables 4–5, pp. 837, 840; Campbell, English Seigniorial Agriculture, Table 4.07, pp. 174–75.
53 Campbell, English Seigniorial Agriculture, Table 4.07, pp. 174–75. ‘All national means are the weighted product of six regional means: norfolk, eastern counties, southeast, midlands, south-west, and the north: 41 counties and districts’. The livestock units are: horses = 1.0; oxen and adult cattle = 1.2; immature cattle = 0.8; sheep and swine = 0.1.
54 Campbell, English Seigniorial Agriculture, Table 4.10, pp. 184–85.
Table 24. Prices and price indexes for wools, livestock products and the Phelps Brown and hopkins Composite Price index, and wool export taxes, in quinquennial means, from 1331–35 to 1446–50 (base: 1451–75 = 100)
Year
5-
year
mea
ns
All W
ools:
Mea
n Pric
es
per S
ack£
ster
ling
Woo
l Pric
e Ind
ex:
1451
–75 =
100
£3.4
917
Bette
r Woo
ls:* M
ean P
rice
per s
ack £
ster
ling
Bette
r Woo
ls:* P
rice I
ndex
14
51–7
5 = 10
0 £4
.854
4
CPI:
Phelp
s Bro
wn &
Hop
kins
14
51–7
5 = 10
0
Den
izen E
xpor
t Dut
ies
on W
ool S
acks
shill
ings
Den
izen E
xpor
t Dut
ies as
Per
cen-
tage
of P
rices
for B
ette
r Woo
ls
Alien
Exp
ort D
uties
on W
ool
Sack
s shi
lling
s
Alien
Exp
ort D
uties
as P
erce
ntag
e of
Pric
es fo
r Bet
ter W
ools
1331–35 5.031 144.080 5.370 110.610 109.108 10.373 9.66% 14.559 13.56%1336–40 4.264 122.110 4.646 95.700 89.256 29.556 31.81% 41.501 44.67%1341–45 4.498 128.830 4.947 101.910 85.533 40.247 40.68% 43.333 43.80%1346–50 4.222 120.910 4.713 97.090 100.064 40.000 42.43% 43.333 45.97%1351–55 3.923 112.360 4.446 91.580 126.472 40.000 44.99% 43.333 48.74%1356–60 4.050 116.000 5.243 108.010 118.092 40.000 38.14% 43.333 41.32%1361–65 4.306 123.310 5.606 115.470 137.976 44.110 39.34% 46.110 41.13%1366–70 5.624 161.080 6.689 137.800 136.460 49.650 37.11% 50.000 37.37%1371–75 6.422 183.920 7.895 162.640 127.345 51.584 32.67% 53.333 33.78%1376–80 6.582 188.490 7.536 155.240 109.891 51.584 34.22% 53.333 35.38%1381–85 5.097 145.960 5.995 123.490 113.190 51.584 43.02% 53.333 44.48%1386–90 4.111 117.740 5.071 104.460 101.233 50.100 49.40% 52.166 51.43%1391–95 4.266 122.170 4.953 102.040 103.953 51.414 51.90% 53.163 53.66%1396–1400 4.814 137.860 5.241 107.970 110.648 51.584 49.21% 56.555 53.95%1401–05 5.065 145.050 5.702 117.460 112.653 52.771 46.28% 61.187 53.66%1406–10 4.974 142.440 6.219 128.114 109.927 51.584 41.47% 60.000 48.24%1411–15 5.426 155.380 5.954 122.650 108.261 51.584 43.32% 60.000 50.39%1416–20 4.155 119.000 4.592 94.590 113.598 51.584 56.17% 68.000 74.05%1421–25 4.205 120.420 5.269 108.540 103.740 45.425 43.11% 62.658 59.46%1426–30 4.613 132.110 5.015 103.300 112.610 51.584 41.46% 53.333 53.18%1431–35 4.928 141.130 5.613 115.630 109.122 41.584 37.04% 57.103 50.86%1436–40 4.440 127.160 5.322 109.630 124.218 41.584 39.07% 62.267 58.50%1441–45 4.188 119.930 5.201 107.150 92.574 41.584 39.97% 63.333 60.88%1446–50 4.119 117.960 5.379 110.800 101.241 41.584 38.66% 63.333 58.88%
* Prices for wools from wiltshire, hampshire, and st swithin’s manors (all of the bishop of winchester’s manors), wiltshire and the Berkshire Downs, the Vale of white horse to Thames Valley; oxfordshire, Berkshire, and adjacent parts of wiltshire; worcestershire, the Cotswolds (oxfordshire, Gloucestershire, and adjacent parts of wiltshire); the Chilterns (oxfordshire, Buckinghamshire, hertfordshire); north-east oxfordshire and north Buckinghamshire.
Sources for Table 24: English Wood Prices: lloyd, The Movement of Wool Prices, statistical Appendix, pp. 35–51, cols 2–5, 10–13; English Wool Export Duties, including the Calais duty on denizen exports to Calais (from 1363): Calendar of the Fine Rolls, iv (Edward II, 1327–1337) to xxi (Edward IV, Edward V, Richard III, 1471–1485); Rotuli parliamentorum, ii–v; Barnes, ‘The Taxation of wool’; Gras, The Early English Customs System, pp. 75–80; Carus-wilson and Coleman, England’s Export Trade, pp. 194–96; ormrod, ‘The Crown and the english economy’. Comsumer Prices (based upon the Phelps Brown and Hopkins ‘Basket of Consumables’ Price Index: lse Archives, Phelps Brown, Box ia:324, lse Archives, Phelps Brown, Box J.iV.2.a. see also the sources for Table 18.

326 John Munro
lords (and peasants) was the fate of the wool-export trade in the later fourteenth century. As Table 25 demonstrates, total raw wool-exports fell precipitously and drastically: by 58.39 per cent, from the post-plague peak of 1356–60 (32,666.4 sacks) to the trough of 1411–15 (13,593.2 sacks), a decline that was not fully offset by the cloth export trade until the late fifteenth century.
The explanation for this drastic decline is to be found in changes in both the overseas and domestic economies that had begun as early as the 1290s, with the almost incessant warfare that spread throughout the entire Mediterranean basin and western europe and merged into the hundred years war (1337–1453). Those wars, directly and indirectly, led to steep increases in both transportation and transactions costs that virtually destroyed long distance trade in the cheaper textiles from northwest europe to their principal markets in the Mediterranean basin.55 The only surviving export-oriented textile producers in this region were those (with few exceptions) that marketed very costly luxury woollens, but directed to very much smaller, wealthier markets. They did so from the 1320s and 1330s, by changing from ‘price-takers’ into ‘price-makers’: engaging in a ‘mono-polistic competition’ based not on price but on the distinctively superior qualities of their woollens. so costly were these ultra-luxury cloths that transportation and transaction costs constituted a far smaller proportion of their sales prices than those for cheaper textiles. By far the most successful cloth manufacturers were those in the low Countries (Flanders, Brabant, and holland), and northern italy (lombardy, Tuscany: with much closer access to still lucrative Mediterranean markets). The english cloth industry underwent a similar transformation, from the 1350s, but less successfully than these foreign rivals, at least before the 1460s (see Table 25).56
england, however, had greatly benefited from this industrial-commercial transformation, from its outset, simply because its high grade wools were the sine qua non for luxury woollen-cloth production. The very best wools, which encountered no serious rivals before the sixteenth-century improvement of spanish merino wools, were those from the ‘welsh Marches’ of herefordshire and shropshire, the Cotswolds (Gloucestershire, worcestershire, wiltshire,
55 Munro, ‘industrial Transformations in the north-west european Textile Trades’; Munro, ‘The origins of the english “new Draperies”’; Munro, ‘The “industrial Crisis” of the english Textile Towns’.
56 Munro, ‘The “industrial Crisis” of the english Textile Towns’, pp. 103–41; Munro, ‘The symbiosis of Towns and Textiles’; Munro, ‘Medieval woollens: The western european woollen industries’, pp. 231–48.
Table 25. exports of english wools (in sacks) and woollen broadcloths (pieces) in quinquennial means, 1331–35 to 1446–50
YearDenizen
Wool ExportsAlien
Wool Exports Total Wool Sacks
Exported
Equivalent Broadcloths
Exported
Broad cloth Exports
Total as Equivalent
BroadclothsMichaelmas
in sacks
% of total
in sacks
% of total exports
1331–35 24,633.000 73.21% 9,012.600 26.79% 33,645.600 145,797.490 145,797.490
1336–40 13,180.000 64.21% 7,344.800 35.79% 20,524.800 88,940.730 88,940.730
1341–45 10,565.510 58.45% 7,510.070 41.55% 18,075.580 78,327.430 78,327.430
1346–50 27,183.130 117,793.450 2,555.667 120,349.120
1351–55 10,169.400 33.07% 20,581.000 66.93% 30,750.400 133,251.630 1,921.200 135,172.830
1356–60 32,666.400 141,554.290 9,061.000 150,615.290
1361–65 20,899.950 69.37% 9,229.250 30.63% 30,129.200 130,559.770 11,717.200 142,276.970
1366–70 16,345.600 61.79% 10,106.200 38.21% 26,451.800 114,624.380 14,527.200 129,151.580
1371–75 16,712.020 64.61% 9,155.780 35.39% 25,867.800 112,093.710 12,211.400 124,305.110
1376–80 16,898.000 82.55% 3,572.200 17.45% 20,470.200 88,704.130 13,642.600 102,346.730
1381–85 13,886.800 79.27% 3,630.600 20.73% 17,517.400 75,908.670 22,242.200 98,150.670
1386–90 15,574.200 80.65% 3,737.800 19.35% 19,312.000 83,685.270 25,610.000 109,295.270
1391–95 13,593.200 73.42% 4,920.600 26.58% 18,513.800 80,226.400 39,525.200 119,751.600
1396–1400 14,515.800 85.95% 2,373.800 14.05% 16,889.600 73,188.210 38,775.100 111,963.310
1401–05 11,803.400 91.47% 1,100.800 8.53% 12,904.200 55,918.160 34,569.600 90,487.760
1406–10 13,392.800 89.48% 1,575.400 10.52% 14,968.200 64,862.150 31,746.200 96,608.350
1411–15 12,633.200 92.94% 960.000 7.06% 13,593.200 58,903.820 27,183.400 86,087.220
1416–20 13,355.400 92.97% 1,009.600 7.03% 14,365.000 62,248.290 27,977.200 90,225.490
1421–25 13,363.600 93.81% 881.600 6.19% 14,245.200 61,729.150 40,274.600 102,003.750
1426–30 12,429.000 93.04% 929.600 6.96% 13,358.600 57,887.220 40,405.600 98,292.820
1431–35 8,679.400 92.49% 705.200 7.51% 9,384.600 40,666.570 40,027.400 80,693.970
1436–40 4,197.800 78.04% 1,181.000 21.96% 5,378.800 23,308.120 47,072.000 70,380.120
1441–45 6,502.200 80.98% 1,527.200 19.02% 8,029.400 34,794.040 56,455.800 91,249.840
1446–50 9,176.800 93.97% 588.400 6.03% 9,765.200 42,315.830 45,846.800 88,162.630
one woolsack = 26 stone = 364 lb. (165.1 kg); and one woolsack = 4.333 broadcloths of assize (24 by 1.75 yards)
Sources: Carus-wilson and Coleman, England’s Export Trade, pp. 36–119; Bridbury, Medieval English Clothmaking, appendix F, pp. 118–22.

The Late Medieval Decline of English Demesne Agriculture 327
lords (and peasants) was the fate of the wool-export trade in the later fourteenth century. As Table 25 demonstrates, total raw wool-exports fell precipitously and drastically: by 58.39 per cent, from the post-plague peak of 1356–60 (32,666.4 sacks) to the trough of 1411–15 (13,593.2 sacks), a decline that was not fully offset by the cloth export trade until the late fifteenth century.
The explanation for this drastic decline is to be found in changes in both the overseas and domestic economies that had begun as early as the 1290s, with the almost incessant warfare that spread throughout the entire Mediterranean basin and western europe and merged into the hundred years war (1337–1453). Those wars, directly and indirectly, led to steep increases in both transportation and transactions costs that virtually destroyed long distance trade in the cheaper textiles from northwest europe to their principal markets in the Mediterranean basin.55 The only surviving export-oriented textile producers in this region were those (with few exceptions) that marketed very costly luxury woollens, but directed to very much smaller, wealthier markets. They did so from the 1320s and 1330s, by changing from ‘price-takers’ into ‘price-makers’: engaging in a ‘mono-polistic competition’ based not on price but on the distinctively superior qualities of their woollens. so costly were these ultra-luxury cloths that transportation and transaction costs constituted a far smaller proportion of their sales prices than those for cheaper textiles. By far the most successful cloth manufacturers were those in the low Countries (Flanders, Brabant, and holland), and northern italy (lombardy, Tuscany: with much closer access to still lucrative Mediterranean markets). The english cloth industry underwent a similar transformation, from the 1350s, but less successfully than these foreign rivals, at least before the 1460s (see Table 25).56
england, however, had greatly benefited from this industrial-commercial transformation, from its outset, simply because its high grade wools were the sine qua non for luxury woollen-cloth production. The very best wools, which encountered no serious rivals before the sixteenth-century improvement of spanish merino wools, were those from the ‘welsh Marches’ of herefordshire and shropshire, the Cotswolds (Gloucestershire, worcestershire, wiltshire,
55 Munro, ‘industrial Transformations in the north-west european Textile Trades’; Munro, ‘The origins of the english “new Draperies”’; Munro, ‘The “industrial Crisis” of the english Textile Towns’.
56 Munro, ‘The “industrial Crisis” of the english Textile Towns’, pp. 103–41; Munro, ‘The symbiosis of Towns and Textiles’; Munro, ‘Medieval woollens: The western european woollen industries’, pp. 231–48.
Table 25. exports of english wools (in sacks) and woollen broadcloths (pieces) in quinquennial means, 1331–35 to 1446–50
YearDenizen
Wool ExportsAlien
Wool Exports Total Wool Sacks
Exported
Equivalent Broadcloths
Exported
Broad cloth Exports
Total as Equivalent
BroadclothsMichaelmas
in sacks
% of total
in sacks
% of total exports
1331–35 24,633.000 73.21% 9,012.600 26.79% 33,645.600 145,797.490 145,797.490
1336–40 13,180.000 64.21% 7,344.800 35.79% 20,524.800 88,940.730 88,940.730
1341–45 10,565.510 58.45% 7,510.070 41.55% 18,075.580 78,327.430 78,327.430
1346–50 27,183.130 117,793.450 2,555.667 120,349.120
1351–55 10,169.400 33.07% 20,581.000 66.93% 30,750.400 133,251.630 1,921.200 135,172.830
1356–60 32,666.400 141,554.290 9,061.000 150,615.290
1361–65 20,899.950 69.37% 9,229.250 30.63% 30,129.200 130,559.770 11,717.200 142,276.970
1366–70 16,345.600 61.79% 10,106.200 38.21% 26,451.800 114,624.380 14,527.200 129,151.580
1371–75 16,712.020 64.61% 9,155.780 35.39% 25,867.800 112,093.710 12,211.400 124,305.110
1376–80 16,898.000 82.55% 3,572.200 17.45% 20,470.200 88,704.130 13,642.600 102,346.730
1381–85 13,886.800 79.27% 3,630.600 20.73% 17,517.400 75,908.670 22,242.200 98,150.670
1386–90 15,574.200 80.65% 3,737.800 19.35% 19,312.000 83,685.270 25,610.000 109,295.270
1391–95 13,593.200 73.42% 4,920.600 26.58% 18,513.800 80,226.400 39,525.200 119,751.600
1396–1400 14,515.800 85.95% 2,373.800 14.05% 16,889.600 73,188.210 38,775.100 111,963.310
1401–05 11,803.400 91.47% 1,100.800 8.53% 12,904.200 55,918.160 34,569.600 90,487.760
1406–10 13,392.800 89.48% 1,575.400 10.52% 14,968.200 64,862.150 31,746.200 96,608.350
1411–15 12,633.200 92.94% 960.000 7.06% 13,593.200 58,903.820 27,183.400 86,087.220
1416–20 13,355.400 92.97% 1,009.600 7.03% 14,365.000 62,248.290 27,977.200 90,225.490
1421–25 13,363.600 93.81% 881.600 6.19% 14,245.200 61,729.150 40,274.600 102,003.750
1426–30 12,429.000 93.04% 929.600 6.96% 13,358.600 57,887.220 40,405.600 98,292.820
1431–35 8,679.400 92.49% 705.200 7.51% 9,384.600 40,666.570 40,027.400 80,693.970
1436–40 4,197.800 78.04% 1,181.000 21.96% 5,378.800 23,308.120 47,072.000 70,380.120
1441–45 6,502.200 80.98% 1,527.200 19.02% 8,029.400 34,794.040 56,455.800 91,249.840
1446–50 9,176.800 93.97% 588.400 6.03% 9,765.200 42,315.830 45,846.800 88,162.630
one woolsack = 26 stone = 364 lb. (165.1 kg); and one woolsack = 4.333 broadcloths of assize (24 by 1.75 yards)
Sources: Carus-wilson and Coleman, England’s Export Trade, pp. 36–119; Bridbury, Medieval English Clothmaking, appendix F, pp. 118–22.

328 John Munro
oxfordshire, and Berkshire), and lincolnshire (Kesteven and lindsey).57 The rapid reorientation of the Flemish cloth industry towards luxury products, from the 1330s, may well explain why, despite the population losses from the Black Death, the english wool export trade grew from a mean 18,075.6 sacks in 1341–45 to the aforesaid peak of 32,666.4 sacks in 1356–60.58
The Wool Export Duties of Edward III and the Calais Staple
These economic transformations also explain how and why edward iii and his successors came to finance the hundred years’ war: by heavily taxing the export of wools, which then accounted for about ninety per cent of total exports by value.59 edward’s new fiscal policy began modestly with a special export levy of twenty shillings per sack: in addition to the old Custom of 6s. 8d. per sack (from 1275), and, for aliens, the additional new Custom (1303) of 3s. 4d.60 As the costs of war mounted, so did the wool taxes. By the 1370s, total export taxes had risen to 50s. 0d. a sack for denizens and 53s. 4d. for aliens. From 1336–50 to 1371–75, the mean prices of better quality wools (those exported to Calais), including the export taxes, and Calais duty, had risen from £6.124 to £10.474 per sack, an increase of 71 per cent (Table 24). initially, the tax ‘incidence’ or burden was born more by the domestic wool growers (in lower real prices) than by the foreign customers and thus was not immediately injurious to the export trade. As Tables 19 and 24 demonstrate, the ratio of wool prices to grain prices and to the CPi itself moved sharply against wool prices from the mid-1340s until the early 1360s. noble and gentry landowners in both houses of parliament
57 Munro, ‘Medieval woollens: Textiles, Textile Technology’, pp. 186–91; Munro, ‘spanish Merino wools and the Nouvelles Draperies’; Munro, ‘wool-Price schedules’.
58 A post-plague hedonistic spending spree, especially of inherited cash balances, may also have boosted a relative demand for luxurious textiles and also contributed to an increased income velocity of money that fuelled inflation, from the 1350s to the 1370s. see lopez and Miskimin, ‘The economic Depression of the renaissance’; Miskimin, The Economy of Early Renaissance Europe, pp. 134–50; Van der wee and Peeters, ‘un Modèle dynamique de croissance interseculaire du commerce mondiale’; Day, ‘Crises and Trends’.
59 see Munro, ‘Medieval woollens: The western european woollen industries’, pp. 241–55, 269–83; and lloyd, The English Wool Trade, pp. 288–317. in the early 1640s, wool and wool-based textiles still accounted for 92.3 per cent of total export values. see Clay, Economic Expansion and Social Change, Table xiii at p. 144.
60 For the following see, Barnes, ‘The Taxation of wool’; Gras, The Early English Customs System, pp. 75–80; Power, The Wool Trade, pp. 63–85; ormrod, ‘The Crown and the english economy’; lloyd, The English Wool Trade, pp. 144–224.

The Late Medieval Decline of English Demesne Agriculture 329
soon mounted a strenuous opposition to the wool export taxes. in March 1363, edward iii sought to resolve this problem by establishing an official staple for all wool exports to northern europe, at the recently conquered French port of Calais (1347), just across the Channel, later exempting (1378) italian and spanish wool shipments by sea, via Gibraltar, to the Mediterranean.
The administration of the new Company of the staple, vested in the hands of twenty-four merchant-aldermen, with full powers to supervise and control all wool sales at Calais, endeavoured to shift the newly increased export-tax burden more fully on to the foreign buyers. At the same time, the Company enforced an older policy of stipulating minimum wool prices, county by county, in order to thwart internal competition.61 The Calais staplers soon found, however, that par-liament was undermining its monopoly powers. Parliament did so, first, by selling various staple exemptions or export licences; and then second, by periodically removing the staple itself from Calais: in 1369–76, in 1382–88, and 1390–92. Finally, in 1392, parliament restored the staple permanently to Calais (until the port’s loss to France in 1558), and the staple’s full powers, while also agreeing to sell fewer export licences for staple exemptions (generally allowing them only for the cheaper wools that could not be sold at Calais). By this time, when the staple finally became an effective cartel, the heavy alien duties (Table 24) had virtually eliminated the italian merchants from the wool export trade. As Table 25 indi-cates, the alien share of total wool exports fell from 38.21 per cent in 1366–70 to just 8.53 per cent in 1401–05.62
By the 1390s, the deepening deflation had severely increased the wool-export tax burden, because the taxes were specific (fixed per sack) and not ad valorem (percentage): thus, the real tax burden rose as prices fell. As Table 24 demon-strates, that tax burden for denizen exporters had now risen to over fifty per cent of the current wholesale export price (though diminishing somewhat in the early fifteenth century). unfortunately, for both exporters and importers, these english wools accounted for very high proportions of pre-finishing production costs in the luxury woollen draperies in the low Countries: ranging from sixty-five to seventy-five per cent of the total.63 it would appear that the low Countries’ wool-
61 see lloyd, The English Wool Trade, pp. 193–256; Power, The Wool Trade, pp. 81–85; Munro, ‘Medieval woollens: The western european woollen industries’, pp. 278–85. The nottingham Assembly, which had granted edward iii’s first wool subsidy in 1336, initiated this policy of fixed minimum prices by county. see Munro, ‘wool-Price schedules’, pp. 135–37.
62 see lloyd, The English Wool Trade, pp. 193–256; Power, The Wool Trade, pp. 86–103; Munro, ‘Medieval woollens: The western european woollen industries’, pp. 278–85.
63 For the data sources, see Munro, ‘industrial Protectionism in Medieval Flanders’, Table 13.2 at p. 256; Munro, ‘The Medieval scarlet’, pp. 13–70, Table 3.12, p. 52.

330 John Munro
len draperies had a relatively inelastic demand for fine quality english wools.64 But, as economists will argue, a producer’s demand for industrial inputs is derived from the market demand for the final product. The demand for luxury goods is by definition elastic, all the more so if there were effective available substitutes. even if one argues that luxury apparel was a social ‘necessity’ for much of the european nobility and for the upper bourgeoisie, they were now finding substitutes in a wide variety of italian-made and imported silk fabrics and other luxury textiles.65
The Dire Fate of the Luxury Woollen Cloth Industries in the Late Fourteenth-Century Low Countries
The effect of this wool export-tax burden (admittedly combined with other negative factors) for both english wool exports and woollen cloth production in the southern low Countries can be seen in Tables 25 and 26: in particular, for the urban draperies of Gent (Ghent), Mechelen, and leuven in the fourteenth century and, in the first half of the fifteenth century, of ieper (ypres) as well (for which no data are available before 1406). They tell a tale even more dismal than that for the english wool trade (whose decline of almost sixty per cent, by the early fifteenth century, has already been stressed).66 The Gent and leuven indices reflect a slow decline to about the 1360s, and then a very precipitous decline, into the early fifteenth century (with an unfortunate lacuna for Gent in the 1390s).
64 As noted earlier (p. 326 and n. 57), spanish merino wools would not finally rival the best english wools until the sixteenth century; but they were being imported into the low Countries by the 1430s. The major urban draperies refused to consider using them, fearing the loss of customers by damaging their reputation for the ultra-luxury qualities of their finer woollens. only their upstart small-town rivals, known as the nouvelles draperies, who were then marketing cheaper imitations of traditional luxury woollens, dared to experiment with merino wools, although mixing them with the finer english wools. see Munro, ‘spanish Merino wools and the Nouvelles Draperies’, pp. 431–84.
65 The most luxurious and most costly of all textiles worn in later medieval and early modern europe were silks. For the late medieval silk industry, see Muthesius, ‘silk in the Medieval world’; Molà, The Silk Industry of Renaissance Venice. For the very high prices of some silk fabrics in fifteenth-century england, with comparison with woollens’ prices, see Munro, ‘The Medieval scarlet’, Table 3.15, p. 69; and Munro, ‘industrial Protectionism in Medieval Flanders’, Table 13.3, Part i, pp. 257–60.
66 see Table 25. if we focus, however, only on the denizen exports, which chiefly went to Calais, and only from the imposition of the Calais staple in 1363, we find a less drastic decline: one of 34.96 per cent, from the mean of 20,899.95 sacks in 1361–65 to a mean of 13,593.2 sacks in 1391–95.
Table 26. exports of english woolsacks and broadcloths and production indices for the woollen draperies of the southern low Countries, 1331–35 to 1446–50 in quinquennial means, 1331–35 to 1446–50
Years
English Wool
Exports
English Broadcloth
Exports
Total English Wool & Cloth
Exports
Gent Drapery Farms A
Gent Drapery Farms B
Ieper Drapery
Farms
Ieper: no.
of stalls rented in
Lakenhalle
Mechelen Drapery
Farms
Leuven Drapery
Farms
in Sacks in pieces as Cloths in £ groot Flemish
in £ groot Flemish
in £ groot Flemish
in £ oude groot
in £ oude groot
1331–35 33,645.600 145,797.490 108.485 150.283 1,563.7101336–40 20,524.800 88,940.730 87.913 123.660 1,045.0451341–45 18,075.580 78,327.430 84.015 125.070 782.3131346–50 27,183.130 2,555.670 120,349.120 67.240 109.378 506.862 250.2921351–55 30,750.400 1,921.200 135,172.830 68.875 114.505 707.914 240.8091356–60 32,666.400 9,061.000 150,615.290 61.720 112.785 467.723 351.4361361–65 30,129.200 11,717.200 142,276.970 55.778 96.825 496.240 709.3981366–70 26,451.800 14,527.200 129,151.580 34.590 67.425 597.661 803.3441371–75 25,867.800 12,211.400 124,305.110 22.800 47.721 540.698 525.5571376–80 20,470.200 13,642.600 102,346.730 19.355 39.311 471.236 564.9431381–85 17,517.400 22,242.000 98,150.670 14.402 22.421 397.290 394.3311386–90 19,312.000 25,610.000 109,295.270 11.743 23.550 353.349 259.1141391–95 18,513.800 39,525.200 119,751.600 missing missing 297.670 224.7301396–1400 16,889.600 38,775.100 111,963.310 missing missing 300.804 169.3381401–05 12,904.200 34,569.600 90,487.760 5.885 15.433 270.285 135.0721406–10 14,968.200 31,746.200 96,608.350 7.654 16.030 183.192 407.000 272.011 170.8751411–15 13,593.200 27,183.400 86,087.220 7.309 15.498 266.902 426.000 275.450 143.1771416–20 14,365.000 27,977.200 90,225.490 8.253 17.782 266.912 489.300 276.334 81.7691421–25 14,245.200 40,274.600 102,003.750 8.623 20.619 265.633 410.000 357.119 58.9321426–30 13,358.600 40,405.600 98,292.820 9.331 23.648 249.817 356.600 352.7071431–35 9,384.600 40,027.400 80,693.970 7.267 22.314 235.327 319.400 220.5321436–40 5,378.800 47,072.000 70,380.120 4.267 14.783 156.022 192.600 186.9761441–45 8,029.400 56,455.800 91,249.840 4.418 14.431 176.453 182.400 190.8811446–50 9,765.200 45,846.800 88,162.630 4.773 14.512 177.450 152.200 162.950
one woolsack = 26 stone = 364 lb. (165.1 kg) = 4.333 broadcloths of assize
Sources: English Wool and Cloth Exports: Carus-wilson and Coleman, England’s Export Trade, pp. 36–119; Bridbury, Medieval English Clothmaking, appendix F, pp. 118–22. Gent (Ghent) A: Total Drapery Excise Farms; Gent B: Excises for ‘Ramen en nieuwe huisgeld’ only: all from Gent, stadsarchief, stadsrekeningen, 1335–1520, 400:3.1–17.2; Algemeen rijksarchief, rekenkamer, 34,862. Ieper (Ypres): Algemeen rijksarchief, rekenkamer, 38,635–722. Mechelen: Mechelen, stadsarchief, stadsrekeningen, 1316–1550, series i: nos. 3–225; Algemeen rijksarchief, rekenkamer, 41,219–85. Leuven: leuven, stadsarchief, stadsrekeningen, 1345–1500, nos. 4986–5124.

The Late Medieval Decline of English Demesne Agriculture 331
len draperies had a relatively inelastic demand for fine quality english wools.64 But, as economists will argue, a producer’s demand for industrial inputs is derived from the market demand for the final product. The demand for luxury goods is by definition elastic, all the more so if there were effective available substitutes. even if one argues that luxury apparel was a social ‘necessity’ for much of the european nobility and for the upper bourgeoisie, they were now finding substitutes in a wide variety of italian-made and imported silk fabrics and other luxury textiles.65
The Dire Fate of the Luxury Woollen Cloth Industries in the Late Fourteenth-Century Low Countries
The effect of this wool export-tax burden (admittedly combined with other negative factors) for both english wool exports and woollen cloth production in the southern low Countries can be seen in Tables 25 and 26: in particular, for the urban draperies of Gent (Ghent), Mechelen, and leuven in the fourteenth century and, in the first half of the fifteenth century, of ieper (ypres) as well (for which no data are available before 1406). They tell a tale even more dismal than that for the english wool trade (whose decline of almost sixty per cent, by the early fifteenth century, has already been stressed).66 The Gent and leuven indices reflect a slow decline to about the 1360s, and then a very precipitous decline, into the early fifteenth century (with an unfortunate lacuna for Gent in the 1390s).
64 As noted earlier (p. 326 and n. 57), spanish merino wools would not finally rival the best english wools until the sixteenth century; but they were being imported into the low Countries by the 1430s. The major urban draperies refused to consider using them, fearing the loss of customers by damaging their reputation for the ultra-luxury qualities of their finer woollens. only their upstart small-town rivals, known as the nouvelles draperies, who were then marketing cheaper imitations of traditional luxury woollens, dared to experiment with merino wools, although mixing them with the finer english wools. see Munro, ‘spanish Merino wools and the Nouvelles Draperies’, pp. 431–84.
65 The most luxurious and most costly of all textiles worn in later medieval and early modern europe were silks. For the late medieval silk industry, see Muthesius, ‘silk in the Medieval world’; Molà, The Silk Industry of Renaissance Venice. For the very high prices of some silk fabrics in fifteenth-century england, with comparison with woollens’ prices, see Munro, ‘The Medieval scarlet’, Table 3.15, p. 69; and Munro, ‘industrial Protectionism in Medieval Flanders’, Table 13.3, Part i, pp. 257–60.
66 see Table 25. if we focus, however, only on the denizen exports, which chiefly went to Calais, and only from the imposition of the Calais staple in 1363, we find a less drastic decline: one of 34.96 per cent, from the mean of 20,899.95 sacks in 1361–65 to a mean of 13,593.2 sacks in 1391–95.
Table 26. exports of english woolsacks and broadcloths and production indices for the woollen draperies of the southern low Countries, 1331–35 to 1446–50 in quinquennial means, 1331–35 to 1446–50
Years
English Wool
Exports
English Broadcloth
Exports
Total English Wool & Cloth
Exports
Gent Drapery Farms A
Gent Drapery Farms B
Ieper Drapery
Farms
Ieper: no.
of stalls rented in
Lakenhalle
Mechelen Drapery
Farms
Leuven Drapery
Farms
in Sacks in pieces as Cloths in £ groot Flemish
in £ groot Flemish
in £ groot Flemish
in £ oude groot
in £ oude groot
1331–35 33,645.600 145,797.490 108.485 150.283 1,563.7101336–40 20,524.800 88,940.730 87.913 123.660 1,045.0451341–45 18,075.580 78,327.430 84.015 125.070 782.3131346–50 27,183.130 2,555.670 120,349.120 67.240 109.378 506.862 250.2921351–55 30,750.400 1,921.200 135,172.830 68.875 114.505 707.914 240.8091356–60 32,666.400 9,061.000 150,615.290 61.720 112.785 467.723 351.4361361–65 30,129.200 11,717.200 142,276.970 55.778 96.825 496.240 709.3981366–70 26,451.800 14,527.200 129,151.580 34.590 67.425 597.661 803.3441371–75 25,867.800 12,211.400 124,305.110 22.800 47.721 540.698 525.5571376–80 20,470.200 13,642.600 102,346.730 19.355 39.311 471.236 564.9431381–85 17,517.400 22,242.000 98,150.670 14.402 22.421 397.290 394.3311386–90 19,312.000 25,610.000 109,295.270 11.743 23.550 353.349 259.1141391–95 18,513.800 39,525.200 119,751.600 missing missing 297.670 224.7301396–1400 16,889.600 38,775.100 111,963.310 missing missing 300.804 169.3381401–05 12,904.200 34,569.600 90,487.760 5.885 15.433 270.285 135.0721406–10 14,968.200 31,746.200 96,608.350 7.654 16.030 183.192 407.000 272.011 170.8751411–15 13,593.200 27,183.400 86,087.220 7.309 15.498 266.902 426.000 275.450 143.1771416–20 14,365.000 27,977.200 90,225.490 8.253 17.782 266.912 489.300 276.334 81.7691421–25 14,245.200 40,274.600 102,003.750 8.623 20.619 265.633 410.000 357.119 58.9321426–30 13,358.600 40,405.600 98,292.820 9.331 23.648 249.817 356.600 352.7071431–35 9,384.600 40,027.400 80,693.970 7.267 22.314 235.327 319.400 220.5321436–40 5,378.800 47,072.000 70,380.120 4.267 14.783 156.022 192.600 186.9761441–45 8,029.400 56,455.800 91,249.840 4.418 14.431 176.453 182.400 190.8811446–50 9,765.200 45,846.800 88,162.630 4.773 14.512 177.450 152.200 162.950
one woolsack = 26 stone = 364 lb. (165.1 kg) = 4.333 broadcloths of assize
Sources: English Wool and Cloth Exports: Carus-wilson and Coleman, England’s Export Trade, pp. 36–119; Bridbury, Medieval English Clothmaking, appendix F, pp. 118–22. Gent (Ghent) A: Total Drapery Excise Farms; Gent B: Excises for ‘Ramen en nieuwe huisgeld’ only: all from Gent, stadsarchief, stadsrekeningen, 1335–1520, 400:3.1–17.2; Algemeen rijksarchief, rekenkamer, 34,862. Ieper (Ypres): Algemeen rijksarchief, rekenkamer, 38,635–722. Mechelen: Mechelen, stadsarchief, stadsrekeningen, 1316–1550, series i: nos. 3–225; Algemeen rijksarchief, rekenkamer, 41,219–85. Leuven: leuven, stadsarchief, stadsrekeningen, 1345–1500, nos. 4986–5124.

332 John Munro
This sharp decline may indicate that, even from its inception, the Calais staple had a significant impact in shifting the wool-tax burden from english growers to the Flemish and Brabantine woollen draperies. From the mean of 1356–60 to that of 1401–05, the Gent A series data fell by 90.46 per cent; the Gent B series data fell by 86.32 per cent; the leuven data, from the peak of 1366–70, fell by 83.19 per cent; the Mechelen data fell by 61.82 per cent from the earlier mean of 1351–55 to the 1401–05 mean.67
The explanations for this decline of the low Countries’ urban draperies are very complex, involving a myriad of factors, domestic and foreign, all of which have been considered at length in numerous recent publications.68 some of the latter are considered in the debate about the so-called ‘Great Depression’ of the later Middle Ages, including the continued negative impact of warfare on the economy: especially in terms of the rising burden of taxation, and continuous disruptions of international trade, and continuously falling population, which, however, cannot account for all of the indicated industrial decline.69
The Rise of the English Cloth Export Trade: Its Impact on Manorial Demesne Economies
As is well known, the sharp decline of the english wool export trade was coun-tered by a rise in woollen cloth exports, which clearly bore a major responsi-bility for the decline of both the wool-export trade and of the low Countries’ luxury cloth industries. As Tables 25 and 26 indicate, the english cloth trade had enjoyed only a very minimal importance before the Black Death, or indeed before the imposition of the heavier wool-export duties. The major if quite unin-tended beneficiaries of english fiscal policies were the producers and exporters of english woollens, because domestic clothiers were able to purchase the same fine english wools (the same as those sold in the low Countries) tax free, while cloth exporters paid only minimal duties. Denizens had in fact paid no duties
67 These are not based on cloth outputs but on the sale of tax farms: i.e., the right to collect taxes imposed on the production and sales of woollen cloths (taxes on both the inputs for cloth production and on the cloth outputs). since they were sold at competitive annual auctions, they should reflect the dire economic realities, though possibly they exaggerate them as well (if tax rates declined with economic adversities).
68 see in particular Munro, ‘Medieval woollens: The western european woollen industries’, pp. 244–62, 269–91; Munro, ‘The symbiosis of Towns and Textiles’.
69 see the sources cited above, in nn. 14 and 58; and also Postan, ‘The Trade of Medieval europe’; hatcher, ‘The Great slump’; nightingale, ‘england and the european Depression’.

The Late Medieval Decline of English Demesne Agriculture 333
at all, until the imposition of the Cloth Custom of 1347, which levied a very small export tax of 1s. 2d. per standard broadcloth of assize. German hanseatic merchants refused to pay this new duty, claiming their 1303 Carta mercatoria privilege of paying only 1s. 0d. per broadcloth; but other alien merchants were forced to pay both duties, for a total of 2s. 4d. per cloth, and later a five-per cent ‘poundage’ tax, as well.70 not surprisingly, english and hanse merchants together soon achieved an overwhelming dominance in the english cloth export trade, usually commanding seventy-five to eighty-five per cent of the total.71 Their low export duties amounted to about 2.5 per cent of the mean value of broadcloths that they shipped: about £2 to £2 10s. 0d. per broadcloth, in the early fifteenth century. The cost advantage of the english cloth trade over its Flemish rivals has been calculated at about twenty-five to thirty per cent. By the early fifteenth cen-tury, the mean export prices of english woollens were only about only thirty-five to forty per cent of the prices for the finer Flemish and Brabantine woollens, though english woollens were not of the same quality.72
As Tables 25 and 26 also indicate, english broadcloth exports enjoyed a twenty-one-fold increase in the second half of the fourteenth century: from a mere 1921.2 cloths in 1351–55 to a peak of 39,525.2 in 1391–95 (in quinquennial means). Thereafter, for reasons explained elsewhere, those exports declined to a mean of 27,183.4 cloths in 1411–15; but then english cloth exports recovered to reach a mean of 40,274.6 cloths in 1421–25.73 Despite the impressive expansion of the english cloth-export trade, and then its strong recovery by the 1420s, it did not offer manorial landlords much hope of maintaining the prosperity of
70 Carus-wilson and Coleman, England’s Export Trade, pp. 13–18, 194–98; Gras, The Early English Customs System, pp. 66–85; Munro, ‘Medieval woollens: The western european woollen industries’, pp. 278–88, 292–96; Munro, ‘industrial Protectionism in Medieval Flanders’, pp. 229–68; Munro, ‘The symbiosis of Towns and Textiles’. Broadcloths that were dyed either partially or wholly in ‘grain’ (in kermes, the scarlet dye) were subjected to much higher duties; but very few were exported in the later medieval era. see also nn. 71–72 below.
71 see Munro, ‘Medieval woollens: The western european woollen industries’, Table 5.4, pp. 306–07. see also Munro, ‘hanseatic Commerce in Textiles’.
72 Munro, ‘Medieval woollens: The western european woollen industries’, Table 5.10, pp. 318–24; Munro, ‘industrial Protectionism in Medieval Flanders’, Table 13.3, pp. 257–62, Table 13.5, pp. 266–67; Munro, ‘The origins of the english “new Draperies”’, Tables 1–2, pp. 39–40, Table 3, pp. 42–44; Munro, ‘The symbiosis of Towns and Textiles’, Table 2, p. 50; and especially Munro, ‘Three Centuries of luxury Textile Consumption’, Tables 1.3–1.4, pp. 20–25; Tables 1.5–1.6, pp. 27–29; Table 1.7, pp. 31–32; Tables 1.11–1.17, pp. 39–50.
73 see Munro, ‘Medieval woollens: The western european woollen industries’, pp. 283–88; Munro, ‘hanseatic Commerce in Textiles’, pp. 97–102.

334 John Munro
their wool-growing demesnes during the later fourteenth and early fifteenth centuries. As the final column in Table 25 clearly indicates, the combined total volume of wool and of cloth exports, expressed as broadcloths (at the accepted ratio of 4.333 broadcloths per wool sack), had fallen by 32.27 per cent: from a mean of 150,615.29 cloths in 1356–60 to one of 102,003.75 cloths in 1421–25. Furthermore, evidence from taxes on domestic production (from the aulnage accounts) indicates that the english home market absorbed an increased domestic production of only 2800 broadcloths, by 1390s (when the evidence ceases), chiefly displacing the former foreign imports.74 Furthermore, the fact that a broadcloth fetched a higher value when exported than did the same quantity of raw wool in a woolsack (apart from taxes) clearly benefited domestic clothiers and cloth merchants, but did not directly benefit the wool-sellers.75 Presumably, manorial and peasant wools were sold to domestic clothiers at the same price as those wools sold to agents of the staplers.
The Late Medieval Changes in Manorial Demesne Economies: The Varieties of Landlord Responses
not all manorial lords were experiencing severe economic difficulties or the same difficulties in the late fourteenth and early fifteenth centuries. As already indicated, some benefited from switching to the production of other livestock
74 For the aulnage accounts, see Gray, ‘The Production and exportation of english woollens’, esp. Appendix ii, p. 34. The fourteenth-century accounts are available for only two periods: 1353–58 and 1394–98; and they have lacuna for london, norfolk, shropshire, and worcestershire. if we subtract the annual means for total cloth exports from those for total taxed cloth outputs, for 1356–58 and 1394–98, we find that the net balance, presumably indicating domestic consumption, were 5445 cloths and 8256 cloths, respectively, a difference of 2811. For cloth exports, see Carus-wilson and Coleman, England’s Export Trade, pp. 76, 85–86. For foreign cloth imports see also Beardwood, Alien Merchants in England, Appendix C:3: pp. 161–77.
75 on the basis of the standard ratio of 4.333 woollen broadcloths per sack of raw wool, and a mean export value of £2.25 per broadcloth, in the early fifteenth century, a sack of finer wools (those exported to Calais) was worth, on average, £5.269 in 1421–25 (Tables 24 and 25); and the same amount of wool exported in manufactured broadcloths would have been worth £9.750, or 85.04 per cent more; i.e., the wool content was worth 54.04 per cent of the value of the broadcloth. But when denizen export taxes were added, the woolsack was worth, on average, £7.540: or 75.46 per cent as much as the 4.333 broadcloths, with export taxes (£9.993). see also the relevant statistical data in the tables presented in Munro, ‘Three Centuries of luxury Textile Consumption’, pp. 1–60.

The Late Medieval Decline of English Demesne Agriculture 335
products (other than wool): especially meat (beef, mutton, pork), dairy products, hides (leather). J. M. Bean notes that many gentry landowners maintained sheep flocks more for meat (and for manure) than for the wool clips in the later fourteenth and early fifteenth centuries, and that ‘the abandonment of pastoral activities occurred later than that of arable farming’.76 J. n. hare similarly found that many ecclesiastical manors in wiltshire had retained sheep flocks long after having leased their arable demesne lands, as did Christopher Dyer on the bishop of worcester’s estates.77 while the agrarian changes in some manors had involved only a shift from wool production to other forms of livestock production within the pastoral sector, that reorientation had required, in many other manors, a major shift in demesne land use from arable to pasture, as indicated earlier, with Campbell’s extensive data.78
however, not all manorial lords were able to make such adjustments and to cope well with the new, harsh economic realties. Their failure was due to several reasons. The first was institutional. Many manorial lords had chosen to have their demesne lands intermixed with those of their tenants, in the form of plough strips, often in order to take advantage of their tenants’ communal ploughing. But, in doing so, they had subjected their own demesne strips to the rigidities of communal or open Field arable agriculture in the Midlands region.79 They would have had great difficulty in converting such lands to livestock raising without engrossing and enclosing such lands, in most cases by evicting tenants. That was hardly a common practice in the late fourteenth and early fifteenth centuries, and would not become so until the 1460s.80
76 Bean also contended that ‘lay magnates continued to maintain large flocks of sheep beyond 1420’; and that not until the 1440s did the Duchy of lancaster give up its large sheep flocks. Bean, ‘landlords’, pp. 574–76. see also Dyer, Lords and Peasants in a Changing Society, pp. 148–54; Bolton, The Medieval English Economy, pp. 228–29; Power, The Wool Trade, pp. 38–40: she also acknowledges that many manorial lords retained sheep flocks longer than they did grain cultivation on their demesnes — but does not mention the products consumed from these sheep.
77 hare, ‘The Monks as landlords’, pp. 85–87; Dyer, Lords and Peasants in a Changing Society, pp. 150–54.
78 see above, p. 323–25.79 see Tawney, The Agrarian Problem in the Sixteenth Century, maps i–v, between pp. 166–
67: of salford, edgeware, Maids Morton, weedon weston manors, in the 1590s, showing the intermixing of demesne lands with those of tenancy lands (plough strips).
80 For the beginnings of the late yorkist and Tudor enclosure movement, see Blanchard, ‘Population Change, enclosure’; Clay, Economic Expansion and Social Change, chap. 3, ‘rural society’, pp. 53–101; and chap, 4, ‘The Progress of Agriculture’, pp. 102–41. see also n. 83 below.

336 John Munro
The second problem was one of capital (affecting both landlords and peas-ants). Any extensive conversion of arable lands into pasture required very large amounts of new capital to acquire and build up herds of cattle and flocks of sheep. As already noted, real capital costs were rising with deflation (especially with no evidence of any significant fall in nominal interest rates during the later fourteenth and fifteenth centuries). By no means all manorial landlords had ready access to capital, especially in an era when, according to both Pamela nightingale and Chris Briggs, supplies of credit were seriously contracting, in both the urban and rural economies. Their research provides further evidence that credit instru-ments were not a remedy for periodic coin shortages (at least in england) and that, instead, access to credit diminished with the effective money supply, espe-cially if lenders feared that they would not be repaid in coin.81
The third problem was, again, one of labour supplies. To be sure, livestock raising required much less labour, per acre, than did arable cultivation; and, as noted earlier, later medieval labour productivity in pastoral agriculture was evidently rising.82 nevertheless, in the Midlands zone of classic ‘sheep-corn’ mixed husbandry, many manorial lords, in first encountering manifestations of crisis in the late fourteenth century, were unwilling to contemplate a total abandonment of arable, especially because of the symbiotic relationship between arable and pastoral agriculture (for example, sheep-folding on the post-harvest arable), simply to save on labour costs.83 They soon found, furthermore, that the problem was not just rising wages (nominal and real) but the actual supply of available labour, even for pastoral agriculture. That was especially the plight of those manorial lords who had previously relied on at least some customary labour services on their demesnes. we hardly need now belabour the often cited point, so well developed in the literature on the decline of english serfdom or villeinage, during this era, that so many manorial lords found it more and more difficult
81 nightingale, ‘Monetary Contraction’; Briggs, Credit and Village Society; and especially Briggs, ‘The Availability of Credit’. in establishing ‘a substantial late-medieval decline in debt litigation (evidently greater than the demographic decline), and hence in real levels of (agrarian) credit’ (p. 23), Briggs suggests that institutional changes in courts that handled debt litigation were also responsible, especially in between the two ‘bullion famine’ eras. see also raftis, Peasant Economic Development, p. 68; Munro, ‘wage-stickiness’, pp. 216–17; and spufford, Money and its Use, pp. 346–47, and n. 15 above.
82 see above pp. 322–23 and nn. 46, 49.83 For other reasons why a shift from arable to pasture was not necessarily profitable (nor all
that labour-saving), before the 1520s, see Blanchard, ‘Population Change, enclosure’, pp. 427–45, esp. pp. 437–38; and Appendix A, pp. 443–45.

The Late Medieval Decline of English Demesne Agriculture 337
to exact labour services from their villein tenants.84 Kosminsky, having focused on this particular problem, concluded that the lesser manorial lords, the gentry small holders, fared better than did the great magnates, lay and ecclesiastical, in this economically depressed era, because they had relied to a far lesser degree on villein labour; but he did not take full account of the sharp rises in piece-work rates for hired agricultural labourers.85
The Economic and Social Varieties of Demesne Leasing: Benefits and Costs for Landlords and Tenants
Finally, more and more manorial lords, perhaps beginning with the greater magnates, found that their simplest solution, and an increasingly popular one by the 1390s, was to lease out more and more of demesne lands into leasehold tenancies, and to convert vacant villein tenancies into leaseholds, with fewer or no servile obligations. when they chose, finally, to do so, evidently depended on their particular economic and social circumstances. Many indeed may have leased their lands not specifically because of a price-cost scissor, or because of an actual lack of capital and labour, but because of problems of personal indebtedness and lack of ready cash.
Published studies by various historians indicate a very wide variety of lease-holds, from short to long term; but the historical tendency by the early fifteenth century was towards much longer leases: of thirty to forty years, and more.86 During the deflationary era from the 1370s to the 1420s, most landlords pre-ferred a longer term over a short term lease, and as just indicated, came to insist on longer term leases. Thus, a general fall in consumer prices ipso facto meant that the real value of fixed annual leasehold-rents was steadily rising (even if rents on new leases were lower). Consequently the burden of sustaining rising operating costs in commercial agriculture generally had to be born by the tenants, especially if they were unable to depend wholly on family labour and had to hire agricul-tural labourers now in scarce supply.
84 see hilton, The Decline of Serfdom, pp. 52–59; hatcher, ‘english serfdom and Villeinage’; and other sources cited in nn. 1–4 above.
85 Kosminsky, Studies in the Agrarian History of England, ed. by hilton, pp. 256–82.86 hilton, The Decline of Serfdom, pp. 45–46; hare, ‘The Monks as landlords’, pp. 18–21;
Dyer, Lords and Peasants in a Changing Society, pp. 210–11; Kerridge, Agrarian Problems, p. 47: giving examples of leases for forty, sixty, or even ninety-nine years, in the early sixteenth century.
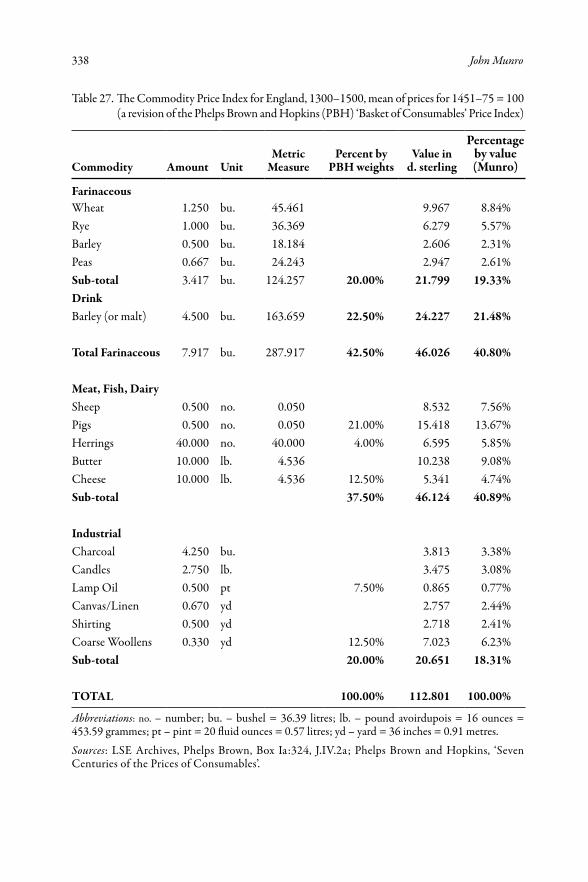
338 John Munro
The positive ‘trade-off ’ for such peasants, economic and social, lay in having that much more land to work, and, if they were villeins by ancestry, greater freedom, and especially dignity as well, and greater freedom to conserve their labour for working their own lands: that is, if manorial lords who had abandoned direct cultivation of their former demesnes had thereby reduced their demand for villein labour services.
All these changes did not mean that there was ever a formal ‘abolition of serfdom’, and did not necessarily mean the abolition of other servile obligations, such as merchet and heriots.87 But they did lead to an inexorable erosion of villeinage. rodney hilton commented that ‘as customary [villeinage] tenures were turned into copyhold, as was general by the beginning of the fifteenth century, the servility associated with them seemed […] to melt away’.88 But in so many cases, what also ‘melted away’ was security of tenure for themselves and their offspring, i.e. inheritance rights that applied when villeins and their offspring were bound to the estate, since so many copyhold tenures were either ‘at will’ or were held from one to three ‘lives’. As eric Kerridge has observed, ‘twenty-one years and three lives were regarded as equivalents and were of much the same length in practice’, at least in the sixteenth century.89 if so, that change to copyhold tenures meant a substantial loss of the inheritance and thus property rights actually enjoyed by so many (if not all) villein tenants.90
The variety of these agrarian changes is far too great and far too complex to be considered fully in this study, all the more so since the extant estate accounts are so few, and often incomplete. But one very recent study of the norfolk Cathedral Priory’s Benedictine manors, for the later fourteenth and fifteenth centuries, does provide concrete evidence on prices, production costs, transport and storage costs, and annual profits (and losses) to justify all of the conclusions presented in this current study.91 At the risk of oversimplification, we may view these changes in the english agrarian economy and society, from the 1380s to the 1420s, as almost the mirror image of the subsequent transformation of the east
87 see hilton, The Decline of Serfdom, pp. 51–59 (‘The last profits of serfdom’).88 hilton, The Decline of Serfdom, p. 47. Also, p. 31: ‘Villeinage was never abolished; it
withered away’. ‘Copyhold’ means: tenure ‘by copy of the court roll according to the custom of the manor’. see Tawney, The Agrarian Problem in the Sixteenth Century, p. 47. he cites norden, The Surveyor’s Dialogue, to note that ‘All copyhold land is commonly customary, but all customary land is not copyhold’.
89 Kerridge, Agrarian Problems, p. 47.90 hatcher, ‘english serfdom and Villeinage’.91 slavin, ‘Church and Food Provisioning’.
Table 27. The Commodity Price index for england, 1300–1500, mean of prices for 1451–75 = 100 (a revision of the Phelps Brown and hopkins (PBh) ‘Basket of Consumables’ Price index)
Commodity Amount UnitMetric
MeasurePercent by
PBH weightsValue in
d. sterling
Percentage by value (Munro)
Farinaceouswheat 1.250 bu. 45.461 9.967 8.84%rye 1.000 bu. 36.369 6.279 5.57%Barley 0.500 bu. 18.184 2.606 2.31%Peas 0.667 bu. 24.243 2.947 2.61%Sub-total 3.417 bu. 124.257 20.00% 21.799 19.33%DrinkBarley (or malt) 4.500 bu. 163.659 22.50% 24.227 21.48%
Total Farinaceous 7.917 bu. 287.917 42.50% 46.026 40.80%
Meat, Fish, Dairysheep 0.500 no. 0.050 8.532 7.56%Pigs 0.500 no. 0.050 21.00% 15.418 13.67%herrings 40.000 no. 40.000 4.00% 6.595 5.85%Butter 10.000 lb. 4.536 10.238 9.08%Cheese 10.000 lb. 4.536 12.50% 5.341 4.74%Sub-total 37.50% 46.124 40.89%
IndustrialCharcoal 4.250 bu. 3.813 3.38%Candles 2.750 lb. 3.475 3.08%lamp oil 0.500 pt 7.50% 0.865 0.77%Canvas/linen 0.670 yd 2.757 2.44%shirting 0.500 yd 2.718 2.41%Coarse woollens 0.330 yd 12.50% 7.023 6.23%Sub-total 20.00% 20.651 18.31%
TOTAL 100.00% 112.801 100.00%
Abbreviations: no. – number; bu. – bushel = 36.39 litres; lb. – pound avoirdupois = 16 ounces = 453.59 grammes; pt – pint = 20 fluid ounces = 0.57 litres; yd – yard = 36 inches = 0.91 metres.
Sources: lse Archives, Phelps Brown, Box ia:324, J.iV.2a; Phelps Brown and hopkins, ‘seven Centuries of the Prices of Consumables’.

The Late Medieval Decline of English Demesne Agriculture 339
The positive ‘trade-off ’ for such peasants, economic and social, lay in having that much more land to work, and, if they were villeins by ancestry, greater freedom, and especially dignity as well, and greater freedom to conserve their labour for working their own lands: that is, if manorial lords who had abandoned direct cultivation of their former demesnes had thereby reduced their demand for villein labour services.
All these changes did not mean that there was ever a formal ‘abolition of serfdom’, and did not necessarily mean the abolition of other servile obligations, such as merchet and heriots.87 But they did lead to an inexorable erosion of villeinage. rodney hilton commented that ‘as customary [villeinage] tenures were turned into copyhold, as was general by the beginning of the fifteenth century, the servility associated with them seemed […] to melt away’.88 But in so many cases, what also ‘melted away’ was security of tenure for themselves and their offspring, i.e. inheritance rights that applied when villeins and their offspring were bound to the estate, since so many copyhold tenures were either ‘at will’ or were held from one to three ‘lives’. As eric Kerridge has observed, ‘twenty-one years and three lives were regarded as equivalents and were of much the same length in practice’, at least in the sixteenth century.89 if so, that change to copyhold tenures meant a substantial loss of the inheritance and thus property rights actually enjoyed by so many (if not all) villein tenants.90
The variety of these agrarian changes is far too great and far too complex to be considered fully in this study, all the more so since the extant estate accounts are so few, and often incomplete. But one very recent study of the norfolk Cathedral Priory’s Benedictine manors, for the later fourteenth and fifteenth centuries, does provide concrete evidence on prices, production costs, transport and storage costs, and annual profits (and losses) to justify all of the conclusions presented in this current study.91 At the risk of oversimplification, we may view these changes in the english agrarian economy and society, from the 1380s to the 1420s, as almost the mirror image of the subsequent transformation of the east
87 see hilton, The Decline of Serfdom, pp. 51–59 (‘The last profits of serfdom’).88 hilton, The Decline of Serfdom, p. 47. Also, p. 31: ‘Villeinage was never abolished; it
withered away’. ‘Copyhold’ means: tenure ‘by copy of the court roll according to the custom of the manor’. see Tawney, The Agrarian Problem in the Sixteenth Century, p. 47. he cites norden, The Surveyor’s Dialogue, to note that ‘All copyhold land is commonly customary, but all customary land is not copyhold’.
89 Kerridge, Agrarian Problems, p. 47.90 hatcher, ‘english serfdom and Villeinage’.91 slavin, ‘Church and Food Provisioning’.
Table 27. The Commodity Price index for england, 1300–1500, mean of prices for 1451–75 = 100 (a revision of the Phelps Brown and hopkins (PBh) ‘Basket of Consumables’ Price index)
Commodity Amount UnitMetric
MeasurePercent by
PBH weightsValue in
d. sterling
Percentage by value (Munro)
Farinaceouswheat 1.250 bu. 45.461 9.967 8.84%rye 1.000 bu. 36.369 6.279 5.57%Barley 0.500 bu. 18.184 2.606 2.31%Peas 0.667 bu. 24.243 2.947 2.61%Sub-total 3.417 bu. 124.257 20.00% 21.799 19.33%DrinkBarley (or malt) 4.500 bu. 163.659 22.50% 24.227 21.48%
Total Farinaceous 7.917 bu. 287.917 42.50% 46.026 40.80%
Meat, Fish, Dairysheep 0.500 no. 0.050 8.532 7.56%Pigs 0.500 no. 0.050 21.00% 15.418 13.67%herrings 40.000 no. 40.000 4.00% 6.595 5.85%Butter 10.000 lb. 4.536 10.238 9.08%Cheese 10.000 lb. 4.536 12.50% 5.341 4.74%Sub-total 37.50% 46.124 40.89%
IndustrialCharcoal 4.250 bu. 3.813 3.38%Candles 2.750 lb. 3.475 3.08%lamp oil 0.500 pt 7.50% 0.865 0.77%Canvas/linen 0.670 yd 2.757 2.44%shirting 0.500 yd 2.718 2.41%Coarse woollens 0.330 yd 12.50% 7.023 6.23%Sub-total 20.00% 20.651 18.31%
TOTAL 100.00% 112.801 100.00%
Abbreviations: no. – number; bu. – bushel = 36.39 litres; lb. – pound avoirdupois = 16 ounces = 453.59 grammes; pt – pint = 20 fluid ounces = 0.57 litres; yd – yard = 36 inches = 0.91 metres.
Sources: lse Archives, Phelps Brown, Box ia:324, J.iV.2a; Phelps Brown and hopkins, ‘seven Centuries of the Prices of Consumables’.

340 John Munro
German agrarian economy: from Grundherrschaft to Gutsherrschaft (from the later fifteenth to early seventeenth centuries).92 The latter is a manorial economy in which the landlord derived the bulk of his incomes from the direct commercial exploitation of his demesne lands, using chiefly servile labour; and the former is a manorial economy in which the landlord, with few demesne lands, derived the bulk of his incomes instead from the money rents of a largely free peasant tenancy. in this context, one might view the subsequent Tudor enclosure movement as an english reversion to a form of Gutsherrschaft (but with no servile labour). That, however, is another story to be told.
92 hagen, ‘how Mighty the Junkers?’; Brenner, ‘The rises and Declines of serfdom’; Blum, ‘The rise of serfdom in eastern europe’.

The Late Medieval Decline of English Demesne Agriculture 341
Works Cited
Manuscripts and Archival Resources
Algemeen rijksarchief, rekenkamer, 34,862
Brussels, Algemeen rijksarchief België, rekenkamer, reg. nos. 34,862
Algemeen rijksarchief, rekenkamer, 38,635–722
Brussels, Algemeen rijksarchief België, rekenkamer, reg. nos. 38,635–722
Algemeen rijksarchief, rekenkamer, 41,219–85
Brussels, Algemeen rijksarchief België, rekenkamer, reg. nos. 41,219–85
Gent, stadsarchief, stadsrekeningen, 1335–1520, 400:3.1–17.2
Gent, stadsarchief, stadsrekeningen, 1335–1520, reeks/series 400:3.1–17.2
leuven, stadsarchief, stadsrekeningen, 1345–1500, nos. 4986–5124
leuven, stadsarchief, stadsrekeningen, 1345–1500, nos. 4986–5124
lse Archives, Beveridge, Boxes A.30–33
london, london school of economics and Political science, British library of Political and economic science, Archives, Beveridge Price and wage history Commission, Boxes A.30–33
lse Archives, Beveridge, Box A.33
—— , Box A.33: winchester Manors
lse Archives, Beveridge, Box F.8 —— , Box F.8: winchester Collegelse Archives, Beveridge,
Box G.10—— , Box G.10: Croyland
lse Archives, Beveridge, Box G.14
—— , Box G.14: redgrave
lse Archives, Beveridge, Box h.10
—— , Box h.10: Battle Abbey
lse Archives, Phelps Brown, Box ia:324
london, london school of economics and Political science, British library of Political and econ-omic science, Archives, The Phelps Brown Papers, Box ia:324
lse Archives, Phelps Brown, Box J.iV.2.a
—— , Box J.iV.2.a
Mechelen, stadsarchief, stadsrekeningen, 1316–1550, series i: nos. 3–225
Mechelen, stadsarchief, stadsrekeningen, 1316–1550, reeks/series i: nos. 3–225

342 John Munro
Primary Sources
Calendar of the Fine Rolls Preserved in the Public Record Office, 22 vols (london, 1911–62) norden, John, The Surveyor’s Dialogue (London, 1618), ed. by Mark netzloff (Farnham:
Ashgate, 2010) Rotuli parliamentorum ut et petitiones et placita in Parliamento: Edward I–Henry VII, 6
vols (london, 1783)
Secondary Works
Barnes, Frederic r., ‘The Taxation of wool, 1327–1348’, in Finance and Trade under Edward III, ed. by George unwin (london, 1918), pp. 137–77
Bean, John M. w., ‘landlords’, in The Agrarian History of England and Wales, ed. by herbert P. r. Finberg and Joan Thirsk, 8 vols (Cambridge, 1967–2000), iii: 1348–1500, ed. by edward Miller (1991), pp. 526–86
Beardwood, Alice, Alien Merchants in England, 1350 to 1377: Their Legal and Economic Position, Mediaeval Academy of America, Monograph 3 (Cambridge, MA, 1931)
Beveridge, william, ‘wages in the winchester Manors’, Economic History Review, 7 (1936–37), 22–43
—— , ‘westminster wages in the Manorial era’, Economic History Review, 2nd ser., 8 (1955–56), 18–35
Blanchard, ian, ‘Population Change, enclosure, and the early Tudor economy’, Economic History Review, 2nd ser., 23 (1970), 427–45
Blum, Jerome, ‘The rise of serfdom in eastern europe’, American Historical Review, 62 ( July 1957), 807–36
Bolton, Jerome l., The Medieval English Economy, 1150—1500 (london, 1980) Boserup, ester, Population and Technological Change: A Study of Long-Term Trends
(Chicago, 1981) Brenner, robert, ‘The rises and Declines of serfdom in Medieval and early Modern
europe’, in Serfdom and Slavery: Studies in Legal Bondage, ed. by Michael l. Bush (london, 1996), pp. 247–76
Bridbury, Anthony r., ‘Before the Black Death’, Economic History Review, 2nd ser., 30 (1977), 393–410
—— , ‘The Black Death’, Economic History Review, 2nd ser., 26 (1973), 557–92 —— , Medieval English Clothmaking: An Economic Survey (london, 1982) Briggs, Chris D., ‘The Availability of Credit in the english Countryside’, Agricultural
History Review, 56 (2008), 1–24 —— , Credit and Village Society in Fourteenth-Century England, British Academy Post-
doctoral Fellowship Monograph (oxford, 2009) Britnell, richard h., ‘Feudal reaction after the Black Death in the Palatinate of Durham’,
Past and Present, 128 (1990), 28–47 Campbell, Bruce M. s., ‘Agricultural Progress in Medieval england: some evidence from
eastern norfolk’, Economic History Review, 2nd ser., 36 (1983), 38–39

The Late Medieval Decline of English Demesne Agriculture 343
—— , ‘Arable Productivity in Medieval england: some evidence from norfolk’, Journal of Economic History, 43 (1983), 379–404
—— , English Seigniorial Agriculture, 1250–1450, Cambridge studies in historical Geography, 31 (Cambridge, 2000)
—— , ‘Matching supply to Demand: Crop Production and Disposal by english Demesnes in the Century of the Black Death’, Journal of Economic History, 57 (1997), 827–58
—— , ‘Progressiveness and Backwardness in Thirteenth and early Fourteenth-Century english Agriculture: The Verdict of recent research’, in Peasants and Townsmen in Medieval Europe: Studia in honorem Adriaan Verhulst, ed. by Jean-Marie Duvosquel and erik Thoen, Belgisch Centrum voor landelijke Geschiedenis, 114 (Gent, 1995), pp. 541–59
—— , and Mark overton, ‘A new Perspective on Medieval and early Modern Agriculture: six Centuries of norfolk Farming, c. 1250–c. 1850’, Past and Present, 141 (1993), 38–105
Carus-wilson, eleanora M., and olive Coleman, England’s Export Trade, 1275–1547 (oxford, 1963)
Clark, Gregory, ‘The long March of history: Farm wages, Population, and economic Growth: england, 1209–1869’, Economic History Review, 2nd ser., 60 (2007), 97–135
Clay, Christopher G. A., Economic Expansion and Social Change: England, 1500—1700, 2 vols (Cambridge, 1984), ii: Industry, Trade, and Government
Day, John, ‘Crises and Trends in the late Middle Ages’, in John Day, The Medieval Market Economy (oxford, 1987), pp. 185–224
—— , ‘The Great Bullion Famine of the Fifteenth Century’, Past and Present, 79 (1978), 3–54 Du Boulay, Francis r. h., ‘who were Farming the english Demesnes at the end of the
Middle Ages?’, Economic History Review, 2nd ser., 17 (1965), 443–55 Dyer, Christopher, ‘Changes in Diet in the later Middle Ages: The Case of harvest
wor kers’, in Christopher Dyer, Everyday Life in Medieval England (london, 1994), pp. 77–99
—— , ‘The Consumer and the Market in the later Middle Ages’, Economic History Review, 2nd ser., 42 (1989), 305–27
—— , ‘english Diet in the later Middle Ages’, in Social Relations and Ideas: Essays in Honour of R. H. Hilton, ed. by Trevor h. Aston and others (Cambridge, 1983), pp. 191–216
—— , Lords and Peasants in a Changing Society: The Estates of the Bishopric of Worcester, 680–1540, Past and Present Publications (Cambridge, 1980)
—— , Standards of Living in the Later Middle Ages: Social Change in England, c. 1200–1520 (Cambridge, 1998)
Farmer, David, ‘Crop yields, Prices and wages in Medieval england’, Studies in Medieval and Renaissance History, 6 (1983), 117–55
—— , ‘The Famuli in the later Middle Ages’, in Progress and Problems in Medieval England: Essays in Honour of Edward Miller, ed. by richard Britnell and John hatcher (Cambridge, 1996), pp. 207–36
—— , ‘Prices and wages’, in The Agrarian History of England and Wales, ed. by herbert P. r. Finberg and Joan Thirsk, 8 vols (Cambridge, 1967–2000), ii: 1042–1350, ed. by herbert e. hallam (1988), pp. 715–817

344 John Munro
—— , ‘Prices and wages, 1350–1500’, in The Agrarian History of England and Wales, ed. by herbert P. r. Finberg and Joan Thirsk, 8 vols (Cambridge, 1967–2000), iii: 1348–1500, ed. by edward Miller (1991), pp. 431–525
Given-wilson, Chris, ‘labour in the Context of the english Government’, in The Problem of Labour in Fourteenth-Century England, ed. by James Bothwell, P. J. P. Goldberg, and w. Mark ormrod, york Medieval Press Publications (woodbridge, 2000), pp. 85–100
Gras, norman s. B., The Early English Customs System: A Documentary Study of the Institutional and Economical History of the Customs from the Thirteenth to the Sixteenth Century, harvard economic series, 18 (Cambridge, MA, 1918)
Gray, howard l., ‘The Production and exportation of english woollens in the Fourteenth Century’, English Historical Review, 39 (1924), 13–35
hagen, william, ‘how Mighty the Junkers? Peasant rents and seigneurial Profits in sixteenth-Century Brandenburg’, Past and Present, 108 (1985), 80–116
hare, John n., ‘The Monks as landlords: The leasing of the Demesnes in southern england’, in The Church in Pre-Reformation Society: Essays in Honour of R. H. Du Boulay, ed. by Caroline M. Barron and Christopher harper-Bill (woodbridge, 1985), pp. 82–94
harvey, Barbara, Westminster Abbey and its Estates in the Middle Ages (oxford, 1977) hatcher, John, ‘england in the Aftermath of the Black Death’, Past and Present, 144
(1994), 3–35 —— , ‘english serfdom and Villeinage: Towards a reassessment’, Past and Present, 90
(1981), 3–39 —— , ‘The Great slump of the Mid-Fifteenth Century’, in Progress and Problems in Medi-
eval England: Essays in Honour of Edward Miller, ed. by richard Britnell and John hatcher (Cambridge, 1996), pp. 237–72
—— , ‘Mortality in the Fifteenth Century: some new evidence’, Economic History Review, 2nd ser., 39 (1986), 19–38
—— , Plague, Population, and the English Economy, 1348–1530 (Basingstoke, 1977) hicks, Michael, ed., Revolution and Consumption in Late Medieval England, The Fifteenth
Century, 2 (woodbridge, 2001) hilton, rodney, The Decline of Serfdom in Medieval England, studies in economic
history (london, 1969) Kerridge, eric, Agrarian Problems in the Sixteenth Century and After, historical Problems:
studies and Documents, 6 (london, 1969) Keynes, John Maynard, The General Theory of Employment, Interest and Money (london,
1936) Kosminsky, evgenii A., Studies in the Agrarian History of England in the Thirteenth Century,
ed. by rodney h. hilton, trans. by ruth Kisch, studies in Mediaeval history, 8 (oxford, 1956)
langdon, John, ‘waged Building employment in Medieval england: subsistence safety net or Demographic Trampoline?’, in Survival and Discord in Medieval Society: Essays in Honour of Christopher Dyer, ed. by richard Goddard, John langdon, and Miriam Müller, Medieval Countryside, 4 (Turnhout, 2010), pp. 109–26
lloyd, Terence h., The English Wool Trade in the Middle Ages (Cambridge, 1977)

The Late Medieval Decline of English Demesne Agriculture 345
—— , The Movement of Wool Prices in Medieval England, economic history review supplements, 6 (Cambridge, 1973)
lopez, robert, and harry Miskimin, ‘The economic Depression of the renaissance’, Economic History Review, 2nd ser., 14 (1962), 408–26
Mayhew, nicholas J., ‘Population, Money supply, and the Velocity of Circulation in england, 1300–1700’, Economic History Review, 2nd ser., 48 (1995), 238–57
Miskimin, harry A., The Economy of Early Renaissance Europe, 1300–1460 (Cambridge, 1975)
—— , ‘Monetary Movements and Market structures: Forces for Contraction in 14th and 15th Century england’, Journal of Economic History, 24 (1964), 470–90
Molà, luca, The Silk Industry of Renaissance Venice (Baltimore, 2000) Munro, John, ‘Before and After the Black Death: Money, Prices, and wages in Fourteenth-
Century england’, in New Approaches to the History of Late Medieval and Early Mod-ern Europe: Selected Proceedings of Two International Conferences at the Royal Danish Academy of Sciences and Letters in Copenhagen in 1997 and 1999, ed. by Troels Dahlerup and Per ingesman, historisk-filosofiske Meddelelser, 104 (Copenhagen, 2009), pp. 335–64
—— , ‘Builders’ wages in southern england and the southern low Countries, 1346–1500: A Comparative study of Trends in and levels of real incomes’, in L’Edilizia prima della rivoluzione industriale, secc. xiii–xviii: Atti delle ‘settimana di studi’, 26–30 aprile 2004, ed. by simonetta Cavaciocchi, Atti delle ‘settimana di studi’ e altri convegni, 36 (Florence, 2005), pp. 1013–76
—— , Bullion Flows and Monetary Policies in England and the Low Countries, 1350–1500, Collected studies, 355 (Aldershot, 1992)
—— , ‘Gold, Guilds, and Government: The impact of Monetary and labour Policies on the Flemish Cloth industry, 1390–1435’, Jaarboek voor middeleeuwse geschiedenis, 5 (2002), 153–205
—— , ‘hanseatic Commerce in Textiles from the low Countries and england during the later Middle Ages: Changing Trends in Textiles, Markets, Prices, and Values, 1290–1570’, in Von Nowgorod bis London: Studien zu Handel, Wirtschaft und Gesellschaft im mittelalterlichen Europa; Festschrift für Stuart Jenks zum 60. Geburtstag, ed. by Marie-luise heckmann and Jens röhrkasten, nova Mediaevalia, 4 (Göttingen, 2008), pp. 97–182
—— , ‘The “industrial Crisis” of the english Textile Towns, 1290–1330’, in Thirteenth-Century England, vii, ed. by Michael Prestwich, richard Britnell, and robin Frame (woodbridge, 1999), pp. 103–41
—— , ‘industrial Protectionism in Medieval Flanders: urban or national?’, in The Medieval City, ed. by harry Miskimin, David herlihy, and Abraham l. udovitch (new haven, 1977), pp. 229–68
—— , ‘industrial Transformations in the north-west european Textile Trades, c. 1290–c. 1340: economic Progress or economic Crisis?’ in Before the Black Death: Studies in the ‘Crisis’ of the Early Fourteenth Century, ed. by Bruce M. s. Campbell (Manchester, 1991), pp. 110–48
346 John Munro
—— , ‘The Medieval scarlet and the economics of sartorial splendour’, in Cloth and Clothing in Medieval Europe: Essays in Memory of Professor E. M. Carus-Wilson, ed. by negley B. harte and Kenneth G. Ponting, Pasold studies in Textile history, 2 (london, 1983), pp. 13–70
—— , ‘Medieval woollens: Textiles, Textile Technology, and industrial organisation, c. 800–1500’, in The Cambridge History of Western Textiles, ed. by David Jenkins, 2 vols (Cambridge, 2003), i, 181–227
—— , ‘Medieval woollens: The western european woollen industries and their struggles for international Markets, c. 1000–1500’, in The Cambridge History of Western Textiles, ed. by David Jenkins, 2 vols (Cambridge, 2003), i, 228–324
—— , ‘Money, Prices, wages, and “Profit inflation” in spain, the southern netherlands, and england during the Price revolution era, c. 1520–c. 1650’, História e Economia: Revista Interdisciplinar, 4 (2008), 13–71
—— , ‘The origins of the english “new Draperies”: The resurrection of an old Flemish industry, 1270–1570’, in The New Draperies in the Low Countries and England, 1300–1800, ed. by negley B. harte, Pasold studies in Textile history, 10 (oxford, 1997), pp. 35–127
—— , ‘spanish Merino wools and the Nouvelles Draperies: An industrial Transformation in the late-Medieval low Countries’, Economic History Review, 2nd ser., 58 (2005), 431–84
—— , ‘The symbiosis of Towns and Textiles: urban institutions and the Changing Fortunes of Cloth Manufacturing in the low Countries and england, 1270–1570’, Journal of Early Modern History, 3 (1999), 1–74
—— , ‘Three Centuries of luxury Textile Consumption in the low Countries and england, 1330–1570: Trends and Comparisons of real Values of woollen Broadcloths (Then and now)’, in The Medieval Broadcloth: Changing Trends in Fashions, Manufacturing, and Consumption, ed. by Kathrine Vestergård and Marie louise nosch, Ancient Textile series, 5 (oxford, 2009), pp. 1–73
—— , ‘wage-stickiness, Monetary Changes, and real incomes in late-Medieval england and the low Countries, 1300–1500: Did Money Matter?’ Research in Economic His-tory, 21 (2003), 185–297
—— , ‘wool-Price schedules and the Qualities of english wools in the later Middle Ages, ca. 1270–1499’, Textile History, 9 (1978), 118–69
Muthesius, Anna, ‘silk in the Medieval world’, in The Cambridge History of Western Textiles, ed. by David Jenkins, 2 vols (Cambridge: 2003), i, 325–54
nightingale, Pamela, ‘england and the european Depression of the Mid-Fifteenth Century’, Journal of European Economic History, 26 (1997), 631–56
—— , ‘Monetary Contraction and Mercantile Credit in later Medieval england’, Economic History Review, 2nd ser., 43 (1990), 560–75
ormrod, w. Mark, ‘The Crown and the english economy, 1290–1348’, in Before the Black Death: Studies in the ‘Crisis’ of the Early Fourteenth Century, ed. by Bruce M. s. Campbell (Manchester, 1991), pp. 149–83

The Late Medieval Decline of English Demesne Agriculture 347
Penn, simon, and Christopher Dyer, ‘wages and earnings in late Medieval england: evidence from enforcement of the labour laws’, Economic History Review, 2nd ser., 43 (1990), 356–76
Phelps Brown, e. henry, and sheila V. hopkins, ‘seven Centuries of Building wages’, Economica, 22 (1955), 195–206 (repr. in henry Phelps Brown and sheila V. hopkins, A Perspective of Wages and Prices (london, 1981), pp. 1–12)
—— , ‘seven Centuries of the Prices of Consumables, Compared with Builders’ wage rates’, Economica, 23 (1956), 296–314 (repr. in Essays in Economic History, ed. by eleanora M. Carus-wilson, 3 vols (london, 1954–62), ii (1962), 168–96; also repr. in e. henry Phelps Brown and sheila V. hopkins, A Perspective of Wages and Prices (london, 1981), pp. 13–39 (with price indexes not in the original)
Poos, lawrence r., ‘The social Context of statute of labourers enforcement’, Law and History Review, 1 (1983), 27–52
Postan, Michael, ‘The Trade of Medieval europe: The north’, in The Cambridge Economic History of Europe, ed. by Michael M. Postan and hrothgar J. habakkuk, 8 vols in 10 pts (Cambridge, 1952–78), ii, Trade and Industry in the Middle Ages, ed. by Michael M. Postan and edwin e. rich (1952), pp. 168–305
Power, eileen, The Wool Trade in English Medieval History, Ford lectures, 1939 (london, 1941)
Putnam, Bertha h., The Enforcement of the Statute of Labourers during the First Decade after the Black Death, studies in history, economics, and Public law, 32 (new york, 1908)
raftis, J. Ambrose, ‘Peasants and the Collapse of the Manorial economy on some ramsey Abbey estates’, in Progress and Problems in Medieval England: Essays in Honour of Edward Miller, ed. by richard Britnell and John hatcher (Cambridge: Cambridge university Press, 1996), pp. 191–206
—— , Peasant Economic Development within the English Manorial System (Montreal, 1997) —— , Tenure and Mobility: Studies in the Social History of the Mediaeval English Village,
studies and Texts, 8 (Toronto, 1964) rigby, stephen h., English Society in the Later Middle Ages: Class, Status, and Gender
(Basingstoke, 1995) slavin, Philip, ‘Church and Food Provisioning in late-Medieval england, 1250–1450:
Production Costs, Markets, and the Decline of Direct Demesne Management’, in Religione et istituzioni religiose nell’economia europea, 1000–1800 / Religion and Reli-gious Institutions in the European Economy, 1000–1800), ed. by Francesco Ammannati, Fondazione internazionale di storia economica ‘F. Datini’, Fondazione istituto internazionale di storia economica ‘F. Datini’, Prato, 2nd ser. (Atti delle ‘settimane de studi’ e altri Convegni), 43 (Firenze: Firenze university Press, 2012), pp. 597–617
spufford, Peter, Money and its Use in Medieval Europe (Cambridge, 1988) stone, David, Decision-Making in Medieval Agriculture (oxford, 2005) —— , ‘Medieval Farm Management and Technological Mentalities: hinderclay Before the
Black Death’, Economic History Review, 2nd ser., 54 (2001), 612–38

348 John Munro
—— , ‘The Productivity and Management of sheep in late Medieval england’, Agricultural History Review, 50 (2003), 1–22
—— , ‘The Productivity of hired and Customary labour: evidence from wisbech Barton in the Fourteenth Century’, Economic History Review, 2nd ser., 50 (1997), 640–56
Tawney, richard h., The Agrarian Problem in the Sixteenth Century, Burt Franklin research and source works series, 13 (london, 1912; repr. 1967)
Van der wee, herman, and Theo Peeters, ‘un Modèle dynamique de croissance inter-seculaire du commerce mondiale, xiie–xviiie siècles’, Annales: Économies, Sociétés, Civi-lisa tions, 15 (1970), 100–28