$t - i fish illinois
TRANSCRIPT

Stephen Pescitelli and Tristan Widloe
Division of Fisheries
Region II Streams Program
5931 Fox River Drive
Plano, IL 60548
Current Status of Fish Assemblages and the Sport Fishery in the Des Plaines River Watershed –
Changes over 44 years of Basin Surveys
Stephen Pescitelli and Tristan Widloe Division of Fisheries 5931 Fox River Drive
Plano, IL 60545 [email protected]
#Y
#Y
#Y
#Y
#Y
#Y
#Y
#Y
#Y
#Y
#Y
#Y
#Y
#Y
#Y#Y
#Y
$T
LAKE
COOK
DUPAGE
WILL
Brandon Lock and Dam
Sal t C
reek
Mil l C
ree
k
DuP
age R
ive
r
DES PLAIN
ES R

2 |D e s P l a i n e s R i v e r B a s i n S u r v e y
Executive Summary
This report summarizes the fish sampling portion of the 2018 IDNR/IEPA basin survey in the Des Plaines River Watershed, with descriptions of current species composition, distribution, stream quality, and sport fishery status, including comparisons to six previous basin surveys over the past 44 years. We also discuss recent improvements and future threats to ongoing restoration efforts, including the Brandon Road Lock and Dam (BRLD) fish barrier.
Ten thousand six hundred sixty-seven fish were collected at 32 stations throughout the Des Plaines River and its tributaries in 2018, representing 15 families and 70 species. Three State Threatened fish species were collected: Blackchin Shiner, Banded Killifish and Iowa Darter. Non-native fish species included Common Carp, Goldfish, and Round Goby. No Asian Carp species were collected or observed.
Sixteen Des Plaines River mainstem stations yielded 3,763 fish, including 54 native species and three non-native species: Common Carp, Goldfish, and Round Goby. Two State Listed species were collected from the mainstem: Iowa Darter and Blackchin Shiner. Species richness at individual station ranged from 13 species at I-55 Bridge (G-01) to 31 at Riverside (G-39). Bluegill, Largemouth Bass, Bluntnose Minnow, Gizzard Shad, and Green Sunfish were the most abundant species in 2018. The number of fish species collected on the mainstem in 2018 (n=54) were similar to the last survey in 2013 (n=57). However, species richness on the mainstem has improved substantially since 1974 when only 20 species were collected at fourteen stations. In five basin surveys from 1983 to 2013, 44 fish species have been collected upstream of BRLD which were not present in 1974. Reduced fish species richness in earlier surveys in 1974 and 1983 was due to poor water quality conditions. Many of the fish species collected since 1974 appear to have migrated upstream through the Brandon Lock from the lower Des Plaines/Illinois Rivers and were able to persist due to improved water quality conditions. Evidence of migration through the Brandon Lock was recently documented by chemical analysis of the fin rays from seven species collected upstream of the Lock. Despite significant increases in species richness, Index of Biotic Integrity (IBI) scores remain in low to moderate range 25 to 39 (total range 0 to 60); below the IEPA threshold for “Good Resource Quality/Full Support of Aquatic Life” (IBI≥41). Improvement in IBI scores will rely on recruitment of intolerant and specialist species from sources downstream of the BRLD. This migration route will be closed when the Brandon Road fish barrier is installed precluding continued natural restoration of fish assemblages. Based on IEPA macroinvertebrate data and appearance of intolerant fish species like Rosyface Shiner, current water quality is adequate to support additional intolerant and specialist species upstream of BRLD. In fact, in 2017 the McCook Reservoir came on line adding 3.5 billion gallons of capacity to the Des Plaines River Tunnel and Reservoir System. This additional capacity reduced combined sewer overflow events resulting in improved IBIs and sportfish abundance in 2018 at the stations downstream of Salt Creek. Catch rate of sportfish increased from 57 in 2013 to 121 in 2018, owing in large part to increases in abundance in the lower river resulting from the addition of the McCook Reservoir. The increase in Smallmouth Bass, an intolerant species, was particularly notable. Differences in size distribution between 2013 and 2018 suggest that many of the larger Smallmouth Bass captured in 2018 migrated from below BRLD, suggesting that populations upstream of BRLD rely on recruitment from downstream.
We collected 5,628 fish of 47 native species at 10 Des Plaines River tributary sites. Species richness ranged from 12 to 26. State Listed species included Blackchin Shiner, Banded Killifish, and Iowa Darter. Five species accounted for 67% of the total abundance for the tributary stations: Central Stoneroller, Bluntnose Minnow, Creek Chub, Blackstripe Topminnow and Striped Shiner. Eight species occurred only at tributary locations downstream of BRLD: Suckermouth Minnow, Redfin Shiner, Rosyface Shiner, Golden Redhorse, Rock Bass, Smallmouth Bass, Longear Sunfish, and Orangethroat Darter. Tributary IBI scores ranged from 27 to 49. Jackson and Bull Creeks were only locations which met or exceeded IEPA IBI threshold for “Full Support of Aquatic Life” (IBI≥41). Similar to the Des Plaines River mainstem, macroinvertebrate sampling results for the tributary locations generally indicated better quality conditions compared to fish IBI, with six of the 11 locations rating “Good Resource Quality/Fully Supporting” based on the mIBI. From 1983 to 2018, improvements in IBI were observed at sites on urbanized streams, whereas agricultural streams, located lower in the watershed, showed little change. Larger sportfish were low in abundance at the tributary locations.
3 |D e s P l a i n e s R i v e r B a s i n S u r v e y
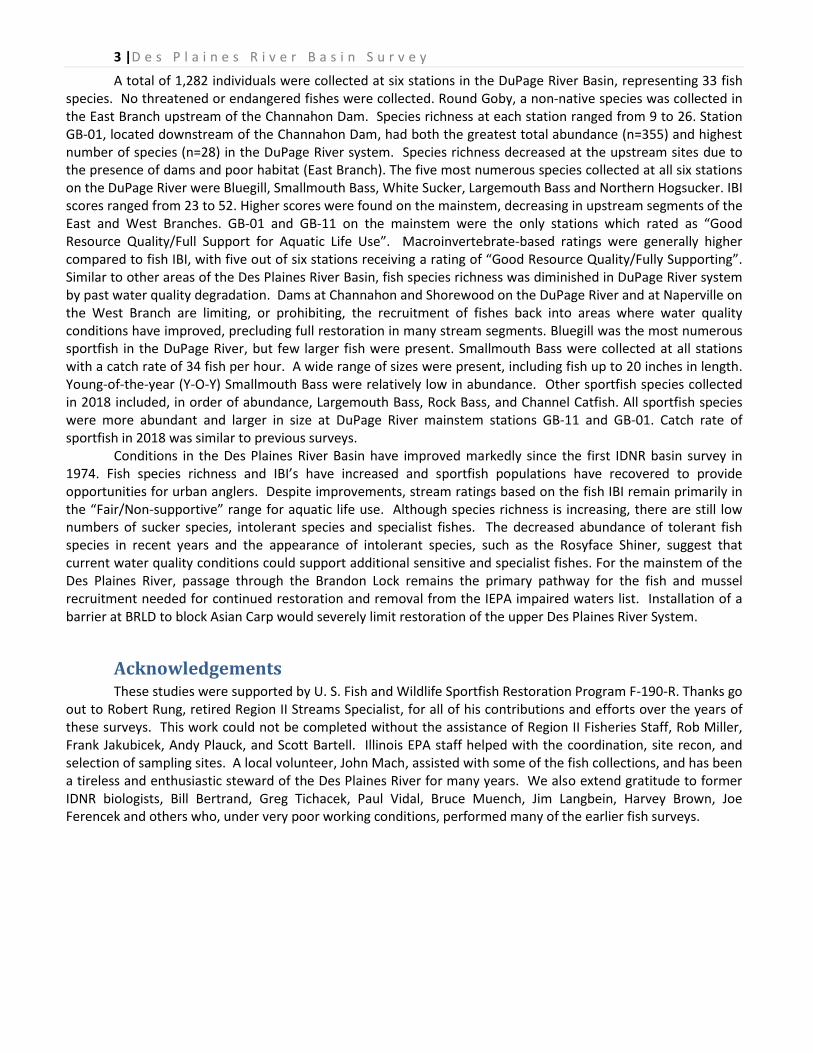
A total of 1,282 individuals were collected at six stations in the DuPage River Basin, representing 33 fish species. No threatened or endangered fishes were collected. Round Goby, a non-native species was collected in the East Branch upstream of the Channahon Dam. Species richness at each station ranged from 9 to 26. Station GB-01, located downstream of the Channahon Dam, had both the greatest total abundance (n=355) and highest number of species (n=28) in the DuPage River system. Species richness decreased at the upstream sites due to the presence of dams and poor habitat (East Branch). The five most numerous species collected at all six stations on the DuPage River were Bluegill, Smallmouth Bass, White Sucker, Largemouth Bass and Northern Hogsucker. IBI scores ranged from 23 to 52. Higher scores were found on the mainstem, decreasing in upstream segments of the East and West Branches. GB-01 and GB-11 on the mainstem were the only stations which rated as “Good Resource Quality/Full Support for Aquatic Life Use”. Macroinvertebrate-based ratings were generally higher compared to fish IBI, with five out of six stations receiving a rating of “Good Resource Quality/Fully Supporting”. Similar to other areas of the Des Plaines River Basin, fish species richness was diminished in DuPage River system by past water quality degradation. Dams at Channahon and Shorewood on the DuPage River and at Naperville on the West Branch are limiting, or prohibiting, the recruitment of fishes back into areas where water quality conditions have improved, precluding full restoration in many stream segments. Bluegill was the most numerous sportfish in the DuPage River, but few larger fish were present. Smallmouth Bass were collected at all stations with a catch rate of 34 fish per hour. A wide range of sizes were present, including fish up to 20 inches in length. Young-of-the-year (Y-O-Y) Smallmouth Bass were relatively low in abundance. Other sportfish species collected in 2018 included, in order of abundance, Largemouth Bass, Rock Bass, and Channel Catfish. All sportfish species were more abundant and larger in size at DuPage River mainstem stations GB-11 and GB-01. Catch rate of sportfish in 2018 was similar to previous surveys.
Conditions in the Des Plaines River Basin have improved markedly since the first IDNR basin survey in 1974. Fish species richness and IBI’s have increased and sportfish populations have recovered to provide opportunities for urban anglers. Despite improvements, stream ratings based on the fish IBI remain primarily in the “Fair/Non-supportive” range for aquatic life use. Although species richness is increasing, there are still low numbers of sucker species, intolerant species and specialist fishes. The decreased abundance of tolerant fish species in recent years and the appearance of intolerant species, such as the Rosyface Shiner, suggest that current water quality conditions could support additional sensitive and specialist fishes. For the mainstem of the Des Plaines River, passage through the Brandon Lock remains the primary pathway for the fish and mussel recruitment needed for continued restoration and removal from the IEPA impaired waters list. Installation of a barrier at BRLD to block Asian Carp would severely limit restoration of the upper Des Plaines River System.
Acknowledgements These studies were supported by U. S. Fish and Wildlife Sportfish Restoration Program F-190-R. Thanks go
out to Robert Rung, retired Region II Streams Specialist, for all of his contributions and efforts over the years of these surveys. This work could not be completed without the assistance of Region II Fisheries Staff, Rob Miller, Frank Jakubicek, Andy Plauck, and Scott Bartell. Illinois EPA staff helped with the coordination, site recon, and selection of sampling sites. A local volunteer, John Mach, assisted with some of the fish collections, and has been a tireless and enthusiastic steward of the Des Plaines River for many years. We also extend gratitude to former IDNR biologists, Bill Bertrand, Greg Tichacek, Paul Vidal, Bruce Muench, Jim Langbein, Harvey Brown, Joe Ferencek and others who, under very poor working conditions, performed many of the earlier fish surveys.

4 |D e s P l a i n e s R i v e r B a s i n S u r v e y
Contents
Introduction ....................................................................................................................................................5
Study Area ......................................................................................................................................................5
Methods ..........................................................................................................................................................8
Results and Discussion ................................................................................................................................ 10
Des Plaines River – Mainstem ..................................................................................................................... 11
Distribution and Abundance .................................................................................................................... 11
Current Conditions. .............................................................................................................................. 11
Stream Quality/Index of Biotic Integrity (IBI). ............................................................................. 14
Sportfish ................................................................................................................................................... 17
Des Plaines River – Tributaries.................................................................................................................... 18
Distribution and Abundance .................................................................................................................... 18
Stream Quality/Index of Biotic Integrity (IBI)........................................................................................... 20
Sportfish ................................................................................................................................................... 21
DuPage River ............................................................................................................................................... 22
Distribution and Abundance .................................................................................................................... 22
Stream Quality/Index of Biotic Integrity (IBI)........................................................................................... 25
Sportfish ................................................................................................................................................... 26
Summary ...................................................................................................................................................... 27
References ................................................................................................................................................... 28
Appendix ...................................................................................................................................................... 30

5 |D e s P l a i n e s R i v e r B a s i n S u r v e y
Introduction The Des Plaines River Basin provides a valuable and accessible resource for urban residents in
Northeastern Illinois. These once highly degraded streams now support areas of diverse and sustainable fisheries
and have seen extensive restoration efforts including dam removals, channel restoration, as well as watershed-
based planning and remediation efforts. As part of the Illinois Department of Natural Resources (IDNR) Dam
Removal Initiative, nine of the 11 dams on the mainstem of the Des Plaines River have been removed to date.
The remaining two dams upstream of the Brandon Road Lock and Dam (BRLD) are slated for removal in 2019,
which will create over 96 miles of free flowing river, one of the longest in Northern Illinois. Three dams have
been removed on the DuPage River system with additional dam removals and fish passage projects planned.
Although water quality conditions have improved over the past 50 years, most of the Des Plaines River
remains impaired for Aquatic Life, Recreation, and Fish Consumption (IEPA 2016). Recently, the Upper and Lower
Des Plaines River Watershed Groups were formed to address water quality impairments. Watershed planning and
resources monitoring are ongoing with financial support for the groups coming from Illinois Environmental
Protection Agency (IEPA).
IDNR Division of Fisheries conducts fish surveys in the Des Plaines River Basin every five years as part of a
Statewide Monitoring Program. In collaboration with the IEPA, the surveys also include macroinvertebrates,
water quality, and habitat evaluation. Since 1983, five cooperative basin surveys with IEPA have been completed
in the Des Plaines River Watershed. In addition, IDNR conducted fish surveys in 1974 (Langbein and Wright 1976)
prior to initiation of the formal Basin Survey program in 1994. Other fish collections at select sites included
Muench (1968), Smith (1971), Heidinger (1989) and Day (1991). McClelland et al. (2004) reported on results of
long term fish monitoring on the lower Des Plaines River below BRLD. A recent publication from the Illinois
Natural History Survey also discussed historic condition of fish assemblages in the lower Des Plaines and Illinois
River Waterways, documenting improvements resulting from the Clean Water Act (Gibson-Reinemer et al. 2017).
This report summarizes the fish sampling portion of the most recent Des Plaines River Basin Survey
conducted in 2018. In addition to describing current species composition, distribution and stream quality, results
were compared to previous basin surveys over the past 44 years. We also examine sportfish populations and
discuss potential factors influencing fish assemblages at mainstem and tributary locations.
Study Area The Des Plaines River originates near Racine, Wisconsin in Kenosha County, entering Illinois two miles
north of Rosecrans in Lake County. The river runs primarily south for 110 miles in Illinois where it joins the
Kankakee River to form the Illinois River, near Channahon (Figure 1). Total watershed area includes
approximately 2,110 square miles, 1,231 of which are in Illinois (Healy 1979). The drainage area was increased by
673 square miles after diversion of Lake Michigan water through the Chicago Sanitary and Ship Canal (CSSC) and
the Cal Sag Channel in the early 1900's (MWRD 2018). The CSSC joins the Des Plaines River at river mile 17, just
north of Joliet. A 16 mile section of the Des Plaines River, from approximately Romeoville to 47th Street, was
channelized as part of the CSSC Construction.
The Des Plaines River is a low gradient stream falling 120 feet in elevation over its 110 mile length in
Illinois, with an average slope of 1.2 feet/mile. Higher gradient areas are found in a short segment near Riverside
and from Romeoville to the CSSC, where the gradient increases to nearly seven feet/mile.
The DuPage River is the largest tributary to the Des Plaines River, with a watershed covering 353 square
miles (Healy 1979), including urbanized areas of DuPage County. Other larger tributaries include Salt Creek, (150
square miles), Hickory Creek (107 square miles), Jackson Creek (52 square miles) and Mill Creek (31 square miles).

6 |D e s P l a i n e s R i v e r B a s i n S u r v e y
The Des Plaines River Watershed is very narrow, especially in the upper part of the basin, reaching less than eight
miles across at its narrowest point. Therefore, many of the upper tributaries are very short in length with small
watershed areas (< 30 square miles).
The watershed includes parts of Lake, Cook, DuPage, Grundy, and Will counties in Northeastern Illinois
(Figure 2). With over 6 million people residing in the watershed, land use is 58.7% urban development with an
additional 33.2% in agriculture. By comparison, urban land use in the Fox River Basin is 17.5% and 3.5%
statewide. Parts of the Des Plaines River Watershed, including Salt Creek, have very high density development
and extensive urban land cover. Tributaries in the lower Des Plaines River Basin (Jackson and Hickory Creek) still
retain substantial agricultural land use.
Figure 1. Map of the Des Plaines River Watershed including streams sampled in the 2018 Basin Survey and connection to the Chicago Sanitary and Ship Canal and Cal Sag Channel.
The Des Plaines/DuPage River Watershed has a large number of wastewater treatment (n=85) and other
industrial treatment facilities (n=66), which discharge 1,221 million gallons of wastewater per day into the stream
system (IEPA 2016). Much of that flows into the lower watershed through the CSSC as municipal wastewater,

7 |D e s P l a i n e s R i v e r B a s i n S u r v e y
originating from Lake Michigan. Mean discharge at Romeoville, downstream of the CSSC, is 3,536 cubic feet per
second (cfs) for 739 square miles of watershed area, compared to mean discharge at Riverside of 535 cfs for 630
square miles (USGS 2018). There are 51 combined sewer overflow (CSO) outlets along the Des Plaines River
between O’Hare Airport and I-294 Bridge (MWRD 2018). The Tunnel and Reservoir Program (TARP) designed to
capture CSOs for subsequent treatment includes a 27 mile tunnel system under the Des Plaines River, completed
in 1999 with a capacity of 405 million gallons. CSO events decreased after completion of the tunnel but were still
common until 2017 when McCook Reservoir came on line with additional capacity of 3.7 billion gallons which
reduced CSO events substantially.
A total of 44 dams are listed for the Des Plaines River Watershed (Figure 2, USACE 2013). BRLD in
Rockdale is 2,391 wide and 35 feet tall, located 13 miles upstream from the Illinois River confluence (Figure 2). A
proposal to install an invasive fish barrier within the lock chamber has recently been approved to keep Asian Carp
from swimming upstream to the Great Lakes (USACE 2019). The barrier will also block native fish migration.
Upstream of Brandon Road, there were 11 low head dams, nine of which have been removed. Two additional
dams at Touhy and Devon Avenues are slated for removal in 2019. In the DuPage River Basin, three dams have
$T
$T$T
$T
$T
$T
$T$T$T$T$T$T
$T
$T$T$T$T
$T
$T
$$TT
$T
$T$T$T$T
$T$T
$T
$T
$T
$T
$T
$T$T$T
$T$T
$T
$T
$T$T
$T
$T
ôó53
DuP
age
Riv
er
#
BRANDON ROAD LOCK & DAM
#
LOCKPORT LOCK AND DAM (on CSSC)
#
TOUHY AVENUE DAM (to be removed)
#
DEMPSTER ST. DAM (to be removed)
#
FAWELL DAM
#
SHOREWOOD DAM (to be removed)
#CHANNAHON DAM
DES PLAINES R
CHICAGO S
ANIT &
SHIP
C#
MORTON ARBORETUM DAM
0 50 Miles
Counties
Chicago Sanitary and Ship CanalTributary Streams
Des Plaines River Mainstem$T Lowhead Dams$T Brandon Road Lock and Dam
N
EW
S
Figure 2. Dam locations in the Des Plaines River Basin. Lockport Lock and Dam is located on the Chicago Sanitary and Ship Canal (CSSC).

8 |D e s P l a i n e s R i v e r B a s i n S u r v e y
been removed in recent years, including two on the West Branch at McDowell Grove and Warrenville, and one on
the East Branch at Churchill Woods.
The Des Plaines River Watershed includes 24 state nature preserves covering 5,850 acres, natural areas
totaling over 13,000 acre and the Des Plaines State Conservation Area (4,600 acres), located near the confluence
with the Kankakee River. Forest Preserve Districts in Lake, Cook, DuPage, and Will Counties own over 300
properties, many of which are in the Des Plaines River Watershed, including extensive areas along the mainstem
of the Des Plaines and DuPage Rivers.
Methods Fish were sampled at 32 stations in 2018, including 16 stations on the Des Plaines River mainstem, 10 on
Des Plaines River tributaries and six stations in the DuPage River watershed (Figure 3, Table 1). At wider, non-
wadeable stations, fish were sampled using pulsed DC boat electrofishing. Seine hauls were also performed at
boat sites where depth and structure allowed, using a 30-ft. long, 0.25-in. mesh minnow seine. Three hauls were
made in an upstream direction along the shoreline. Each haul was approximately 50-ft. in length. Seine data was
used only for species presence absence and was not include in other quantitative analyses. Wadeable tributary
sites were sampled using a 30-ft. long electric seine powered by a single-phase, 2,000 watt AC generator (Bayley
IEPA STATION
CODE STREAM LOCALITY COUNTY LAT LONG
SAMPLING
DATE METHOD
SAMPLE
TIME (min)
G-08 DES PLAINES RIVER DNS RUSSELL ROAD LAKE CO FP LAKE 42.48925 -87.92592 7/17/2018 BE 40
G-25* DES PLAINES RIVER WADSWORTH RD WADSWORTH LAKE 42.428790 -87.930420 7/17/2018 BE 50
G-07* DES PLAINES RIVER RT 120 /BELVIDERE RD BR W OF GURNEE LAKE 42.343710 -87.940900 7/18/2018 BE 60
G-35* DES PLAINES RIVER DAN WRIGHT FOREST PRESERVE LAKE 42.219710 -87.933290 7/18/2018 BE 50
G-46 DES PLAINES RIVER DAM #2 WOODS COOK COUNTY FOREST PRSRVE COOK 42.079842 -87.889781 7/19/2018 BE 50
G-38 DES PLAINES RIVER TOUHY AV PK RIDGE COOK 42.010330 -87.861320 7/24/2018 BE 50
G-15 DES PLAINES RIVER IRVING PK RD IN SCHILLER PARK COOK 41.953060 -87.854200 7/24/2018 BE 60
G-30 DES PLAINES RIVER GRAND AV FRANKLIN PARK COOK 41.929580 -87.845470 7/24/2018 BE 60
G-44 DES PLAINES RIVER BETWEEN FOREST AVE AND 26TH ST COOK 41.835989 -87.827500 9/26/2018 BE 45
G-39* DES PLAINES RIVER RIVERSIDE/ LYONS COOK 41.825426 -87.818492 7/25/2018 BE 60
G-18* DES PLAINES RIVER WILLOW SPRINGS RD COLUMBIA WOODS COOK 41.735450 -87.881660 7/19/2018 BE 50
G-03 DES PLAINES RIVER US LEMONT RD COOK 41.681560 -88.002200 7/27/2018 BE 60
G-02 DES PLAINES RIVER 135 ST AT ROMEOVILLE ISLE LA CACHE FP WILL 41.640380 -88.071500 7/19/2018 BE 60
G-11* DES PLAINES RIVER DIVISION ST BR AT LOCKPORT WILL 41.581910 -88.071590 7/18/2018 BE 50
G-12 DES PLAINES RIVER DOWNSTREAM OF BRANDON RD LOCK AND DAM WILL 41.500390 -88.103710 7/17/2018 BE 60
G-01 DES PLAINES RIVER I-55 BRIDGE 2 MI E CHANNAHON WILL 41.421780 -88.194470 7/17/2018 BE 60
GW-09 MILL CREEK ROLLINS SAVANAH FOREST PRESERVE LAKE 42.374094 -88.021029 9/18/2018 ES 32
GV-01 BULL CREEK RT 21 MILWAUKEE AV LIBERTYVL LAKE CO FP LAKE 42.313826 -87.962180 9/19/2018 PE 34
GU-06 INDIAN CREEK 0.8 MILE N PRAIRIE VIEW AT VERNON TWP PK LAKE 42.206722 -87.960228 9/19/2018 ES 53
GL-01 SALT CREEK YORK RD, 0.3 MI N OF OGDEN AVE HINSDALE DUPAGE 41.820730 -87.927010 7/25/2018 BE 51
GK-03 FLAGG CREEK WALKER PK WOLF RD LA GRANGE 0.5 M S I-55 COOK 41.738820 -87.896440 9/20/2018 ES 43
GJ-01 SAWMILL CREEK BLUFF RD WATRFAL GLEN FP DS RR BRIDGE DUPAGE 41.697610 -87.961939 9/20/2018 PE 50
GG-06 HICKORY CREEK 1 MI NE NEW LENOX DS MARLEY RD WILL 41.523150 -87.942830 8/28/2018 ES 40
GG-04 HICKORY CREEK GAUGES RD 3 MI E JOLIET in PILCHER PARK WILL 41.526290 -88.004850 8/28/2018 ES 30
GC-03 JACKSON CREEK ROWEL RD, 3.5MI NE ELWOOD WILL 41.439167 -88.059167 9/21/2018 ES 70
GCA-01 MANHATTAN CREEK DS W MANHATTAN RD BR, E RT 53 WILL 41.430000 -88.077222 9/21/2018 PE 40
GBK-02 W BR DUPAGE RIVER 2 MI S NAPERVILLE WILL 42.444221 -88.000557 9/27/2018 ES 35
GBK-07 W BR DUPAGE RIVER GARYS MILL RD WEST CHICAGO DUPAGE 41.858150 -88.193520 7/24/2018 BE 46
GBL-07 E BR DUPAGE RIVER SR 56 BR, HIDDEN LAKES FP DOWNERS GROVE DUPAGE 41.831630 -88.047650 7/26/2018 BE 36
GBL-19 E BR DUPAGE RIVER ROYCE RD, 0.1 MI W OF SR 53 BOLLINGBROOK WILL 41.718000 -88.070500 7/24/2018 BE 37
GB-11 DUPAGE RIVER RT 52 BRIDGE SHOREWOOD WILL 41.521570 -88.194830 7/18/2019 BE 40
GB-01 DUPAGE RIVER OLD RT 6 S CHANNAHON WILL 41.420390 -88.227450 7/31/2018 BE 60
Table 1. Location and collection information for 2018 Des Plaines River Basin Survey sampling stations; listed from upstream to downstream. BE=Boat Electrofishing; ES= Electric
Seine; PE=Backpack Electrofishing.
*Stations common to all Basin Surveys 1983 - 2018

9 |D e s P l a i n e s R i v e r B a s i n S u r v e y
et al. 1989). Collection dates and methods for each station are shown in Table 1. At all stations, larger fish and
readily identifiable specimens were identified, weighed (g), measured (mm) and returned to the stream alive.
Smaller fish that were difficult to identify in the field were preserved in a 10% formalin solution for laboratory
analysis. Sampling time for each station is shown in Table 1 and varied based stream width and habitat
complexity. Stream width on the mainstem of the Des Plaines River ranged from 40 ft. at Wadsworth Road to
300 ft. at I-55 Bridge. Tributary stations ranged from 10 to 70 ft. in width.
Figure 3. Sampling station locations for Des Plaines River mainstem (A), Des Plaines River tributaries and DuPage River (B).
Stream flows were near median daily levels during boat electrofishing sampling in July for the mainstem
Des Plaines and DuPage River sites and were slightly elevated during tributary samples in late August and
September (based on the USGS gage at Riverside https://waterdata.usgs.gov/il/nwis/current/?type=flow).
We examined fish species composition, distribution and abundance of mainstem and tributary fish
collections. Non-metric multidimensional scaling (NMDS) was used to compare fish species composition among
sampling stations using Bray-Curtis (1957) similarity of square root transformed catch per unit effort (Kwak and
Peterson 2007) using Primer 5 software. Separate analyses were run for mainstem and tributary stations. Analysis
of sportfish populations included comparison of catch per unit effort (CPUE) and length frequency. Index of Biotic
Integrity (IBI) scores were calculated for each station using protocols described by Smogor (2004). IBI evaluates
fish community attributes using 10 different metrics, each with a possible score of 0-6, with the grand total
ranging from 0-60. Higher scores indicate better stream quality. Differences in IBI of >10 points are considered
“biologically meaningful” (Smogor 2004).
Results from the 2018 survey were compared to previous surveys in 1974, 1983, 1997, 2003, 2008 and
2013. All stations were included for fish species presence/absence comparisons. For quantitative analyses of
catch rates and IBI, only the six stations common to surveys from 1983 to 2018 were used (Table 1). IBI results
among years were compared for the six mainstem Des Plaines River locations common to all basin surveys using
#Y
#Y
#Y
#Y#Y
#Y
#Y#Y
#Y #Y
#Y
#Y
#Y
#Y
#Y
#Y
#
GW-04
#GV-01
#GU-06
#
GJ-01
#
GG-06
#
GG-04
#
GC-03
#
GCA-01
#
GBK-07
#GBL-07
#
GBK-02#
GBL-13
#
GB-11
#GB-01
#
GK-03
#
GL-01
Jackson Creek
DuP
age R
iver
E B
R D
U P
AG
E R
W B
R D
U P
AG
E R
DES PLAINES R
0 50 Miles
CountiesTributary Streams
#Y 2018 Dupage River Stations #Y 2018 Des Plaines River Tributary Stations
Des Plaines River Mainstem
N
EW
S
#Y
#Y
#Y
#Y
#Y
#Y
#Y
#Y
#Y
#Y
#Y
#Y
#Y
#Y
#Y#Y
#Y
$T
LAKE
COOK
DUPAGE
WILL
Brandon Lock and Dam
Salt C
r eek
Mi ll C
reek
Hickory Creek
Jackson Creek
DuP
age R
iver
#
G-46#
G-38#
G-15#
G-30#
G-44#
G-39#
G-18#
G-03#G-02#
G-11
#
G-12#
G-01
# G-35
#
G-07
#
G-25
#
G-08
E B
R D
U P
AG
E R
W B
R D
U P
AG
E R
DES PLAINES R
0 50 Miles
Counties
Tributary Streams
Des Plaines River Mainstem
#Y 2018 Mainstem Sampling Stations$T Brandon road lock and dam.shp
N
EW
S
10 |D e s P l a i n e s R i v e r B a s i n S u r v e y
ANOVA (α=0.05) and t-test with Bonferroni Correction (α = 0.008). NMDS was used to evaluate species
composition among all 2018 and prior years sampling stations using Bray-Curtis Similarity on square root
transformed CPUE. Scientific names for all fish species collected can be found in Table 2 and are not repeated in
the text or in other tables.
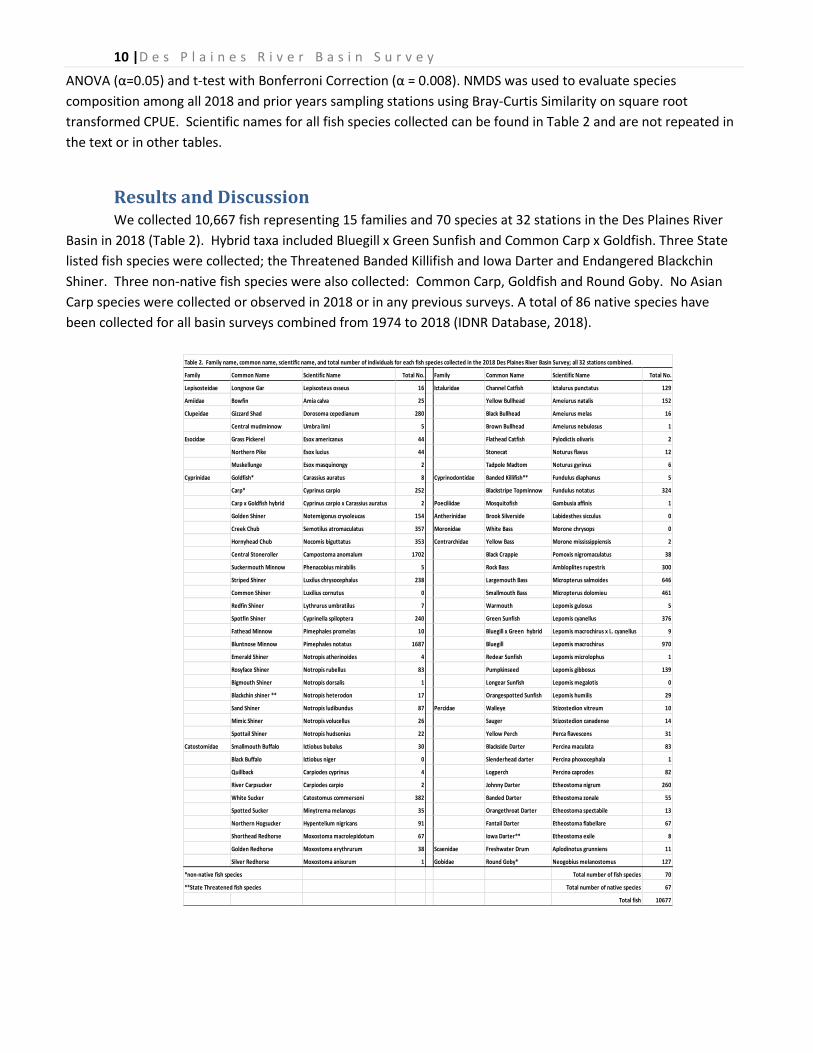
Results and Discussion We collected 10,667 fish representing 15 families and 70 species at 32 stations in the Des Plaines River
Basin in 2018 (Table 2). Hybrid taxa included Bluegill x Green Sunfish and Common Carp x Goldfish. Three State
listed fish species were collected; the Threatened Banded Killifish and Iowa Darter and Endangered Blackchin
Shiner. Three non-native fish species were also collected: Common Carp, Goldfish and Round Goby. No Asian
Carp species were collected or observed in 2018 or in any previous surveys. A total of 86 native species have
been collected for all basin surveys combined from 1974 to 2018 (IDNR Database, 2018).
Family Common Name Scientific Name Total No. Family Common Name Scientific Name Total No.
Lepisosteidae Longnose Gar Lepisosteus osseus 16 Ictaluridae Channel Catfish Ictalurus punctatus 129
Amiidae Bowfin Amia calva 25 Yellow Bullhead Ameiurus natalis 152
Clupeidae Gizzard Shad Dorosoma cepedianum 280 Black Bullhead Ameiurus melas 16
Central mudminnow Umbra limi 5 Brown Bullhead Ameiurus nebulosus 1
Esocidae Grass Pickerel Esox americanus 44 Flathead Catfish Pylodictis olivaris 2
Northern Pike Esox lucius 44 Stonecat Noturus flavus 12
Muskellunge Esox masquinongy 2 Tadpole Madtom Noturus gyrinus 6
Cyprinidae Goldfish* Carassius auratus 8 Cyprinodontidae Banded Killifish** Fundulus diaphanus 5
Carp* Cyprinus carpio 252 Blackstripe Topminnow Fundulus notatus 324
Carp x Goldfish hybrid Cyprinus carpio x Carassius auratus 2 Poeciliidae Mosquitofish Gambusia affinis 1
Golden Shiner Notemigonus crysoleucas 154 Antherinidae Brook Silverside Labidesthes sicculus 0
Creek Chub Semotilus atromaculatus 357 Moronidae White Bass Morone chrysops 0
Hornyhead Chub Nocomis biguttatus 353 Centrarchidae Yellow Bass Morone mississippiensis 2
Central Stoneroller Campostoma anomalum 1702 Black Crappie Pomoxis nigromaculatus 38
Suckermouth Minnow Phenacobius mirabilis 5 Rock Bass Ambloplites rupestris 300
Striped Shiner Luxilus chrysocephalus 238 Largemouth Bass Micropterus salmoides 646
Common Shiner Luxilius cornutus 0 Smallmouth Bass Micropterus dolomieu 461
Redfin Shiner Lythrurus umbratilus 7 Warmouth Lepomis gulosus 5
Spotfin Shiner Cyprinella spiloptera 240 Green Sunfish Lepomis cyanellus 376
Fathead Minnow Pimephales promelas 10 Bluegill x Green hybrid Lepomis macrochirus x L. cyanellus 9
Bluntnose Minnow Pimephales notatus 1687 Bluegill Lepomis macrochirus 970
Emerald Shiner Notropis atherinoides 4 Redear Sunfish Lepomis microlophus 1
Rosyface Shiner Notropis rubellus 83 Pumpkinseed Lepomis gibbosus 139
Bigmouth Shiner Notropis dorsalis 1 Longear Sunfish Lepomis megalotis 0
Blackchin shiner ** Notropis heterodon 17 Orangespotted Sunfish Lepomis humilis 29
Sand Shiner Notropis ludibundus 87 Percidae Walleye Stizostedion vitreum 10
Mimic Shiner Notropis volucellus 26 Sauger Stizostedion canadense 14
Spottail Shiner Notropis hudsonius 22 Yellow Perch Perca flavescens 31
Catostomidae Smallmouth Buffalo Ictiobus bubalus 30 Blackside Darter Percina maculata 83
Black Buffalo Ictiobus niger 0 Slenderhead darter Percina phoxocephala 1
Quillback Carpiodes cyprinus 4 Logperch Percina caprodes 82
River Carpsucker Carpiodes carpio 2 Johnny Darter Etheostoma nigrum 260
White Sucker Catostomus commersoni 382 Banded Darter Etheostoma zonale 55
Spotted Sucker Minytrema melanops 35 Orangethroat Darter Etheostoma spectabile 13
Northern Hogsucker Hypentelium nigricans 91 Fantail Darter Etheostoma flabellare 67
Shorthead Redhorse Moxostoma macrolepidotum 67 Iowa Darter** Etheostoma exile 8
Golden Redhorse Moxostoma erythrurum 38 Scaenidae Freshwater Drum Aplodinotus grunniens 11
Silver Redhorse Moxostoma anisurum 1 Gobidae Round Goby* Neogobius melanostomus 127
*non-native fish species Total number of fish species 70
**State Threatened fish species Total number of native species 67
Total fish 10677
Table 2. Family name, common name, scientific name, and total number of individuals for each fish species collected in the 2018 Des Plaines River Basin Survey; all 32 stations combined.

11 |D e s P l a i n e s R i v e r B a s i n S u r v e y
Figure 4. Non-parametric Multidimensional Scaling (NMDS) plot of square root
transformed catch per unit effort for each Des Plaines River mainstem station. Stations
grouping closer together have more similar fish species assemblages. NMDS station
groupings are represented on the map by numbering 1 – 4. See text for descriptions of
number groupings.
Des Plaines River – Mainstem
Distribution and Abundance Current Conditions. A total of 3,763 fish were collected in 2018 at the mainstem stations, including 54
native and three non-native species (Carp, Goldfish, and Round Goby) (Table 3). The number of fish species at
each station ranged from 13 at G-01 at the I-55 Bridge to 31 at G-39 in Riverside, downstream of the former
Hofmann Dam. Two State Listed species were collected in the mainstem: Iowa Darter and Blackchin Shiner. Iowa
Darter was collected at two stations upstream of BRLD, Russell Road (G-08) and Belvidere Road (G-07), with only
one individual collected at each station (Table 3). One individual was also captured at an upstream station in
2013. Sixteen Blackchin Shiners
were collected at 3 locations
including Belvidere Road (G-07;
n=7), Dam #2 Woods (G-46; n=1),
and Columbia Woods (G-18; n=8).
They were captured previously in
2008 at Belvidere Road but have
never been collected as far
downstream as Columbia Woods,
which is more than 40 miles
downstream of the Belvidere
Road station. One Blackchin
Shiner was also collected in Salt
Creek (see below in Des Plaines
River - Tributaries). Another
species of interest, Rosyface
Shiner, was collected for the first
time in 2013 at four mid-river stations between Riverside (G-39) and Irving Park Road (G-15). In 2018 their range
expanded from Indian Creek (GU-06) in Lake County downstream to 135th Street (G-02) (see Figure 3). This
minnow species is considered to be intolerant (Smogor 2004) and had not been collected at any locations in basin
surveys previous to 2013. There is one un-vouchered record for Rosyface Shiner in the Des Plaines River Basin
from Mill Creek in 1976 (Heidinger 1989). They are absent from the Wisconsin portion of the watershed (USGS
2018). Orangethroat Darter was collected in 2018 at G-25 and G-39. These are the first records for this species in
the Des Plaines River Watershed upstream of BRLD. No records for this species exist in the Des Plaines River
system in Wisconsin.
The five most abundant fish species at mainstem stations in 2018 were Bluegill, Largemouth Bass,
Bluntnose Minnow, Gizzard Shad and Green Sunfish (Table 3). Bluegill and Largemouth Bass were collected at all
mainstem stations. Catch rates were somewhat higher for both species in the upper river where low gradient
conditions provided more favorable habitat. Bluntnose Minnow, Gizzard Shad and Green Sunfish were also very
widespread. Other widespread species occurring at 10 or more of the 16 sampling stations included Common
Carp, Spotfin Shiner, White Sucker, Channel Catfish, Yellow Bullhead, Blackstripe Topminnow, Rock Bass,
Pumpkinseed and Logperch.
Channel gradient and longitudinal position appeared to influence the presence and/or abundance of a
number of species. For example, Green Sunfish, Pumpkinseed and Spotted Sucker were more abundant at the
upper river stations, whereas Gizzard Shad and Channel Catfish were more numerous downstream. Smallmouth

12 |D e s P l a i n e s R i v e r B a s i n S u r v e y
Bass were absent upstream of G-44 (Figure 3), preferring the higher gradient conditions downstream. Larger-
bodied riverine species like Longnose Gar, Quillback, River Carpsucker and Smallmouth Buffalo were only found
in the far downstream segments (Table 3). Golden Redhorse and Shorthead Redhorse occurred only downstream
of BRLD in 2018 (Table 3) and have never been collected in the upstream areas. The former upstream limit of
Round Goby was G-39, below the former Hofmann Dam. Following removal of the dam in 2012, they have moved
over 20 miles upstream to G-46 (Figure 3, Table 3). Removal of seven other mainstem dams since 2013 (FPCC
2018) likely have facilitated range expansion of native fishes as well, including Rosyface Shiner, Orangethroat
Darter, Channel Catfish and Logperch.
The influence of channel gradient, longitudinal position and dams were evident in the NMDS plots of
mainstem fish assemblages in 2018 (Figure 4). Stations downstream of BLRD (G-01, G-12) were different than all
the other stations thus grouped together (Group 3, Figure 4). These two stations are located in a wider river
segment, downstream of the CSSC with direct connection to the upper Illinois River. As a result, they held a
Russel
Road
Wdswrth
Road
Belvidere
Road
Daniel
Wright
Dam # 2
Woods
Irving
Park Rd
Grand
Ave
I-294
Bridge
Forest
Ave River-side
Columbia
Woods
Lemont
Road 135th St
Division
St
DS
Brandon
I-55
Bridge
Common Name Total No. No. Sites G-08 G-25 G-07 G-35 G-46 G-15 G-30 G-38 G-44 G-39 G-18 G-03 G-02 G-11 G-12 G-01
Longnose gar 14 4 0 0 0 0 0 0 0 0 0 0 0 2 1 0 9 2
Bowfin 24 4 14 6 0 0 0 0 0 0 0 0 1 3 0 0 0 0
Gizzard shad 278 11 3 2 2 0 0 2 0 0 7 68 28 13 0 2 17 134
Central mudminnow 2 1 2 0 0 0 0 0 0 0 0 0 0 0 0 0 0 0
Grass pickerel 4 3 0 2 0 0 0 0 0 0 0 0 1 1 0 0 0 0
Northern pike 42 11 2 0 5 5 1 4 4 2 11 6 1 1 0 0 0 0
Goldfish 8 6 0 1 0 0 0 1 0 3 0 1 1 1 0 0 0 0
Carp 179 15 33 15 3 6 11 39 22 5 1 3 9 15 8 0 3 6
Carp x Goldfish hybrid 2 2 0 0 1 0 0 0 0 0 0 1 0 0 0 0 0 0
Golden shiner 152 8 112 9 13 9 0 0 0 0 0 0 1 0 2 1 0 5
Creek chub 5 1 0 0 0 0 0 0 0 0 0 5 0 0 0 0 0 0
Hornyhead chub 100 9 0 0 35 4 0 4 5 0 27 4 2 13 6 0 0 0
Central stoneroller 1 1 0 0 0 0 0 0 0 0 0 0 0 0 0 1 0 0
Spotfin shiner 155 10 0 0 17 8 8 3 9 0 2 40 22 27 19 0 0 0
Fathead minnow 6 2 3 0 3 0 0 0 0 0 0 0 0 0 0 0 0 0
Bluntnose minnow 351 12 0 2 27 8 49 0 2 1 1 16 10 33 193 9 0 0
Emerald shiner 4 1 0 0 0 0 0 0 0 0 0 0 0 0 0 0 4 0
Rosyface shiner 21 3 0 0 0 0 0 0 0 0 0 6 1 0 14 0 0 0
Bigmouth shiner 1 1 0 0 0 0 0 0 0 0 0 1 0 0 0 0 0 0
Blackchin shiner *T* 16 3 0 0 7 0 1 0 0 0 0 0 8 0 0 0 0 0
Sand shiner 27 4 0 0 0 0 23 1 0 0 0 2 0 1 0 0 0 0
Spottail shiner 22 8 0 0 1 2 0 0 0 0 0 6 2 2 2 2 0 5
Smallmouth buffalo 28 3 0 0 0 0 0 0 0 0 0 0 0 0 0 3 18 7
Quillback 4 2 0 0 0 0 0 0 0 0 0 0 2 0 0 0 2 0
River carpsucker 2 1 0 0 0 0 0 0 0 0 0 0 0 0 0 0 2 0
White sucker 124 12 2 0 16 12 0 19 10 4 14 21 0 20 4 1 1 0
Spotted sucker 35 6 3 6 19 2 3 0 0 2 0 0 0 0 0 0 0 0
Shorthead redhorse 31 1 0 0 0 0 0 0 0 0 0 0 0 0 0 0 31 0
Golden redhorse 2 1 0 0 0 0 0 0 0 0 0 0 0 0 0 0 0 2
Channel catfish 105 16 1 2 1 2 3 5 2 2 17 15 1 26 17 5 4 2
Yellow bullhead 90 14 2 4 11 3 17 0 4 3 0 12 2 8 7 13 1 3
Black bullhead 16 7 2 0 1 0 1 2 3 1 0 6 0 0 0 0 0 0
Brown bullhead 1 1 1 0 0 0 0 0 0 0 0 0 0 0 0 0 0 0
Stonecat 4 2 0 0 0 1 3 0 0 0 0 0 0 0 0 0 0 0
Tadpole madtom 3 3 1 0 0 0 1 0 0 0 0 0 0 0 1 0 0 0
Blackstripe topminnow 63 10 3 8 15 2 12 0 1 0 0 18 1 0 2 1 0 0
Yellow bass 1 1 0 0 0 0 1 0 0 0 0 0 0 0 0 0 0 0
Black crappie 30 7 6 1 0 2 1 0 0 1 0 4 0 15 0 0 0 0
White crappie 1 1 0 0 0 0 0 0 0 0 0 1 0 0 0 0 0 0
Rock bass 197 13 0 0 22 6 37 5 3 14 2 38 10 40 7 12 1 0
Largemouth bass 366 16 60 40 45 15 15 6 12 7 26 45 8 32 18 1 18 18
Smallmouth bass 187 6 0 0 0 0 0 0 0 0 3 10 0 19 68 83 4 0
Warmouth 5 2 1 4 0 0 0 0 0 0 0 0 0 0 0 0 0 0
Green sunfish 200 12 2 28 6 15 45 5 27 19 9 20 7 17 0 0 0 0
Bluegill x Green sunfish hybrid 3 2 1 2 0 0 0 0 0 0 0 0 0 0 0 0 0 0
Bluegill 535 16 44 94 114 80 45 6 13 9 8 27 15 53 2 4 10 11
Redear sunfish 1 1 1 0 0 0 0 0 0 0 0 0 0 0 0 0 0 0
Pumpkinseed 128 10 34 56 12 2 2 0 0 3 0 4 9 2 0 0 0 4
Orangespotted sunfish 25 2 0 24 0 0 0 0 0 0 0 0 1 0 0 0 0 0
Walleye 3 1 0 0 0 0 0 0 0 0 0 3 0 0 0 0 0 0
Sauger 14 5 0 0 0 0 0 1 1 0 3 5 0 4 0 0 0 0
Yellow perch 10 3 1 0 7 2 0 0 0 0 0 0 0 0 0 0 0 0
Blackside darter 23 6 0 1 5 5 8 0 0 1 3 0 0 0 0 0 0 0
Logperch 35 11 0 0 2 0 1 1 0 2 5 2 1 2 2 5 12 0
Johnny darter 26 8 8 6 0 3 5 1 1 1 0 0 0 0 0 1 0 0
Orangethroat darter 2 2 0 1 0 0 0 0 0 0 0 1 0 0 0 0 0 0
Iowa darter *T* 2 2 1 0 1 0 0 0 0 0 0 0 0 0 0 0 0 0
Freshwater drum 10 4 0 0 0 0 0 0 0 0 0 1 0 0 2 0 6 1
Round goby 37 6 0 0 0 0 1 1 0 0 3 13 0 0 17 2 0 0
No. Species 57 25 21 25 22 24 18 16 18 17 31 24 24 20 17 17 13
Total fish 3763 343 314 391 194 294 106 119 80 142 405 144 350 392 146 143 200
Table 3. Number of individuals of each species collected at Des Plaines River mainstem stations in 2018 for all methods combined, including total number of each species and the number of sites where each species was collected. Stations are
arranged from upstream (left) to downstream (right).

13 |D e s P l a i n e s R i v e r B a s i n S u r v e y
higher abundance of larger riverine species like Longnose Gar and large-bodied suckers (Table 3). The two
stations immediately upstream of BLRD (G-11 and G-02) were also very similar to one another but separated out
from the other upstream stations (Group 4, Figure 4). These two locations are in the highest gradient segment of
the river (7-10 feet/mile) where
substrate is primarily bedrock and
cobble. Smallmouth Bass were
highly abundant at these locations
while smaller bodied sunfishes
were in low abundance. The ten
stations between G-02 and G-25
appeared to have similar species
composition, forming the largest
group (Group 2, Figure 4). Group 1
consists of the two upper-most
stations, located in very low
gradient river segment with
extensive flood plains and
abundant aquatic vegetation
favoring species like Bowfin, Golden
Shiner and Pumpkinseed.
Historic Conditions. The long history of degraded water quality conditions in both the upper and
lower Des Plaines River mainstem led to the local extirpation of many fish species (Bertrand 1984; IEPA 1988).
However, recent evaluation of species richness trends on the Des Plaines River upstream (Pescitelli 2015) and
downstream (Gibson-Reinemer et al. 2017) of BRLD documents the restoration of fish assemblages resulting from
the Clean Water Act of 1972 and implementation of TARP. The lower Des Plaines River below BRLD
demonstrated a substantial increase in the number of fish species between 1983 and the present, increasing
from a mean of seven species to over 20 species per sampling period. Sportfish catch rate also increased from
near zero to over 300 per hour (Gibson-Reinemer et al. 2017). A similar trend was observed upstream of BRLD,
where sportfish catch rate increase from 10 per hour in 1983 to 127 per hour in 2018 (see detailed discussion
below in Sportfish section). Similarly, species richness increased upstream of BRLD in the Des Plaines River
mainstem from 20 species in 1974 to a cumulative total of 64 species in 2018 (Figure 5; see Appendix Table A-1
for a list of species)
The recruitment sources for reestablishment of fish species in the lower Des Plaines River downstream of
BRLD was the nearby Illinois and Kankakee Rivers. In fact, the Kankakee River was largely spared from the
historic water quality degradation experienced in the Des Plaines and Illinois Rivers and remains one the highest
quality rivers in the state (Pescitelli 2015). Many of the 44 species collected upstream of BRLD since 1974 appear
to have originated in the areas downstream of BRLD. This list of species includes many obligate riverine species
like River Carpsucker, Quillback, Smallmouth Buffalo and others (Table A-1). Migration through the 28 ft. high
lock and traversing through four miles of degraded conditions in the Brandon Road Pool appears to be a difficult
pathway. However, evidence of migration through BRLD into the upper Des Plaines River has been provided by
empirical analysis of basin survey data (Altenritter et al. 2019). More recently, evidence for passage through
Brandon Road lock was documented using micro-chemical analysis of fin rays of seven species from four families
collected upstream of BRLD (Snyder et al., 2019). Species analyzed included Longnose Gar, River Carpsucker,
Figure 5. Cumulative species richness for the Des Plaines River mainstem at
each Basin Survey from 1974 to 2018.

14 |D e s P l a i n e s R i v e r B a s i n S u r v e y
Quillback, Smallmouth Buffalo, Channel Catfish, Largemouth Bass, and Smallmouth Bass. Other potential sources
of new species include refugia within the upper Des Plaines River watershed and migration from Lake Michigan
and the CAWS (Pescitelli 2015). Round Goby and Banded Killifish appear to have originated from Lake Michigan,
entering the Des Plaines River through the CSSC (see Figure 1).
In addition to increases in species richness observed in the mainstem of the Des Plaines River from 1983
to 2018, there has also been a change is species composition. A notable decrease in the percentage of tolerant
species was observed throughout the river. At the six stations common to all basin surveys (see Table 1), tolerant
fish species (Smogor 2004) composed 72% of the total abundance in 1983 compared to 18% in 2013, increasing
slightly in 2018 (Figure 6). Although the percentage of tolerant species decreased substantially over the sampling
period from 1983 to 2018, there has been only a small increase in intolerant fish species in recent years (Figure
6). In 2018, there were only five intolerant species collected on the Des Plaines River mainstem, the same
number found in 2013. However, increased abundance of Smallmouth Bass in the lower mainstem added to the
overall percentage of intolerant species in 2018. By comparison, in 2015 there were 11 intolerant fish species at
13 stations on the higher quality
Kankakee River (Pescitelli and
Widloe 2017). The appearance and
range expansion of Rosyface Shiner
and Blackchin Shiner and the
increase in Smallmouth Bass
abundance on the upper Des
Plaines River suggests that water
quality conditions are adequate to
support additional intolerant fish
species. Data from IEPA
macroinvertebrate sampling also
indicate water quality is adequate
for “full support of aquatic life use”
at all but one Des Plaines River
mainstem stations (see Stream
Quality section below). Despite
increases in species richness this
rating reflects the fact that many
native minnow, sucker and darter species common in other Northeastern Illinois Rivers are absent upstream of
BRLD.
Stream Quality/Index of Biotic Integrity (IBI). In 2018, mainstem IBI scores ranged from 23 to 39
(mean =36) indicating moderate to low stream quality (Table 4; Smogor 2004). The higher quality Kankakee River
had a mean IBI of 48 at 13 mainstem stations in 2015 (Pescitelli and Widloe 2017). There were no apparent
longitudinal trends in IBI on the Des Plaines River in 2018, although higher gradient stations generally had higher
IBI scores (e.g. G-07, G-39, G-11). Mean metric scores for all mainstem stations were particularly low (range 1 – 3
out of 6 possible points) for the categories “number species”, “number intolerant species”, “proportion benthic
invertivore species” and “proportion of specialist benthic invertivores” (Figure 7). As mentioned previously, the
proportion of tolerant species has decreased over the sampling period (Figure 6), yielding better scores for that
category.
Figure 6. Percentage of neutral, tolerant and intolerant species (Smogor 2004) for Des
Plaines River basin surveys at six common stations from 1983 to 2018.

15 |D e s P l a i n e s R i v e r B a s i n S u r v e y
There was significant variation amongst IBI scores at the six boat electrofishing stations common to all
basin surveys from 1983 to 2018 (ANOVA, P<0.05, Table 5). Post–hoc t-tests revealed no statistical differences in
mean IBI among earlier surveys in 1983, 1997 and 2003. Furthermore, the differences in mean IBI between 1983,
1997 and 2003 were less than 10 and, therefore, not considered to be “biologically meaningful” (Smogor 2004).
In 2008 mean IBI increased to 27.4, which was statistically greater than the mean IBI for 1983 (t-test, P<0.008)
and also exceeded a difference of 10 points indicating a “biologically meaningful” change (Table 5). The mean IBI
for 2018 increased slightly from the 2013 survey from to 30.8 to 33. Much of the increase in IBI from 2013 to
2018 was due to improvements at the four
stations in the lower segment of the river
above BRLD (Figure 8). The increases in IBI
were due in part to the appearance of
Blackchin Shiner and Rosyface Shiner, as well
as the substantial increase in Smallmouth
Bass in 2018. Catch rate for this intolerant
sportfish increased from 6/hr. to 35/hr. from
2013 to 2018, with two stations exceeding
60/hr. (see Sportfish section below). The
increase in stream quality in the lower
segment on the mainstem was due to a
reduction in CSOs in 2017 following the
opening of the McCook Reservoir. The
additional 3.5 gallons in storage capacity
(MWRD.com) reduced and/or eliminated CSOs from Salt Creek downstream to Willow Springs Road.
IBI Metric Value Score Value Score Value Score Value Score Value Score Value Score Value Score
No. fish species 15 3 24 5 22 4 22 4 16 3 14 3 16 3
No. native minnow species 3 2 5 4 7 5 5 4 5 4 4 3 1 1
No. sucker species 1 1 1 1 1 1 1 1 1 1 2 2 5 4
No. sunfish species 5 5 8 6 6 6 7 6 4 4 4 4 4 4
No. benthic invertevore species 2 2 2 2 1 1 1 1 2 2 2 2 3 2
No. intolerant species 2 2 3 3 3 3 2 2 2 2 1 1 1 1
Prop. specialist benthic invertivores 0.056 2 0.008 1 0.007 1 0.006 1 0.011 1 0.035 2 0.301 6
Prop. generalist feeders 0.415 6 0.629 5 0.694 4 0.617 5 0.603 5 0.268 6 0.406 6
Prop. Lithophilic spawners 0.303 6 0.191 4 0.097 2 0.223 4 0.298 6 0.711 6 0.336 6
Prop. Tolerant species 0.267 5 0.25 5 0.273 5 0.273 5 0.312 5 0.286 5 0.188 5
Total IBI Score 34 36 32 33 33 34 38
G-44 G-39 G-18 G-03 G-02 G-11 G-12
Table 4. continued
IBI Metric Value Score Value Score Value Score Value Score Value Score Value Score Value Score Value Score
No. fish species 24 5 15 3 24 5 21 5 20 4 15 3 15 3 16 3
No. native minnow species 5 2 2 2 7 5 5 3 2 2 3 2 3 2 1 1
No. sucker species 2 2 1 1 2 2 2 2 1 1 1 1 1 1 2 2
No. sunfish species 7 6 6 6 5 5 6 6 6 6 4 4 4 4 6 6
No. benthic invertevore species 4 3 1 1 4 3 4 3 6 4 2 2 1 1 4 3
No. intolerant species 2 2 1 1 4 4 2 2 1 1 1 1 1 1 1 1
Prop. specialist benthic invertivores 0.035 2 0 0 0.022 1 0.041 2 0.044 2 0.019 1 0.008 1 0.05 2
Prop. generalist feeders 0.677 4 0.615 5 0.64 5 0.758 3 0.702 4 0.783 3 0.773 3 0.613 5
Prop. Lithophilic spawners 0.011 1 0.019 1 0.232 4 0.088 2 0.194 4 0.104 2 0.076 2 0.237 4
Prop. Tolerant species 0.25 5 0.4 4 0.292 5 0.286 5 0.2 5 0.267 5 0.333 5 0.375 4
Total IBI Score 32 24 39 33 33 24 23 31
G-30 G-38
Table 4. Index of Biotic Integrity (IBI) scores for the 2018 Des Plaines Basin Survey mainstem stations, including individual metric values and scores.G-15G-08 G-25 G-07 G-35 G-46
Figure 7. Mean of individual Index of Biotic Integrity (IBI)
metric scores for 16 mainstem Des Plaines River stations 2018.
Figure 7. Mean of individual Index of Biotic Integrity (IBI) metric scores
for 16 mainstem Des Plaines River stations 2018.

16 |D e s P l a i n e s R i v e r B a s i n S u r v e y
While there have been
notable improvements on the Des
Plaines River since 1983, IBI scores in
2018 remained within the range
indicating low to moderate stream
quality. All 2018 mainstem stations
were below the threshold for “Good
Resource Quality/Fully Supportive”
Aquatic Life Use Rating (fish IBI ≥
41). Instead, the mainstem IBI
scores were in the category “Poor
Resource Quality/Not supportive”
(<41 and > 20, IEPA 2016) (Table 4).
Missing or lacking species/functional
groups that would help bolster the IBI include suckers, darters, native minnows, intolerant species, specialist
benthic invertivores and mineral substrate spawners (Figure 7). The primary source for recruitment of these
species groups for the upper Des Plaines River is the lower Des Plaines, Kankakee and Illinois Rivers via the
Brandon Road Lock.
Stream quality ratings for the Des Plaines River mainstem based on IEPA macroinvertebrate samples
were not available for 2018, but in 2015 they were generally higher than the fish IBI ratings with most stations
indicating “Good Resource Quality/Fully Supportive” (Pescitelli 2015). Reduction or elimination of CSOs largely
contributed to improving stream quality. Improvements in the fish assemblage to support an IBI score of ≥41 and
removal of the Des Plaines River mainstem from the impaired waters list (IEPA 2016) will require upstream
movement of fishes through the Brandon Road Lock. Installation of the Asian Carp barrier at Brandon Road will
halt migration of native species and impact restoration of the upstream areas.
Figure 8. Index of Biotic Integrity scores for Des Plaines River mainstem sampling station
upstream of Brandon Road Lock and Dam for 2013 and 2018 Basin Surveys. Stations are
arranged from upstream (left) to downstream (right).
Location 1983 1997 2003 2008 2013 2018
G-25 19 20 26 32 29 24
G-07 20 32 26 36 35 39
G-35 18 23 22 26 31 33
G-39 15 31 27 27 31 36
G-18 13 20 21 21 30 32
G-11 11 17 20 27 29 34
mean 15.4 24.6 23.2 27.4 30.8 33.0
t-test a ab ab bc c c
Table 5. Index of Biotic Integrity scores for the six sites common to all Des
Plaines River surveys from 1983 to 2018 (boat electrofishing only). Means
with different letters were significantly different (t-Test; P<0.008 with
Boniferoni correction)

17 |D e s P l a i n e s R i v e r B a s i n S u r v e y
Sportfish Catch rates for sportfish species, Bluegill, Largemouth Bass, Rock Bass, and Smallmouth Bass, were up
substantially in 2018 compared to all other years (Figure 9). This can largely be attributed to the dramatic
increase in Smallmouth Bass; though catch rates were higher for all species, except Channel Catfish. Since 1983
total sportfish catch rate has increased from 10 to 121 per hour at the six stations common to all six basin surveys
(Figure 9).
Bluegill was the most abundant
sportfish species in the 2018 with a total of
535 individuals collected by seining and boat
electrofishing (Table 3). Bluegill were
widespread throughout the mainstem but
were generally more abundant at the
upstream, lower gradient locations,
especially G-25, G-07, and G-35 (Table 3).
Individuals up to 8 inches were present
(Figure A-1); however, quality-sized fish (≥6
inches, Anderson and Neumann 1996) made
up only 12% of the catch. Stock-sized fish (3
to 5.9 inches) were very abundant (n=193)
suggesting good potential for larger Bluegill
in years to come. Y-O-Y Bluegill were in low
abundance, indicating low reproduction in
2018 (Figure A-1).
One hundred five Channel Catfish
were collected in 2018 for a catch rate of 6
per hour. Individuals up to 24 inches were
present with most individuals in the 15 to 20
inch size range (Figure A-1). Quality-sized
fish (≥16 inches) made up 93% of the total
catch. Smaller Channel Catfish, including Y-
O-Y, were absent from the collection
indicating low reproduction in recent years.
Channel Catfish catch rate was higher in the
river segments downstream of G-44, where
riffle habitat was more common. Catch rates in 2018 were lower compared to recent surveys (Figure 9).
However, Channel Catfish abundance tends to be cyclical in Northeastern Illinois rivers (Pescitelli and Widloe
2017).
Catch rates of Largemouth Bass in 2018 were the highest recorded for Des Plaines Basin surveys, with a
substantial increase since 2013 (Figure 9). A total of 366 Largemouth Bass ranging from 2 to 18 inches were
collected (Figure A-1). Quality-sized fish (≥12 inches) made up 17% of the total catch. Younger fish were
abundant, including Y-0-Y (Figure A-1). Although Largemouth Bass were more abundant upstream of G-44, the
downstream areas held higher numbers of larger individuals.
Rock Bass catch rates were also higher in 2018, increasing to 14.8 per hour (compared to 3.9 per hour in
2013) (Figure 9). Of 197 Rock Bass collected, 43 (22%) were quality size (≥7 inches) (Figure A-1). Similar to
Figure 9. Mean electrofishing catch rates at six stations common to all Des
Plaines River Basin surveys from 1983-2018, including individual species
(top) and all species combined (bottom).

18 |D e s P l a i n e s R i v e r B a s i n S u r v e y
Smallmouth Bass, there were no Y-O-Y Rock Bass present in 2018. Stations with the highest catch rates of Rock
Bass included G-46, G-39 and G-03 (Table 3).
Smallmouth Bass were collected only downstream of G-44 due to presence of more favorable higher
gradient habitat, especially at G-39, G-03, G-02, and G-11 (Table 3, Figure 3). In 2013 we collected a total of 35
Smallmouth Bass in the lower river, for a catch rate of 6 per hour. In 2018, 187 Smallmouth Bass were collected
for a rate of 35 per hour (Figure 9). At G-02 and G-11 catch rates were 68 and 83 per hour respectively; rates
equivalent to higher quality streams like the Fox and Kankakee Rivers (Pescitelli and Rung 2014, Pescitelli and
Widloe 2017). Surprisingly there was a wide range of sizes present in 2018. Individuals up to 16 inches in length
were collected (Figure A-2), which is typically an eight or nine year-old fish in Illinois. Comparing the length
frequency graphs between 2013 and 2018 (Figure A-2), it is apparent there were not enough Smallmouth Bass in
2013 to support the population size/age structure collected in 2018. It is likely that many of the Smallmouth Bass
captured in 2018 migrated up through BRLD. Fin microchemistry indicated that movement through the lock is
possible (Snyder et al. 2019). Elimination of CSOs in 2017 when the McCook Reservoir came on line resulted in
improved water quality conditions and an increased abundance of pollution intolerant Smallmouth Bass.
Forty-two Northern Pike were collected at mainstem stations in 2018 (Table 3), an increase of 21 from
2013. Similar to previous surveys, Northern Pike were more abundant at the upper river stations (Table 3). They
ranged in size from 6 to 26 inches. A total of 14 (33%) were in the quality size range (≥21 inches; Anderson and
Neumann 1996). G-44 held the highest number of Northern Pike (n=11).
IDNR Division of Fisheries has stocked Sauger in the Des Plaines River since 2000, with an average of
19,000 2-inch fingerlings released each year at Irving Park Road (G-15), Riverside (G-39) as well as other locations
downstream. Summer catch rates for Sauger are typically low. In 2018 we collected only 14 individuals. During
fall sportfish surveys from 2001 to 2008, electrofishing catch rates for Sauger ranged from 14 to 21 in higher
gradient areas, with fish ranging from 6 to 19 inches in length (Pescitelli et al. 2010). Walleye are also more
common in the fall. Individuals up to 25 inches in length were present with electrofishing catch rates of 10 fish
per hour at G-39 during fall surveys (ILDNR unpublished data). Three Walleye were collected in 2018, all at G-39.
Des Plaines River – Tributaries
Distribution and Abundance A total of 5,628 individuals were collected at 10 Des Plaines River tributary sites, including forty-eight
native fish species, two non-native species and one hybrid taxa (Table 6). Fish species richness ranged from 11 at
Manhattan Creek to 26 at Jackson Creek. Three State-threatened species were collected at tributary sites: Iowa
Darter in Bull Creek and Mill Creek, Banded Killifish in Bull Creek and Indian Creek and Blackchin Shiner in Salt
Creek. These species have not been collected previously in Des Plaines River tributaries, though the site on Mill
Creek was not sampled before 2018. Non-native fish species included Common Carp and Round Goby. Round
Goby were collected only in Flagg Creek.
The five most abundant species at the tributary stations were Central Stoneroller, Bluntnose Minnow,
Creek Chub, Blackstripe Topminnow and Striped Shiner. All five of these fish species were widespread, occurring
at seven or more of the 10 locations sampled with no apparent habitat or longitudinal preference (Table 6). Other
relatively widespread fish species included Green Sunfish, Bluegill, Yellow Bullhead, Hornyhead Chub and
Largemouth Bass. Central Mudminnow and Bowfin were rare in occurrence and were found only at the upstream
tributaries in Lake County (Table 6). A total of eight fish species occurred only at tributary locations downstream
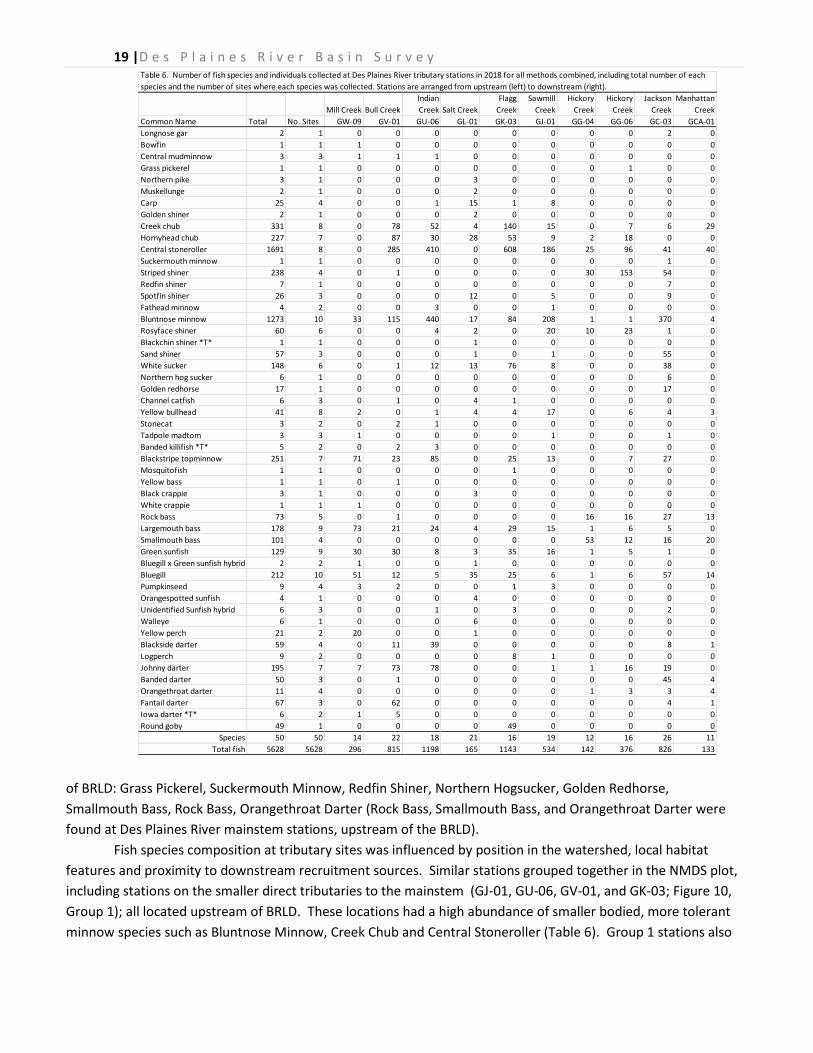
19 |D e s P l a i n e s R i v e r B a s i n S u r v e y
of BRLD: Grass Pickerel, Suckermouth Minnow, Redfin Shiner, Northern Hogsucker, Golden Redhorse,
Smallmouth Bass, Rock Bass, Orangethroat Darter (Rock Bass, Smallmouth Bass, and Orangethroat Darter were
found at Des Plaines River mainstem stations, upstream of the BRLD).
Fish species composition at tributary sites was influenced by position in the watershed, local habitat
features and proximity to downstream recruitment sources. Similar stations grouped together in the NMDS plot,
including stations on the smaller direct tributaries to the mainstem (GJ-01, GU-06, GV-01, and GK-03; Figure 10,
Group 1); all located upstream of BRLD. These locations had a high abundance of smaller bodied, more tolerant
minnow species such as Bluntnose Minnow, Creek Chub and Central Stoneroller (Table 6). Group 1 stations also
Mill Creek Bull Creek
Indian
Creek Salt Creek
Flagg
Creek
Sawmill
Creek
Hickory
Creek
Hickory
Creek
Jackson
Creek
Manhattan
Creek
Common Name Total No. Sites GW-09 GV-01 GU-06 GL-01 GK-03 GJ-01 GG-04 GG-06 GC-03 GCA-01
Longnose gar 2 1 0 0 0 0 0 0 0 0 2 0
Bowfin 1 1 1 0 0 0 0 0 0 0 0 0
Central mudminnow 3 3 1 1 1 0 0 0 0 0 0 0
Grass pickerel 1 1 0 0 0 0 0 0 0 1 0 0
Northern pike 3 1 0 0 0 3 0 0 0 0 0 0
Muskellunge 2 1 0 0 0 2 0 0 0 0 0 0
Carp 25 4 0 0 1 15 1 8 0 0 0 0
Golden shiner 2 1 0 0 0 2 0 0 0 0 0 0
Creek chub 331 8 0 78 52 4 140 15 0 7 6 29
Hornyhead chub 227 7 0 87 30 28 53 9 2 18 0 0
Central stoneroller 1691 8 0 285 410 0 608 186 25 96 41 40
Suckermouth minnow 1 1 0 0 0 0 0 0 0 0 1 0
Striped shiner 238 4 0 1 0 0 0 0 30 153 54 0
Redfin shiner 7 1 0 0 0 0 0 0 0 0 7 0
Spotfin shiner 26 3 0 0 0 12 0 5 0 0 9 0
Fathead minnow 4 2 0 0 3 0 0 1 0 0 0 0
Bluntnose minnow 1273 10 33 115 440 17 84 208 1 1 370 4
Rosyface shiner 60 6 0 0 4 2 0 20 10 23 1 0
Blackchin shiner *T* 1 1 0 0 0 1 0 0 0 0 0 0
Sand shiner 57 3 0 0 0 1 0 1 0 0 55 0
White sucker 148 6 0 1 12 13 76 8 0 0 38 0
Northern hog sucker 6 1 0 0 0 0 0 0 0 0 6 0
Golden redhorse 17 1 0 0 0 0 0 0 0 0 17 0
Channel catfish 6 3 0 1 0 4 1 0 0 0 0 0
Yellow bullhead 41 8 2 0 1 4 4 17 0 6 4 3
Stonecat 3 2 0 2 1 0 0 0 0 0 0 0
Tadpole madtom 3 3 1 0 0 0 0 1 0 0 1 0
Banded killifish *T* 5 2 0 2 3 0 0 0 0 0 0 0
Blackstripe topminnow 251 7 71 23 85 0 25 13 0 7 27 0
Mosquitofish 1 1 0 0 0 0 1 0 0 0 0 0
Yellow bass 1 1 0 1 0 0 0 0 0 0 0 0
Black crappie 3 1 0 0 0 3 0 0 0 0 0 0
White crappie 1 1 1 0 0 0 0 0 0 0 0 0
Rock bass 73 5 0 1 0 0 0 0 16 16 27 13
Largemouth bass 178 9 73 21 24 4 29 15 1 6 5 0
Smallmouth bass 101 4 0 0 0 0 0 0 53 12 16 20
Green sunfish 129 9 30 30 8 3 35 16 1 5 1 0
Bluegill x Green sunfish hybrid 2 2 1 0 0 1 0 0 0 0 0 0
Bluegill 212 10 51 12 5 35 25 6 1 6 57 14
Pumpkinseed 9 4 3 2 0 0 1 3 0 0 0 0
Orangespotted sunfish 4 1 0 0 0 4 0 0 0 0 0 0
Unidentified Sunfish hybrid 6 3 0 0 1 0 3 0 0 0 2 0
Walleye 6 1 0 0 0 6 0 0 0 0 0 0
Yellow perch 21 2 20 0 0 1 0 0 0 0 0 0
Blackside darter 59 4 0 11 39 0 0 0 0 0 8 1
Logperch 9 2 0 0 0 0 8 1 0 0 0 0
Johnny darter 195 7 7 73 78 0 0 1 1 16 19 0
Banded darter 50 3 0 1 0 0 0 0 0 0 45 4
Orangethroat darter 11 4 0 0 0 0 0 0 1 3 3 4
Fantail darter 67 3 0 62 0 0 0 0 0 0 4 1
Iowa darter *T* 6 2 1 5 0 0 0 0 0 0 0 0
Round goby 49 1 0 0 0 0 49 0 0 0 0 0
Species 50 50 14 22 18 21 16 19 12 16 26 11
Total fish 5628 5628 296 815 1198 165 1143 534 142 376 826 133
Table 6. Number of fish species and individuals collected at Des Plaines River tributary stations in 2018 for all methods combined, including total number of each
species and the number of sites where each species was collected. Stations are arranged from upstream (left) to downstream (right).

20 |D e s P l a i n e s R i v e r B a s i n S u r v e y
had a high number of
individuals. Salt Creek (GL-01)
and Mill Creek (GW-09), also
located upstream of BRLD,
were not similar to any other
stations (Figure 10). Salt Creek
has a larger, highly urbanized
watershed than the other
streams. Species richness was
relatively high (n=21) but
minnow species were in low
abundance. Unlike the other
tributary streams, which were
sampled by electric seine, this
deeper station at Salt Creek
was sampled by boat
electrofishing. As a result,
larger bodied fish (Channel
Catfish, Walleye, and Common
Carp) were more abundant.
Mill Creek is smaller, low gradient stream located downstream of an impounded glacial lake. It held many lake-
dwelling sport species (Table 6), unlike all other locations. Stations downstream of BRLD formed Group 2 (GG-06,
GC-03) and Group 3 (GG-04, GCA-01) (Figure 10). Jackson Creek (GC-03) and upper Hickory Creek (GG-06) had
moderate to good habitat quality and many similar species (n=14); however, Jackson Creek was larger and held
more species that Hickory, including several species not found in other Des Plaines River tributaries (Longnose
Gar, Suckermouth Minnow, Redfin Shiner and Northern Hogsucker; Table 6). Group 3 stations GG-04 and GCA-01
(Figure 10) were also quite different in size but appeared to group together due to lower species richness and
lower catch rate. GG-04, located on lower Hickory Creek, despite its larger size and the presence of diverse
habitat (including rocky substrate, numerous riffles, and deep pools) had very low species richness and few
individuals (Table 6). Extensive upstream urbanization and the presence of a large dam directly downstream may
have affected this station. GCA-01, located on Manhattan Creek (Group 3, Figure 10), is a very small stream
which also had moderately good habitat but lacked deeper pools and held few fish as a result.
Stream Quality/Index of Biotic Integrity (IBI) Tributary IBI scores ranged from 27 at Mill Creek to 49 at Jackson Creek, with a mean score of 36.8 (Table
7, Table 8). Jackson Creek (GC-03), and Bull Creek (GV-01) were the only stations which met or exceeded IEPA
threshold for “Full Support of Aquatic Life Use” based on fish IBI scores (IBI≥41, Table 7). Low IBI scores result
from a number of factors, including past and current water quality problems, habitat limitations and lack of direct
connection to a quality riverine recruitment source. Although not available for 2018, 2013 macroinvertebrate
data (Pescitelli and Rung 2015) suggests water quality was limiting at 3 of the 10 tributary locations (Flagg, Indian
and Mill Creeks). Habitat at Flagg Creek also appeared to be quite limited with fine substrate and poorly
developed riffles and pools. All streams except Jackson Creek had relatively high percentage of urban land cover,
which has been shown to be negatively correlated with IBI scores in Northeastern Illinois (Slawski et al. 2008,
Pescitelli et al. 2008).
Figure 10. Non-parametric Multidimensional Scaling (NMDS) plot of square root
transformed catch per unit effort for Des Plaines River tributary stations. Stations
grouping closer together have more similar fish species assemblages. See text for
descriptions of numbered groups.

21 |D e s P l a i n e s R i v e r B a s i n S u r v e y
Stream quality conditions were poor in 1983 with a mean IBI of 21.3 (Table 8). The mean increased in
1997 to 36.4, which is a biologically meaningful change (>10 points) from 1983. The mean IBI for tributary sites
has been relatively stable from 1997 to 2018, though data for some locations were lacking in 1997 and 2003
(Table 8). IBI trends for individual streams over the sampling period appeared to be influenced by position in the
watershed (Table 8). Jackson Creek, located in the primarily agricultural area of the Des Plaines River watershed,
had relatively stable IBI scores for all samples 1983-2018. IBI scores for Indian, Bull, Salt, Flagg, and Sawmill
Creeks, which are all located in more urbanized watersheds (USGS 1999), all demonstrated “biologically
meaningful” change (>10 points; Smogor 2004) since 1983 (Table 8). Water quality conditions were described as
“severe” for these streams in 1983 and was a primary limiting factor affecting fish assemblages (IEPA 1988).
Water quality issues were also prevalent on the mainstem of the Des Plaines River in 1983 and before,
reducing fish species richness (Bertrand 1984). Although fish assemblages have recovered the mainstem remains
limited in terms of native species richness upstream of BRLD. Tributary streams typically rely on a species rich
recruitment source downstream to maintain quality fish assemblages. Therefore, reduced fish species richness in
the mainstem may still be a primary limiting factor for Des Plaines River tributaries.
Sportfish Bluegill and Largemouth Bass were wide-spread and abundant throughout most tributary sites (Table 6).
The size distribution for these two species was typical of that for small streams in Northeastern Illinois with a
population dominated by smaller individuals and few larger individuals present (Figure A-3). Smallmouth Bass
IEPA Code Stream 1983 1997 2003 2008 2013 2018
GW-02/GW-01* Mill Creek 22 35 27
GV-01 Bull Creek 23 28 38 34 40 47
GU-06/GU-02* Indian Creek 24 30 37 39 31 37
GL-01 Salt Creek 12 27 23 16 32
GJ-01 Flagg Creek 10 32 29 32
GK-03 Sawmill Creek 9 34 36 36
GG-04 Hickory Creek 38 34 35 36
GG-06 Hickory Creek 29 37 37 37 41 35
GCA-01 Manhattan Creek 40 37 40 42 37
GC-03/GC-02* Jackson Creek 41 47 41 47 36 49
mean 21.3 36.4 36.4 35.6 34.1 36.8
Stdev 10.85 7.70 4.39 6.54 7.58 6.66
Table 8. Comparison of Index of Biotic Integrity (IBI) results for Des Plaines River tributary stations, 1983-
2018.
IBI Metric Value Score Value Score Value Score Value Score Value Score Value Score Value Score Value Score Value Score Value Score
No. fish species 14 3 22 6 17 4 20 4 14 3 18 4 12 2 16 3 26 6 11 2
No. native minnow species 5 1 5 3 6 4 8 5 4 2 8 4 5 3 6 4 9 5 3 2
No. sucker species 0 0 1 2 1 2 1 1 1 2 1 2 0 0 0 0 3 4 0 0
No. sunfish species 5 6 5 6 3 4 5 6 4 6 4 6 5 6 5 6 5 6 3 5
No. benthic invertevore species 3 2 6 4 3 2 0 0 1 1 3 2 2 2 2 2 9 6 4 3
No. intolerant species 1 1 3 3 2 2 3 3 1 1 2 2 3 3 3 3 4 4 2 2
Prop. specialist benthic invertivores 0.03 2 0.187 6 0.098 4 0 0 0.007 1 0.006 1 0.014 1 0.051 2 0.125 5 0.075 3
Prop. generalist feeders 0.392 6 0.292 6 0.436 6 0.667 5 0.32 6 0.534 6 0.232 6 0.473 6 0.728 4 0.376 6
Prop. Lithophilic spawners 0 0 0.472 5 0.403 5 0.218 3 0.585 6 0.404 4 0.965 6 0.854 6 0.219 3 0.586 6
Prop. Tolerant species 0.214 6 0.182 6 0.412 4 0.35 5 0.429 4 0.389 5 0.167 6 0.25 5 0.192 6 0.273 5
Total IBI Score 27 47 37 32 32 36 35 37 49 34
Table 7. Index of Biotic Integrity (IBI) scores for the 2018 Des Plaines Basin Survey tributary stations, including individual metric values and scores.GG-04 GG-06 GC-03 GCA-01GJ-01GW-09 GV-01 GU-06 GL-01 GK-03

22 |D e s P l a i n e s R i v e r B a s i n S u r v e y
were collected only in Hickory, Jackson and Manhattan Creeks with a total of 101 individuals (Table 6). Several
year classes were present with a relatively large number of fish in the 5 to 7 inch range (1 to 2 years old) (Figure
A-3). No Y-O-Y were present and only a few quality sized fish (≥11 inches) were collected. Rock Bass were only
found primarily in Hickory, Jackson and Manhattan Creek, with a size distribution similar to Smallmouth Bass.
DuPage River
Distribution and Abundance Six stations were sampled in the DuPage River system, including two on the East Branch, two on the West
Branch, and two on the mainstem of the DuPage River. We collected a total of 1,287 individuals, representing 37
fish species at all the stations combined (Table 9). No State listed fish species were collected in 2018, or in any
other previous surveys upstream of the Channahon Dam. River Redhorse (State Threatened) was collected
downstream of the Channahon Dam in 2003. Common Carp and Round Goby were the only non-native species
collected in 2018. It is not surprising to find Gobies downstream of the Channahon Dam due to the direct
connection to the lower Des Plaines River where they are common. However, their appearance on the East
Branch, upstream of Channahon Dam, was not expected and likely the result of a bait bucket release by an
angler.
The number of fish species collected at individual stations in 2018 ranged from 10 to 28 (Table 9). Station
GB-01, located downstream of the Channahon Dam, held the highest number of fish species and greatest total
abundance for the DuPage River system in 2018; similar to past surveys (Pescitelli and Rung 2015). The five most
numerous fish species collected at the six stations in the DuPage River watershed were Bluegill, Smallmouth Bass,
White Sucker, Largemouth Bass, and Northern Hogsucker (Table 9) accounting for 54% of the fish collected. Four
of the five fish species were wide spread appearing at 5 or more stations. Northern Hogsucker was found only in
the lower West Branch (GBK-02) and mainstem of the DuPage River (GB-01 and GB-11).
Dams at Channahon, Shorewood and Naperville (Fawell Dam) create four segments within the DuPage
River system (see Figure 2) and appear to influence the distribution of fishes as previously observed (Yoder et al.
2015; Pescitelli and Rung 2003). Species richness was highest at the station below the Channahon Dam and
decreased in the river segments upstream of each of the three dams. Past water quality problems in the DuPage
River led to local extirpation of many of the pollution intolerant species (Bertand et al 1983). Despite
improvements in water quality throughout the system, the dams have prevented recolonization from
downstream sources.
In 2018, there were 10 species collected only downstream of the Channahon Dam including: Gizzard
Shad, Suckermouth Minnow, Rosyface Shiner, Smallmouth Buffalo, Golden Redhorse, Silver Redhorse,
Pumpkinseed, Walleye, Blackside Darter, and Freshwater Drum (Table 9). A total of 11 species have never been
found upstream of the Channahon Dam (Appendix, Table A-2). Due to water quality improvements in the lower
Des Plaines River, cumulative species richness downstream of both the Channahon Dam on the DuPage River and
the BRLD on the Des Plaines River has steadily increased since 1983. Species richness plateaued upstream of the
impassable Channahon Dam between 1983 and 2018, while species richness continued to increase on the upper
Des Plaines River due to fish passage through the Brandon Road Lock (Altenritter et al. 2019). The Channahon
Dam was breached by a large flood event in 1996 and repaired in 1997. It appears that several species including
Shorthead Redhorse, Golden Redhorse, Silver Redhorse, and Longear Sunfish swam upstream during the time the
dam was breached, and were collected for several subsequent surveys. Silver Redhorse, Golden Redhorse,
Quillback, and Longear Sunfish have not been collected above the Channahon Dam since 2008. We collected 99
Shorthead Redhorse in 1997 and 2003 combined, but only 16 have been collected in the last three surveys. Dam

23 |D e s P l a i n e s R i v e r B a s i n S u r v e y
removal or installation of fish passage at the Channahon Dam is currently not possible due the presence of Asian
Carp downstream.
The low head dam in Shorewood also appears to have an impact on the distribution of fishes. For all
basin surveys from 1983 to 2018, a total of eight species collected between the Channahon Dam and the
Shorewood Dam were never been collected upstream of the Shorewood Dam (Table A-2). Combined with the 11
species found only downstream of Channahon Dam, a total of 19 species have been found only in the two
downstream river segments. In 2019, the Shorewood Dam was earmarked for removal for biological and human
safety concerns.
E Br
DuPage
River
E Br
DuPage
River
W Br
DuPage
River
W Br
DuPage
River
DuPage
River
DuPage
River
Total GBL-07 GBL-19 GBK-07 GBK-02 GB-11 GB-01
Gizzard shad 2 0 0 0 0 0 2
Carp 48 1 7 27 5 7 1
Creek chub 21 19 0 1 1 0 0
Hornyhead chub 26 0 1 2 21 2 0
Central stoneroller 10 9 0 0 0 0 1
Suckermouth minnow 4 0 0 0 0 0 4
Spotfin shiner 59 2 8 29 0 0 20
Bluntnose minnow 63 22 0 6 5 1 29
Rosyface shiner 2 0 0 0 0 0 2
Sand shiner 3 0 0 1 0 0 2
Mimic shiner 26 0 0 0 0 0 26
Smallmouth buffalo 2 0 0 0 0 0 2
White sucker 110 13 29 27 27 14 0
Northern hog sucker 85 0 0 0 5 46 34
Shorthead redhorse 36 0 0 0 0 4 32
Golden redhorse 19 0 0 0 0 0 19
Silver redhorse 1 0 0 0 0 0 1
Channel catfish 18 0 2 0 0 7 9
Yellow bullhead 21 3 2 3 3 8 2
Flathead catfish 2 0 0 0 0 2 0
Stonecat 5 4 0 0 1 0 0
Blackstripe topminnow 10 9 0 0 0 0 1
Black crappie 5 0 0 3 0 1 1
Rock bass 30 0 0 1 6 12 11
Largemouth bass 102 4 26 43 11 2 16
Smallmouth bass 173 4 11 10 85 32 31
Green sunfish 47 33 3 5 3 3 0
Bluegill x Green sunfish hybrid 4 0 1 1 2 0 0
Bluegill 223 49 26 50 15 18 65
Pumpkinseed 2 0 0 0 0 0 2
Unidentified Sunfish hybrid 1 1 0 0 0 0 0
Walleye 1 0 0 0 0 0 1
Blackside darter 1 0 0 0 0 0 1
Slenderhead darter 1 0 0 0 0 1 0
Logperch 38 0 0 0 0 0 38
Johnny darter 39 39 0 0 0 0 0
Banded darter 5 3 0 0 0 2 0
Freshwater drum 1 0 0 0 0 0 1
Round goby 41 35 0 0 0 5 1
Species 37 16 10 14 13 18 28
Total fish 1287 250 116 209 190 167 355
Table 9. Number of fish species and individuals collected at each DuPage River station in 2018 for all methods combined,
including total number of each species. Stations are arranged from upstream (left) to downstream (right).

24 |D e s P l a i n e s R i v e r B a s i n S u r v e y
River segments upstream of the Shorewood Dam include 18 miles of mainstem channel, at which point
the river splits into the West and East Branches. There is an eight mile segment of the West Branch between the
mainstem confluence and the impassable Fawell Dam. Stations GBK-02 and GBL-19 are within this segment. The
East Branch is free flowing for 13 miles up to the Morton Arboretum Dam, which appears to be passable by fish
at some flow levels. GBL-07 is just upstream of the Morton Arboretum Dam, and 5 miles downstream of the
Churchill Woods Dam, which was removed in 2011. A total of 33 fish species have been collected in these
segments upstream of the Shorewood Dam since 1983, most of which were also found downstream (Table A-2).
The stream segment above the Fawell Dam on the West Branch (Figure 2) has produced only 20 species
for all surveys combined. These are mostly tolerant species, with the exception of Smallmouth Bass which was
absent prior to a stocking program by IDNR. Altogether, a total of 33 species have been collected within the
DuPage River watershed which are absent above the Fawell Dam including many common species found in
similar sized watersheds (Table A-2). Although some reduction is species richness is expected in smaller
upstream habitats, results from the Mazon River, a similar sized, more natural system in Northeastern Illinois, far
upstream sites contained similar numbers of species compared to downstream sites (Pescitelli and Rung 2015).
Water quality upstream of the Fawell Dam is currently adequate to support higher fish species richness as
indicated by evaluation of
macroinvertebrate assemblages
(Pescitelli 2015). However, the presence
of the dam limits additional species
recolonizing the river upstream of the
dam. There are currently efforts
underway by DuPage County Forest
Preserve District to provide fish passage
at the Fawell Dam (S. McCracken, pers.
comm.)
The differences in fish
assemblages between stream segments,
due in large part to the DuPage River
dams, are reflected in the NMDS plot
(Figure 10). This analysis is based on
catch rate of all species collected at six
fixed-site stations for all basin surveys from
1983 to 2018. The two mainstem stations, GB-01 and GB-11, on the left side of the plot were not similar to other
stations but were also not similar to one another, likely due to fragmentation by the Channahon Dam. As
described above, stations on the East Branch (GBL-19) and West Branch (GBK-02) while technically within the
same stream segment above the lower dams in Shorewood and Channahon, were also dissimilar possibly due to
habitat differences. The East Branch is mostly channelized while the West Branch maintains more natural habitat
features including riffles, pools and runs. The upper stations on the East Branch (GBL-07) and West Branch (GBK-
07) appear to have similar fish assemblages, grouping closely together on the right side of the plot (Figure 10),
despite habitat differences between the two branches. Due to the Fawell Dam species richness is reduced at
station GBK-07 on the West Branch. Despite having much more diverse habitat features above the dam, fish
assemblages were similar to the habitat-limited East Branch station GBL-07.
Figure 10. NMDS plot based on catch rate of all species
collected for DuPage River Basin surveys from 1983 to 2018.

25 |D e s P l a i n e s R i v e r B a s i n S u r v e y
Stream Quality/Index of Biotic Integrity (IBI)
IBI scores for the DuPage River watershed largely mirrored species richness trends in 2018. IBI scores
were higher on the mainstem and decreased at the upper stations (Table 10). Only GB-01 and GB-11 exceeded
the threshold for “Full Support of Aquatic Life” (IBI≥41; IEPA 2014). Upstream stations had lower IBI metric
scores for total fish species, native minnow species and sucker species metrics. Low species metric scores were
related to the decrease in species richness resulting from presence of dams, especially the Fawell Dam on the
West Branch, located downstream of GBK-07. Based on 2013 macroinvertebrate data, which resulted in “full
support” ratings at all stations
(Pescitelli 2015), water quality did
not appear to be a limiting factor.
Habitat quality was lower on the
East Branch due to past
channelization, whereas the West
Branch has more natural habitat
conditions throughout much of its
length. DuPage County Forest
Preserve District has completed
seven miles of habitat restoration on the West Branch including two dam removals (Jessi DeMartini, DuPage
County Forest Preserve District 2013, pers. comm.). However, all projects are located upstream of the Fawell
Dam. Therefore, improvement in fish assemblages following the restorations has been limited (IDNR unpublished
data).
Similar to the Des Plaines River, the lowest historic IBI scores for the DuPage River systems were
observed in 1983 due to poor water quality. However, unlike the Des Plaines River, differences in IBI scores was
not significant among years for the DuPage River watershed (Table 11; ANOVA; P=0.23). Mean IBI for all six
stations improved in 1997 and 2003. The 2003 mean IBI was greater than the 1983 mean by 14.5 points,
indicating a “biologically meaningful change” (>10 points; Smogor2004). Between 2003 and 2018, mean IBI has
been stable (Table 11). GB-01 saw a 19 point increase between 1997 and 2003, possibly reflecting improvements
IBI Metric Value Score Value Score Value Score Value Score Value Score Value Score
No. fish species 14 3 9 2 13 3 12 2 16 3 26 5
No. native minnow species 5 3 2 2 5 3 3 2 2 2 7 5
No. sucker species 1 2 1 1 1 1 2 2 3 3 5 4
No. sunfish species 4 6 4 5 6 6 5 6 6 6 6 6
No. benthic invertevore species 3 2 0 0 0 0 2 2 4 3 8 5
No. intolerant species 2 2 2 2 2 2 3 3 5 5 3 3
Prop. specialist benthic invertivores 0.168 6 0 0 0 0 0.026 1 0.317 6 0.352 6
Prop. generalist feeders 0.568 6 0.664 5 0.713 4 0.311 6 0.347 6 0.445 6
Prop. Lithophilic spawners 0.052 1 0.103 2 0.062 1 0.616 6 0.581 6 0.493 6
Prop. Tolerant species 0.429 4 0.444 4 0.462 4 0.5 4 0.312 5 0.115 6
Total IBI Score 35 23 24 34 45 52
GB-01
Table 10. Index of Biotic Integrity (IBI) scores for the 2018 DuPge River Survey stations, including individual metric values and scores.GBL-07 GBL-19 GBK-07 GBK-02 GB-11
IEPA CODE STREAM 1983 1997 2003 2008 2013 2018
GB-01 DuPage River 30 38 57 58 39 52
GB-11 DuPage River 38 48 45 43 42 45
GBK-02 West Branch 24 29 39 39 34 34
GBK-07 West Branch 10 19 21 23 23 24
GBL-02/19 East Branch 17 28 31 26 23 23
GBL-07 East Branch 14 22 27 31 33 35
mean 22.2 30.7 36.7 36.7 32.3 35.5
std. dev. 10.55 10.73 13.11 12.91 7.94 11.43
Table 11. Comparison of Index of Biotic Integrity score for the DuPage River Basin 1983 to 2018.

26 |D e s P l a i n e s R i v e r B a s i n S u r v e y
in the nearby lower Des Plaines River fish assemblage (Gibson-Reinemer et al. 2017). Lower water levels made
boat sampling difficult in 2013, likely accounting for the 19 point decrease in the IBI score that year. GBL-07 on
the East Branch has seen consistent increases in IBI scores over the entire survey period, possible due to water
quality improvements. Also, the dam removal at Churchill Woods on the East Branch in 2011 contributed to
habitat improvement and increased connectivity on to the lower East Branch.
Sportfish Bluegill was the most numerous sportfish in the DuPage River basin, with a total of 223 collected by boat
electrofishing for a catch rate of 44 per hour (Table 12). Bluegill were present at all stations with abundance
ranging from 15 to 65 individuals (Table 9). Most Bluegill were in the three to six inch range and Y-O-Y (< 2 inches)
were present, but not abundant (Figure A-4). One hundred seventy-three Smallmouth Bass were collected,
appearing at all six stations with a catch rate of 34 fish per hour (Table 10). Catch rate was lower in the East
Branch (11 per hour) due to lower channel gradient and the absence of riffle/pool habitat. A wide range of sizes
were present (Figure A-4). Y-O-Y were relatively low in abundance, but one year-old fish (4-6 inches) were very
common. Station GBK-02 at Plainfield held the highest number of Smallmouth Bass (n=85) (Table 9), but
downstream locations on the DuPage River generally held larger fish. Other sportfish species collected in 2018
included, in order of abundance: Largemouth Bass, Rock Bass and Channel Catfish (Table 12). Largemouth Bass
were present at all stations, with highest catch rates at GBK-07 and GBL-19 (Table 9). Multiple year classes were
present including many Y-O-Y and one year-old fish (Figure A-4). Larger fish up to 16 inches were more common
at downstream stations. Eighteen Channel Catfish were collected, 16 at the mainstem DuPage River stations. All
but two fish exceeded 20 inches in length. Thirty Rock Bass were captured in the mainstem and West Branch
with none collected at the East Branch stations. Rock Bass were all less than 10 inches in Length. Overall catch
rate of sportfish has increased each year of the DuPage River basin survey (Table 12). In 1983, Rock Bass and
Channel Catfish were not present and Smallmouth Bass were only found at one station. Catch rate more than
doubled in 1997 and has increased in each survey since. Smallmouth Bass were not present upstream of Fawell
Dam in 1995 (IDNR database). They have been stocked multiple times since then, including many 2-4 inch fish
from 1995-1997. Stocking of smaller size Smallmouth Bass resulted in increased abundance in the West Branch.
Several stocking events included larger brood-sized fish (14-18 inches), the last such stocking occurred in 2012.
Stocking of larger brood-sized fish was fairly unsuccessful. The tagged larger individuals were present in several
subsequent electrofishing samples and also in angler reports for a short time after stocking. However, their
numbers diminished rapidly and any remaining fish appeared to be in poor condition. The number of
Smallmouth Bass has decreased at GBK-07 since 2003, with only 10 collected in 2018. Additional stocking is
possible, but a more sustainable approach would be to provide fish passage at the Fawell Dam.
Species Total No./hr. Total No./hr. Total No./hr. Total No./hr. Total No./hr. Total No./hr.
Bluegill 53 12 102 21 123 27 202 37 259 51 223 44
Smallmouth bass 22 5 37 8 129 28 110 20 124 24 173 34
Rock bass 0 0 8 2 28 6 58 11 39 8 30 6
Largemouth bass 28 6 65 14 68 15 53 10 58 11 102 20
Channel catfish 0 0 12 3 11 2 16 3 11 2 18 4
total 103 23 224 62 359 78 439 80 491 96 546 107
1983 2018
Table 12. Total number of sport species and catch per hour captured by boat electrofishing for DuPage River Basin, six stations 1997 -
2018.
1997 2003 2008 2013

27 |D e s P l a i n e s R i v e r B a s i n S u r v e y
Summary Similar to many rivers and streams in Illinois and across the country, the Des Plaines River has benefited
from improved water quality conditions following passage of the Clean Water Act in 1972. These improvements
did not occur rapidly in the Des Plaines River as indicated by fish collections reported herein. Unlike other basins
in Northeastern Illinois which have seen little change since 1994 (Pescitelli and Rung 2014, Pescitelli and Rung
2015), the Des Plaines River has experienced continued improvements in recent years with the appearance of
new fish species, a decline in tolerant species and an increase in abundance and distribution of intolerant species.
Ongoing additions to TARP appear to be a major contributor to improvements in fish assemblages with the
completion of the Des Plaines River Tunnel in 1999 and the addition of the McCook Reservoir in 2017.
Another critical component of the ongoing restoration in the upper Des Plaines River is the connection to
diverse fish recruitment sources in the lower Des Plaines, Kankakee and Illinois Rivers, downstream of BRLD
(McClelland et al. 2004, Pescitelli 2015, Gibson-Reinemer 2017). Many of the new migrants appearing upstream
of BRLD have a preference for riverine habitats, coupled with the close proximity of aforementioned waterways,
suggests that the waterways downstream of BRLD were the primary source of recruitment for the upper Des
Plaines River. Passage through the 29 ft. tall lock does not appear to be an easy migration pathway. However,
recent empirical (Altenritter et al. 2019) and micro-chemical evidence (Snyder et al. 2019) has confirmed that
BRLD is passable by fish. Based on 2018 data, it also appears that fishes already occurring upstream of BRLD, like
Smallmouth Bass, rely on connection to a downstream recruitment source. The increase in Smallmouth Bass
abundance and overall stream quality improvements following the addition of the McCook Reservoir were quite
remarkable and rapid. These events are a good indicator for further improvements to the Des Plaines River
ecosystem which, despite the progress to date, remains on IEPA’s impaired list.
Currently, the biggest threat to continued restoration of the upper Des Plaines River is the planned
installation of the invasive fish species barrier in the Brandon Road Lock. This barrier will not only halt movement
of invasive fish species but native species as well. New migrants are needed to restore the upstream segment of
the Des Plaines River to “full aquatic life use” and also to help maintain and improve existing populations. In
addition to natural events such as floods and droughts, the Des Plaines River upstream of the BRLD remains
vulnerable to local extirpations due to human perturbations such as pollution causing fish kills, especially given
the high extent of urbanization in the watershed.
In recent years there has been extensive public investment in the Des Plaines River watershed. In
addition to the multi-billion dollar TARP system, nine dams on the mainstem of the upper Des Plaines River have
been removed. The remaining two dams upstream of the BRLD are slated for removal, creating over 96 miles of
free flowing river. Three dams have been removed on the DuPage River system as well and additional removals
and fish passage projects are planned for that system. Seven miles of extensive habitat restoration has been
completed on the West Branch of the DuPage River. Recently, the upper and lower Des Plaines River Watershed
Groups were formed to address impairments as part of the total maximum daily load (TMDL) process required by
the Clean Water Act. Both groups have developed watershed plans and monitoring programs with financial
support from IEPA. Success of these projects will be measured in part by the response of fish assemblages and in
turn improvement in the IBI. Continued improvements in IBI ratings will be difficult without recruitment of
additional fish species, especially intolerant and specialist species. Continued connection to downstream
recruitment sources will also be critical to the restoration of mussel communities which are currently in very poor
condition in the upper Des Plaines River (Price et al. 2012). A mitigation program will be necessary to accomplish
these goals if the planned Brandon Road Lock fish barrier is installed.
28 |D e s P l a i n e s R i v e r B a s i n S u r v e y
References Altenritter, M. E., S M. Pescitelli, A L. Whitten, A F. Casper. 2019. Implications of an invasive fish barrier for the
long-term recovery of native fish assemblages in a previously degraded northeastern Illinois River system. River Res Applic. 2019;1–9. https://doi.org/10.1002/rra.3457
Anderson, R. O. and R. M. Neuman. 1996. Length, weight, and associated structural indices. Pages 447-482 in B. R. Murphy and D. R. Willis, editors, Fisheries techniques, 2
nd edition. American Fisheries Society, Bethesda, Maryland.
Bayley, R. R., R. W. Larimore, and D. C. Dowling. 1989. Electric seine as a fish sampling gear in streams. Transactions of the American Fisheries Society 118:447-453.
Bertrand, Bill. 1984. Des Plaines River Basin Fisheries Assessment. Illinois Department of Conservation (currently Department of Natural Resources). Springfield, IL.
Bray, J. R. and J. T. Curtis. 1957. An ordination of the upland forest communities of Wisconsin. Ecological Monographs 27:325-349.
Day, D. M. 1991. The Des Plaines River: Monitoring the Fish Resources of an Urban River (1978-1991) Streams Program, Illinois Department of Conservation, Aledo, IL. Heidinger, R. C. 1989. Fishes in the Illinois portion of the upper Des Plaines River. Transactions of the Illinois Academy of
Science. 82:85-96. Kwak, T. J. and J. T. Peterson. 2007. Community indices, parameters, and comparisons, Pages 327-374 in C. S. Guy and M. L.
Brown, editors. Analysis and interpretation of freshwater fisheries data. American Fisheries Society, Bethesda Maryland.
IEPA 1988. Illinois Environmental Protection Agency, An Intensive Survey of the Des Plaines River Basin from the Wisconsin State Line to Joliet, Illinois, 1983-1984. Division of Water Pollution Control. IEPA/WPC/88-014. Springfield, IL.
IEPA 2016. Illinois Environmental Protection Agency, Illinois Integrated Water Quality Report and 303d list – Volume I – Surface Water – 2016. Illinois Environmental Protection Agency, Springfield, IL. http://www.epa.state.il.us/water/tmdl/303d-list.html.
FPCC 2018. Forest Preserve District of Cook County website. https://fpdcc.com/about/plans-projects/dam-removals/#removal
Gibson-Reinemer, D. K., R. E. Sparks, J. L. Parker, J. A. DeBoer, M. W. Fritts, M. A. McClelland, J. H. Chick, and A. F. Casper 2017. Ecological Recovery of a River Fish Assemblage following the Implementation of the Clean Water Act. BioScience 67 (11) 957-970.
Healy, R. W. 1979. River mileages and drainage areas for Illinois streams- Volume 1, Illinois except Illinois River Basin. U.S. Geological Survey, Water Resources Investigations 79-110.
Langbein, J. R. and H. L. Wright. 1976. Inventory of the fishes of the Des Plaines River Basin for 1974. Illinois Department of Conservation, 37 pp.
McClelland, M.A., and Pegg, M.A. 2004. Spatial and temporal patterns in fish communities along the Illinois River. Ecology of Freshwater Fish 13:125-135.
MWRD 2018. Metropolitan Water Reclamation District website: MWRD.org Muench, B. 1968. Upper Illinois Tributaries and Des Plaines. In: A. C. Lopinot, editor. Inventory of Nine River Basins in Illinois
– 1967. Illinois Department of Conservation Special Fisheries Report No. 25. Pescitelli S. M. and R. C. Rung 2003. Effects of Dams on the DuPage River System: Fish Communities, Sportfishery, and
Stream Quality. Illinois Department of Natural Resources, Region II Streams Program, Plano, IL Pescitelli, S., R. Rung, R. Bushman, and E. Hansen. 2010. Establishing an urban sauger fishery in the Des Plaines River. 48
th
Annual Meeting of the Illinois Chapter of the American Fisheries Society, February 2010, Utica, IL. Pescitelli, S. M, F. M. Veraldi, P. Willink. 2008. Effects of Urbanization on Fish Species Distribution and Biotic Integrity in the
Chicago Region. 46th
Annual Meeting of the Illinois Chapter of the American Fisheries Society, February 2008, Rock Island, IL.
Pescitelli S. M. and R. C. Rung. 2014. Status of fish assemblages and sport fishery in the Fox River Watershed: Results of the 2012 basin survey. Illinois Department of Natural Resources, Division of Fisheries Streams Program, Plano, IL.
Pescitelli S. M. and R. C. Rung. . Status of fish assemblages and sport fishery in the Upper Illinois Basin. Illinois Department of Natural Resources, Division of Fisheries Streams Program, Plano, IL.
Pescitelli, S M. 2015. Status of fish assemblages and sport fishery in the Des Plaines River Watershed and trends over 30 years of Basin Surveys 1983 – 2013. Illinois Department of Natural Resources, Division of Fisheries Streams Program, Plano, IL.
Pescitelli, S. M. 2015. Changes in fish species distribution and stream quality in the Des Plaines River from 1983 to 2013. 53
rd Annual Meeting of the Illinois Chapter of the American Fisheries Society, March 3-5, 2015, Grafton, IL

29 |D e s P l a i n e s R i v e r B a s i n S u r v e y
Pescitelli, S. and T. Widloe. 2017. Evaluation of Stream Quality and Sport Fisheries in the Kankakee River Basin. Illinois Department of Natural Resources, Division of Fisheries Streams Program, Plano, IL.
Price, A. L., D. K. Shasteen, S. A. Bales. 2012. Freshwater mussels of the Des Plaines River and Lake Michigan tributaries in Illinois. INHS Techincal Report 2012 (10). Illinois Natural History Survey, Champaign, IL.
Smogor, R. 2004. Draft manual for calculating Index of Biotic Integrity Scores for streams in Illinois. Illinois Environmental Protection Agency, Bureau of Water, Springfield Illinois.
Slawski, T. M., F. M. Veraldi, S. M. Pescitelli, and M. J. Pauers. 2008. Effects of Tributary Spatial Position, Urbanization and Multiple Low Head Structures on Warmwater Fish Community Structure in a Midwestern Stream. North American Journal of Fisheries Management 28: 1020-1035.
Smith, P. W. 1971. A classification of streams based on their fishes and an analysis of factors responsible for the disappearance of native species, Illinois Natural History Survey Biological Notes No. 76, 14 pp.
USGS 2018. United States Geological Survey, Illinois Water Resources Information Web Page. http//:il.water.usgs.gov/data/index.html.
USGS 2018. Wisconsin Department of Natural Resources Map of Distribution of WI Fish Species, John Lyons https://cida.usgs.gov/wdnr_fishmap/map/ USACE 2013. U.S. Army Corps of Engineers National Inventory of Dams 2013.
http://nid.usace.army.mil/cm_apex/f?p=838:3:0::NO::P3_STATES:IL USACE 2015, U.S. Army Corps of Engineers Rock Island District, Brandon Road Lock and Dam http://www.mvr.usace.army.mil/Portals/48/docs/CC/FactSheets/IL/BrandonRoadLockandDam(2015).pdf USACE 2019, U.S. Army Corps of Engineers Rock Island District, GLMRIS – Brandon Raod. https://www.mvr.usace.army.mil/Missions/Environmental-Protection-and-Restoration/GLMRIS-BrandonRoad/ Yoder, C. O., J. T. Freda, and E. T. Rankin. 2015. Report on Biological and Water Quality Monitoring in the West Branch
DuPage Watershed: 2016-2012. Center for Applied Bioassessment and Biocriteria, Midwest Biodiversity Institute, Columbus, OH.

30 |D e s P l a i n e s R i v e r B a s i n S u r v e y
Appendix
Common name 1974 1983 1997 2003 2008 2013 2018
Gizzard shad X X X X X X X
Northern pike X X X X X X X
Golden shiner X X X X X X X
Creek chub X X X X X X X
Fathead minnow X X X X X X X
Bluntnose minnow X X X X X X X
Emerald shiner X X X X X X
White sucker X X X X X X X
Yellow bullhead X X X X X X X
Black bullhead X X X X X X X
Black crappie X X X X X X X
White crappie X X X X X
Rock bass X X X X X X X
Largemouth bass X X X X X X X
Green sunfish X X X X X X X
Bluegill X X X X X X X
Blackside darter X X X X X X X
Johnny darter X X X X X X X
Bowfin X X X X X X
Central mudminnow X X X X
Common shiner X X X
Spotfin shiner X X X X X X
Red shiner X
Sand shiner X X X X X X
Blackstripe topminnow X X X X X X
Smallmouth bass X X X X X X
Pumpkinseed X X X X X X
Yellow perch X X X X X
Hornyhead chub X X X X X
Bigmouth shiner X X X X X
Quillback X X X X X
Spotted sucker X X X X X
Silver redhorse X
Channel catfish X X X X X
Tadpole madtom X X X X X
Brook silverside X X
Yellow bass X X X X
Orangespotted sunfish X X X X X
Walleye X X X X X
Freshwater drum X X X X X
Central stoneroller X X X
Redfin shiner X
Blackchin shiner X X
Mimic shiner X
Spottail shiner X X X X
Smallmouth buffalo X X X X
Stonecat X X X X
Mosquitofish X X X
Warmouth X X X X
Sauger X X X X
Striped shiner X
River carpsucker X X
Flathead catfish X X
Logperch X X X
Longnose gar X X
Grass pickerel X X
Muskellunge X
Suckermouth minnow X
Rosyface shiner X X
Banded killifish X
Iowa Darter x X
Redear sunfish X X
Orangethroat Darter X
Brown Bullhead X
Total Native Species 18 28 37 45 47 50 51
Cummulative Species Total 18 28 40 50 54 62 64
No. Stations 13 13 8 15 9 14 14
Table A-1. Native fish species collected at all locations upstream of the Brandon Lock and Dam for each
IDNR Basin Survey on the mainstem of the Des Plaines River 1983 to 2018.

31 |D e s P l a i n e s R i v e r B a s i n S u r v e y
DuPage R. DuPage R. West Br. West Br. East Br. East Br.
Dwnstrm
Channahon
Dam
Dwnstrm
Shorewood
Dam
Dwnstrm
Fawell
Dam
Upstrm
Fawell
Upstrm
Shorewood
Upstrm
Shorewood
GB-01 GB-11 GBK-02 GBK-07 GBL-19 GBL-07
Golden shiner X X X X X X
Creek chub X X X X X
Hornyhead chub X X X X X X
Spotfin shiner X X X X X X
Fathead minnow X X X X
Bluntnose minnow X X X X X X
Sand shiner X X X X X X
White sucker X X X X X X
Yellow bullhead X X X X X X
Black crappie X X X X X
Rock bass X X X X X X
Largemouth bass X X X X X X
Smallmouth bass X X X X X X
Green sunfish X X X X X X
Bluegill X X X X X X
Orangespotted sunfish X X X X X X
Gizzard shad X X X X X
Red shiner X X
Quillback X X X X X
Channel catfish X X X X X
Central stoneroller X X X X
Bigmouth shiner X X X X
Stonecat X X X
Blackstripe topminnow X X X X X
Johnny darter X X X X X
Banded darter X X X
Longnose gar X
Grass pickerel X
Suckermouth minnow X
Striped shiner X X X
Common shiner X X
Emerald shiner X X
Rosyface shiner X
Mimic shiner X
Spottail shiner X
Smallmouth buffalo X
River carpsucker X
Northern hog sucker X X X
River redhorse *T* X
Shorthead redhorse X X X X
Black redhorse X
Golden redhorse X X
Silver redhorse X X
Black bullhead X X
Flathead catfish X
Tadpole madtom X X
Pumpkinseed X X
Longear sunfish X X
Walleye X X X
Blackside darter X
Slenderhead darter X
Logperch X
Freshwater drum X X
total no. species 46 34 31 20 25 22
Table A-2. Fish species occurence at each DuPage River sampling station over the Basin Survey
Period 1983 to 2018.
2013
1997
-2013
1983

32 |D e s P l a i n e s R i v e r B a s i n S u r v e y
Figure A-1. Length-frequency graph for Bluegill (A), Channel Catfish (B), Largemouth Bass (C), and Rock Bass (D) for all mainstem
stations for the 2018 Des Plaines River Basin Survey.

33 |D e s P l a i n e s R i v e r B a s i n S u r v e y
Figure A-2. Length-frequency graph for Des Plaines River Smallmouth Bass from
2018 survey (top) and 2013 survey (bottom).

34 |D e s P l a i n e s R i v e r B a s i n S u r v e y
Bluegill
; n=684
Figure A-3. Length-frequency graph for Bluegill (top), Smallmouth Bass (middle) and
Largemouth Bass (bottom) at tributary stations for the 2018 Des Plaines River Basin
Survey.

35 |D e s P l a i n e s R i v e r B a s i n S u r v e y
Bluegill; n=
394
Figure A-4. Length frequency graphs for DuPage River sportfish, Bluegill (top), Smallmouth Bass (middle), and Largemouth Bass (bottom).