t he effects of mergers: an international comparison klaus
TRANSCRIPT

International Journal of Industrial Organization21 (2003) 625–653
www.elsevier.com/ locate/econbase
T he effects of mergers: an international comparison
*Klaus Gugler, Dennis C. Mueller , B. Burcin Yurtoglu,Christine Zulehner
Department of Economics, University of Vienna, BWZ, Bruennerstr. 72, A-1210 Vienna, Austria
Received 12 December 2001; received in revised form 5 July 2002; accepted 22 July 2002
Abstract
This paper analyzes the effects of mergers around the world over the past 15 years. Weutilize a large panel of data on mergers to test several hypotheses about mergers. The effectsof the mergers are examined by comparing the performance of the merging firms withcontrol groups of nonmerging firms. The comparisons are made on profitability and sales.The results show that mergers on average do result in significant increases in profits, butreduce the sales of the merging firms. Interestingly, these post merger patterns look similaracross countries. We also did not find dramatic differences between mergers in themanufacturing and the service sectors, and between domestic and cross-border mergers.Conglomerate mergers decrease sales more than horizontal mergers. By separating mergersinto those that increase profits and those that reduce them and by then examining thepatterns of sales changes following the mergers, we determine the effects of mergers onefficiency and market power. Our results suggest that those mergers that decrease profitsand efficiency account for a large proportion. However, we can also identify mergers thatincrease profits by either increasing market power or by increasing efficiency. The firstconclusion seems to be a more likely explanation for large companies, whereas the latter islikely to be true for small firms. 2002 Elsevier Science B.V. All rights reserved.
JEL classification: G34; L2
Keywords: Mergers; Acquisitions; International comparison
*Corresponding author. Tel.:143-1-4277-37484; fax:1 43-1-4277-37498.E-mail addresses: [email protected](K. Gugler), [email protected](D.C.
Mueller), [email protected](D.C. Mueller), [email protected](B.B. Yurtoglu),[email protected](C. Zulehner).
0167-7187/02/$ – see front matter 2002 Elsevier Science B.V. All rights reserved.doi:10.1016/S0167-7187(02)00107-8
626 K. Gugler et al. / Int. J. Ind. Organ. 21 (2003) 625–653
1 . Introduction
The past century saw five great merger waves—one at its beginning, andsuccessive waves at the ends of the 1920s, 1960s, 1980s and 1990s. While much ofthe earlier merger activity was confined to North America and Great Britain, themost recent wave has engulfed all of the major industrial countries of the world.And, as befits a global economy, it has been composed of an increasing percentageof cross-border acquisitions. What have been the causes of these great bursts ofmerger activity? What have been their effects? In this paper we focus largely onthe second question, but the answers that we give to it will also shed light on thefirst. We confine our analysis to mergers taking place in the last two decades, butinclude in it mergers from around the world including also cross-border acquisi-tions.
1The hypotheses as to why mergers occur can be grouped into three broadcategories. Of these, the first two presume that the managers of the mergingcompanies seek to maximize profits or shareholder wealth. Under this assumptionany merger must be expected to either increase the market power of the mergingcompanies or reduce their costs. The third set of hypotheses includes those thatposit other managerial goals than profits, as say the growth of the firm, orquasi-irrational behavior as might occur because managers are overcome byhubris.
From the point of view of the theory of the firm, it is important to determinewhether mergers are best explained by one of the hypotheses from the thirdcategory, or by a hypothesis that presumes profit maximization. Ifall mergers areconsistent with profit maximization, then corporate governance structures can beassumed to be designed in such a way as to align shareholder and managerialinterests. If, on the other hand, a large fraction does not appear to increaseshareholder wealth, corporate governance structures must be assumed to bedeficient in bringing about such an alignment. We attempt to determine whethermergers increase market power or efficiency by examining their impacts oncompany sales and profits. In this way, we seek to determine to what extentmergers fall into each of these three categories.
The paper proceeds as follows. In the following section we present somepredictions regarding the effects of mergers. Section 3 describes the methodologyused to determine the effects of mergers. Our data base is described in Section 4.Sections 5 and 6 present our overall findings and those that are specific to thequestion of whether mergers increase efficiency or market power. In Section 7 wecompare our findings with those previously reported in the literature. The sampleis divided according to the mergers’ effects on market power and efficiency inSection 8. Conclusions are drawn in the final section.
1We shall not distinguish between mergers and takeovers, but rather simply refer to all as mergers.

K. Gugler et al. / Int. J. Ind. Organ. 21 (2003) 625–653 627
2 . Predictions
We would like to derive predictions regarding the consequences of mergersfrom a model, which is applicable to all forms of mergers, to all industries and inall countries. Unfortunately, we know of nogenerally accepted model of firmbehavior that meets these criteria. The most commonly used oligopoly model inindustrial organization—the Cournot model with identical firms and homogeneousproducts—has the awkward feature of predicting that no horizontal mergers take
2place, even when they raise industry profits. Nevertheless, both economic theoryand our economic intuition allow us to make some predictions about the effects ofmergers on sales and profits.
The term ‘market power’ connotes the ability to control price. Any merger thatincreases a firm’s market power must, therefore, increase its ability to control(raise) the price of its products. If the firm faces a downward sloping demandschedule, and it takes advantage of its increase in market power by raising price,both its output and sales will fall, if it is maximizing profits, as it will then be
3operating in the elastic portion of its demand schedule.Of the three types of mergers, increases in market power are perhaps most likely
to follow horizontal mergers, but are also possible with vertical and conglomeratemergers. Conglomerate mergers can increase the degree ofmultimarket contactbetween the merging firms and their rivals. High multimarket contact raises thecosts of cutting price in any given market and thus can facilitate more cooperative
4behavior thereby effectively increasing the merging firm’s market power.A vertical merger can also increase multimarket contact, if the merging
companies’ rivals are also vertically integrated. A vertical merger can also increasemarket power by raising entry barriers and thus effectively lowering the mergingfirm’s elasticity of demand. Thus, we hypothesize that an increase in market poweris a possible consequence of all three types of mergers. For any merger thatincreases market power, we predict an increase in profits and a decline in sales.
A merger is said to have increased the efficiency of the merging firms, if itreduces their costs. A fall in marginal costs should cause a profit-maximizing
5company to lower its price and thus lead to an increase in both sales and profits.If mergers take place because managers pursue growth rather than profits, or out
2See Salant et al. (1983).3We find the assumption that firms in our sample face negative sloped demand schedules reasonable
because: (1) they do not tend to operate in atomistically competitive industries, (2) many do selldifferentiated products, and (3) even firms selling seemingly homogeneous products like cement differfrom their rivals in terms of location, speed of delivery and similar factors that give them some controlover price.
4For a development and testing of the theory of multimarket contact, see Scott (1993).5A merger might increase efficiency without changing marginal costs by, say, reducing fixed costs.
In this case we should expect an increase in profits and no change in sales. We shall not test separatelyfor this case.

628 K. Gugler et al. / Int. J. Ind. Organ. 21 (2003) 625–653
Table 1Possible consequences of mergers
DP . 0 DP , 0
DS . 0 1 3Efficiency increase Market power reduction (?)
DS , 0 2 4Market power increase Efficiency decline
of managerial hubris, neither efficiency nor market power need change. We shall,however, hypothesize that these sorts of mergers lead to declines in efficiencybecause of the transaction costs of bringing two companies together. We thuspredict for mergers that decrease efficiency decreases in both profits and sales.
The various possible consequences of mergers are depicted in Table 1. Since allhorizontal mergers eliminate competition between the merging companies, anyhorizontal merger that meets our test for an increase in efficiency must do sobecause itsnet effect is to increase efficiency. The same can, of course, be said forthe other types of mergers. All of our tests are thus of the net effects of mergers. Inaddition to the three possible consequences already discussed, the table includes afourth—profits decline, but sales increase. Since this outcome is the mirror imageof cell 2, we have labeled it ‘Market power reduction,’ but the question markindicates our uncomfortableness with this categorization. No profit-maximizingmanager would undertake a merger because she wanted to increase the amount ofcompetition her firm faces. Sales increases coupled with profit declines might beobserved, if the managers were sales or growth maximizers. Thus, both themotivation behind and the consequences of mergers falling into cell 3 are moredifficult to identify than for the other three cells.
3 . Methodology
To determine whether a merger has increased profits or not, we must predictwhat the profits of the two merging firms would have been in the absence of themerger. Determining this counterfactual is one of the most difficult aspects inempirical investigations of the effects of mergers. Even if we observe a 20%increase in profits after a merger, it might be a failure because the two firms’profits would have increased by 40% had they not merged. Most studies that try toaddress the counterfactual problem do so by choosing a benchmark group of firmsand predicting that the performance of the merging firms would have followed thatof the benchmark group. In event studies the benchmark group is usually thecompanies in the market portfolio, in studies like ours that use accounting data, thebenchmark firms have been chosen from the same industry(ies) as that (those) of

K. Gugler et al. / Int. J. Ind. Organ. 21 (2003) 625–653 629
6the two merging firms. We adopt the same methodology and assume that themerging companies’ profits and sales would have changed in the same way as themedian firm’s profits and sales in their respective two-digit ISIC industries
7changed.We chose the two-digit level of aggregation as opposed, say, to the four-digit
level, because in many countries our samples of possible benchmark companieswere too small to be able to identify a nonmerging company for every four-digitindustry. Although a two-digit industry’s performance will track one of itsfour-digit industries with some error, we see no reason to expect a systematic biasfrom this choice of benchmark. Moreover, it has the possible advantage of notbeing contaminated by the merger itself, as would occur if the merger sys-tematically changed the sales or profits of all other firms in the merged company’sfour-digit industry(ies).
Consider first the problem of predicting the merging companies’ sales. Define:S as the sales of the acquiring company in yeart 1 n; S as the sales of theGt1n Dt
acquired company in yeart; S as the predicted sales of the combined companyCt1n
in yeart 1 n; S as the sales of the median firm in the industry of the acquiringIGt1n
company in yeart 1 n; andS as the sales of the median firm in the industry ofIDt1n
the acquired company in yeart 1 n.The predicted sales for the combined company in yeart 1 n is estimated as
follows:
S SIGt1n IDt1n]] ]]S 5 S 1 S (1)Ct1n Gt21 DtS SIGt21 IDt
The sales of the acquiring company are projected relative to its sales in the yearprior to the merger, the sales of the acquired company are projected relative to itssales in the year of the merger.
It often happens, of course, that companies make several acquisitions over shortspans of time. To allow for this possibility we amend Eq. (1) to take into accountmergers occurring after timet. If, for example, a firm made one acquisition intand another int 1 2, then the amended formula for predictingS would lookCt1n
like the following (for n > 2)
6See the studies in Mueller (1980a), McDougall and Round (1986), Ravenscraft and Scherer (1987),and Healy et al. (1992).
7Our control group excludes firms that made mergers in the periodt 2 1 to t 1 5, wheret is the yearof the merger. In the small fraction of cases where no control group was available for the respectiveindustry and country or country group, we take the median firm in the whole manufacturing/servicesector of the respective country /country group. We also tried using the firms at the first and thirdquartiles of the distribution of firm sizes rather than the median, and matching merging firms to thenearest quartile. This did not produce a substantive change in our findings, so we report only the one setof results.

630 K. Gugler et al. / Int. J. Ind. Organ. 21 (2003) 625–653
S S SIGt1n IDt1n IDt1n]] ]] ]]S 5 S 1 S 1 S (2)Ct1n Gt21 Dt Dt12S S SIGt21 IDt IDt12
Many firms both acquire and sell assets. We also need to account for the effectsof spin- and sell-offs on the merging companies’ sales. We do so by treating thesesales symmetrically to acquisitions. Namely, we subtract the sales of any part of acompany sold or spun-off during the 5 years after a merger, again scaling the salesof the spun-off unit by the changes in sales for the median firm in its industry.
If, for example, a firm made one acquisition in yeart, another in yeart 12 andspins or sells off a company in yeart 1 3, the final formula for predictingSCt1n
would then be (forn > 3)
S S S SIGt1n IDt1n IDt1n ISt1n]] ]] ]] ]]S 5 S 1 S 1 S 2 S (3)Ct1n Gt21 Dt Dt12 St13S S S SIGt21 IDt IDt12 ISt13
whereS denotes the sales spun or sold off by the acquiring company in yearSt13
t 1 3 and S is the sales of the median firm in the industry of the divestedISt1n8company in yeart 1 n.
Our methodology for determining the effects of mergers on sales is to comparethe predicted value for the merged company’s sales in yeart 1 n after adjusting forall mergers and spin-offs as obtained using Eq. (3) with the actual level of sales ofthis company.
Projecting the levels of profits is a little more difficult, because they can take onnegative and zero values. Taking ratios of profits at different points in time mayintroduce significant errors. We shall, therefore, use changes in the ratios of profitsto total assets to predict changes in the profits of the merging companies. Define:P as the profits of the acquiring company in yeart 1 n; P as the profits ofGt1n Dt
the acquired company in yeart; P as the predicted profits of the combinedCt1n
company in yeart 1 n; P as the profits of the median firm in the industry ofIGt1n
the acquiring company in yeart 1 n; P as the profits of the median firm in theIDt1n
industry of the acquired company in yeart 1 n; K as the assets of theGt1n
acquiring company in yeart 1 n; K as the assets of the acquired company in yearDt
t; K as the assets of the median firm in the industry of the acquiring companyIGt1n
in year t 1 n; and K as the assets of the median firm in the industry of theIDt1n
acquired company in yeart 1 n.We can now compute the projected change in the returns on the acquirer’s assets
from yeart 21 to t 1 n using again the changes observed for the median (in termsof profitability) company in its industry. Call this projected changeD .IGt21,t1n
8Two biases might occur: If sales data are missing on additional mergers fromt to t 1 5 weunderestimate projected sales, if sales data are missing on spin- or sell-offs fromt to t 15 weoverestimate projected sales. Additional mergers occur more often than divestitures, while divestituresare larger on average. Thus, the two biases potentially offset each other.
K. Gugler et al. / Int. J. Ind. Organ. 21 (2003) 625–653 631
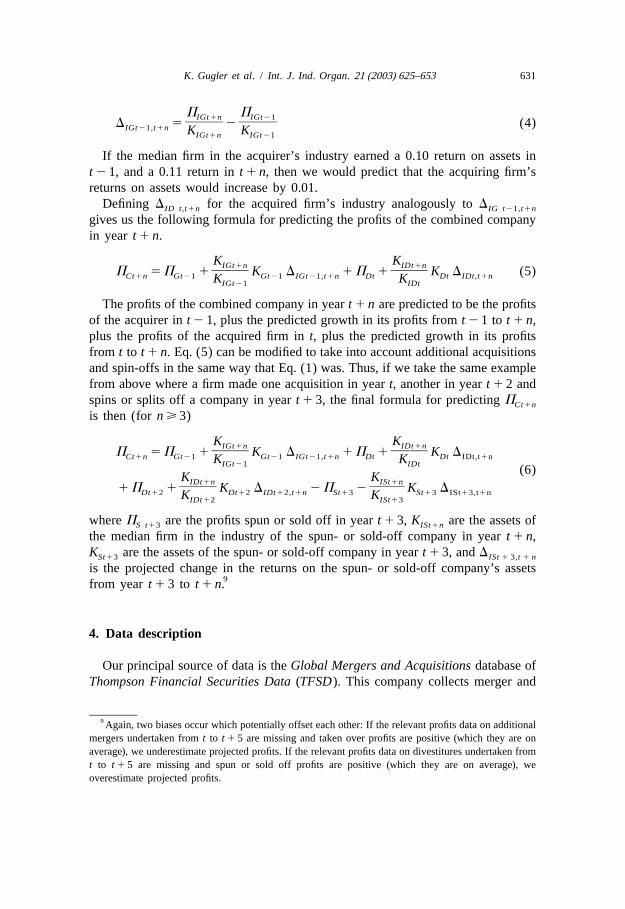
P PIGt1n IGt21]] ]]D 5 2 (4)IGt21,t1n K KIGt1n IGt21
If the median firm in the acquirer’s industry earned a 0.10 return on assets int 2 1, and a 0.11 return int 1 n, then we would predict that the acquiring firm’sreturns on assets would increase by 0.01.
Defining D for the acquired firm’s industry analogously toDID t,t1n IG t21,t1n
gives us the following formula for predicting the profits of the combined companyin year t 1 n.
K KIGt1n IDt1n]] ]]P 5P 1 K D 1P 1 K D (5)Ct1n Gt21 Gt21 IGt21,t1n Dt Dt IDt,t1nK KIGt21 IDt
The profits of the combined company in yeart 1 n are predicted to be the profitsof the acquirer int 21, plus the predicted growth in its profits fromt 21 to t 1 n,plus the profits of the acquired firm int, plus the predicted growth in its profitsfrom t to t 1 n. Eq. (5) can be modified to take into account additional acquisitionsand spin-offs in the same way that Eq. (1) was. Thus, if we take the same examplefrom above where a firm made one acquisition in yeart, another in yeart 1 2 andspins or splits off a company in yeart 1 3, the final formula for predictingPCt1n
is then (forn > 3)
K KIGt1n IDt1n]] ]]P 5P 1 K D 1P 1 K DCt1n Gt21 Gt21 IGt21,t1n Dt Dt IDt,t1nK KIGt21 IDt (6)K KIDt1n ISt1n
]] ]]1P 1 K D 2P 2 K DDt12 Dt12 IDt12,t1n St13 St13 ISt13,t1nK KIDt12 ISt13
whereP are the profits spun or sold off in yeart 1 3, K are the assets ofS t13 ISt1n
the median firm in the industry of the spun- or sold-off company in yeart 1 n,K are the assets of the spun- or sold-off company in yeart 1 3, andDSt13 ISt 1 3,t 1 n
is the projected change in the returns on the spun- or sold-off company’s assets9from year t 1 3 to t 1 n.
4 . Data description
Our principal source of data is theGlobal Mergers and Acquisitions database ofThompson Financial Securities Data (TFSD). This company collects merger and
9Again, two biases occur which potentially offset each other: If the relevant profits data on additionalmergers undertaken fromt to t 15 are missing and taken over profits are positive (which they are onaverage), we underestimate projected profits. If the relevant profits data on divestitures undertaken fromt to t 1 5 are missing and spun or sold off profits are positive (which they are on average), weoverestimate projected profits.

632 K. Gugler et al. / Int. J. Ind. Organ. 21 (2003) 625–653
spin-off data using a variety of sources such as financial newspapers, ReutersTextline, the Wall Street Journal, Dow Jones, etc. The database covers alltransactions valued at US$1 million or more. We define a merger as a transaction
10where more than 50% of the equity of a target firm is acquired. During the period1981 to 1998, there were 69 605 announcements of such mergers. Our data for theUnited States begin in the late 1970s, for all other countries in the mid-1980s. Fig.1 presents the total number of deals by completion year.
Table 2A summarizes the characteristics of completed mergers (see also Table2B). From the nearly 70 000 announced mergers across the world, nearly 45 000mergers were actually completed with almost half of these taking place in theUnited States. For the full sample, horizontal mergers make up 42% of all mergers,conglomerate mergers 54% and vertical mergers only 4%. To be defined as avertical merger at least 10% of the sales (purchases) of the primary four-digitindustry to which one of the merging companies belongs must go to (come from)the industry to which the other belongs. We use the 1992 input–output table for theUS economy to make this determination. Horizontal mergers are defined as
Fig. 1. The Number of Completed Mergers and Divestitures, 1981–1998. Source: SDC ThompsonFinancial Securities.
10Symmetrically we define a spin- or sell-off as a transaction where more than 50% of the equity aredisposed off. We use the term ‘divestitures’ interchangeably.

K. Gugler et al. / Int. J. Ind. Organ. 21 (2003) 625–653 633
Table 2ASummary statistics on mergers and acquisitions from around the world from 1981 to 1998
Period: Until 1990 1991/92 1993/94 1995/96 1997/98 Wholeperiod
United States of AmericaNumber of deals 8194 1965 2840 3782 4367 21 148Average deal value (Mn $) 238.2 102.8 137.6 217.0 408.7 246.7Cross border 3.4% 11.7% 13.9% 16.0% 16.7% 10.6%Horizontal 39.6% 47.4% 48.7% 49.3% 48.9% 45.2%Vertical 5.8% 4.9% 3.8% 2.8% 2.8% 4.3%Conglomerate 54.6% 47.7% 47.5% 47.9% 48.3% 50.5%
United KingdomNumber of deals 1,180 501 790 1138 1108 4717Average deal value (Mn $) 217.3 113.1 60.6 135.0 212.1 158.3Cross border 35.0% 30.3% 26.8% 27.4% 29.0% 29.9%Horizontal 31.6% 35.9% 34.7% 37.8% 41.2% 36.3%Vertical 4.7% 5.0% 3.5% 4.3% 3.6% 4.2%Conglomerate 63.7% 59.1% 61.8% 57.9% 55.2% 59.5%
Continental EuropeNumber of deals 986 2125 1996 2359 2129 9595Average deal value (Mn $) 393.4 186.1 159.2 220.4 414.1 285.9Cross border 53.8% 24.2% 26.6% 33.3% 39.8% 33.5%Horizontal 37.0% 43.8% 37.5% 35.8% 39.6% 38.9%Vertical 4.8% 3.5% 3.3% 3.2% 3.4% 3.5%Conglomerate 58.2% 52.7% 59.2% 61.0% 57.0% 57.6%
JapanNumber of deals 172 88 61 151 174 646Average deal value (Mn $) 513.2 456.0 198.1 783.3 169.4 464.9Cross border 80.8% 72.4% 59.0% 34.4% 28.2% 52.6%Horizontal 33.7% 29.5% 36.1% 35.1% 42.0% 35.9%Vertical 4.7% 0.0% 3.2% 2.0% 4.0% 3.1%Conglomerate 61.6% 70.5% 60.7% 62.9% 54.0% 61.0%
Australia /New Zealand /CanadaNumber of deals 671 425 549 766 821 3232Average deal value (Mn $) 354.6 68.5 61.6 118.8 142.5 156.0Cross border 37.9% 22.6% 32.4% 27.7% 27.9% 30.0%Horizontal 43.8% 43.3% 47.5% 40.1% 44.6% 43.7%Vertical 4.8% 1.9% 3.7% 3.1% 3.4% 3.5%Conglomerate 51.4% 54.8% 48.8% 56.8% 52.0% 52.8%
Rest of the WorldNumber of deals 371 553 831 1728 1779 5262Average deal value (Mn $) 276.2 150.0 87.5 101.9 143.3 128.3Cross border 49.6% 25.7% 32.8% 25.0% 26.5% 28.5%Horizontal 34.8% 36.2% 34.7% 36.7% 40.1% 37.3%Vertical 6.4% 4.3% 2.7% 3.2% 3.5% 3.6%Conglomerate 58.8% 59.5% 62.6% 60.1% 56.4% 59.1%

634 K. Gugler et al. / Int. J. Ind. Organ. 21 (2003) 625–653
Table 2A. Continued
Period: Until 1990 1991/92 1993/94 1995/96 1997/98 Wholeperiod
All MergersNumber of deals 11 574 5657 7067 9924 10 378 44 600Average deal value (Mn $) 256.5 129.3 114.7 181.9 313.4 220.0Cross border 15.5% 21.2% 23.0% 24.2% 25.5% 21.7%Horizontal 38.6% 43.4% 42.1% 41.7% 44.2% 41.7%Vertical 5.5% 4.0% 3.5% 3.1% 3.2% 4.0%Conglomerate 55.9% 52.6% 54.4% 55.2% 52.6% 54.3%
The database is theGlobal Mergers and Acquisition database ofThompson Financial Securities. Itcovers all transactions with a value of at least US $1 million.Continental Europe includes Austria,Belgium, Germany, Denmark, Spain, Finland, France, Greece, Ireland, Italy, Luxembourg, TheNetherlands, Norway, Sweden, Portugal, Switzerland and Island. TheRest of the World sampleincludes more than 100 other countries.Deal value is defined as the total consideration paid by theacquirer excluding fees and expenses. The dollar value (deflated by the US-CPI with base year 1995)includes the amount paid for all common stock, common stock equivalents, preferred stock, debt,options, assets, warrants and stake purchases made within 6 months of the announcement date of thetransaction. Liabilities assumed are included in the value if they are publicly disclosed. If a portion ofthe consideration paid by the acquirer is common stock, the stock is valued using the closing price onthe last full trading day prior to the announcement of the terms of the stock swap.Cross-bordermergers are mergers where the acquiring and acquired companies stem from different nations.Horizontal mergers are defined as mergers between two companies with sales in the same primaryfour-digit SIC industry.Vertical mergers are mergers where at least 10% of the sales (purchases) of theprimary four-digit industry to which one of the companies belongs must go to (come from) the industryto which the other belongs. We use the 1992 US input–output table.Conglomerate mergers consist ofall mergers which are neither horizontal nor vertical.
Table 2BCharacteristics of acquiring and target companies
Number Sales Profits Profit rateof Obs.
Acquirer Target Acquirer Target Acquirer TargetMn $ Mn $ Mn $ Mn $
United States of America 1967 1997.5 318.0 102.26 9.78 0.029 0.019United Kingdom 379 2162.1 329.7 110.53 10.89 0.066 0.039Continental Europe 172 4644.2 729.6 169.86 24.58 0.035 0.033Japan 16 4349.1 876.1 165.10 26.47 0.011 0.030Australia /N.Zealand/Canada 172 1940.8 391.9 93.45 15.53 0.024 0.027Rest of the World 47 2132.4 443.0 157.64 22.88 0.052 0.013All mergers 2753 2198.0 355.3 108.25 11.53 0.034 0.023
The sample includes those mergers where we have all the relevant data for yeart. Sales are averagesales in million 1995 USD, profits are average profits before interest and taxes in million 1995 USD.The profit rate is profits before interest and taxes divided by total assets.

K. Gugler et al. / Int. J. Ind. Organ. 21 (2003) 625–653 635
mergers between two companies with sales in the same primary four-digitindustry. Conglomerate mergers consist of all mergers which are neither horizontalnor vertical. It is interesting to note that a greater fraction of mergers in the UnitedStates appears to be horizontal than for any other area/country category. Despitethe step-up in antitrust enforcement under the Clinton Administration, a greaterfraction of mergers between 1993 and 1998 was horizontal in nature than frombefore 1990. In some years the proportion is nearly 50%. Roughly one-fifth of themergers are cross-border transactions (22%). An upward trend in cross-bordermergers is apparent in Table 2, and is confirmed by a regression of the fraction ofmergers in a country which are cross-border on time. The upward trend isparticularly pronounced for EU countries, which may reflect the greater integration
11of EU economies over the 1990s as a result of the Single Market Program.Japanese companies undertake relatively few mergers compared to other countries,with a much higher fraction of these (53%) being cross-border deals. To arrive atcomparable real values, we first convert all variables to USD and deflate by theUS-Consumer Price Index with base year 1995. Thus, the average deal value was
12220 million 1995-USD.The samples used for our analysis are much smaller than the numbers in Table
2A,B suggest due to missing data for relevant variables. Acquiring companybalance sheet and market data for the yearst 21 to t 15 relative to the mergeryear t stem from theGlobal Vantage /Compustat database. Out of the 45 000completed mergers of Table 2 we could match 17 863 to one of these databases.Some acquiring companies acquire more than one target in a given year, and sinceour balance sheet information for acquiring companies is on a yearly basis, weaggregate the relevant variables of these targets. This further reduces the merger
13sample to 14 269 merger years.
11Call CB the fraction of mergers in a country which are cross-border mergers,Y the year in whichthe mergers took place, andY2EU an interaction betweenY and a 1/0 dummy for whether the countrywas an EU-member or not. A regression using data for the 1990s yielded the following results(t-statistics under the coefficients):
2CB5 0.251 0.008Y 1 0.007Y 2EU, R 5 0.067.33 1.65 2.30
The upward time trend for EU countries was almost twice that for all other countries, a difference thatwas significant at the 1% level. (We did not include data for the 1980s in the regression, since our datafrom before 1990 for countries other than the USA contain a disproportionate fraction of large, andtherefore also cross-border mergers.)
12A table summarizing the characteristics of divestitures is available upon request. In short, ourdatabase covers 9659 completed divestitures worldwide from 1981 to 1998, 31.4% of these werecross-border deals, 37.0% horizontal, 4.3% vertical, and 58.7% conglomerate. The average deal valuewas $181 million.
13We could match 6616 divestitures to these databases aggregated to 4666 divestiture years.

636 K. Gugler et al. / Int. J. Ind. Organ. 21 (2003) 625–653
Table 3AEffects of mergers for full sample
Years after Number of Difference in Profits Difference in Salesthe merger observations Mn $ Mn $
p-value % Positive p-value % Positive
t 11 2704 5.91 0.062 57.0 2214.16 0.000 51.5t 12 2274 11.11 0.009 57.2 2382.81 0.000 49.5t 13 1827 10.79 0.056 54.8 2549.59 0.000 46.4t 14 1517 19.68 0.007 57.8 2633.46 0.000 46.3t 15 1250 17.81 0.046 57.6 2714.04 0.000 44.6
On average, acquiring firms are present over a time period of 15 years in ourdatabases. During this period acquiring firms make 2.25 acquisitions and divest0.83 companies on average. Missing data and the elimination of outliers (we dropthe left and right 1% tail of the distribution) reduces the sample to the numbers
14reported in Table 3A. We have attempted to make our samples as large aspossible and thus do not limit ourselves to balanced panels, companies makingonly one merger or the like.
Table 2B presents means of the distributions of sales, profits and profit to assetsratios for the acquired and acquiring companies in our sample. Profits aremeasured before interest and taxes (COMPUSTAT item 18), net sales are item 12,and total assets are item 6. Again all variables are deflated by the Consumer PriceIndex with base year 1995.
On average the acquired companies are just 16% of the size of the companieswhich buy them and make only around a tenth of the profits. In the United States,the United Kingdom and Continental Europe the acquired firms are less profitablethan their buyers, in Japan, Australia, Canada, and New Zealand they are moreprofitable. In the rest-of-the-world subsample, the acquired companies are much
15less profitable than their buyers.
5 . Overall results
5 .1. Full sample
In this section we present the main results for our full sample and for differentsubsets of mergers to see whether mergers on average have increased profits andsales or reduced them. In the following section we look more closely at themergers that have increased profitability to see whether the changes appear to bedue to increases in efficiency or market power.
14In Tables 3–9 we drop the left and right 1% of the distribution in each (sub)sample.15Summary statistics on divestitures (available upon request) reveal that divested units are larger and
less profitable than acquired firms.

K. Gugler et al. / Int. J. Ind. Organ. 21 (2003) 625–653 637
Table 3A presents our findings for the full sample of companies. The size of thesample declines as we move away from the date of the merger because companies
16disappear from the data set. The profitability numbers consist of the difference inyear t 1 n between the actual profits of the combined firm and its projected profitsin this year. Thus a negative number implies a decline in profits. The meandifference between actual and projected profitability is positive in all 5 years afterthe mergers, and is significant in every year at the 10% level, or better. The $17.8million constitutes a difference between actual and projected profits of 8.2 (0.20)%of the profits (assets) of the average acquirer in the sample in yeart 1 5.
The results for sales are again the difference between the actual and projectedvalues for the combined companies. The mean difference in sales is negative inevery year and continuously increases in absolute value through year 5. Five yearsafter the mergers, the average acquiring firm had sales that were $714 millionlower than their projected value. This constitutes a difference between actual andprojected sales of 14.5% of the sales of the average acquirer in the sample in yeart 1 5. The last column in each set of results gives the fraction of the sample forwhich the change was positive. While a majority of mergers led to higher actualprofits than those predicted, the reverse was true for sales.
5 .2. Results by country
Table 3B reports the comparable figures by country or country group. TheUnited States makes up a substantial fraction of the overall sample and so it is notsurprising to find the pattern of results for it resembling that of the full sample asjust discussed. Profits are higher than predicted in every post-merger year,although only three of the five differences are significant at the 10% level for theUS. Actual sales are significantly less than predicted in every post-merger year. Inpercentage terms we predict that mergers increase profits by 8.1% (0.17%) of theprofits (assets) of the average acquirer in the USA and decrease sales by 14.8% 5years after the merger.
Essentially the same pattern can also be observed for the United Kingdom.Actual profits are greater than projected profits in all 5 years, although thedifference is statistically significant in only the first post-merger year. Actual salesfall short of their projected values in all 5 years after the mergers, with all of thedeclines significant at conventional levels.
The pattern of results for Continental Europe is very similar to that for the USAand UK. The differences between actual and projected profitability are all positive,but the only significant difference is for the fourth post-merger year. Sales fall
16Remember our last year is 1998, thus mergers having taken place in 1993 are the last mergers forwhich we have data until yeart 15, mergers having taken place in 1994 are in our sample only up toyear t 14, mergers of year 1995 up to yeart 1 3 and so on.

638 K. Gugler et al. / Int. J. Ind. Organ. 21 (2003) 625–653
Table 3BEffects of mergers by country /country groupings
Years Number of Profits Salesafter the observations
Difference p-value % Difference p-value %merger
in Mn $ Positive in Mn $ Positive
United States of Americat 11 1950 3.735 0.307 57.0 2174.495 0.000 52.8t 12 1641 12.457 0.013 58.1 2324.825 0.000 49.8t 13 1272 10.490 0.133 55.6 2524.798 0.000 46.6t 14 1067 16.654 0.054 57.9 2595.367 0.000 45.5t 15 889 17.388 0.098 58.7 2730.236 0.000 44.3
United Kingdomt 11 362 15.440 0.061 65.7 2263.828 0.001 48.6t 12 322 14.902 0.135 59.3 2445.977 0.000 48.9t 13 297 12.545 0.287 52.2 2468.442 0.002 45.4t 14 233 4.729 0.777 55.8 2380.410 0.050 47.0t 15 181 24.149 0.201 53.6 2545.682 0.043 43.5
Continental Europet 11 178 18.831 0.233 53.9 2568.403 0.001 47.3t 12 140 16.015 0.462 55.7 21106.104 0.000 46.2t 13 122 19.191 0.457 53.3 2972.056 0.006 47.9t 14 108 81.284 0.016 60.2 21461.227 0.002 48.5t 15 87 42.345 0.361 58.6 2666.390 0.272 54.2
Japant 11 20 236.826 0.342 35.0 2238.893 0.652 61.1t 12 19 263.507 0.276 21.1 378.774 0.474 56.3t 13 19 18.149 0.660 42.1 396.802 0.284 52.9t 14 16 4.031 0.934 43.8 270.744 0.900 56.3t 15 15 241.621 0.740 73.3 22328.611 0.187 46.2
Australia /New Zealand/Canadat 11 165 23.275 0.801 45.5 2175.353 0.130 47.9t 12 129 227.001 0.093 45.6 2357.068 0.087 51.2t 13 101 29.984 0.640 55.4 2686.854 0.014 44.6t 14 79 5.862 0.858 54.3 2962.244 0.016 48.1t 15 66 233.577 0.308 47.0 2805.393 0.121 39.4
Rest of the worldt 11 42 26.539 0.296 51.2 2346.740 0.106 45.2t 12 35 71.808 0.086 61.8 2237.196 0.174 42.9t 13 25 44.931 0.377 65.2 2880.127 0.018 40.0t 14 22 93.866 0.153 89.5 2577.552 0.223 50.0t 15 15 115.937 0.250 64.3 2281.547 0.390 46.7
‘Difference in Mn $’ is the difference between actual and projected profits or sales as obtained byEqs. (3) and (6) in 1995 million USD. A positive number therefore implies that the merger increasedprofits or sales, a negative number implies that the merger decreased profits or sales. ‘p-value’ is theprobability that the observed differences are zero (two-sided test). ‘% Positive’ is the percentage ofpositive differences between actual and projected values.

K. Gugler et al. / Int. J. Ind. Organ. 21 (2003) 625–653 639
short of their projected values in every year and four of the five differences arestatistically significant at the 5% level.
The results for Japan are somewhat different than those already discussed. Threeof the five profit comparisons are negative, while sales are greater than predictedfor the first time in two of the five post-merger years. Our sample for Japan isquite small, however, and none of the differences is statistically significant.
The results for Australia, New Zealand and Canada resemble those for the US,UK and Continental Europe in so far as actual sales fall short of predicted sales inall five post-merger years with three of the short falls being significant at the 10%level or better. The post-merger profit differences are also generally insignificant,as was the case for the UK and Western Europe, although in the case of Australia,New Zealand and Canada the post-merger profits of the merging firms tend to beless than those predicted for them, and one of these differences is significant at the10% level.
The pattern of results for the remaining countries also resembles that for the US,UK and Continental Europe. Profit differences are positive in all 5 years, but areusually insignificantly different from zero. Sales differences are again consistentlynegative, although only one of these is statistically significant
Thus, the results by country and country group tend by and large to resembleone another. Differences between actual and projected profits tend to be positivebut often are not significantly different from zero. Differences between actual andprojected sales tend to be negative and often significantly so.
The lack of significant differences in results across countries can be furtherillustrated through an analysis of variance. Table 4 reports the results from aregression of the differences between actual and projected profits and sales oncountry category dummies for yeart 1 5. An intercept has been included and the
Table 4Analysis of variance in yeart 1 5 by country categories
Country /country group Profits Sales
Difference t-value Difference t-valuein Mn $ in Mn $
Average 17.8 2.00 2714.0 6.63USA 20.4 0.33 216.2 0.70UK 6.3 0.38 168.3 1.13Continental Europe 24.5 0.37 47.6 0.55Japan 259.4 0.85 21615.0 1.83Aus/NZ/Can 251.4 1.32 291.4 0.45Rest of the world 98.1 1.26 432.5 0.63
2AdjustedR 20.0006 0.0003Number of observations 1250 1250
‘Average’ denotes the overall average value of the difference of actual and projected profits or sales.All other coefficients are differences from this average.

640 K. Gugler et al. / Int. J. Ind. Organ. 21 (2003) 625–653
country dummies constrained to sum to zero, so that the coefficient on a countrydummy represents the difference between its mean and that for the full sample(Suits, 1984).
For the full sample, the mean difference between actual and predicted profits inyear t 15 is positive and significant at the 5% level. No country category’s meanis significantly different from that of the full sample. The mean difference betweenactual and predicted sales is negative and significant at the 1% level. All countrymeans are insignificantly different from the sample mean except for Japan, whosemean difference in sales is significantly less than the sample mean, although onlyat the 10% level.
5 .3. Results by sector and type of merger
In Table 5A,B we have separated mergers into the manufacturing and servicesectors, and then within these divided them into horizontal, vertical and conglom-erate mergers. Mergers in the manufacturing sector tend to be less profitable thanin the service sector. All 15 entries in the service sector are positive, while six ofthe 15 are negative in the manufacturing sector. The differences between actualand predicted sales are uniformly negative except for vertical mergers in theservice sector, where two of the differences are positive.
Table 6 presents the results for an analysis of variance conducted in much thesame way as in Table 4. Coefficients on the merger categories representdifferences from the intercept. In yeart 1 5, horizontal mergers in manufacturingare significantly more profitable than the average merger in manufacturing, whichhad a near zero difference between its actual and projected values (Panel A).Vertical mergers in manufacturing are significantly (at the 10% level) lessprofitable, on the other hand. In contrast, all three categories of mergers areequally profitable in the service sector (Panel B). The difference between actualand projected profits for the average merger in the service sector is significantly
17higher than for the average merger in manufacturing.Although actual sales fall short of predicted sales in all three categories for the
manufacturing sector, the shortfall is significantly smaller for horizontal mergers.Thus, within the manufacturing sector, horizontal mergers appear to be con-siderably more successful than conglomerate and vertical mergers with respect totheir effect on both profits and sales.
Within the service sector, vertical mergers exhibit the best performance in termsof sales, although the small number of vertical mergers makes the differencestatistically insignificant. Horizontal mergers still produce smaller shortfallsbetween actual and projected sales than do conglomerate mergers.
Thus, we conclude that mergers in the service sector are generally moresuccessful than those in manufacturing, at least as far as their effects on
17Test results are available from the authors upon request.

K. Gugler et al. / Int. J. Ind. Organ. 21 (2003) 625–653 641
Table 5Effects of mergers by sector
Years after Number of Profits Salesafter the observations
Difference p-value % Difference p-value %merger
in Mn $ Positive in Mn $ Positive
Panel A. Effects of mergers in the manufacturing sector by category
Horizontal mergerst 11 411 28.006 0.370 51.3 2180.323 0.002 47.1t 12 352 3.130 0.761 57.1 2288.936 0.000 44.9t 13 274 15.924 0.252 56.9 2466.510 0.001 48.2t 14 233 41.933 0.007 60.5 2467.476 0.002 46.6t 15 193 41.751 0.017 56.5 2195.891 0.268 43.2
Vertical mergerst 11 66 31.234 0.270 55.4 284.619 0.637 53.0t 12 53 211.697 0.702 42.6 242.079 0.897 49.1t 13 47 252.549 0.112 38.3 2397.957 0.343 46.8t 14 43 271.252 0.231 43.2 2773.660 0.152 55.8t 15 34 288.254 0.340 51.4 2989.052 0.188 50.0
Conglomerate mergerst 11 877 8.133 0.175 55.8 2411.540 0.000 45.5t 12 761 12.253 0.115 54.5 2605.256 0.000 44.3t 13 641 7.833 0.409 52.3 2768.647 0.000 42.0t 14 541 8.567 0.494 52.7 2735.062 0.000 42.6t 15 475 25.879 0.674 52.4 2824.688 0.000 42.9
Panel B. Effects of mergers in services by category
Horizontal mergerst 11 775 12.177 0.017 60.0 244.617 0.369 61.7t 12 624 14.211 0.093 59.5 2189.847 0.009 59.8t 13 470 5.772 0.627 55.5 2316.710 0.004 52.1t 14 368 22.877 0.088 63.1 2492.849 0.001 50.0t 15 287 39.167 0.038 65.7 2545.498 0.007 52.3
Vertical mergerst 11 22 23.377 0.248 50.0 2234.462 0.399 45.5t 12 19 9.967 0.543 52.6 211.693 0.919 42.1t 13 17 38.608 0.031 64.7 48.534 0.929 41.2t 14 15 11.566 0.781 73.3 2376.665 0.338 50.0t 15 8 104.254 0.013 100.0 933.507 0.588 50.0
Conglomerate mergerst 11 550 0.716 0.914 59.8 2178.648 0.016 50.7t 12 465 14.446 0.095 60.6 2406.578 0.001 48.4t 13 374 26.555 0.034 59.1 2584.358 0.000 46.0t 14 309 33.924 0.059 59.9 2735.722 0.000 47.2t 15 247 36.059 0.100 59.5 21112.637 0.000 40.1
The manufacturing sector includes all firms with SIC codes smaller than 4000, theservice sectorincludes those firms with SIC codes greater than or equal to 4000. See also the note to Table 3.

642 K. Gugler et al. / Int. J. Ind. Organ. 21 (2003) 625–653
Table 6
Category Profits Sales
Difference t-value Difference t-valuein Mn $ in Mn $
Panel A. Analysis of variance in year t1 5 in the manufacturing sector by merger categoriesAverage 3.1 0.27 2660.0 5.19Horizontal 38.7 2.07 464.1 2.25Vertical 291.4 1.82 2329.1 0.59Conglomerate 29.0 1.13 2164.7 1.87
2AdjustedR 0.0066 0.0045Number of observations 702 702
Panel B. Analysis of variance in year t1 5 in services by merger categoriesAverage 38.7 2.75 2782.1 4.87Horizontal 0.5 0.03 236.6 1.56Vertical 65.5 0.57 1715.6 1.31Conglomerate 2.6 0.17 2330.5 1.88
2AdjustedR 20.0031 0.0051Number of observations 542 542
‘Average’ denotes the overall average value of the difference of actual and projected profits or sales.All other coefficients are differences from this average. See also the note to Table 5.
profitability are concerned, and that horizontal mergers have more favorableeffects on sales than do conglomerate mergers in both sectors, and on profits in
18manufacturing.
5 .4. The effects of cross-border mergers
Table 7 breaks the sample into cross-border and domestic mergers. We have atmost 429 observations on cross-border mergers, and so the results for domesticmergers look a lot like those for the full sample. The same can more or less be saidfor the cross-border mergers. Mean differences between actual and projectedprofits are positive in all five post-merger years, but are significantly different fromzero in only one of them. Mean differences between actual and projected sales arenegative and significant in all five post-merger years. We tested for differences inthe effects of cross-border mergers that were related to the origin of either theacquiring or target company, but did not find any significant differences. Cross-border acquisitions by (of) UK companies did not generate significantly larger
18We also tested for significant differences in the effects of mergers depending on the industry of theacquiring companies. Almost no significant differences were found. The most interesting exceptionswere for the chemicals and insurance industries. Mergers in these industries were followed by profitincreases significantly above the sample mean, and sales declines below the mean. The patterns ofprofits and sales changes following mergers in the chemicals and insurance industries strongly resemblethose that we associate with market power increases.

K. Gugler et al. / Int. J. Ind. Organ. 21 (2003) 625–653 643
Table 7Effects of domestic and cross-border mergers
Years Number of Profits Salesafter the observations
Difference p-value % Difference p-value %merger
in Mn. $ Positive in Mn. $ Positive
Cross-border mergerst 11 429 16.136 0.121 58.3 2385.824 0.000 48.1t 12 336 15.727 0.170 58.3 2555.023 0.000 47.3t 13 286 3.886 0.803 53.8 2871.451 0.000 44.9t 14 236 37.202 0.050 66.1 2785.575 0.002 47.0t 15 183 41.826 0.132 62.8 2867.729 0.022 46.2
Domestic mergerst 11 2288 3.986 0.214 56.8 2182.953 0.000 52.1t 12 1940 10.305 0.025 57.0 2353.158 0.000 49.9t 13 1544 12.067 0.046 55.0 2490.591 0.000 46.6t 14 1281 16.454 0.036 56.3 2605.429 0.000 46.1t 15 1064 13.689 0.141 56.7 2687.170 0.000 44.4
See the note to Table 3.
changes in sales and profits than was true for other cross-border acquisitions, andthe same was true for all other countries.
6 . Results: market power and efficiency
Mergers that increase the efficiency of the merging firms should increase boththeir profits and their sales. Mergers that increase market power should increaseprofits and reduce sales. A merger which reduces efficiency should reduce bothprofitability and sales. In this section we attempt to increase our understanding ofthe causes and effects of mergers, by dividing our sample into subsets of mergersthat either increase or reduce profitability.
Panel A1 of Table 8 reports the results for all mergers for which post-mergerprofitability changes are greater than those of the matching industries, while PanelA2 reports the figures for the mergers that reduced profitability relative to thecontrol group. The mean difference between actual and projected sales is negativeand significant in every post-merger year. The difference between actual andprojected profits in yeart 1 5 is more than $150 million for profitable mergers, adifference of 70.0% (1.70%) of the actual profits (assets) of the average acquirer inthe sample in yeart 15. The difference between actual and projected sales int 1 5is $2475 million, 29.6% of the sales of the average acquirer int 15. This is thepattern we expect for mergers that increase market power, and thus we concludethat theaverage profitable merger in our sample would appear to have increasedmarket power.

644 K. Gugler et al. / Int. J. Ind. Organ. 21 (2003) 625–653
Table 8Tests for efficiency and market power effects
Years Number of Profits Sales p-valueafter the observations
Difference Differencemerger
in Mn. $ in Mn. $
Panel A1. Mergers with profits changes above zerot 1 1 1512 76.129 292.148 0.013t 1 2 1276 97.129 2247.630 0.000t 1 3 981 117.517 2328.543 0.000t 1 4 857 140.957 2399.243 0.000t 1 5 706 152.181 2475.338 0.000
Panel A2. Mergers with profits changes below zerot 1 1 1192 283.419 2368.936 0.000t 1 2 998 299.076 2555.640 0.000t 1 3 846 2113.522 2805.902 0.000t 1 4 660 2139.492 2937.575 0.000t 1 5 544 2157.147 21023.821 0.000
Panel B1. Mergers with profits changes in top quartilet 1 1 661 160.825 2191.652 0.017t 1 2 557 205.372 2554.697 0.000t 1 3 447 240.393 2600.628 0.000t 1 4 368 299.393 2821.384 0.000t 1 5 305 323.198 2817.953 0.004
Panel B2. Mergers with profits changes in lower quartilet 1 1 664 2144.851 2666.086 0.000t 1 2 558 2171.933 2903.308 0.000t 1 3 450 2205.304 21424.606 0.000t 1 4 377 2239.140 21501.687 0.000t 1 5 308 2269.075 21631.660 0.000
Panel C. Horizontal mergers with profits changes above zerot 1 1 664 70.810 220.014 0.684t 1 2 558 91.082 2157.492 0.048t 1 3 410 113.251 2249.082 0.030t 1 4 367 125.995 2252.037 0.058t 1 5 294 148.933 2238.859 0.183
Panel D. Vertical mergers with profits changes above zerot 1 1 47 132.926 2192.295 0.451t 1 2 33 115.225 174.208 0.641t 1 3 29 84.576 287.980 0.499t 1 4 28 137.429 153.551 0.705t 1 5 25 161.787 710.515 0.240
Panel E. Conglomerate mergers with profits changes above zerot 1 1 796 77.713 2146.062 0.008t 1 2 680 101.754 2344.146 0.000t 1 3 539 122.894 2424.531 0.000t 1 4 457 153.935 2551.364 0.001t 1 5 384 154.530 2735.240 0.000

K. Gugler et al. / Int. J. Ind. Organ. 21 (2003) 625–653 645
Table 8. Continued
Years Number of Profits Sales p-valueafter the observations
Difference Differencemerger
in Mn. $ in Mn. $
Panel F. Horizontal mergers with profits changes below zerot 1 1 519 279.689 2182.776 0.002t 1 2 416 297.804 2316.613 0.000t 1 3 334 2116.183 2522.617 0.000t 1 4 235 2117.672 2843.660 0.000t 1 5 185 2130.796 2669.969 0.003
Panel G. Vertical mergers with profits changes below zerot 1 1 41 287.076 241.590 0.770t 1 2 39 2106.117 2210.288 0.504t 1 3 35 2121.891 2749.439 0.140t 1 4 29 2244.293 21477.246 0.038t 1 5 17 2380.079 22583.682 0.065
Panel H. Conglomerate mergers with profits changes below zerot 1 1 627 286.521 2544.284 0.000t 1 2 539 299.820 2763.271 0.000t 1 3 471 2111.278 21016.108 0.000t 1 4 392 2144.490 2949.741 0.000t 1 5 336 2160.265 21138.591 0.000
Not surprisingly, actual sales for companies undertaking unprofitable mergers(Panel A2) fall way below their projected values. We predict that had the acquiringfirms not undertaken these mergers they would have had 72.3% more profits and20.8% more sales than they actually had in yeart 1 5. These mergers areunsuccessful in both dimensions and imply that they lowered efficiency.
In Panel B1 of Table 8 the results are reported for the highest quartile ofmergers ranked by the difference between actual and projected profits. The averageprofit changes are roughly three times as large as those in Panel A1. Mean actualsales continue to fall short of their projected values in every year after the mergers.All sales comparisons are highly significant. In Panel B2 of Table 8 the results arereported for the lowest quartile of mergers ranked by changes in profits. Thesemergers appear as unmitigated disasters.
Panels C, D and E in Table 8 divide mergers with changes in profitability abovethe matching industries into the horizontal, vertical and conglomerate categories.The first thing to note is that all three categories of successful mergers exhibitroughly similar increases in profitability. The mean differences between actual andprojected profits tend to get larger as one moves away from the mergers, and fallroughly in a range from $150 to $160 million in yeart 1 5.
The mean differences between actual and projected sales for companiesundertaking profitable horizontal and conglomerate mergers are negative in all 5

646 K. Gugler et al. / Int. J. Ind. Organ. 21 (2003) 625–653
years following the mergers. Thus, the average merger falling in both categoriesappears to result in an increase in market power. In contrast the mean differencebetween actual and projected sales for firms undertaking vertical mergers isnegative only in year one. Although none of the other four entries is statisticallysignificant, the results for profitable vertical mergers areweakly consistent withtheir increasing efficiency.
Panels F, G and H in Table 8 parallel C, D and E for mergers that loweredprofitability. All 15 post-merger sales comparisons are negative, with all differ-ences for horizontal and conglomerate mergers being statistically significant, aswere two for vertical mergers. The average unprofitable merger fits the pattern weanticipate for efficiency reducing mergers regardless of what type of merger it is.
One might expect mergers between small firms to be more likely to increaseefficiency by creating economies of scale and scope, while mergers between largefirms would be more likely to increase market power. These conjectures wouldlead us to expect sales increases following profitable mergers between smallcompanies, and sales decreases following profitable mergers between largecompanies. Our final test for the effects of mergers splits our sample into small
19and large acquirers, and profitable and unprofitable mergers.The results of these tests are reported in Table 9. The mean differences between
actual and projected sales are positive and significant in all five post-merger yearsfor the small firms making profitable mergers (Panel A). These differences suggestthat profitable mergers of small firms increase sales by around $150 million or25.0% relative to the average small acquirer’s size in yeart 1 5, while profitsnearly double. This pattern accords with our prediction for efficiency enhancingmergers and is the first time that actual sales have exceeded their projected valueson average in each of the five post-merger years. These results strongly suggestthat these mergers increased the efficiency of the merging firms.
In contrast mean differences between actual and projected sales are negative andsignificant in all five post-merger years for the large firms making profitablemergers. These differences suggest that profitable mergers of large firms decreasesales by around $1 billion or 10.7% relative to the average large acquirer’s size inyear t 1 5, while the change in profits is 60.7% of the profits of the average largeacquirer int 1 5. These differences accord with our prediction for market powerenhancing mergers. The average profitable merger among small firms appears toincrease their efficiency, the average profitable merger by a large firm appears toincrease its market power.
The results of Panel B of Table 9 are for the firms, which undertook unprofitable
19The full sample was first divided into ‘small’ and ‘large’ companies using the median sales ofacquiring firms in yeart 2 1 as the dividing line. These two samples were then subdivided on the basisof whether profits were greater or less than their projected values. ‘Large’ firms have average sales(profits) of $5713 (264) million and ‘small’ firms have average sales (profits) of $341 (18.1) million inyeart 2 1. The average deal value of transactions involving ‘large’ acquirers is $667 million, while theaverage deal value involving ‘small’ acquirers is $103 million.

K. Gugler et al. / Int. J. Ind. Organ. 21 (2003) 625–653 647
Table 9
Years Number of Profits Sales p-valueafter the observations
Difference Differencemerger
in Mn. $ in Mn. $
Panel A. Mergers with profits changes above zero by size
I. Small Firmst 1 1 766 20.440 54.953 0.000t 1 2 642 27.947 72.190 0.000t 1 3 476 36.465 83.328 0.001t 1 4 418 40.155 129.245 0.000t 1 5 349 47.001 148.724 0.002
II. Large Firmst 1 1 746 133.310 2243.194 0.001t 1 2 634 167.294 2571.486 0.000t 1 3 505 193.925 2716.762 0.000t 1 4 439 236.070 2902.450 0.000t 1 5 357 255.298 21085.415 0.000
Panel B. Mergers with profits changes below zero by size
I. Small Firmst 1 1 610 228.854 259.829 0.001t 1 2 514 230.951 288.808 0.000t 1 3 453 243.943 2128.520 0.009t 1 4 356 255.022 2105.590 0.004t 1 5 288 253.384 265.567 0.215
II. Large Firmst 1 1 582 2140.806 2692.914 0.000t 1 2 484 2171.866 21051.408 0.000t 1 3 393 2194.135 21586.702 0.000t 1 4 304 2239.117 21911.873 0.000t 1 5 256 2274.339 22101.856 0.000
The full sample was first divided into ‘small’ and ‘large’ companies using the sales median ofacquiring firms in yeart 2 1 as the dividing line. These two samples were then subdivided on the basisof whether profits were greater or less than their projected values.
mergers. Here we see consistent declines in post-merger sales for both size classes.Unprofitable mergers by both small and large companies tend to be the result ofreduced economic efficiency.
7 . Comparisons with previous results in the literature
The results reported above with respect to the effects of mergers on profitabilityand sales are broadly consistent with those obtained by others. In a recent surveyof the literature Mueller (1997) summarized the results from 20 studies drawn

648 K. Gugler et al. / Int. J. Ind. Organ. 21 (2003) 625–653
from 10 countries over the post-World War II period that generally followed themethodology that we have employed here to determine the effects of mergers onprofitability, namely compared actual post-merger profits with those predictedusing a control group.
The most ambitious of all of the studies in terms of sample size, time span, andcare in handling the data was that of Ravenscraft and Scherer (1987) for theUnited States. They concluded that the profitability of acquired firms declined afterthey were acquired. On the other hand, Healy et al. (1992) found a significantincrease in the pre-tax cash flows of the companies involved in the 50 largestmergers between 1979 and 1984 implying that the largest mergers in the USduring the early 1980s did increase either the market power or the efficiency of the
20merging firms. Our results suggest that the profit increases that Healy et al.observed were mostly due to increases in market power.
The largest study of mergers in the UK (Meeks, 1977) concluded as didRavenscraft and Scherer that mergers reduced the profitability of the mergingcompanies. Other studies for the UK have, however, reached the oppositeconclusion (Cosh et al., 1980). Although the preponderance of evidence for theUK suggests that mergers tend to reduce profitability (Hughes, 1989), not allstudies have reached this conclusion.
No distinct pattern emerges in the studies from other countries. Profit increaseswere observed in Canada (Baldwin, 1995, Chapter 10) and Japan (Ikeda and Doi,1983), profit decreases in Holland (Peer, 1980) and Sweden (Ryden and Edberg,1980). In all other countries the differences were statistically insignificant. Wheremergers seem to result in profit increases in one country (e.g., Germany), theyresult in declines in another (e.g., France). Thus, our overall finding that the actualpost-merger profits of merging companies are in many cases insignificantlydifferent from their predicted values is in general accordance with the findings ofprevious studies. Where we perhaps differ from them is that we have observed agreater preponderance of positive and significant profit changes following mergers.
Our findings with respect to post-merger changes in sales for the surviving firmsalso accord with the main results reported in the literature. Since we project amerging company’s sales using the median sales of a non-merging company in thesame industry, one might expect that relative declines in sales will translate intodeclines in market shares. Three studies of the effects of mergers on market sharesexist. Goldberg (1973) observed insignificant changes in market shares for asample of 44 advertising intensive firms over an average of 3.5 years followingtheir undertaking a merger. Mueller (1985) observed significantdeclines in marketshares for a sample of 209 manufacturing companies over an average of 11 yearsfollowing the mergers. Baldwin and Gorecki (1990) found significant declines inmarket shares for plants acquired in horizontal mergers, but no significant changes
20Ravenscraft and Scherer also reported that ‘mergers among equals’—which is to say between twolarge firms—were more profitable than the average merger in their sample.

K. Gugler et al. / Int. J. Ind. Organ. 21 (2003) 625–653 649
for plants acquired in other sorts of mergers. They concluded that their resultswere consistent with the mergers having increased market power.
Nine studies that measured changes in the growth rates of merging firmsfollowing the mergers using either their industries or matched non-merging firmsas control groups found either that the mergers produced no significant change ingrowth rates [see McDougall and Round (1986) for Australia; Kumps andWtterwulghe (1980) for Belgium; Jenny and Weber (1980) for France; Cable et al.(1980) for Germany; Ryden and Edberg (1980) for Sweden; Cosh et al. (1980) forthe United Kingdom; and Amel and Rhoades (1989) for acquired US banks], orsignificant declines [Peer (1980) for Holland and Mueller (1980b) for the UnitedStates]. Thus, no study of which we are aware has found significant increases ineither the internal growth rates of merging companies or their market sharesfollowing their acquisitions, and several have reported significant declines. Ourgeneral finding of smaller sales for merging companies than are projected usingthe sales changes of the median nonmerging firm in the merging companies’industries is consistent with these results from the literature.
8 . A categorization of mergers according to their effects on market powerand efficiency
We begin this paper by stating that mergers can be divided into three broadcategories: those that increase profits by increasing market power, those thatincrease profits by increasing efficiency and those that reduce profits andefficiency. In Table 1 we categorized these and the other logically possibleconsequence of mergers. Table 10 summarizes the results of our study by reportingthe fractions of mergers that fall into each of the four categories. The first entry ineach sell gives the percentage of all acquisitions by small companies falling intothis cell, the second entry is for large acquirers, and the third is for all mergersregardless of size. Cell 1 reveals that 29.1% of the mergers in our sample resultedin increases in both sales and profits, and thus met our criterion for efficiencyincreasing mergers. A larger fraction of mergers by small firms (34.7%) satisfiedour criterion for an efficiency-increasing merger than was true for large firms(23.4%) (difference significant at the 1% level).
Roughly the same fraction of mergers reduced efficiency (cell 4) as increased it.Here, however, there was no difference related to size. Small firms were just aslikely to undertake a merger that reduced both profits and sales as were large firms.
A slightly smaller fraction of mergers met our criteria for a market powerincrease than did so for an efficiency increase. As one expects, large firmsaccounted for a significantly larger fraction of market power increasing mergers(34.8%) than did small companies (20.4%). Thus, some 85% of the mergers in oursample fall into the three main categories ‘efficiency increasing’, ‘efficiency

650 K. Gugler et al. / Int. J. Ind. Organ. 21 (2003) 625–653
Table 10Classification of mergers by firm size in yeart 1 5 (Percent of mergers)
DP.0 DP,0
1 3Small 34.7 17.5
DS.0 Large 23.4* 12.7*All 29.1 15.1
2 4Small 20.4 27.4
DS,0 Large 34.8* 29.1All 27.6 28.2
DP.0 (DP,0) denotes that the mergers resulted in a profit increase (decrease) relative to yeartand relative to industry and country peers.DS.0 (DS,0) denotes that the mergers resulted in a salesincrease (decrease) relative to yeart and relative to industry and country peers. The first number in eachcell is for small firms (total sales less than the median in yeart21), the second number in each cell isfor large firms (total sales more than the median in yeart21), and the third number in each cell is theoverall proportion. A * denotes that the proportion of small firms is significantly different from theproportion of large firms at the 1% level, two-sided test.
reducing’ or ‘market power increasing’, and they are divided roughly equallyacross them.
These comparisons leave out the somewhat puzzling cell 3. As we noted inSection 2, this pattern of effects—sales rise and profits fall—is what one mightexpect of firms whose managers were size or growth maximizers. It is also whatone would expect if the mergers led to a decrease in market power using the samelogic that we employ to determine increases in market power. Even if one uses thislogic to classify mergers in cell 3 as socially beneficial, however, the fraction ofbeneficial mergers in our study (44.2) falls short of the fraction that is harmful
21because they either increase market power or reduce efficiency.
21Of course, some of the differences between actual and projected profits and sales that we recordare small andeconomically insignificant. Thus, some of the mergers falling into each category might bejudged to have resulted in small and insignificant increases in market power, etc. An alternative way toproceed would be to define an additional category—no significant difference—where significantdifference is interpreted as an economically meaningful difference between the actual and projectedvalues. We made such a classification using a one percentage point difference in profits relative toassets and a 10% difference in sales as our criteria for significant difference. Using these criteria, 3% ofthe mergers fell into the no difference category for both profits and sales, and 60% of all remainingmergers fell into the three main categories identified in Table 1, with the division among themremaining roughly equal—20% in each cell. Thus, one’s judgement as to therelative proportions ofsocially beneficial and harmful mergers is not affected by introducing an additional, no-differencecategory.

K. Gugler et al. / Int. J. Ind. Organ. 21 (2003) 625–653 651
9 . Conclusions
We believe that the present study is the first to determine the effects of mergerson efficiency and market power by first separating mergers into those that increaseprofits and those that reduce them, and then examining the patterns of saleschanges following the mergers. Most previous studies have judged the conse-quences of mergers by examining their average effects on either the profits or salesof the merging companies. As the previous section suggests, our results usingthese tests are broadly consistent with what others have found. We find that 56.7%of all mergers result in higher than projected profits, but almost the same fractionof mergers results in lower than projected sales after 5 years. Both meandifferences are significantly different from zero. Thus, using profits as the measureof success would lead one to conclude that the average merger was a success,using sales one would reach the opposite conclusion. By basing our judgement ofthe welfare effects of mergers upon criteria that look at both the sales and profitschanges following mergers, we have been able to resolve this ambiguity. Wepredict profit increases and sales declines for mergers that increase market power.More than a fourth of all mergers exhibit this pattern, and this helps to explainwhy mergers look more successful, when one examines post-merger profits thanfor post-merger sales. If one categorizes mergers that increase market power orthat reduce efficiency as welfare reducing, then a majority of the mergers takingplace around the world over the last 15 years appear to be welfare reducing.
Our study is the largest cross-national comparison of the effects of mergers todate. In this respect one of our most interesting findings is how similar thepost-merger patterns of profit and sales changes look across the different countries.We also did not find significant differences between domestic and cross-bordermergers. Although individual mergers can have quite different consequences interms of efficiency and market power, their effects do not appear to depend on thecountry origins of the merging companies.
A cknowledgements
We would like to thank A. D. Cosh, M. Erlei, O. Fabel, P. A. Geroski, P. Guest,A. Hughes, D. Marin, S. Martin, H. Odagiri, A. Singh, K. Stahl and P. Zweifel forcomments. Thanks are also due to participants in presentations at the CorporateGovernance conference organized by the DIW, Berlin, November, 2000; at the 9thAnnual WZB conference on Industrial Organization, Berlin, December 2000; and
¨ ¨ ¨at the ‘Ausschuß fur Industrieokonomik’ of the Verein fur Socialpolitik, Passau,March 2001. We also thank J. Jung for excellent research assistance. Financial
¨support of the ‘Jubilaumsfonds der Oesterreichischen Nationalbank’, Project 8861,is gratefully acknowledged.

652 K. Gugler et al. / Int. J. Ind. Organ. 21 (2003) 625–653
R eferences
Amel, D.F., Rhoades, S.A., 1989. Empirical evidence on the motives for bank mergers. EasternEconomic Journal 15, 17–27.
Baldwin, J., 1995. In: The Dynamics of the Competitive Process. Cambridge University Press,Cambridge.
Baldwin, J., Gorecki, P., 1990. Mergers placed in the context of firm turnover. In: Bureau of theCensus, Annual Research Conference, Proceedings, Washington, DC: US Department of Commerce,pp. 53–73.
Cable, J.R., Palfrey, J.P.R., Runge, J.W., 1980. Federal Republic of Germany, 1964–1974. In: Mueller,D.C. (Ed.), The Determinants and Effects of Mergers: An International Comparison. Oelgeschlager,Gunn & Hain, Cambridge, MA, pp. 99–132.
Cosh, A., Hughes, A., Singh, A., 1980. The causes and effects of takeovers in the United Kingdom: anempirical investigation for the late 1960s at the microeconomic level. In: Mueller, D.C. (Ed.), TheDeterminants and Effects of Mergers: An International Comparison. Oelgeschlager, Gunn & Hain,Cambridge, MA, pp. 227–270.
Goldberg, L.G., 1973. The effect of conglomerate mergers on competition. Journal of Law andEconomics 16, 137–158.
Healy, P.M., Palepu, K.G., Ruback, R.S., 1992. Does corporate performance improve after mergers?Journal of Financial Economics 31, 135–175.
Hughes, A., 1989. The impact of merger: a survey of empirical evidence for the UK. In: Fairburn, J.,John, K. (Eds.), Mergers and Merger Policy. Oxford University Press, Oxford, pp. 30–98.
Ikeda, K., Doi, N., 1983. The performance of merging firms in Japanese manufacturing industry:1964–75. Journal of Industrial Economics 31, 257–266.
Jenny, F., Weber, A.P., 1980. France, 1962–72. In: Mueller, D.C. (Ed.), The Determinants and Effectsof Mergers: An International Comparison. Oelgeschlager, Gunn & Hain, Cambridge, MA, pp.133–162.
Kumps, A., Wtterwulghe, R., 1980. Belgium, 1962–74. In: Mueller, D.C. (Ed.), The Determinants andEffects of Mergers: An International Comparison. Oelgeschlager, Gunn & Hain, Cambridge, MA,pp. 67–97.
McDougall, F.M., Round, D.K., 1986. The Determinants and Effects of Corporate Takeovers inAustralia, 1970–1981. Australian Institute of Management, Victoria.
Meeks, G., 1977. In: Disappointing Marriage: A Study of the Gains From Merger. CambridgeUniversity Press, Cambridge.
Mueller, D.C., 1980a. The Determinants and Effects of Mergers: An International Comparison.Oelgeschlager, Gunn & Hain, Cambridge, MA.
Mueller, D.C., 1980b. The United States, 1962–1972. In: Mueller, D.C. (Ed.), The Determinants andEffects of Mergers: An International Comparison. Oelgeschlager, Gunn & Hain, Cambridge, MA,pp. 271–298.
Mueller, D.C., 1985. Mergers and market share. Review of Economics and Statistics 67, 259–267.Mueller, D.C., 1997. Merger policy in the United States: a reconsideration. Review of Industrial
Organization 12, 655–685.Peer, H., 1980. The Netherlands, 1962–1973. In: Mueller, D.C. (Ed.), The Determinants and Effects of
Mergers: An International Comparison. Oelgeschlager, Gunn & Hain, Cambridge, MA, pp. 163–191.
Ravenscraft, D.J., Scherer, F.M., 1987. Mergers Sell-offs and Economic Efficiency. The BrookingsInstitution, Washington, DC.
Ryden, B., Edberg, J.O., 1980. Large mergers in Sweden, 1962–1976. In: Mueller, D.C. (Ed.), TheDeterminants and Effects of Mergers: An International Comparison. Oelgeschlager, Gunn & Hain,Cambridge, MA, pp. 193–226.
Salant, S.W., Switzer, S., Reynolds, R.J., 1983. Losses from horizontal merger: the effects of an

K. Gugler et al. / Int. J. Ind. Organ. 21 (2003) 625–653 653
exogenous change in industry structure on Cournot-Nash equilibrium. Quarterly Journal ofEconomics 98, 185–199.
Scott, J.T., 1993. Purposive Diversification and Economic Performance. Cambridge University Press,Cambridge.
Suits, D.B., 1984. Dummy variables: mechanics v. interpretation. Review of Economics and Statistics66, 177–178.