systematic methodology for planning and evaluation of a multi … · 2017-06-11 · systematic...
TRANSCRIPT
Systematic methodology for planning and evaluation of a multi-source
geohazard monitoring system. Application of a reusable template.
Fjóla G. Sigtryggsdóttir Department of Civil and Environmental Engineering, NTNU, Norway, [email protected]
Jónas Th. Snæbjörnsson School of Science and Engineering, Reykjavík University, Iceland, [email protected]
ABSTRACT:
In this paper geohazards and their monitoring are considered in the general context of reservoirs and dams. A
systematic methodology is used to identify and characterise multiple causes and effects, as well as their
interdependencies. This methodology originated at NASA as a part of the safety management of the space program.
Here, a recently presented, multi-system expansion of the method is introduced, which has been used to capture
complicated data into a reusable template represented by interrelation matrices. This template has a general
relevance for monitoring geohazards considering the safety of reservoirs and dams. The methodology and the
related system analysis possesses some powerful diagnoses possibilities. The template is for instance, used to
reveal the potential safety value of a multi-source system installed for monitoring geohazards in conjunction with
a large reservoir in Iceland. The method presents an important step in a holistic risk and safety management of
reservoirs.
Keywords: Multi-hazards, geohazard, systems analysis, interrelations, reservoir, dam
1. INTRODUCTION
Hydroelectric generation requires topographic conditions providing for both adequate storage of
impounded water and suitable dam sites, as well as, a significant drop in elevation, between the storage
area and a powerhouse over a reasonable distance. Favourable topographic conditions are often found
in mountainous regions or highlands with glacially fed rivers and/or significant seasonal and/or annual
precipitation. Furthermore, suitable dam sites for impounding of a reservoir are usually found in narrow
valleys or canyons.
Mountain slopes, combined with sensitive geology and climatic conditions, are susceptible for landslide
occurrence, rock falls and avalanches, while glacially related processes include glacial outburst
(jökulhlaup), ice calving and glacier surge which can lead to flooding and debris flow. Moreover,
mountainous regions are formed through tectonic forces and volcanism, with rivers and streams in many
cases running along valleys or canyons formed through weakness in the geological structure such as
faults and lineaments. Hence, it can be concluded that the topographic conditions favouring the
construction of a hydropower plant are likely to hold an inherent potential for geohazards.
From a hydropower project perspective, geohazards have been defined (Sigtryggsdóttir et al, 2015) as
site specific (in the foundation), local (in the reservoir area) and/or regional depending on the
characteristics of the threatening geological condition. Furthermore, a potential geohazard can develop
a failure event during the project’s lifetime causing one or more of the following effects: loss of life,
destruction of downstream property, damage to environment, damage to hydroelectric facilities, loss of
sustainability, project benefits and/or socio-economic impacts.
The assessment of relevant geohazards is thus imperative for the planning, design and operation of
reservoirs and dams. Furthermore, one has to consider the potential of the reservoir itself to induce or
trigger different geohazards during the impounding and operation period. Hence, a comprehensive risk

and safety management of reservoirs and dams should consider geohazard/reservoir interrelations in a
multi-source monitoring program, linking multi-hazards with the appropriate monitoring parameters. A
tool in planning such a program has been developed by Sigtryggsdóttir et al (2015 and 2016), based on
an existing method of systems theory, expanded to be applicable for multiple systems. In this paper the
methodology will be introduced, and a reusable template of interrelations from Sigtryggsdóttir et al
(2016), used for investigating a multi-source monitoring of multiple geohazards. This template can be
further used when planning new reservoirs and dams, or in reviewing existing infrastructure.
2. METHODOLOGY
The method used is based on an interrelation matrix (an “N-squared” matrix) designed to identify and
characterise multiple causes and effects, as well as their interdependencies. This methodology originated
at NASA in late 1960’s and early 1970’s as a part of safety management for the space program. Hudson
(1992) later developed this method further to solve complex engineering problems in rock engineering
systems. Sigtryggsdóttir et al (2015 and 2016) presented a multi-system expansion of the methodology,
allowing for a quantitative investigation of the interrelation between individual systems.
The construction of a single system nxn interrelation matrix is visualized in Fig. 1. Here, i and j,
respectively, are a row and a column of the matrix. The first step is to identify the components, Pi, of a
particular system and align these on the matrix diagonal (i=j),. Then the interrelations defined in the off-
diagonal cells, Iij , (i≠j) are described and subsequently identified, for example, using binary interactions
(1 for existing interrelation, 0 for none). The matrix can also be coded by ranking the interactions in
order of importance or strength, using, for example, the numerical values 0, 1, 2, 3, 4 to represent,
respectively, “none”, “weak”, “medium”, “strong” and “critical” interrelations (Hudson, 1992). Fig. 1
explains how summation of the interrelations in the same row as parameter Pi, represents its influence
or causes, Ci, while the summation of the interrelations in the same column represents the effects, Ei, of
the system on Pi. The coordinates, (Ci, Ei), can be plotted in a cause-effect diagram. Furthermore, the
interaction intensity (Ci + Ei), and dominance (Ci - Ei) of parameter Pi within a system, can be plotted.
Figure 1. Construction of an interrelation matrix. Parameters are named P1, P2,..,Pn on the diagonal. The cell Ii,j
represents the influence of Pi on Pj (cause); vice versa the cell Ij,i represents the influence of Pj on Pi (effect).
As previously mentioned, Sigtryggsdóttir et al (2015 and 2016) expanded the method to include multiple
systems. Fig. 2 describes a multiple system interrelation matrix [MSIM] for N systems. The interrelation
matrix of each system J, where J = 1, 2,…, N, within the [MSIM] is denoted SJ and is constructed and
analysed as described above for one system. The parameters defining each system are aligned
diagonally, and the number of these within the respective systems may vary. The interrelation between
systems J and I (where J = 1, 2, …, N; I=1, 2, ..., N; and I ≠ J) is described in sub-matrices denoted SIJ,I
and SII,J. Sub-matrix SIJ,I defines the influence of the system defined by SJ on the one defined by SI and
vice versa for sub-matrix SII,J. There may be more than one type of interrelation between systems, that
calls for investigation.

.
Figure 2. Multiple system interrelation matrix [MSIM] with sub-matrices of system interrelations (S) and sub-
matrices of interrelations between systems (SI). (Sigtryggsdóttir et al, 2016)
3. APPLICATION OF A REUSABLE TEMPLATE
3.1 Conceptual model
A conceptual model comprising two systems, GeoRes and SafeMon is outlined in Fig. 3 (left). GeoRes
is a system of geohazards, a reservoir and large dams, while SafeMon is a system of the monitoring
system installed to monitor geohazards within GeoRes. Table 1 defines the parameters of each system.
Further expansion of the monitoring parameters of specific processes (SpS) and pore pressure (PP) is in
Table 2. Sigtryggsdóttir et al (2016) developed the conceptual model, ranking numerically both physical
and natural interrelations (Fig. 3). The interrelation ranking is based on physical/natural possibility
rather than e.g. site specific probability, to allow for general application. Thus, the conceptual model
with the interrelation appropriately defined presents a template that can be applied for any reservoir as
a first step in a multi-hazard analysis and/or for planning a geohazard monitoring program. However, as
later explained, indices must be defined to represent the actual site specific, local and regional settings
of a specific reservoir.
Figure 3. (Left) Outline of the conceptual model’s multiple systems interrelation matrix and the different
SafeMon system interrelations to the GeoRes system. The full model (the Template) with numerical values is in
Sigtryggsdóttir et al, (2016). (Right) A table with interrelation categories and ranking used in the model.
The Template with the numerical interrelations is available in Sigtryggsdóttir et al (2016) and can be
copied from there for reuse, or as required. Here, the numerical interrelations from the Template are
Used in S1
for possible
triggering
Used in S1 for the possible effect
on Reservoir and dam safety and
integrity
4 Strong 4 Critical
3 Medium 3 Strong
2 Weak 2 Medium
1 Very weak 1 Weak 0 No 0 No
Used in S1, S2 and SI1,2
for possible
interrelation
Used in SI2,1
for possible alarm or back-
calculations/evaluations (BE) 4 Strong alarm
3 Strong 3 Medium alarm
2 Medium 2 Weak alarm
1 Weak 1 Back calculations/evaluations
0 No 0 No alarm/back calculation
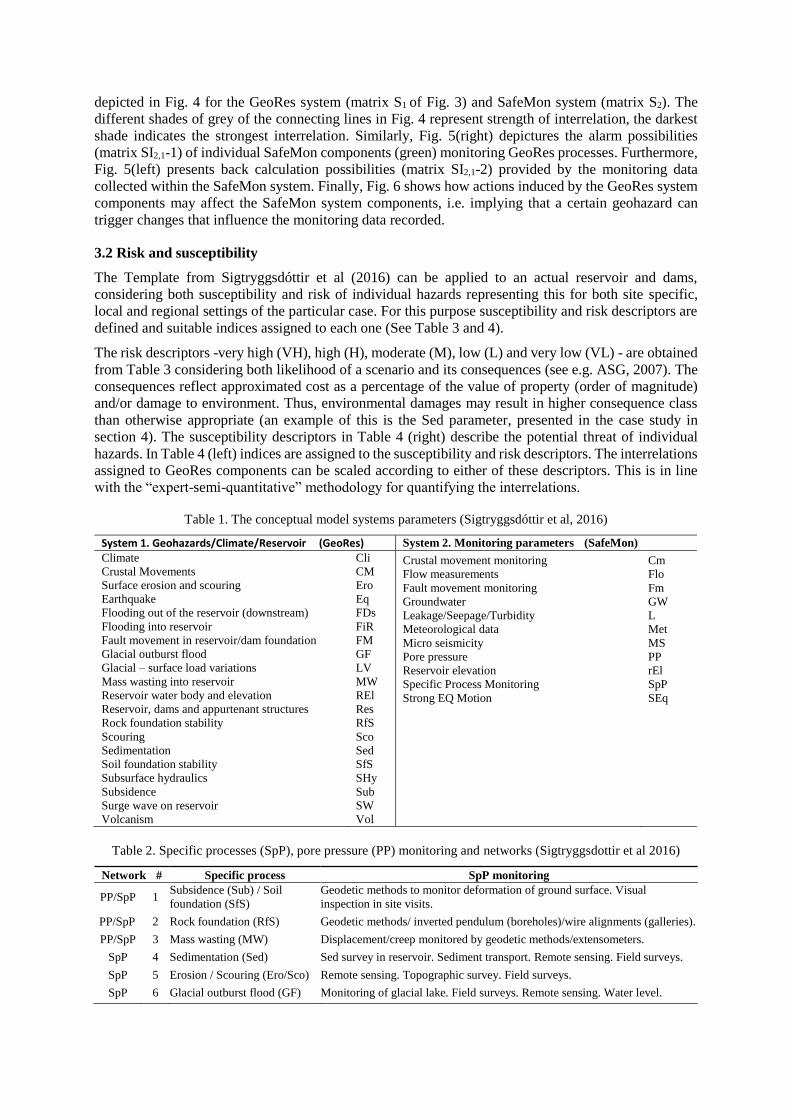
depicted in Fig. 4 for the GeoRes system (matrix S1 of Fig. 3) and SafeMon system (matrix S2). The
different shades of grey of the connecting lines in Fig. 4 represent strength of interrelation, the darkest
shade indicates the strongest interrelation. Similarly, Fig. 5(right) depictures the alarm possibilities
(matrix SI2,1-1) of individual SafeMon components (green) monitoring GeoRes processes. Furthermore,
Fig. 5(left) presents back calculation possibilities (matrix SI2,1-2) provided by the monitoring data
collected within the SafeMon system. Finally, Fig. 6 shows how actions induced by the GeoRes system
components may affect the SafeMon system components, i.e. implying that a certain geohazard can
trigger changes that influence the monitoring data recorded.
3.2 Risk and susceptibility
The Template from Sigtryggsdóttir et al (2016) can be applied to an actual reservoir and dams,
considering both susceptibility and risk of individual hazards representing this for both site specific,
local and regional settings of the particular case. For this purpose susceptibility and risk descriptors are
defined and suitable indices assigned to each one (See Table 3 and 4).
The risk descriptors -very high (VH), high (H), moderate (M), low (L) and very low (VL) - are obtained
from Table 3 considering both likelihood of a scenario and its consequences (see e.g. ASG, 2007). The
consequences reflect approximated cost as a percentage of the value of property (order of magnitude)
and/or damage to environment. Thus, environmental damages may result in higher consequence class
than otherwise appropriate (an example of this is the Sed parameter, presented in the case study in
section 4). The susceptibility descriptors in Table 4 (right) describe the potential threat of individual
hazards. In Table 4 (left) indices are assigned to the susceptibility and risk descriptors. The interrelations
assigned to GeoRes components can be scaled according to either of these descriptors. This is in line
with the “expert-semi-quantitative” methodology for quantifying the interrelations.
Table 1. The conceptual model systems parameters (Sigtryggsdóttir et al, 2016)
System 1. Geohazards/Climate/Reservoir (GeoRes) System 2. Monitoring parameters (SafeMon) Climate
Crustal Movements
Surface erosion and scouring
Earthquake
Flooding out of the reservoir (downstream)
Flooding into reservoir
Fault movement in reservoir/dam foundation
Glacial outburst flood
Glacial – surface load variations
Mass wasting into reservoir
Reservoir water body and elevation
Reservoir, dams and appurtenant structures
Rock foundation stability
Scouring
Sedimentation
Soil foundation stability
Subsurface hydraulics
Subsidence
Surge wave on reservoir
Volcanism
Cli
CM
Ero
Eq
FDs
FiR
FM
GF
LV
MW
REl
Res
RfS
Sco
Sed
SfS
SHy
Sub
SW
Vol
Crustal movement monitoring
Flow measurements
Fault movement monitoring
Groundwater
Leakage/Seepage/Turbidity
Meteorological data
Micro seismicity
Pore pressure
Reservoir elevation
Specific Process Monitoring
Strong EQ Motion
Cm
Flo
Fm
GW
L
Met
MS
PP
rEl
SpP
SEq
Table 2. Specific processes (SpP), pore pressure (PP) monitoring and networks (Sigtryggsdottir et al 2016)
Network # Specific process SpP monitoring
PP/SpP 1 Subsidence (Sub) / Soil
foundation (SfS)
Geodetic methods to monitor deformation of ground surface. Visual
inspection in site visits.
PP/SpP 2 Rock foundation (RfS) Geodetic methods/ inverted pendulum (boreholes)/wire alignments (galleries).
PP/SpP 3 Mass wasting (MW) Displacement/creep monitored by geodetic methods/extensometers.
SpP 4 Sedimentation (Sed) Sed survey in reservoir. Sediment transport. Remote sensing. Field surveys.
SpP 5 Erosion / Scouring (Ero/Sco) Remote sensing. Topographic survey. Field surveys.
SpP 6 Glacial outburst flood (GF) Monitoring of glacial lake. Field surveys. Remote sensing. Water level.

Figure 4. Interrelations within the GeoRes system (Left) (matrix S1) and SafeMon system (Right) (matrix S2)
depicted. The arrowhead of the connecting lines points to the affected component. The different shades of grey
of the connecting lines represent strength of interrelation, the darkest shade for the strongest interrelation.
(Legend: Reservoir (blue); Tectonic geohazards (pink); Surficial geohazards (yellow), Site specific geohazards
(in the foundation) (green); Site specific geohazard relating to tectonics (brown)). (Sigtryggsdottir et al 2016)
Figure 5. Back-calculation (BE) (Left) (matrix SI2,1-2) and Alarm possibilities (Right) (matrix SI2,1-1) of
individual SafeMon components (green) monitoring GeoRes processes (yellow). The arrowhead of the
connecting lines points to the GeoRes component for which an alarm/BE is provided by a SafeMon component.
(The different shades of grey of the connecting lines for the Alarms (Right), represent strength of alarm
possibility, for example, increase/changes in L may provide a strong alarm for critical development of SHy).
Figure 6. Possible actions applied by the GeoRes system to the SafeMon system (matrix SI1,2 ). The arrowhead of
the connecting lines points to the SafeMon component reacting to the action imposed by a GeoRes component.
For example Flo and rEl will react to the action imposed by FiR; in other words, FiR influences flow in rivers
and the reservoir elevation and thus the relevant monitoring (Flo and rEl).

Table 3. Risk descriptors considering likelihood and consequences (adopted from: AGS, 2007)
Likelihood Consequences to propertya) and environment
Descriptor
Indicative
annual
probability
Indicative
return
period
(years)
Catastrophic
200%
(Cat)
Major
<60%
(Maj)
Medium
<20%
(Med)
Minor
<5%
(Min)
Insignificant
<0.5%
(In)
A
B
C
D
E
F
Almost certain
Likely
Possible
Unlikely
Highly unlikely
Barely credible
10-1
10-2
10-3
10-4
10-5
10-6
10
100
1,000
10,000
100,000
1,000,000
VH
VH
VH
H
M
L
VH
VH
H
M
L
VL
VH
H
M
L
L
VL
H
M
M
L
VL
VL
M/L b)
L
L
VL
VL
VL a) As a percentage of the value of the property (order of magnitude) with consideration of environmental damages b) L if consequences <0.1% otherwise M.
Table 4. Susceptibility descriptors (right) and indices for the susceptibility and risk descriptors (left)
4. CASE STUDY
The case study presented herein, considers the Hálslón Reservoir, the main storage of the 690 MW
Kárahnjúkar Hydropower Plant in Iceland. A glacial river fed by the Vatnajökull Glacier and carrying
high sediment load, is stemmed with three dams (Fig. 7) to form the reservoir. The highest dam is 198
m high. From the reservoir the water runs through a 53 km long tunnel to an underground powerhouse,
from which the tailwater is diverted into another riverbed. Key figures relating to the reservoir, its dams
and waterways are given in Sigtryggsdottir et al (2016). In addition to the dams, important structures
include: a fuse plug and a spillway necessitating a plunge pool.
The Hálslón Reservoir is located close to the South East margin of the Northern Volcanic Zone (NVZ)
in Iceland (Fig. 7 right). Horizontal crustal movements are continuous in this area, as are post-glacial
rebound uplift due to the melting of the Vatnajökull Glacier. The reservoir is in an area generally
assessed as a low seismic hazard zone. However, faults with movement in Holocene time have been
identified in the reservoir area. Information on the settings of the Hálslón Reservoir can be found in
papers and reports referred to in Sigtryggsdóttir et al (2016).
Figure 7. The case study (left) and its location (right) close the the eastern boundary of the volcanic zones
(sketches of elliptic circles indicate rough location of volcanic systems).
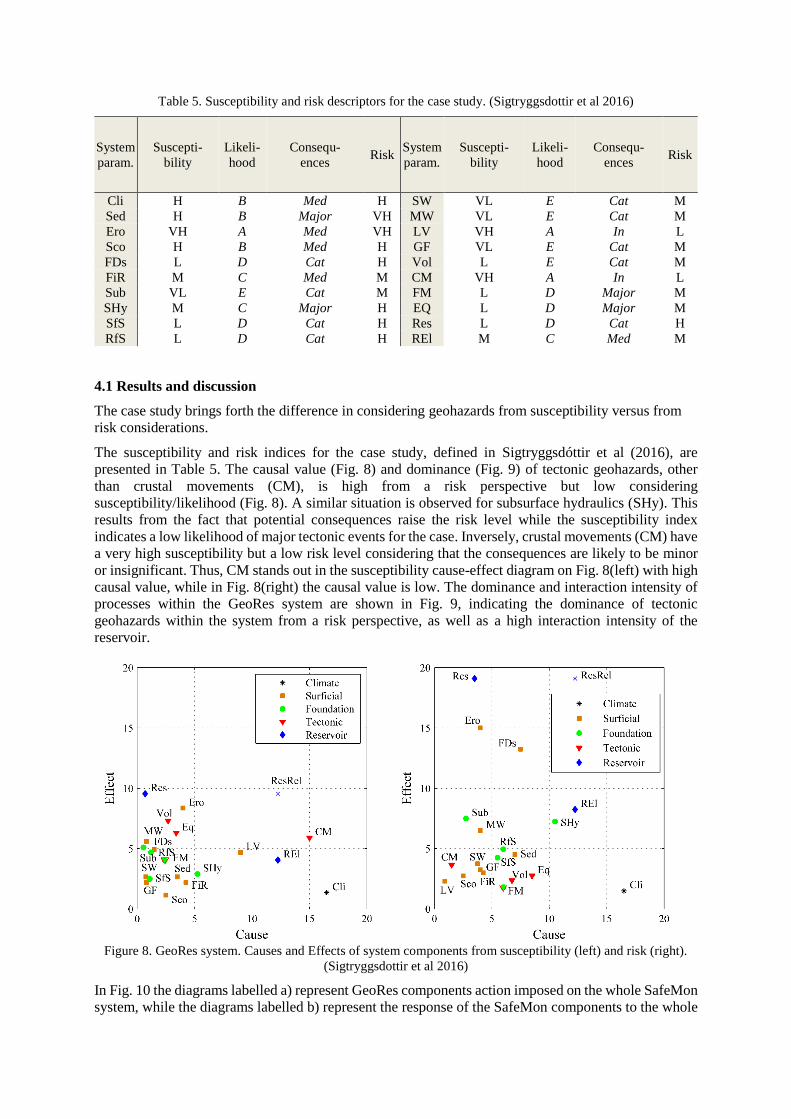
Table 5. Susceptibility and risk descriptors for the case study. (Sigtryggsdottir et al 2016)
System
param.
Suscepti-
bility
Likeli-
hood
Consequ-
ences Risk
System
param.
Suscepti-
bility
Likeli-
hood
Consequ-
ences Risk
Cli H B Med H SW VL E Cat M
Sed H B Major VH MW VL E Cat M
Ero VH A Med VH LV VH A In L
Sco H B Med H GF VL E Cat M
FDs L D Cat H Vol L E Cat M
FiR M C Med M CM VH A In L
Sub VL E Cat M FM L D Major M
SHy M C Major H EQ L D Major M
SfS L D Cat H Res L D Cat H
RfS L D Cat H REl M C Med M
4.1 Results and discussion
The case study brings forth the difference in considering geohazards from susceptibility versus from
risk considerations.
The susceptibility and risk indices for the case study, defined in Sigtryggsdóttir et al (2016), are
presented in Table 5. The causal value (Fig. 8) and dominance (Fig. 9) of tectonic geohazards, other
than crustal movements (CM), is high from a risk perspective but low considering
susceptibility/likelihood (Fig. 8). A similar situation is observed for subsurface hydraulics (SHy). This
results from the fact that potential consequences raise the risk level while the susceptibility index
indicates a low likelihood of major tectonic events for the case. Inversely, crustal movements (CM) have
a very high susceptibility but a low risk level considering that the consequences are likely to be minor
or insignificant. Thus, CM stands out in the susceptibility cause-effect diagram on Fig. 8(left) with high
causal value, while in Fig. 8(right) the causal value is low. The dominance and interaction intensity of
processes within the GeoRes system are shown in Fig. 9, indicating the dominance of tectonic
geohazards within the system from a risk perspective, as well as a high interaction intensity of the
reservoir.
Figure 8. GeoRes system. Causes and Effects of system components from susceptibility (left) and risk (right).
(Sigtryggsdottir et al 2016)
In Fig. 10 the diagrams labelled a) represent GeoRes components action imposed on the whole SafeMon
system, while the diagrams labelled b) represent the response of the SafeMon components to the whole
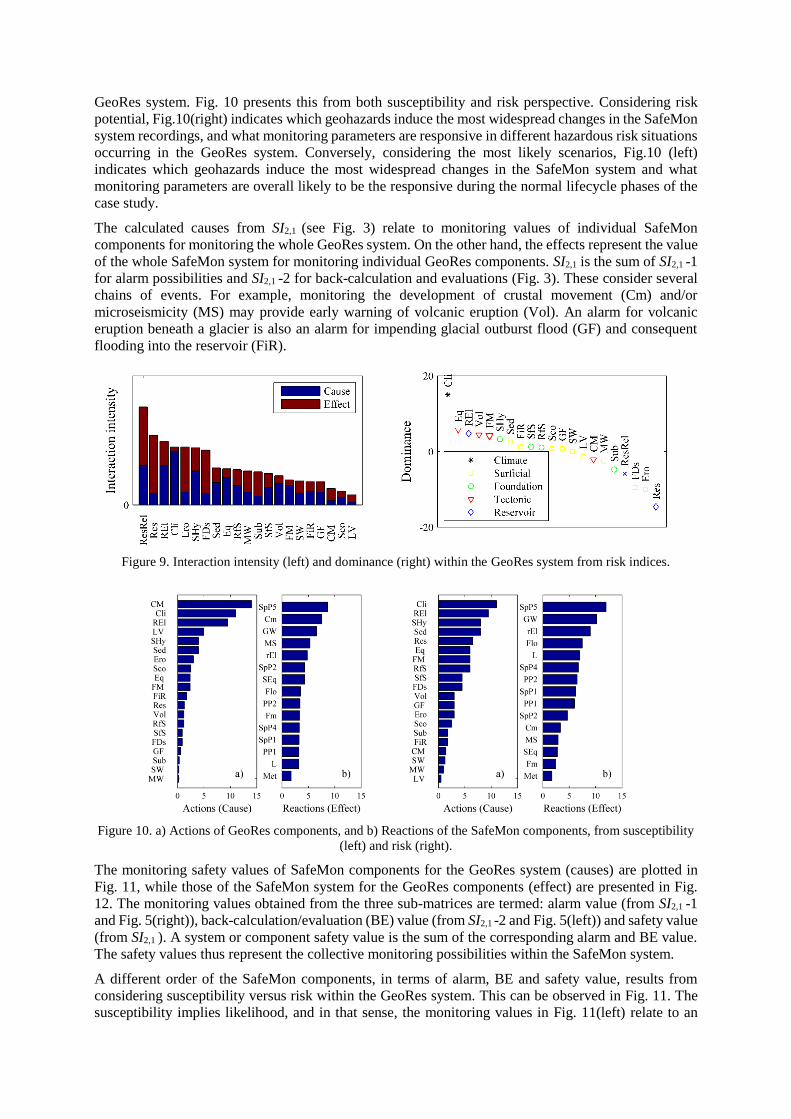
GeoRes system. Fig. 10 presents this from both susceptibility and risk perspective. Considering risk
potential, Fig.10(right) indicates which geohazards induce the most widespread changes in the SafeMon
system recordings, and what monitoring parameters are responsive in different hazardous risk situations
occurring in the GeoRes system. Conversely, considering the most likely scenarios, Fig.10 (left)
indicates which geohazards induce the most widespread changes in the SafeMon system and what
monitoring parameters are overall likely to be the responsive during the normal lifecycle phases of the
case study.
The calculated causes from SI2,1 (see Fig. 3) relate to monitoring values of individual SafeMon
components for monitoring the whole GeoRes system. On the other hand, the effects represent the value
of the whole SafeMon system for monitoring individual GeoRes components. SI2,1 is the sum of SI2,1 -1
for alarm possibilities and SI2,1 -2 for back-calculation and evaluations (Fig. 3). These consider several
chains of events. For example, monitoring the development of crustal movement (Cm) and/or
microseismicity (MS) may provide early warning of volcanic eruption (Vol). An alarm for volcanic
eruption beneath a glacier is also an alarm for impending glacial outburst flood (GF) and consequent
flooding into the reservoir (FiR).
Figure 9. Interaction intensity (left) and dominance (right) within the GeoRes system from risk indices.
Figure 10. a) Actions of GeoRes components, and b) Reactions of the SafeMon components, from susceptibility
(left) and risk (right).
The monitoring safety values of SafeMon components for the GeoRes system (causes) are plotted in
Fig. 11, while those of the SafeMon system for the GeoRes components (effect) are presented in Fig.
12. The monitoring values obtained from the three sub-matrices are termed: alarm value (from SI2,1 -1
and Fig. 5(right)), back-calculation/evaluation (BE) value (from SI2,1 -2 and Fig. 5(left)) and safety value
(from SI2,1 ). A system or component safety value is the sum of the corresponding alarm and BE value.
The safety values thus represent the collective monitoring possibilities within the SafeMon system.
A different order of the SafeMon components, in terms of alarm, BE and safety value, results from
considering susceptibility versus risk within the GeoRes system. This can be observed in Fig. 11. The
susceptibility implies likelihood, and in that sense, the monitoring values in Fig. 11(left) relate to an
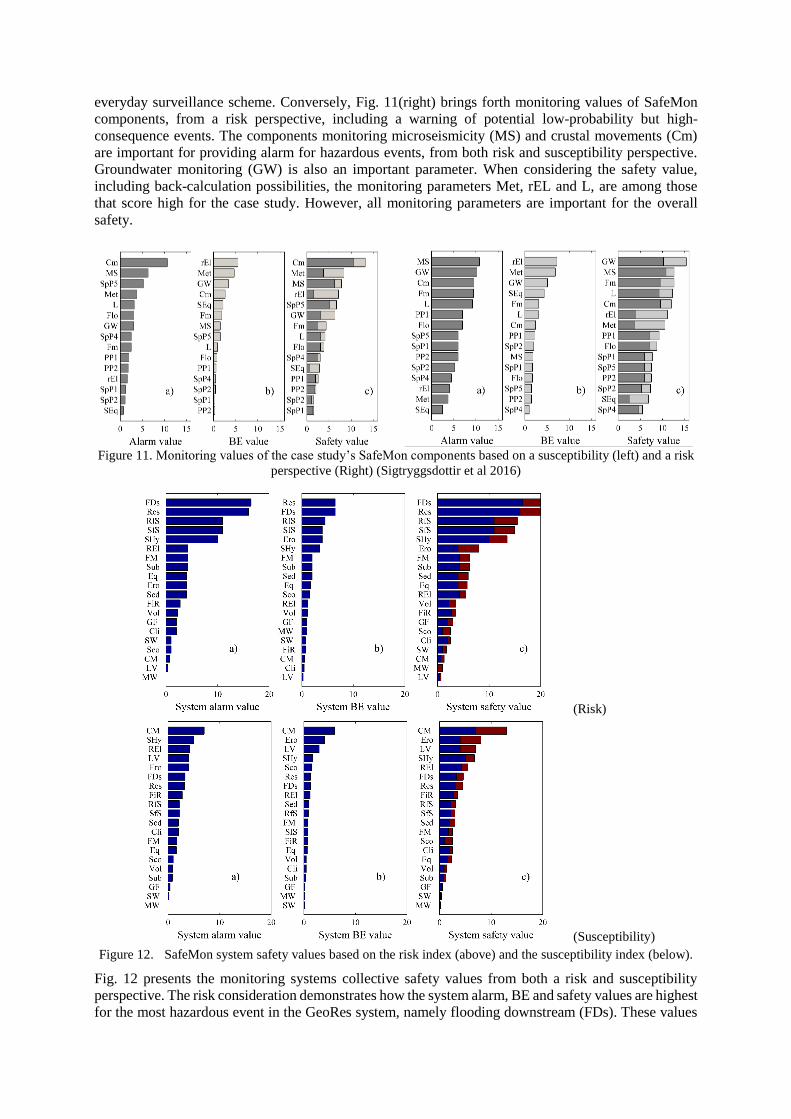
everyday surveillance scheme. Conversely, Fig. 11(right) brings forth monitoring values of SafeMon
components, from a risk perspective, including a warning of potential low-probability but high-
consequence events. The components monitoring microseismicity (MS) and crustal movements (Cm)
are important for providing alarm for hazardous events, from both risk and susceptibility perspective.
Groundwater monitoring (GW) is also an important parameter. When considering the safety value,
including back-calculation possibilities, the monitoring parameters Met, rEL and L, are among those
that score high for the case study. However, all monitoring parameters are important for the overall
safety.
Figure 11. Monitoring values of the case study’s SafeMon components based on a susceptibility (left) and a risk
perspective (Right) (Sigtryggsdottir et al 2016)
(Risk)
(Susceptibility) Figure 12. SafeMon system safety values based on the risk index (above) and the susceptibility index (below).
Fig. 12 presents the monitoring systems collective safety values from both a risk and susceptibility
perspective. The risk consideration demonstrates how the system alarm, BE and safety values are highest
for the most hazardous event in the GeoRes system, namely flooding downstream (FDs). These values
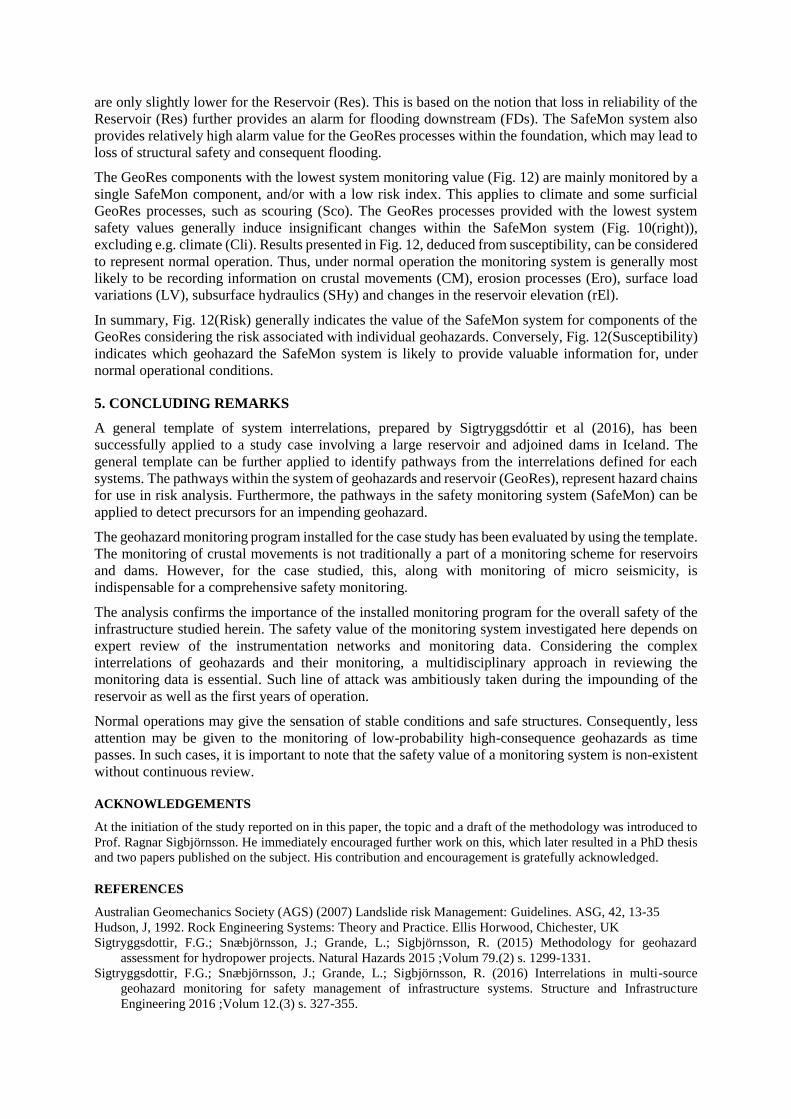
are only slightly lower for the Reservoir (Res). This is based on the notion that loss in reliability of the
Reservoir (Res) further provides an alarm for flooding downstream (FDs). The SafeMon system also
provides relatively high alarm value for the GeoRes processes within the foundation, which may lead to
loss of structural safety and consequent flooding.
The GeoRes components with the lowest system monitoring value (Fig. 12) are mainly monitored by a
single SafeMon component, and/or with a low risk index. This applies to climate and some surficial
GeoRes processes, such as scouring (Sco). The GeoRes processes provided with the lowest system
safety values generally induce insignificant changes within the SafeMon system (Fig. 10(right)),
excluding e.g. climate (Cli). Results presented in Fig. 12, deduced from susceptibility, can be considered
to represent normal operation. Thus, under normal operation the monitoring system is generally most
likely to be recording information on crustal movements (CM), erosion processes (Ero), surface load
variations (LV), subsurface hydraulics (SHy) and changes in the reservoir elevation (rEl).
In summary, Fig. 12(Risk) generally indicates the value of the SafeMon system for components of the
GeoRes considering the risk associated with individual geohazards. Conversely, Fig. 12(Susceptibility)
indicates which geohazard the SafeMon system is likely to provide valuable information for, under
normal operational conditions.
5. CONCLUDING REMARKS
A general template of system interrelations, prepared by Sigtryggsdóttir et al (2016), has been
successfully applied to a study case involving a large reservoir and adjoined dams in Iceland. The
general template can be further applied to identify pathways from the interrelations defined for each
systems. The pathways within the system of geohazards and reservoir (GeoRes), represent hazard chains
for use in risk analysis. Furthermore, the pathways in the safety monitoring system (SafeMon) can be
applied to detect precursors for an impending geohazard.
The geohazard monitoring program installed for the case study has been evaluated by using the template.
The monitoring of crustal movements is not traditionally a part of a monitoring scheme for reservoirs
and dams. However, for the case studied, this, along with monitoring of micro seismicity, is
indispensable for a comprehensive safety monitoring.
The analysis confirms the importance of the installed monitoring program for the overall safety of the
infrastructure studied herein. The safety value of the monitoring system investigated here depends on
expert review of the instrumentation networks and monitoring data. Considering the complex
interrelations of geohazards and their monitoring, a multidisciplinary approach in reviewing the
monitoring data is essential. Such line of attack was ambitiously taken during the impounding of the
reservoir as well as the first years of operation.
Normal operations may give the sensation of stable conditions and safe structures. Consequently, less
attention may be given to the monitoring of low-probability high-consequence geohazards as time
passes. In such cases, it is important to note that the safety value of a monitoring system is non-existent
without continuous review.
ACKNOWLEDGEMENTS
At the initiation of the study reported on in this paper, the topic and a draft of the methodology was introduced to
Prof. Ragnar Sigbjörnsson. He immediately encouraged further work on this, which later resulted in a PhD thesis
and two papers published on the subject. His contribution and encouragement is gratefully acknowledged.
REFERENCES
Australian Geomechanics Society (AGS) (2007) Landslide risk Management: Guidelines. ASG, 42, 13-35
Hudson, J, 1992. Rock Engineering Systems: Theory and Practice. Ellis Horwood, Chichester, UK
Sigtryggsdottir, F.G.; Snæbjörnsson, J.; Grande, L.; Sigbjörnsson, R. (2015) Methodology for geohazard
assessment for hydropower projects. Natural Hazards 2015 ;Volum 79.(2) s. 1299-1331.
Sigtryggsdottir, F.G.; Snæbjörnsson, J.; Grande, L.; Sigbjörnsson, R. (2016) Interrelations in multi-source
geohazard monitoring for safety management of infrastructure systems. Structure and Infrastructure
Engineering 2016 ;Volum 12.(3) s. 327-355.