system interacon complexity metrics and the … webinar 2_28_2011.pdf · system interacon...
TRANSCRIPT
System Interac-on Complexity Metrics and The Applica-on to Embedded So;ware Systems
Qi Van Eikema Hommes, Ph.D. Research Scien7st
Engineering Systems Division Massachuse>s Ins7tute of Technology

Dr. Qi Van Eikema Hommes • Research Scien7st and Lecturer (MIT Engineering Systems Division) – Lead Instructor for ESD.33 Systems Engineering – Lead Instructor for ESD.40‐‐PDD in Spring 2010 – Co‐instructor for the PDD class in the MIT Portugal program
• 8 years of work experiences in US automo7ve companies (Ford and GM) – Senior Research Scien7st at GM R&D – Powertrain Systems Engineer at Ford
Qi Van Eikema Hommes, [email protected]
Ph.D. and M.S. in Mechanical Engineering
B.S. in Mechanical Engineering
2 © 2/28/2010
Presenta7on Outline
Research Mo7va7on Networks and Its Matrix Representa7on
Review and Compare Complexity Measures
Applica7on to Vehicle Embedded So_ware Systems
Summary
© 2/28/2010 Qi Van Eikema Hommes, [email protected] 3
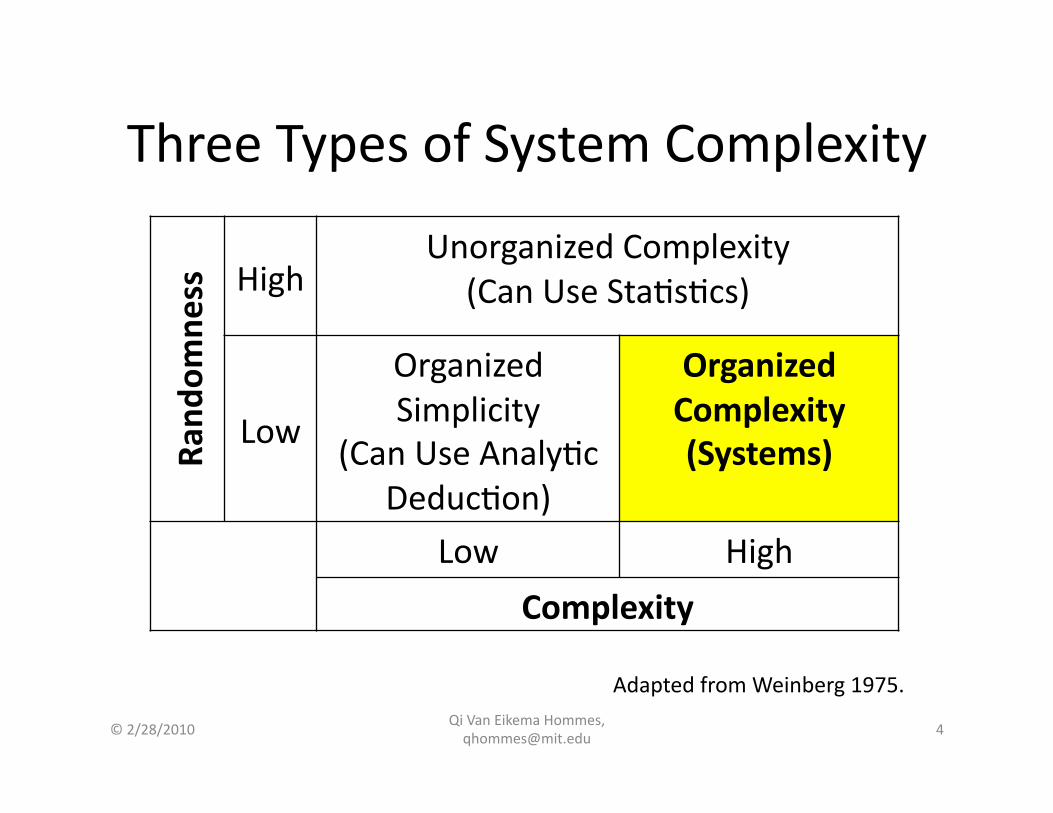
Three Types of System Complexity Ra
ndom
ness High
Unorganized Complexity (Can Use Sta7s7cs)
Low
Organized Simplicity
(Can Use Analy7c Deduc7on)
Organized Complexity (Systems)
Low High
Complexity
© 2/28/2010 Qi Van Eikema Hommes, [email protected] 4
Adapted from Weinberg 1975.
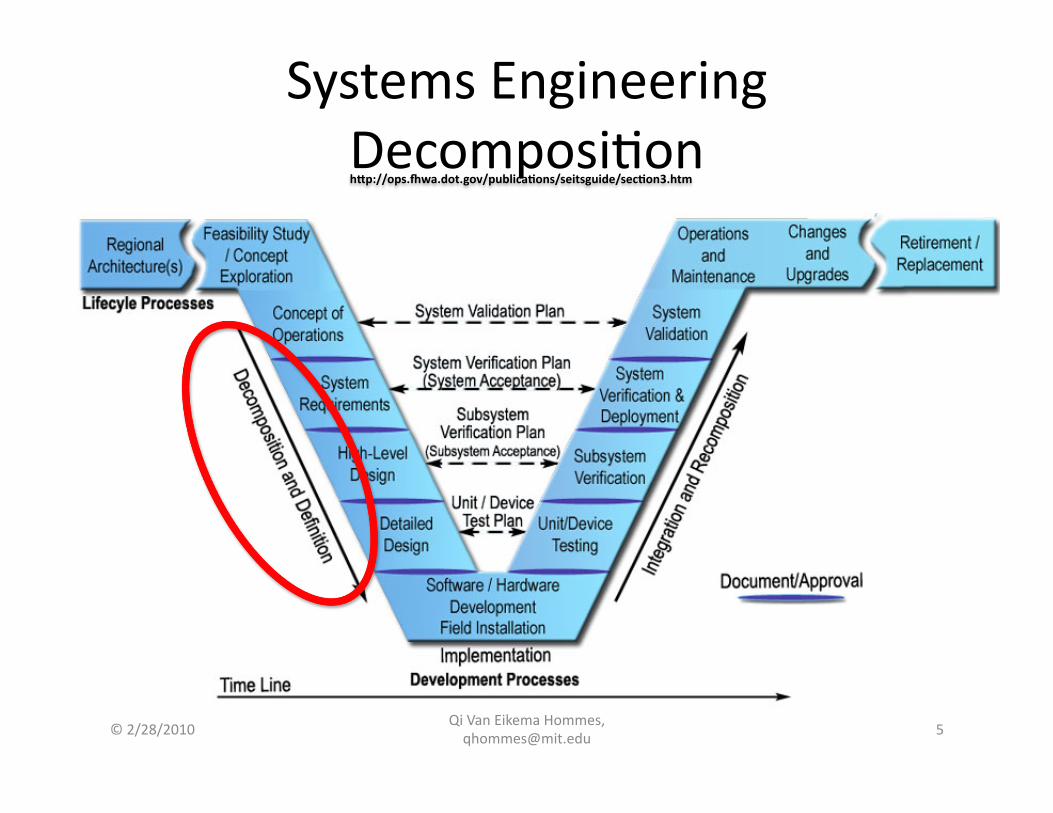
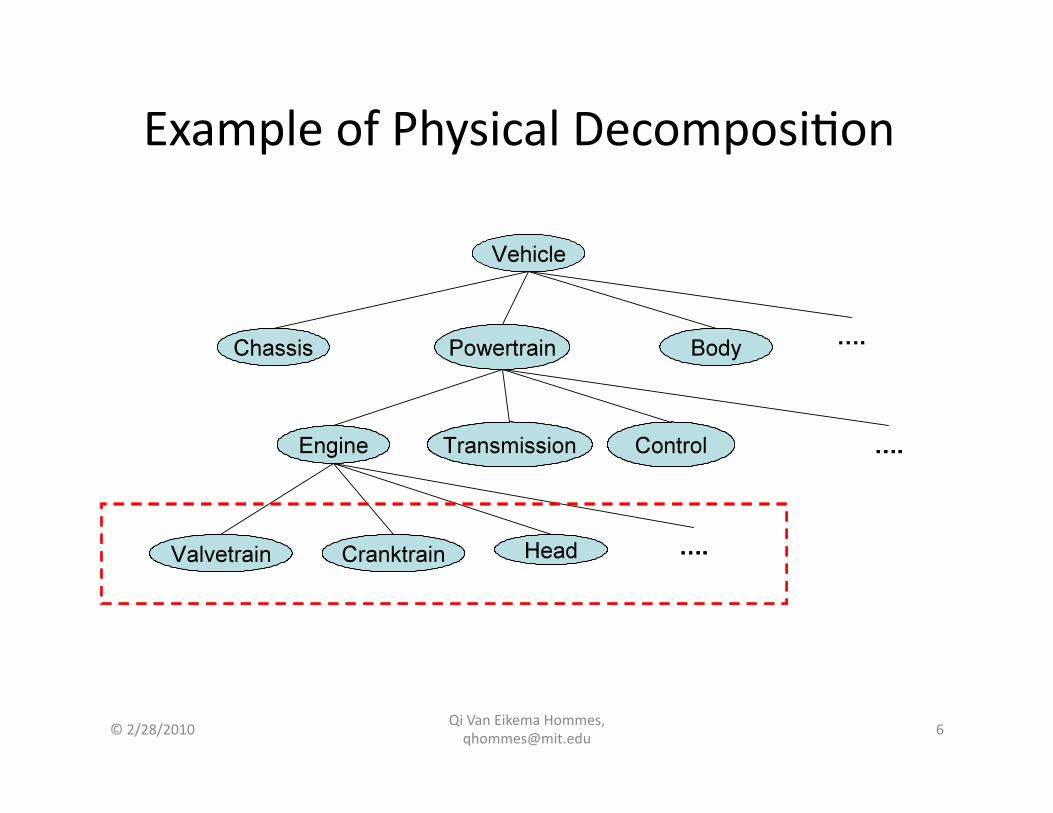
Systems Engineering Decomposi7on
Qi Van Eikema Hommes, [email protected]
hCp://ops.Gwa.dot.gov/publica-ons/seitsguide/sec-on3.htm
5 © 2/28/2010
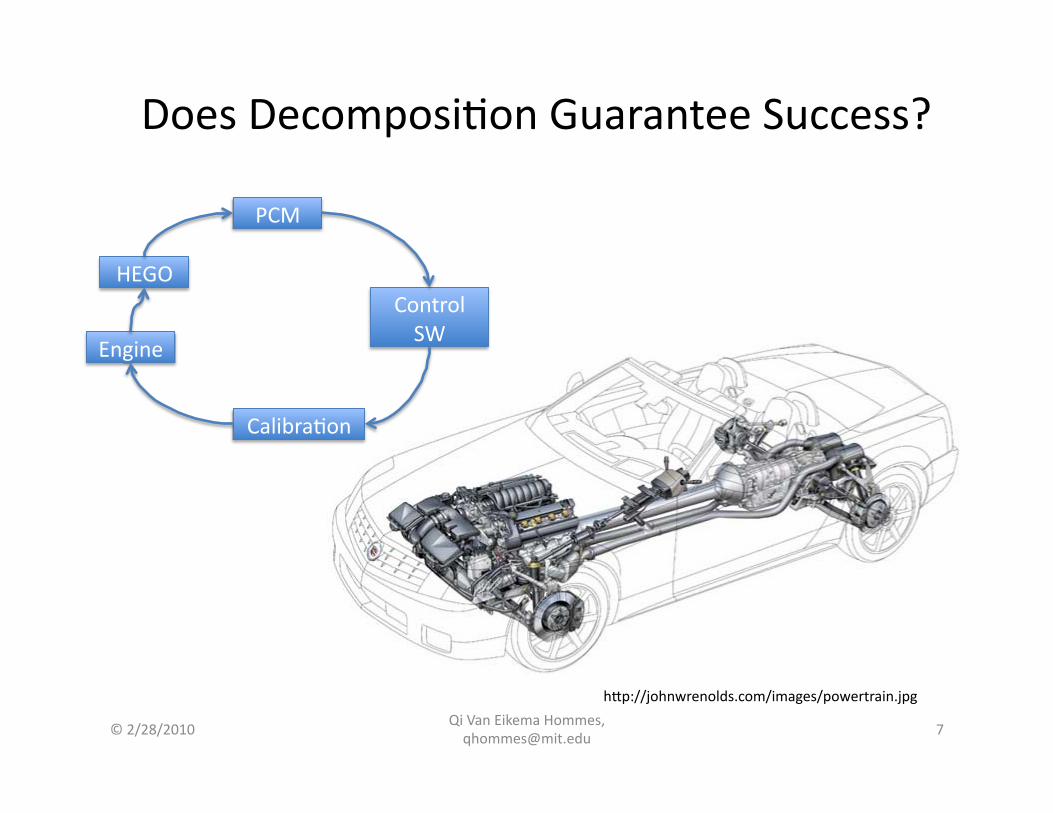
Does Decomposi7on Guarantee Success?
Qi Van Eikema Hommes, [email protected]
HEGO Control SW
PCM
Calibra7on
Engine
h>p://johnwrenolds.com/images/powertrain.jpg
© 2/28/2010 7
Emerging Proper7es of a Systems
• The whole is not equal to the sum of its parts.
– Some7mes more – Some7mes less
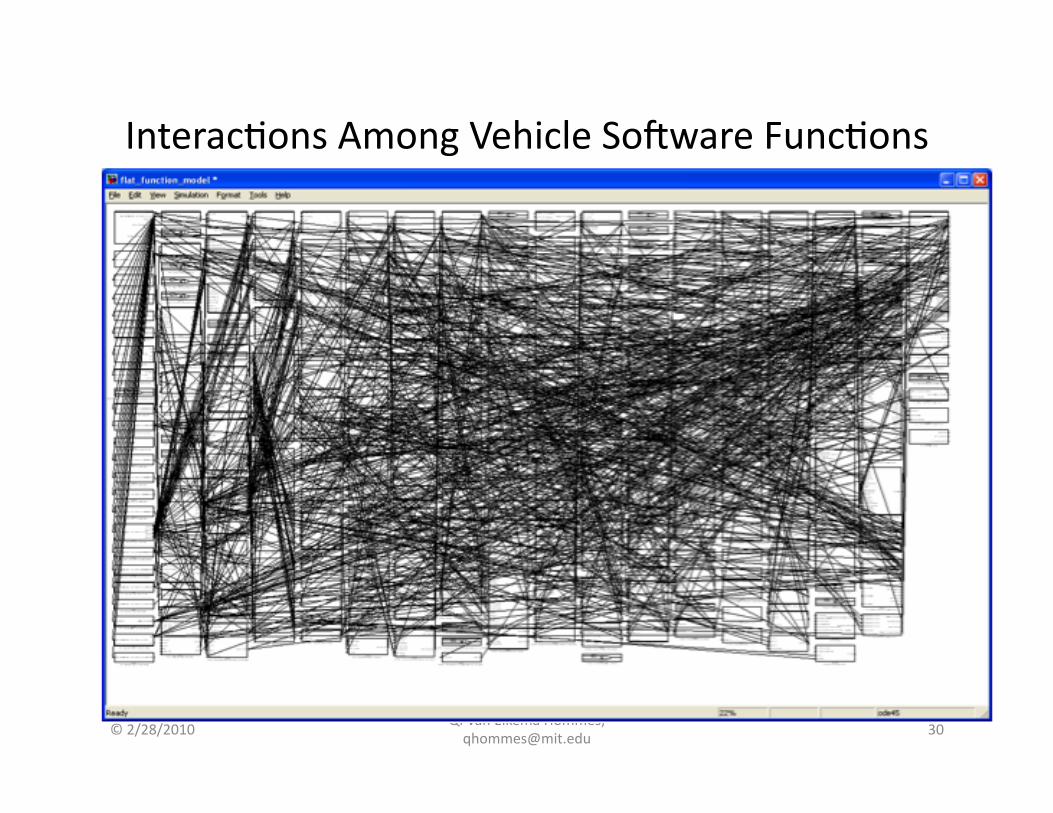
• Complex behavior of the system arise because of the interac7ons between the components of a system.
• Today’s complex systems have very large numbers of interac7ons that are beyond the human comprehension.
• More couplings more system interac7ons more emergent behaviors (some are unan7cipated and undesirable)
© 2/28/2010 Qi Van Eikema Hommes, [email protected] 8
© 2/28/2010 Qi Van Eikema Hommes, [email protected] 9
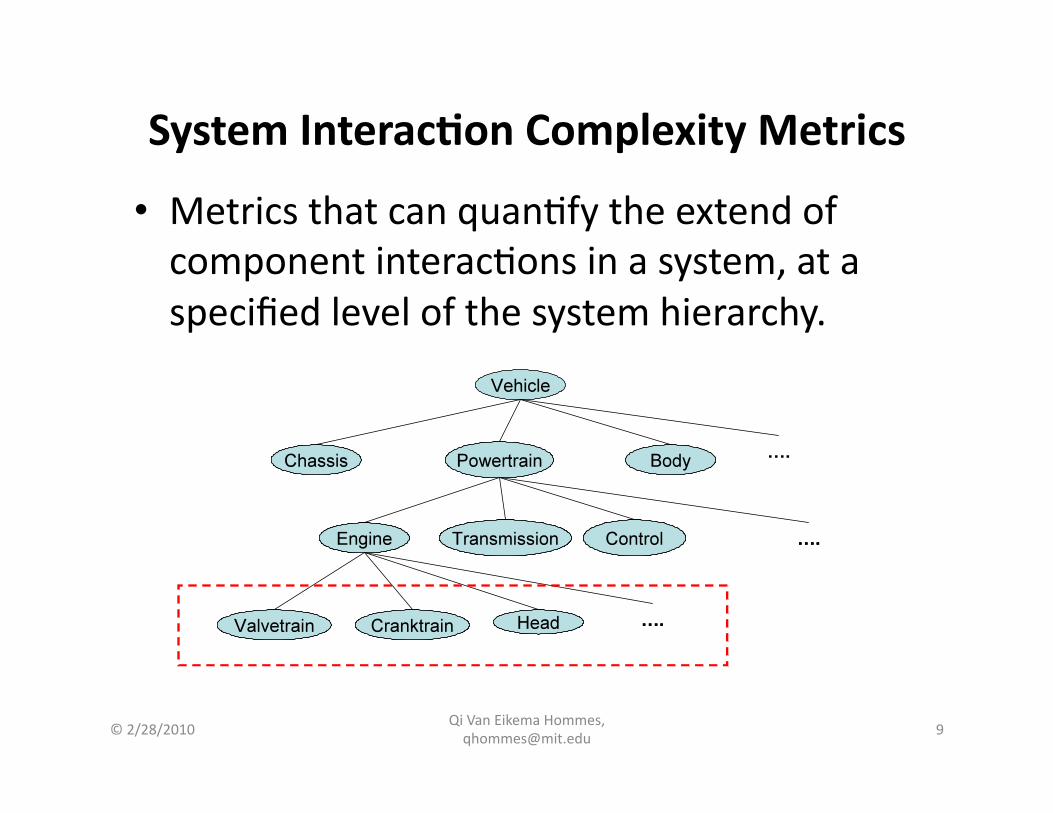
System Interac-on Complexity Metrics
• Metrics that can quan7fy the extend of component interac7ons in a system, at a specified level of the system hierarchy.
Presenta7on Outline
Research Mo7va7on Networks and Its Matrix Representa7on
Review and Compare Complexity Measures
Applica7on to Vehicle Embedded So_ware Systems
Summary
© 2/28/2010 Qi Van Eikema Hommes, [email protected] 10
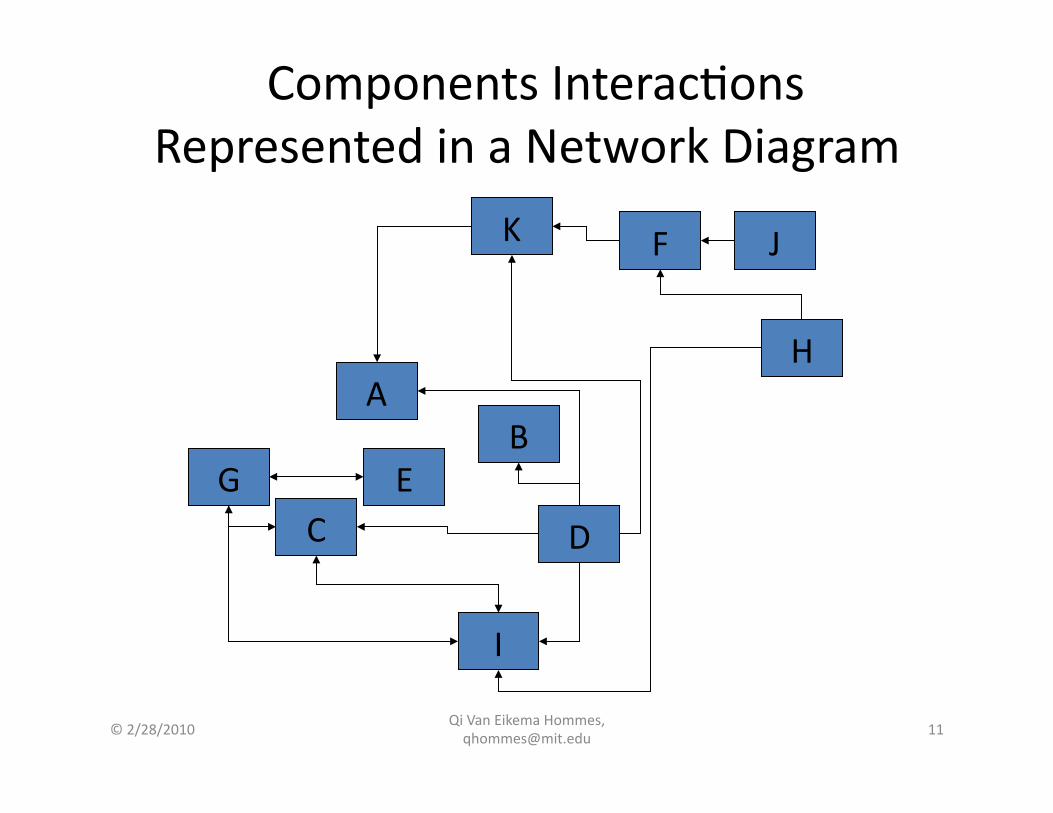
Components Interac7ons Represented in a Network Diagram
© 2/28/2010 Qi Van Eikema Hommes, [email protected] 11
A B
C D
E
F
G
H
I
J K

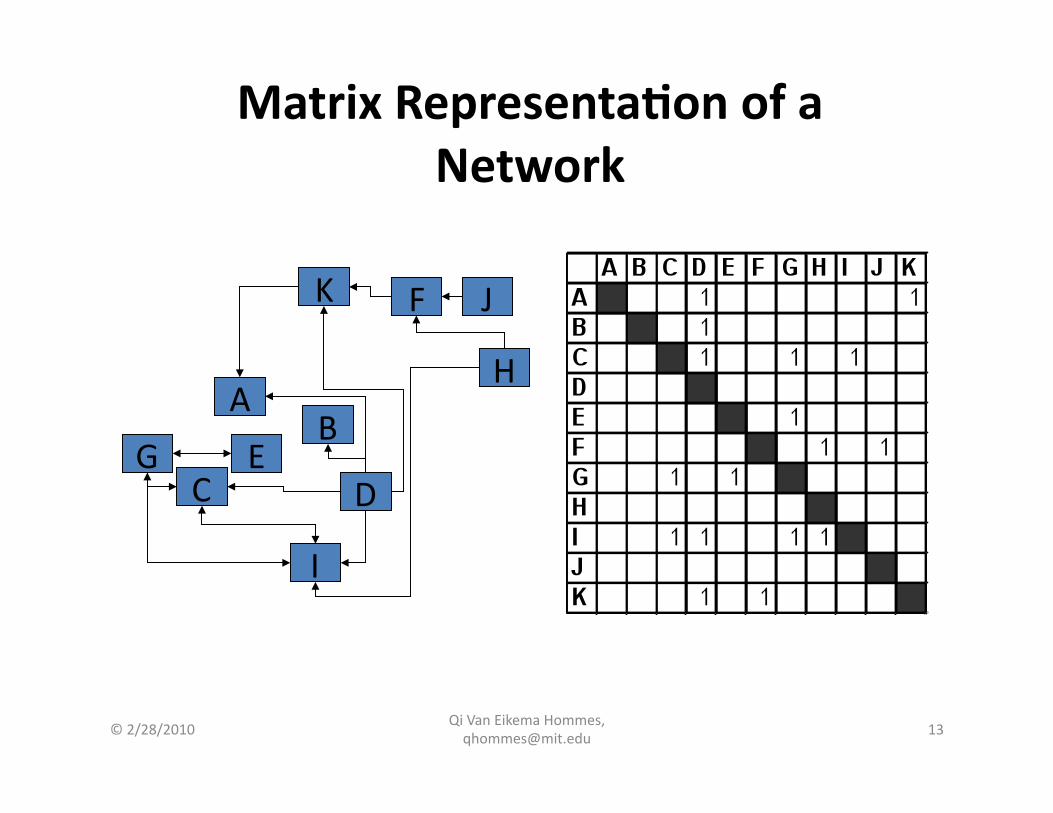
Matrix Form of the Network Diagram
• Social Network Analysis—Affilia7on Matrix • Mathema7cs and Computer Science—Adjacency Matrix
• Product Design and Development—Design Structure Matrix
© 2/28/2010 Qi Van Eikema Hommes, [email protected] 12
© 2/28/2010 Qi Van Eikema Hommes, [email protected] 13
Matrix Representa-on of a Network
A B
C D E
F
G
H
I
J K
Presenta7on Outline
Research Mo7va7on Networks and Its Matrix Representa7on
Review and Compare Complexity Measures
Applica7on to Vehicle Embedded So_ware Systems
Summary
© 2/28/2010 Qi Van Eikema Hommes, [email protected] 14
© 2/28/2010 Qi Van Eikema Hommes, [email protected] 15
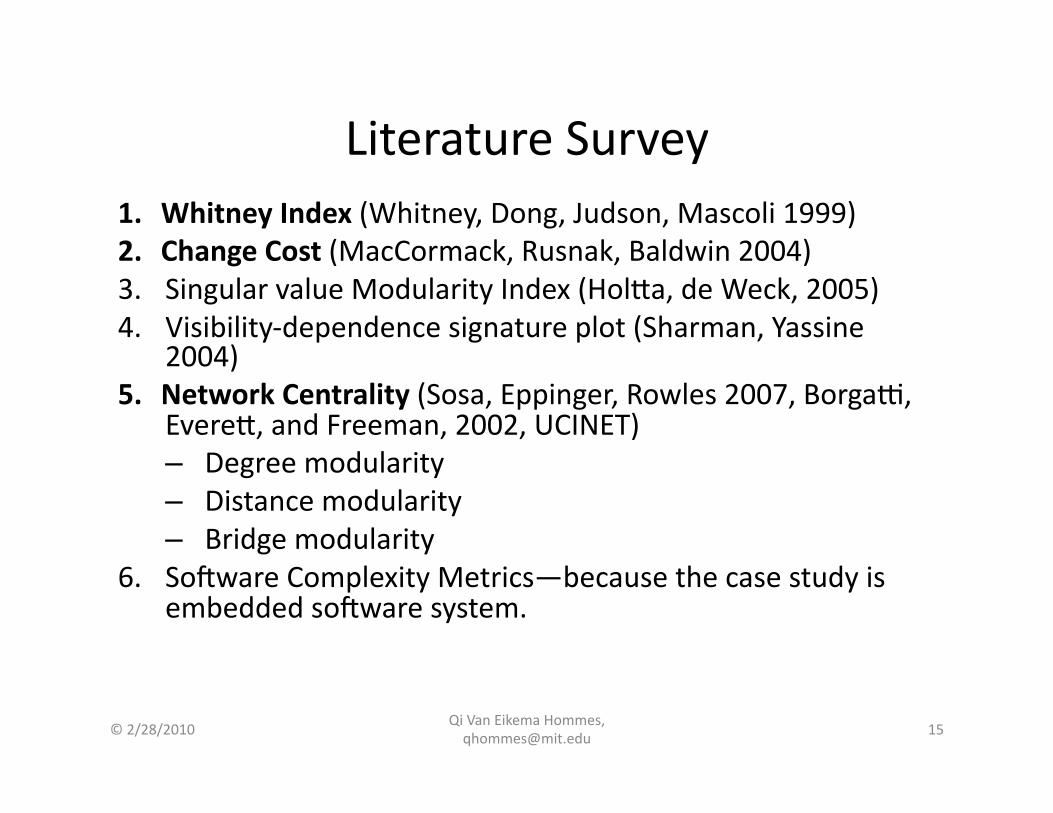
Literature Survey 1. Whitney Index (Whitney, Dong, Judson, Mascoli 1999) 2. Change Cost (MacCormack, Rusnak, Baldwin 2004) 3. Singular value Modularity Index (Hol>a, de Weck, 2005) 4. Visibility‐dependence signature plot (Sharman, Yassine
2004) 5. Network Centrality (Sosa, Eppinger, Rowles 2007, Borgap,
Evere>, and Freeman, 2002, UCINET) – Degree modularity – Distance modularity – Bridge modularity
6. So_ware Complexity Metrics—because the case study is embedded so_ware system.
© 2/28/2010 Qi Van Eikema Hommes, [email protected] 16
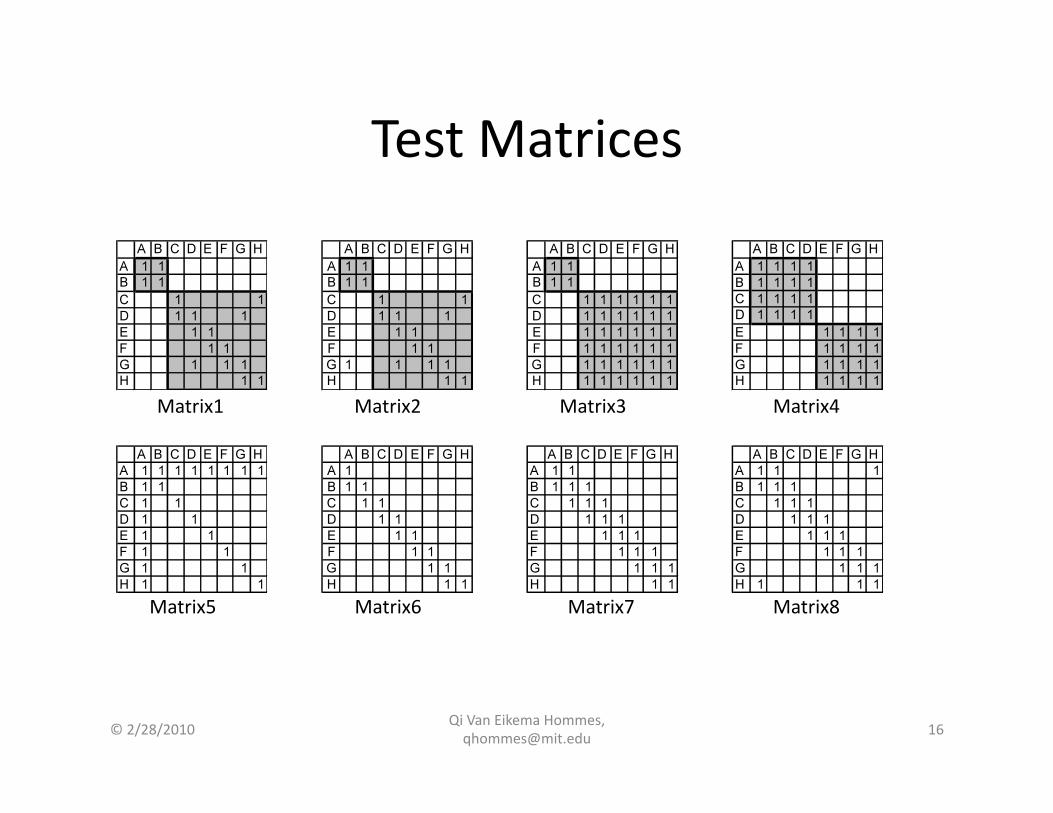
Test Matrices
Matrix1 Matrix2 Matrix3 Matrix4
Matrix5 Matrix6 Matrix7 Matrix8
© 2/28/2010 Qi Van Eikema Hommes, [email protected] 17
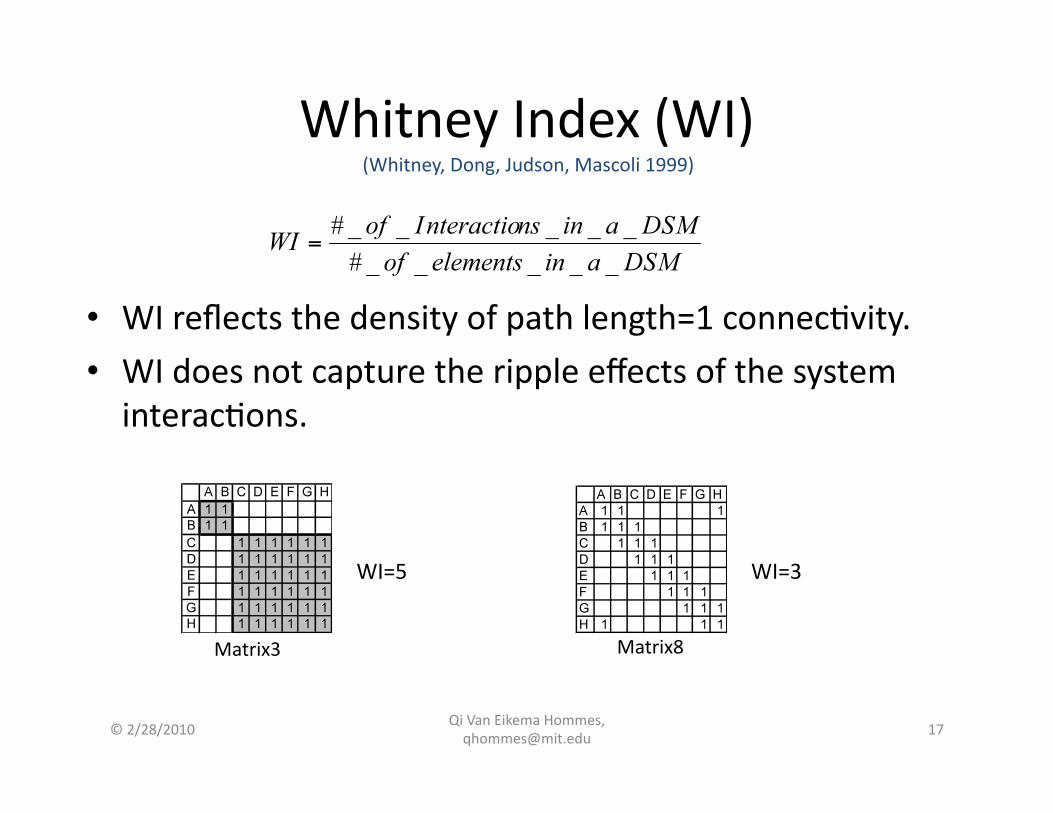
Whitney Index (WI) (Whitney, Dong, Judson, Mascoli 1999)
Matrix3 Matrix8
• WI reflects the density of path length=1 connec7vity.
• WI does not capture the ripple effects of the system interac7ons.
WI=5 WI=3
© 2/28/2010 Qi Van Eikema Hommes, [email protected] 18
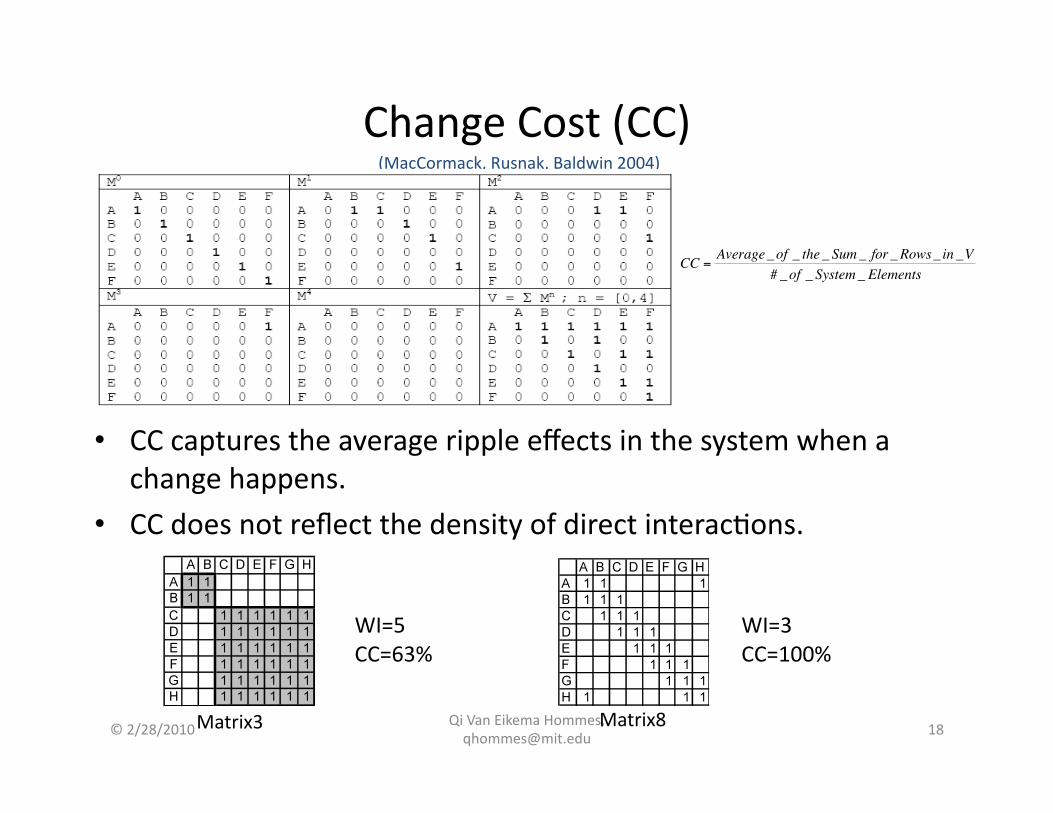
Change Cost (CC)
€
CC =Average_of _ the_ Sum _ for_Rows_ in _V
# _of _ System_ Elements
(MacCormack, Rusnak, Baldwin 2004)
• CC captures the average ripple effects in the system when a change happens.
• CC does not reflect the density of direct interac7ons.
Matrix3 Matrix8
WI=5 CC=63%
WI=3 CC=100%
© 2/28/2010 Qi Van Eikema Hommes, [email protected] 19
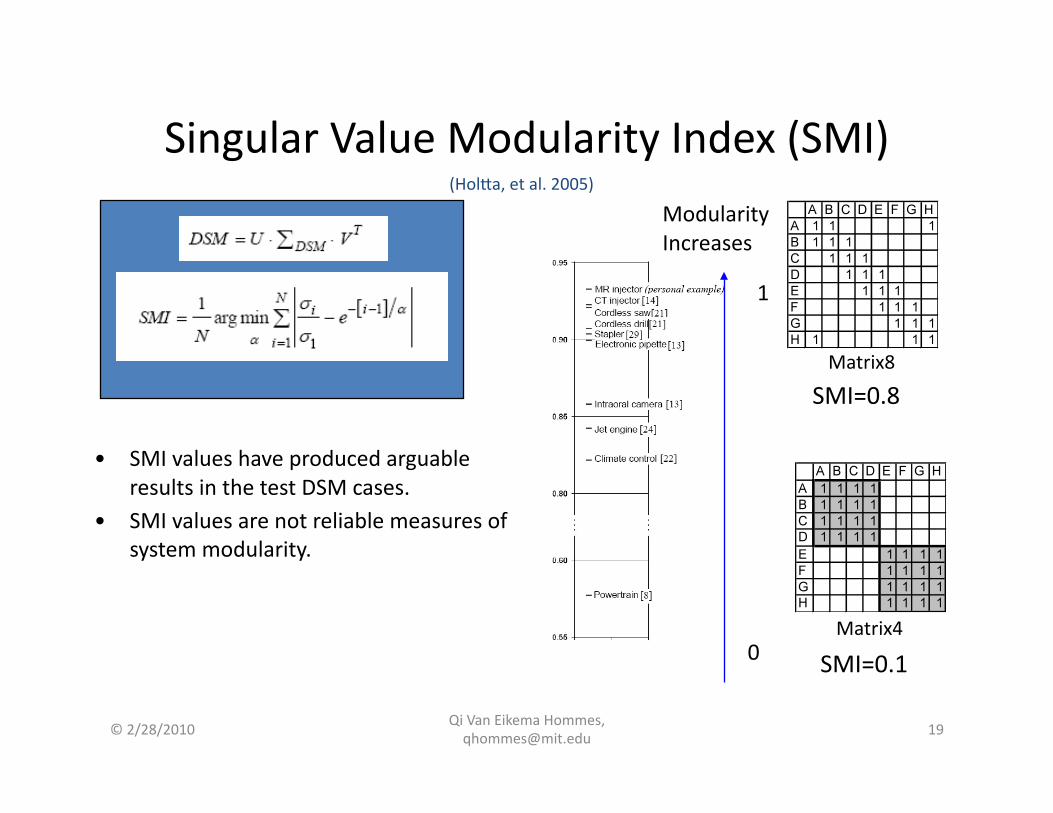
Singular Value Modularity Index (SMI) (Hol>a, et al. 2005)
Matrix4
SMI=0.1
Matrix8
SMI=0.8
Modularity Increases
0
1
• SMI values have produced arguable results in the test DSM cases.
• SMI values are not reliable measures of system modularity.
© 2/28/2010 Qi Van Eikema Hommes, [email protected] 20
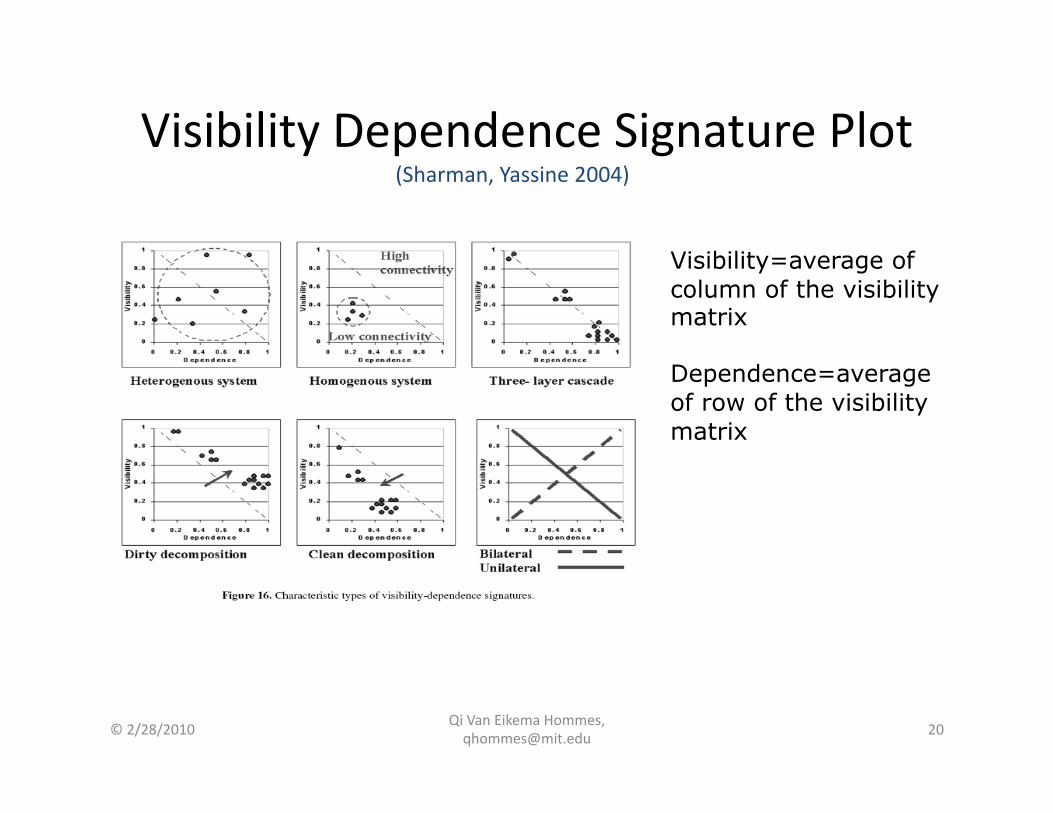
Visibility Dependence Signature Plot
Visibility=average of column of the visibility matrix
Dependence=average of row of the visibility matrix
(Sharman, Yassine 2004)
© 2/28/2010 Qi Van Eikema Hommes, [email protected] 21
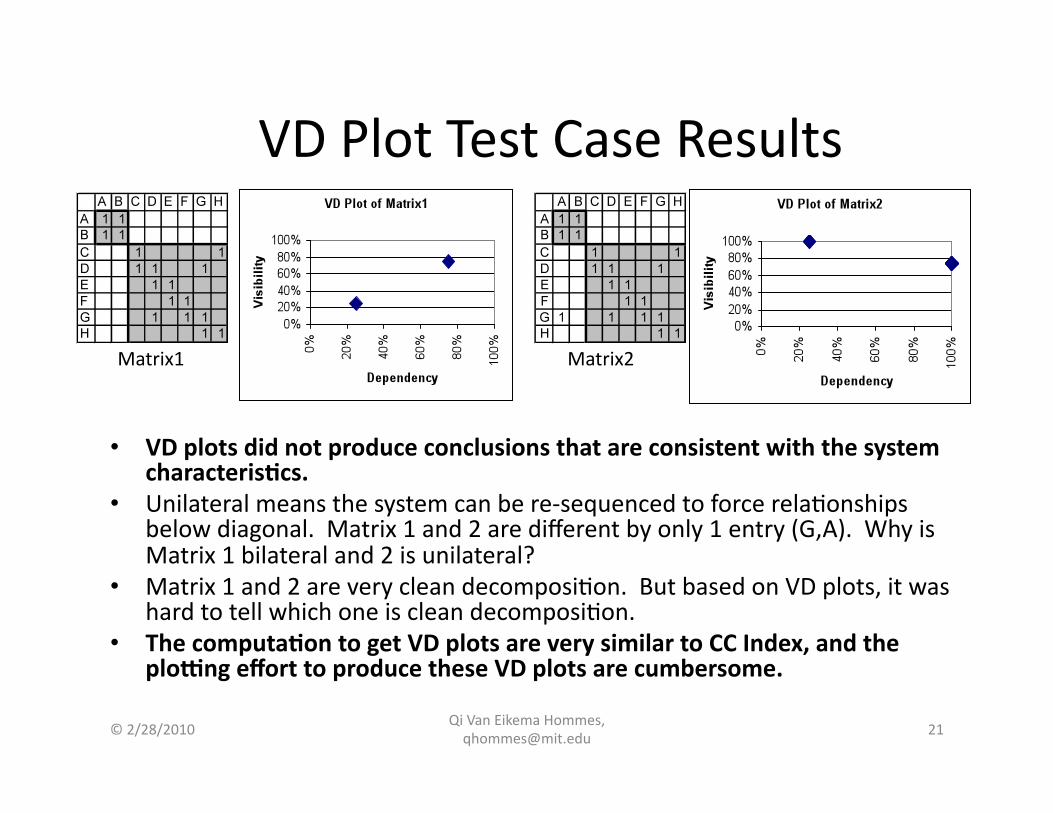
VD Plot Test Case Results
• VD plots did not produce conclusions that are consistent with the system characteris-cs.
• Unilateral means the system can be re‐sequenced to force rela7onships below diagonal. Matrix 1 and 2 are different by only 1 entry (G,A). Why is Matrix 1 bilateral and 2 is unilateral?
• Matrix 1 and 2 are very clean decomposi7on. But based on VD plots, it was hard to tell which one is clean decomposi7on.
• The computa-on to get VD plots are very similar to CC Index, and the ploUng effort to produce these VD plots are cumbersome.
Matrix1 Matrix2
© 2/28/2010 Qi Van Eikema Hommes, [email protected] 22
Network Centrality
• Network centrality metrics can iden7fy the few elements that have the largest impact on the system.
• If the network has central players, the network may be bus‐modular.
• If the network does not have central player, the network system is either not connected, or highly integral.
• Central players can be the priority for system complexity reduc7on strategy.
(Sosa, Eppinger, Rowles 2007, Borgap, Evere>, and Freeman, 2002, UCINET)

© 2/28/2010 Qi Van Eikema Hommes, [email protected] 23
Network Centrality—Degree Centrality
In degree—how many others pass information to the element of interest. Out degree—how many others depend on the element of interest for information.
Degree Centrality identifies which few elements, if any, in the system have a central effect on the rest of the systems.
By its definition, the overall system centrality measures doesn’t correlate well with components interaction complexity.
(Sosa, Eppinger, Rowles 2007, Borgap, Evere>, and Freeman, 2002, UCINET)
Matrix4
Matrix5
Matrix8
© 2/28/2010 Qi Van Eikema Hommes, [email protected] 24
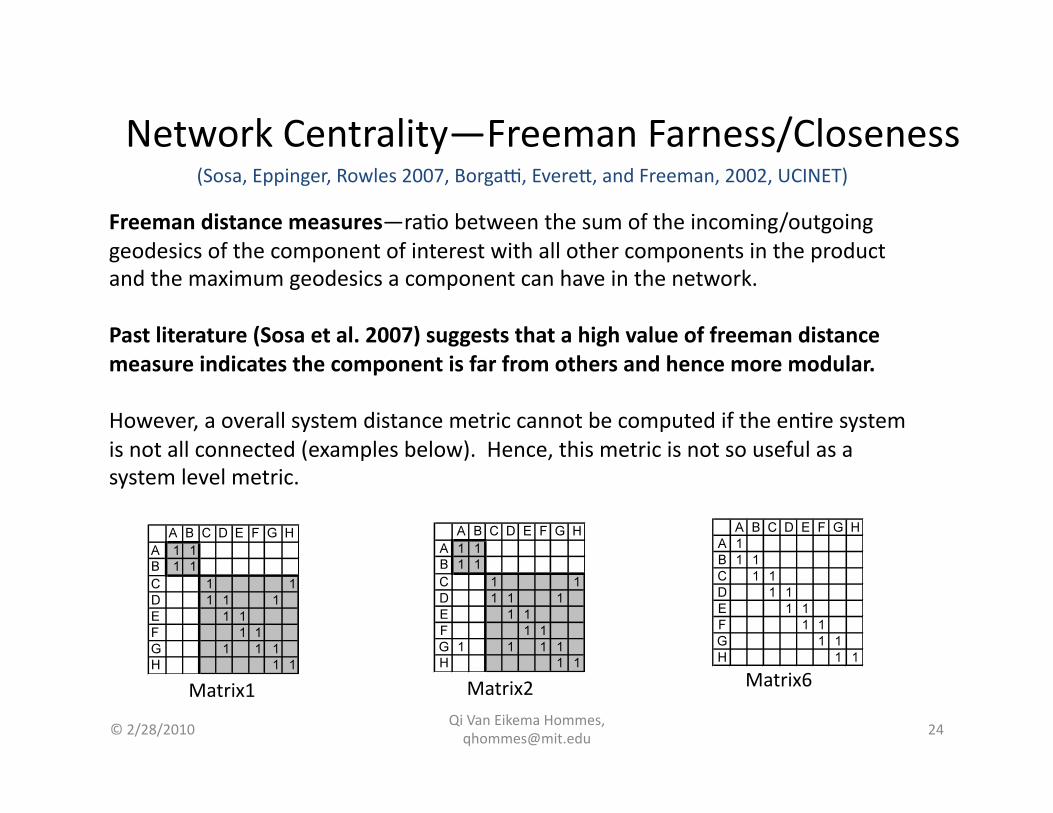
Network Centrality—Freeman Farness/Closeness
Freeman distance measures—ra7o between the sum of the incoming/outgoing geodesics of the component of interest with all other components in the product and the maximum geodesics a component can have in the network.
Past literature (Sosa et al. 2007) suggests that a high value of freeman distance measure indicates the component is far from others and hence more modular.
However, a overall system distance metric cannot be computed if the en7re system is not all connected (examples below). Hence, this metric is not so useful as a system level metric.
(Sosa, Eppinger, Rowles 2007, Borgap, Evere>, and Freeman, 2002, UCINET)
Matrix1 Matrix2 Matrix6
© 2/28/2010 Qi Van Eikema Hommes, [email protected] 25
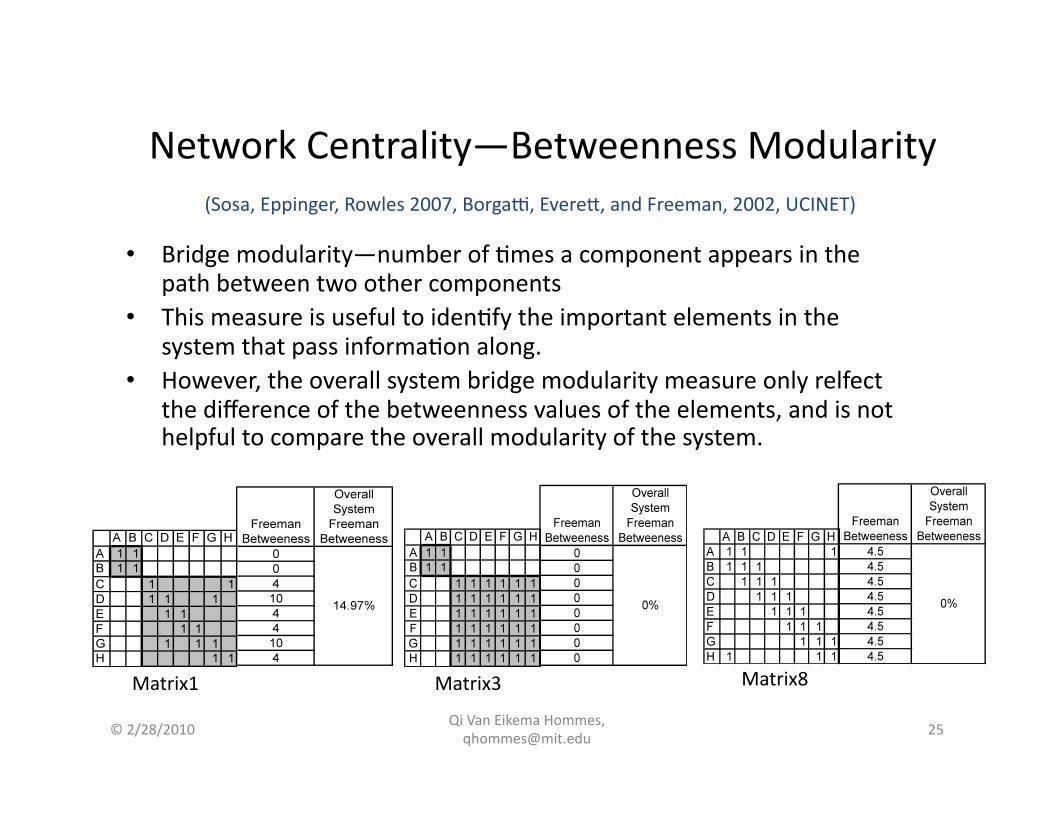
Network Centrality—Betweenness Modularity
• Bridge modularity—number of 7mes a component appears in the path between two other components
• This measure is useful to iden7fy the important elements in the system that pass informa7on along.
• However, the overall system bridge modularity measure only relfect the difference of the betweenness values of the elements, and is not helpful to compare the overall modularity of the system.
(Sosa, Eppinger, Rowles 2007, Borgap, Evere>, and Freeman, 2002, UCINET)
Matrix3 Matrix8 Matrix1

So_ware Complexity Metrics • Measuring Lexical En77es in a So_ware Program:
– The number of lines of code (LOC) – McCabe’s Cycloma7c Complexity (McCabe 1976)‐‐the number of
linearly independent execu7on paths through the program. – Halstead metrics (Halstead 1977)—a func7on of the number of
operators and operands in the program. – These three metrics are all computed based on the lexical en77es in a
program, and hence correlate to one another very well (Kearny 1986). However, these metrics are measures only at the so_ware code level. The purpose of this research is to study the architecture decision’s implica7on on module interac7on complexity. Hence these three metrics don’t apply.
• Measuring Structure of the So_ware Program (Henry and Kafura 1984): – Length * (fan‐in * fan‐out) ^2 – However, the length of the code is undefined at architecture level. – Fan‐in and fan‐out measures are captured in the WI.
© 2/28/2010 Qi Van Eikema Hommes, [email protected] 27
Presenta7on Outline
Research Mo7va7on Networks and Its Matrix Representa7on
Review and Compare Complexity Measures
Applica7on to Vehicle Embedded So_ware Systems
Summary
© 2/28/2010 Qi Van Eikema Hommes, [email protected] 28
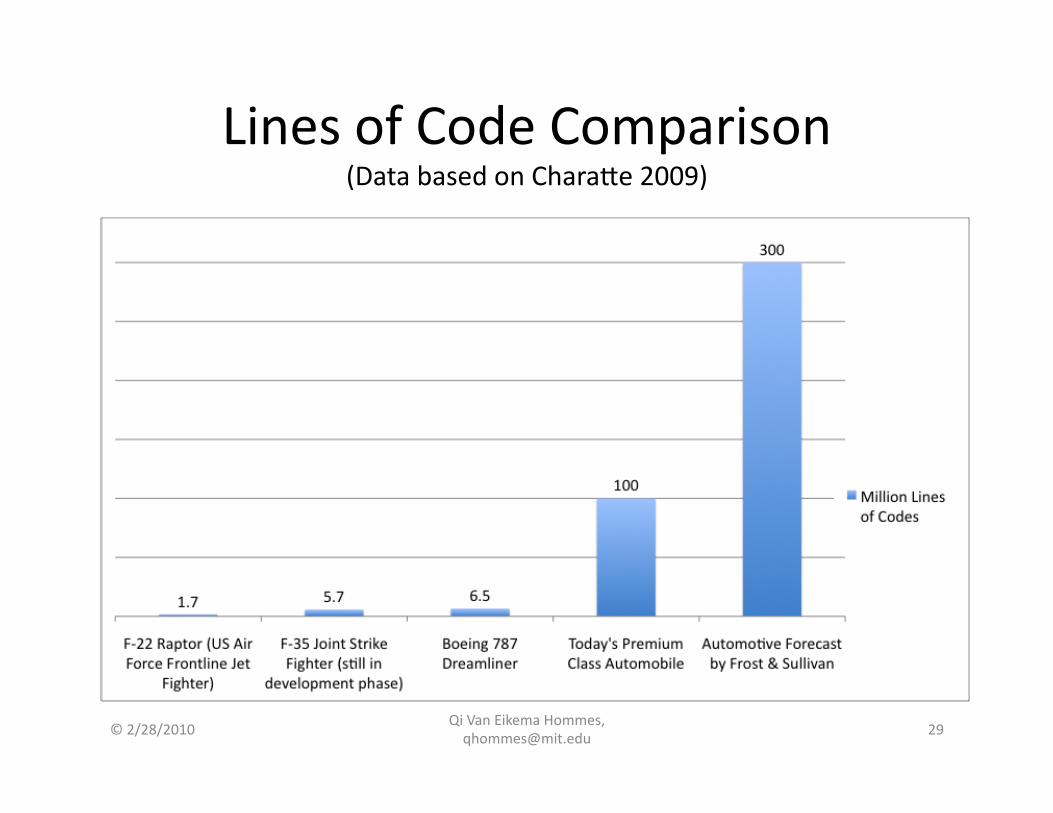
Lines of Code Comparison (Data based on Chara>e 2009)
© 2/28/2010 Qi Van Eikema Hommes, [email protected] 29
31
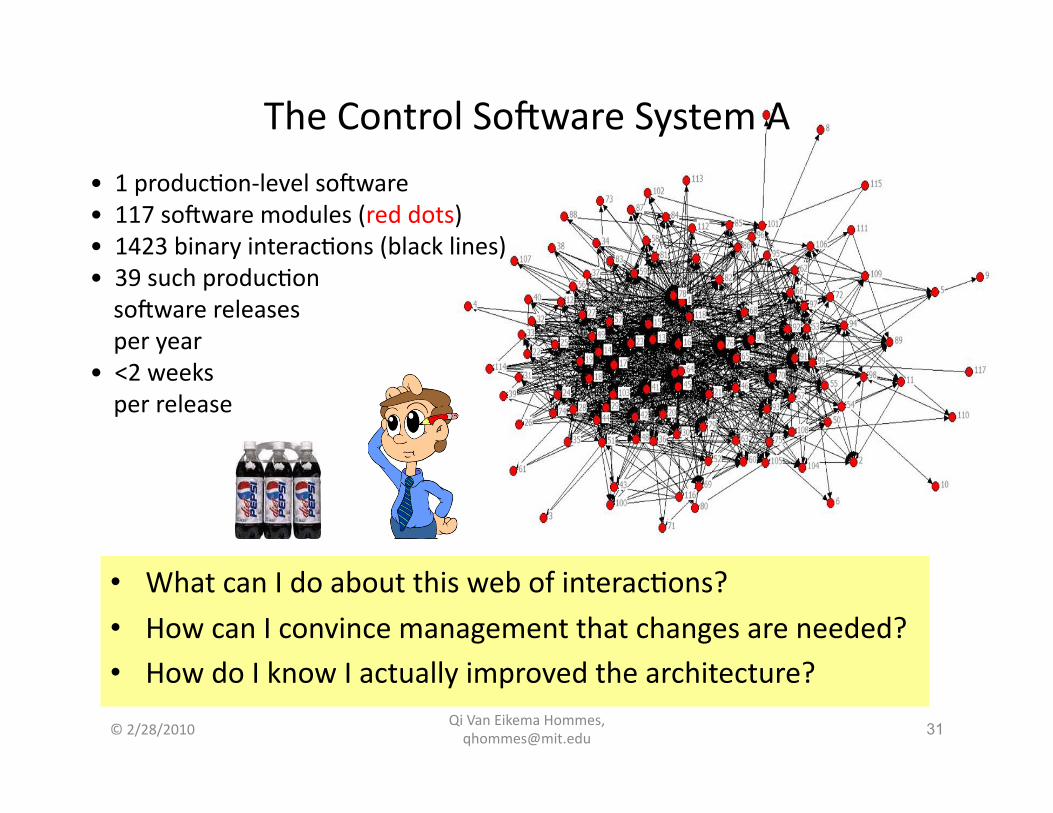
The Control So_ware System A
• What can I do about this web of interac7ons?
• How can I convince management that changes are needed? • How do I know I actually improved the architecture?
• 1 produc7on‐level so_ware • 117 so_ware modules (red dots) • 1423 binary interac7ons (black lines) • 39 such produc7on so_ware releases per year • <2 weeks per release
© 2/28/2010 Qi Van Eikema Hommes, [email protected]
© 2/28/2010 Qi Van Eikema Hommes, [email protected] 32
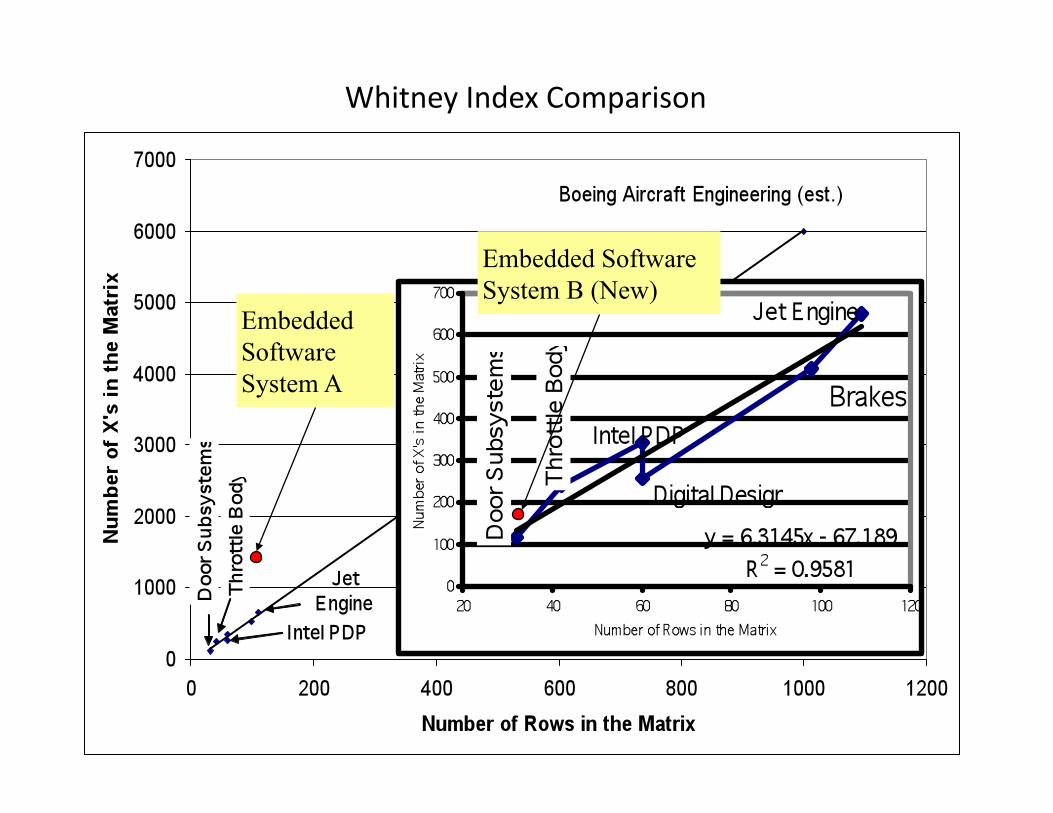
Whitney Index Comparison
Embedded Software System A
Embedded Software System B (New)
© 2/28/2010 Qi Van Eikema Hommes, [email protected] 33
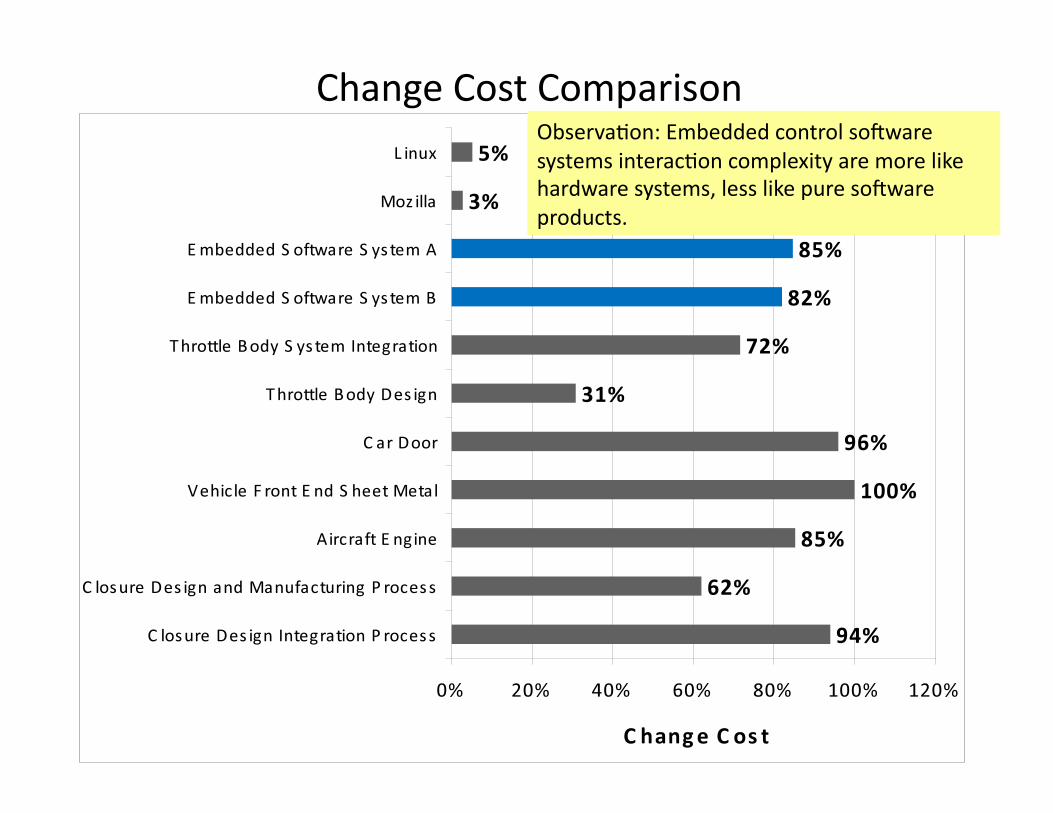
Change Cost Comparison Observa7on: Embedded control so_ware systems interac7on complexity are more like hardware systems, less like pure so_ware products.
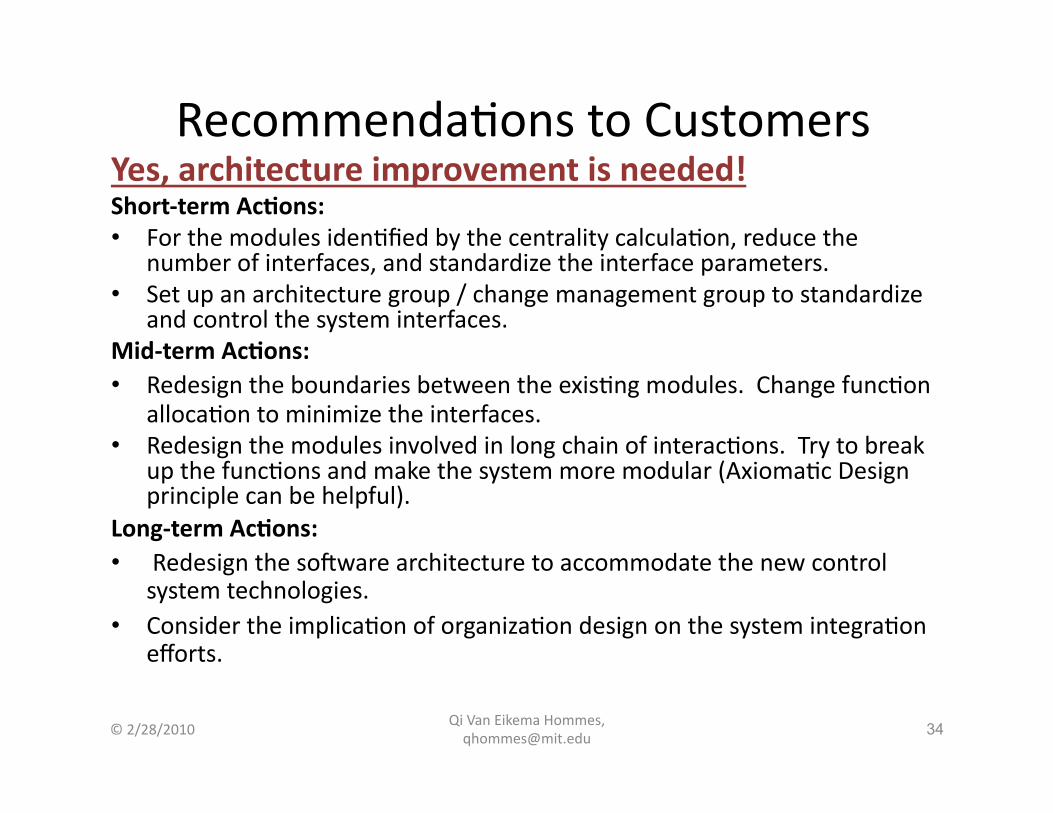
Recommenda7ons to Customers Yes, architecture improvement is needed! Short‐term Ac-ons: • For the modules iden7fied by the centrality calcula7on, reduce the
number of interfaces, and standardize the interface parameters. • Set up an architecture group / change management group to standardize
and control the system interfaces. Mid‐term Ac-ons: • Redesign the boundaries between the exis7ng modules. Change func7on
alloca7on to minimize the interfaces. • Redesign the modules involved in long chain of interac7ons. Try to break
up the func7ons and make the system more modular (Axioma7c Design principle can be helpful).
Long‐term Ac-ons: • Redesign the so_ware architecture to accommodate the new control
system technologies. • Consider the implica7on of organiza7on design on the system integra7on
efforts.
34 © 2/28/2010 Qi Van Eikema Hommes, [email protected]
Conclusions • This research work iden7fied two metrics that can describe the characteris7cs of component interac7ons in a complex system: – The Whitney Index (WI) – The Change Cost (CC)
• Network centrality analysis can iden7fy elements in the system that contributes to high interac7on complexity.
• The case study demonstrated successful applica7on of these metrics in real industry examples.
© 2/28/2010 Qi Van Eikema Hommes, [email protected] 35
Future Research Ques7ons • Need more case study examples of embedded so_ware systems.
• Are embedded so_ware systems fundamentally more complex than IT so_ware systems? Why?
• What design methods can be used to improve embedded so_ware system complexity?
• Do these measures of complexity correlate with: – number of errors in system integra7on? – resources needed for system design? – number of failures/quality problems during system opera7on?
© 2/28/2010 Qi Van Eikema Hommes, [email protected] 36
References • Van Eikema Hommes, Q. “System Interac7on Complexity Metrics and The Applica7on to Embedded So_ware Systems.” Research in Engineering Design, submi>ed for review in November 2010.
• Van Eikema Hommes, Q. “Comparison and Applica7on Of Metrics That Define The Components Modularity in Complex Products.” ASME IDETC 2008 – DTM 49140.
© 2/28/2010 Qi Van Eikema Hommes, [email protected] 37