system integration and modeling of a fuel cell vehicle - virginia tech
TRANSCRIPT

Systems Integration, Modeling, and Validation of a Fuel Cell Hybrid Electric Vehicle
by Michael James Ogburn
Thesis submitted to the Faculty of Virginia Polytechnic Institute and State University
in partial fulfillment of the requirements for the degree of Master of Science in
Mechanical Engineering
Dr. Douglas J. Nelson
Dr. Charles F. Reinholtz
Dr. Michael R. von Spakovsky
May 4, 2000
Blacksburg, Virginia
Key Words:
Fuel Cell, System Integration, Hybrid Electric Vehicle, Simulation, Modeling
Copyright 2000, Michael J. Ogburn
ii
Systems Integration, Modeling, and Validation of a Fuel Cell Hybrid Electric Vehicle
Michael J. Ogburn
ABSTRACT
The goals of the research documented in this thesis were the design, construction, modeling,
and validation of a fuel cell hybrid electric vehicle. Over 60 engineering students, working
together as the Hybrid Electric Vehicle Team of Virginia Tech (HEVT), integrated a proton
exchange membrane fuel cell system into a series hybrid electric vehicle. This design
produced an efficient and truly zero-emission vehicle converted from a five-passenger
production sedan. This 1997 Chevrolet Lumina sedan, renamed ANIMUL H2, carries an
advanced fuel cell powertrain that includes an efficient AC induction drivetrain, regenerative
braking, compressed hydrogen fuel storage, and an advanced lead-acid battery pack for peak
power load leveling. The vehicle weighed 2000 kg (4400 lb) and achieved a combined
city/highway fuel economy of 9L/100 km or 26 mpgge (miles per gallon gasoline equivalent,
charge depleting, state of charge corrected).
A model of the vehicle is developed using ADVISOR, an Advanced Vehicle Simulator that
tracks energy flow and fuel usage within the vehicle drivetrain and energy conversion
components. The vehicle was tested using the Environmental Protection Agency city and
highway driving cycles to provide data for validation of the model. Vehicle data and model
results show good correlation at all levels and show that ADVISOR has the capability to
model fuel cell hybrid electric vehicles. To make techniques proven by this work more
versatile for real world application, Virginia Tech worked with engineers at the National
Renewable Energy Laboratory to develop a ‘generic’ version of this fuel cell system model
that was released to the public in ADVISOR 2.2. This generic model correlates well to test
data and incorporates both fuel cell stack and subsystem models. This feature allowed HEVT
to predict the benefits of adding load following subsystem control to ANIMUL H2, showing
the opportunity for a 40% fuel economy improvement.

iii
ACKNOWLEDGEMENTS
This work was sponsored by the U.S. Department of Energy (DoE) under contract XCL-8-
18086-01 for the National Renewable Energy Laboratory. Many thanks go out to the NREL
CTTS Systems Analysis Team, especially Keith Wipke, Tony Markel, and Sam Sprik, for
helping me along the way. I would also like to thank both the U.S. DOE for selecting
Virginia Tech to receive the 20kW Energy Partners, Inc. fuel cell that has made all this work
possible, and the Energy Partners’ staff including Mike Fuchs, Walter Pierce, and Frano
Barbir, for helping us get their stack operational in our vehicle.
Special thanks are extended to my colleagues on the Hybrid Electric Vehicle Team of
Virginia Tech for participating in the single most significant educational and extracurricular
activity in my college career. Matt Merkle, John Gromatsky, Alex Boligitz, Steve Gurski, and
Paul Bryan, are just a few of the many people, past and present, that made it all possible. The
faculty and staff associated with the student projects in Mechanical Engineering, including my
advisor Dr. Doug Nelson and Ware Lab Manager Jerry Lucas, have worked tirelessly to make
projects like HEVT a valuable part of engineering education at Virginia Tech. Lastly, I owe
my family a huge thanks for supporting my education over the years. Without their influence
I would not be where I am today.
iv
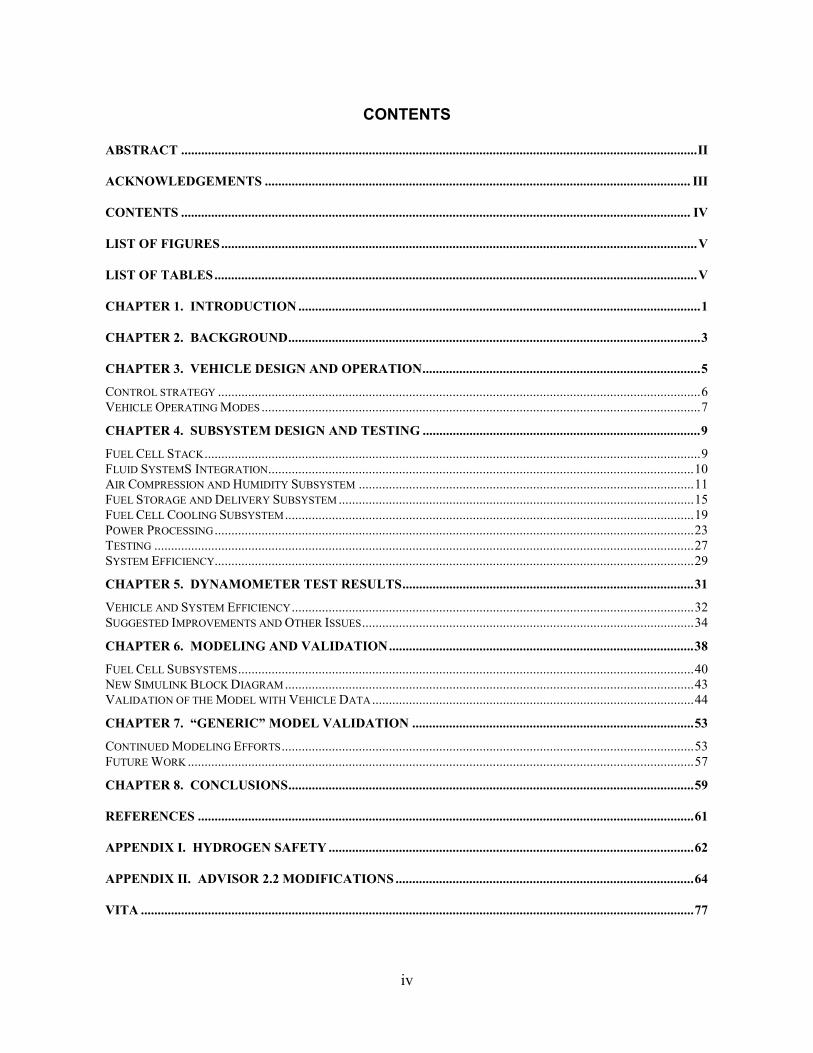
CONTENTS
ABSTRACT ..........................................................................................................................................................II
ACKNOWLEDGEMENTS ............................................................................................................................... III
CONTENTS ........................................................................................................................................................ IV
LIST OF FIGURES..............................................................................................................................................V
LIST OF TABLES................................................................................................................................................V
CHAPTER 1. INTRODUCTION ........................................................................................................................1
CHAPTER 2. BACKGROUND...........................................................................................................................3
CHAPTER 3. VEHICLE DESIGN AND OPERATION...................................................................................5
CONTROL STRATEGY ................................................................................................................................................6 VEHICLE OPERATING MODES ...................................................................................................................................7
CHAPTER 4. SUBSYSTEM DESIGN AND TESTING ...................................................................................9
FUEL CELL STACK....................................................................................................................................................9 FLUID SYSTEMS INTEGRATION...............................................................................................................................10 AIR COMPRESSION AND HUMIDITY SUBSYSTEM ....................................................................................................11 FUEL STORAGE AND DELIVERY SUBSYSTEM ..........................................................................................................15 FUEL CELL COOLING SUBSYSTEM..........................................................................................................................19 POWER PROCESSING...............................................................................................................................................23 TESTING .................................................................................................................................................................27 SYSTEM EFFICIENCY...............................................................................................................................................29
CHAPTER 5. DYNAMOMETER TEST RESULTS.......................................................................................31
VEHICLE AND SYSTEM EFFICIENCY........................................................................................................................32 SUGGESTED IMPROVEMENTS AND OTHER ISSUES...................................................................................................34
CHAPTER 6. MODELING AND VALIDATION...........................................................................................38
FUEL CELL SUBSYSTEMS........................................................................................................................................40 NEW SIMULINK BLOCK DIAGRAM ..........................................................................................................................43 VALIDATION OF THE MODEL WITH VEHICLE DATA................................................................................................44
CHAPTER 7. “GENERIC” MODEL VALIDATION ....................................................................................53
CONTINUED MODELING EFFORTS...........................................................................................................................53 FUTURE WORK .......................................................................................................................................................57
CHAPTER 8. CONCLUSIONS.........................................................................................................................59
REFERENCES ....................................................................................................................................................61
APPENDIX I. HYDROGEN SAFETY .............................................................................................................62
APPENDIX II. ADVISOR 2.2 MODIFICATIONS .........................................................................................64
VITA .....................................................................................................................................................................77
v
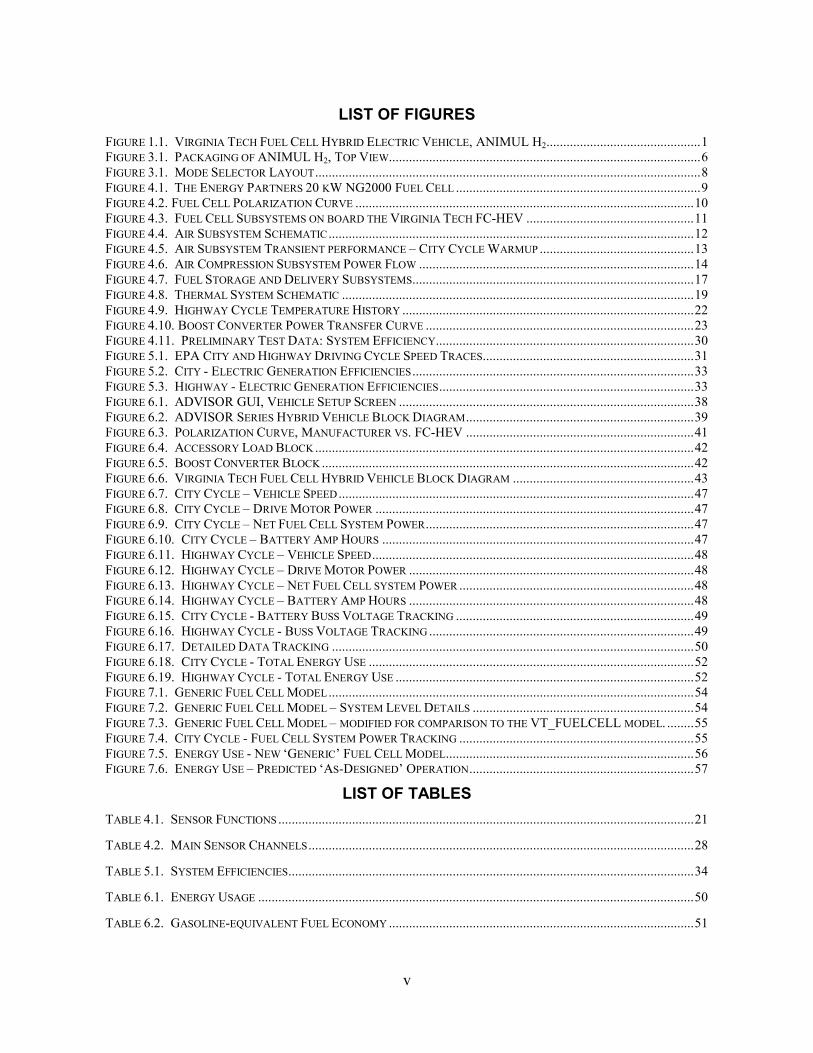
LIST OF FIGURES FIGURE 1.1. VIRGINIA TECH FUEL CELL HYBRID ELECTRIC VEHICLE, ANIMUL H2..............................................1 FIGURE 3.1. PACKAGING OF ANIMUL H2, TOP VIEW.............................................................................................6 FIGURE 3.1. MODE SELECTOR LAYOUT...................................................................................................................8 FIGURE 4.1. THE ENERGY PARTNERS 20 KW NG2000 FUEL CELL .........................................................................9 FIGURE 4.2. FUEL CELL POLARIZATION CURVE .....................................................................................................10 FIGURE 4.3. FUEL CELL SUBSYSTEMS ON BOARD THE VIRGINIA TECH FC-HEV ..................................................11 FIGURE 4.4. AIR SUBSYSTEM SCHEMATIC.............................................................................................................12 FIGURE 4.5. AIR SUBSYSTEM TRANSIENT PERFORMANCE – CITY CYCLE WARMUP ..............................................13 FIGURE 4.6. AIR COMPRESSION SUBSYSTEM POWER FLOW ..................................................................................14 FIGURE 4.7. FUEL STORAGE AND DELIVERY SUBSYSTEMS....................................................................................17 FIGURE 4.8. THERMAL SYSTEM SCHEMATIC .........................................................................................................19 FIGURE 4.9. HIGHWAY CYCLE TEMPERATURE HISTORY .......................................................................................22 FIGURE 4.10. BOOST CONVERTER POWER TRANSFER CURVE ................................................................................23 FIGURE 4.11. PRELIMINARY TEST DATA: SYSTEM EFFICIENCY.............................................................................30 FIGURE 5.1. EPA CITY AND HIGHWAY DRIVING CYCLE SPEED TRACES...............................................................31 FIGURE 5.2. CITY - ELECTRIC GENERATION EFFICIENCIES....................................................................................33 FIGURE 5.3. HIGHWAY - ELECTRIC GENERATION EFFICIENCIES............................................................................33 FIGURE 6.1. ADVISOR GUI, VEHICLE SETUP SCREEN ........................................................................................38 FIGURE 6.2. ADVISOR SERIES HYBRID VEHICLE BLOCK DIAGRAM....................................................................39 FIGURE 6.3. POLARIZATION CURVE, MANUFACTURER VS. FC-HEV ....................................................................41 FIGURE 6.4. ACCESSORY LOAD BLOCK .................................................................................................................42 FIGURE 6.5. BOOST CONVERTER BLOCK ...............................................................................................................42 FIGURE 6.6. VIRGINIA TECH FUEL CELL HYBRID VEHICLE BLOCK DIAGRAM ......................................................43 FIGURE 6.7. CITY CYCLE – VEHICLE SPEED..........................................................................................................47 FIGURE 6.8. CITY CYCLE – DRIVE MOTOR POWER ...............................................................................................47 FIGURE 6.9. CITY CYCLE – NET FUEL CELL SYSTEM POWER................................................................................47 FIGURE 6.10. CITY CYCLE – BATTERY AMP HOURS .............................................................................................47 FIGURE 6.11. HIGHWAY CYCLE – VEHICLE SPEED................................................................................................48 FIGURE 6.12. HIGHWAY CYCLE – DRIVE MOTOR POWER .....................................................................................48 FIGURE 6.13. HIGHWAY CYCLE – NET FUEL CELL SYSTEM POWER ......................................................................48 FIGURE 6.14. HIGHWAY CYCLE – BATTERY AMP HOURS .....................................................................................48 FIGURE 6.15. CITY CYCLE - BATTERY BUSS VOLTAGE TRACKING .......................................................................49 FIGURE 6.16. HIGHWAY CYCLE - BUSS VOLTAGE TRACKING ...............................................................................49 FIGURE 6.17. DETAILED DATA TRACKING ............................................................................................................50 FIGURE 6.18. CITY CYCLE - TOTAL ENERGY USE .................................................................................................52 FIGURE 6.19. HIGHWAY CYCLE - TOTAL ENERGY USE .........................................................................................52 FIGURE 7.1. GENERIC FUEL CELL MODEL.............................................................................................................54 FIGURE 7.2. GENERIC FUEL CELL MODEL – SYSTEM LEVEL DETAILS ..................................................................54 FIGURE 7.3. GENERIC FUEL CELL MODEL – MODIFIED FOR COMPARISON TO THE VT_FUELCELL MODEL. ........55 FIGURE 7.4. CITY CYCLE - FUEL CELL SYSTEM POWER TRACKING ......................................................................55 FIGURE 7.5. ENERGY USE - NEW ‘GENERIC’ FUEL CELL MODEL..........................................................................56 FIGURE 7.6. ENERGY USE – PREDICTED ‘AS-DESIGNED’ OPERATION...................................................................57
LIST OF TABLES TABLE 4.1. SENSOR FUNCTIONS ............................................................................................................................21
TABLE 4.2. MAIN SENSOR CHANNELS...................................................................................................................28
TABLE 5.1. SYSTEM EFFICIENCIES.........................................................................................................................34
TABLE 6.1. ENERGY USAGE ..................................................................................................................................50
TABLE 6.2. GASOLINE-EQUIVALENT FUEL ECONOMY ...........................................................................................51

1
CHAPTER 1. INTRODUCTION
Hybrid electric vehicles (HEV’s) combine the benefits of several propulsion subsystems in an
attempt to produce a more efficient vehicle. A common approach to hybrid vehicle design
takes a conventional vehicle drivetrain and combines it with subsystems commonly found in
an electric vehicle. In this type of vehicle, a gasoline engine might be augmented by an
electric motor. In a hybrid that uses a fuel cell, a different approach must be taken to harness
the electrochemical energy of hydrogen. In this case, hydrogen and oxygen react and are
converted into electrical energy that drives the wheels of an electric vehicle. Because the
vehicle is a hybrid, the power generation system does not completely replace the battery pack
but rather serves to supply the average power demands of the vehicle. This approach, shown
in Figure 1.1, allows for a smaller fuel cell than in a non-hybrid or ‘pure’ fuel cell vehicle
(FCV). As a flurry of recent developments such as 68 mpg by the hydrogen-fueled Ford
P2000 and over 300 mile range in the GM Precept FCV have shown, fuel cells have the
potential to provide high efficiency, high vehicle fuel economy, and very low emissions for
hybrid electric vehicles. For more information on the basic workings of fuel cells, a brief
history, and a discussion of their applications, please see Thomas and Zalbowitz (1999)
Inverter Fuel Cell
Contactor Box A/C Compressor
Fuel Cell Heat Exchanger Inverter Heat Exchanger
Boost Converter Fuel Cell Cooling Pump
DC/DC Converter Air Compressor Controller
Charge Controller
Charger Filter Box H 2 Fuel Tanks
Buck Converter Battery Pack
Transaxle AC Induction Motor
Humidification Pump Deionized Water Reservoir Air Compressor
Figure 1.1. Virginia Tech Fuel Cell Hybrid Electric Vehicle, ANIMUL H2
There were two goals of the research that will be outlined in this paper. First was the design
of Virginia Tech’s ANIMUL H2. Much was learned during fuel cell subsystem construction,
during implementation of system control and operational control, and during vehicle data
acquisition and an analysis. This information will be presented, along with details about of
the system integration issues that were encountered throughout development and testing.
2
The National Renewable Energy Laboratory (NREL) has developed ADVISOR as an
Advanced Vehicle Simulator which is a very useful computer simulation tool for the analysis
of energy use and emissions in both conventional and advanced vehicles. By incorporating
various vehicle performance and control information into a modular environment within
Matlab and Simulink, ADVISOR allows the user to interchange a variety of components,
vehicle configurations, and control strategies. Modification of data files to represent new or
unique vehicle components is straightforward and a user friendly graphical user interface
(GUI) allows for easy manipulation of input files, test routines, and output plots. Other
unique and valuable features of ADVISOR include the ability to quickly perform parametric
and sensitivity studies of vehicle parameters on overall performance and economy.
No simulation tool however, is complete without being validated against measured vehicle
data to ensure the reliability of its predictions. After construction, ANIMUL H2 was tested
using Environmental Protection Agency (EPA) city and highway driving cycles in controlled
conditions at an emissions dynamometer facility. The data acquired from the vehicle test and
the output of the ADVISOR model of the vehicle were compared to judge the accuracy and
validity of the model.
The second goal in the development of ANIMUL H2 was to use what was learned during
construction to develop a fuel cell vehicle model for the ADVISOR environment. An initial
framework for the model was developed using information from tests of the individual fuel
cell subsystems. This data, and eventually vehicle data, was loaded into the model framework
for benchmarking against dynamometer data to provide vehicle-level validation of modeling
performed using ADVISOR. After the model was validated, it was used to predict the effect
of system and subsystem changes on fuel economy and other parameters. The proven model
was then modified to be more generalized for public release in ADVISOR 2.2.
3
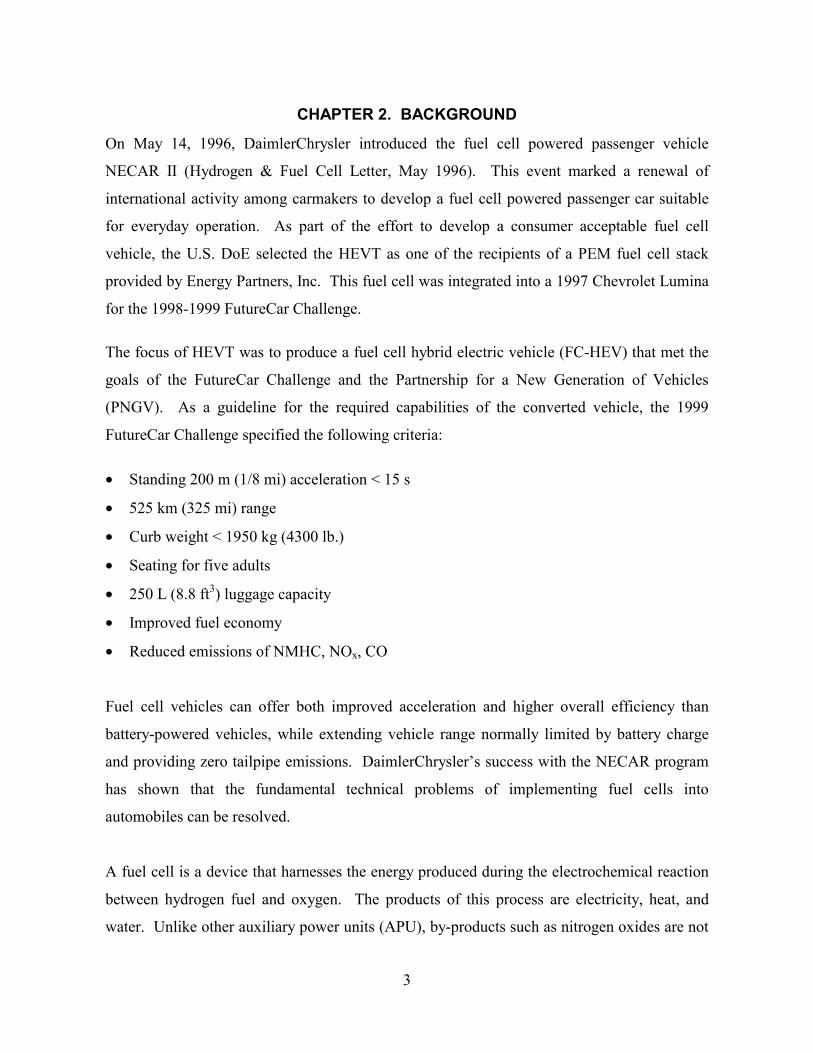
CHAPTER 2. BACKGROUND
On May 14, 1996, DaimlerChrysler introduced the fuel cell powered passenger vehicle
NECAR II (Hydrogen & Fuel Cell Letter, May 1996). This event marked a renewal of
international activity among carmakers to develop a fuel cell powered passenger car suitable
for everyday operation. As part of the effort to develop a consumer acceptable fuel cell
vehicle, the U.S. DoE selected the HEVT as one of the recipients of a PEM fuel cell stack
provided by Energy Partners, Inc. This fuel cell was integrated into a 1997 Chevrolet Lumina
for the 1998-1999 FutureCar Challenge.
The focus of HEVT was to produce a fuel cell hybrid electric vehicle (FC-HEV) that met the
goals of the FutureCar Challenge and the Partnership for a New Generation of Vehicles
(PNGV). As a guideline for the required capabilities of the converted vehicle, the 1999
FutureCar Challenge specified the following criteria:
• Standing 200 m (1/8 mi) acceleration < 15 s
• 525 km (325 mi) range
• Curb weight < 1950 kg (4300 lb.)
• Seating for five adults
• 250 L (8.8 ft3) luggage capacity
• Improved fuel economy
• Reduced emissions of NMHC, NOx, CO
Fuel cell vehicles can offer both improved acceleration and higher overall efficiency than
battery-powered vehicles, while extending vehicle range normally limited by battery charge
and providing zero tailpipe emissions. DaimlerChrysler’s success with the NECAR program
has shown that the fundamental technical problems of implementing fuel cells into
automobiles can be resolved.
A fuel cell is a device that harnesses the energy produced during the electrochemical reaction
between hydrogen fuel and oxygen. The products of this process are electricity, heat, and
water. Unlike other auxiliary power units (APU), by-products such as nitrogen oxides are not

4
produced because of low operating temperatures. The absence of carbon in the reaction
excludes hydrocarbons, carbon dioxide, and carbon monoxide as possible local emissions.
Fuel cells can theoretically convert energy at higher efficiencies than internal combustion
engines since they are not limited by the Carnot heat engine cycle efficiency. Given their
greater efficiency and lower operating cost, fuel cell vehicles are likely to have lower life-
cycle costs than gasoline or battery-powered vehicles (Sperling, 1995). Because of these
characteristics, a vehicle powered by a fuel cell stack has the potential of addressing all of the
FutureCar Challenge criteria. General Motors has indicated that fuel cell systems could be
built for about the same price as a conventional internal combustion engine powered vehicle,
once they are in mass production.
Although the fuel cell provides superior efficiency and zero emissions at the vehicle tailpipe,
the efficiency of the entire drivetrain and any possible emissions from other parts of the
vehicle need to be considered. A study (Cuddy and Wipke, 1996) shows that a 1% increase in
APU efficiency results in a 1% improvement in fuel economy. A 1% decrease in mass results
in a 0.6% increase in fuel efficiency, and a 1% decrease in aerodynamic drag results in only a
0.3% improvement in fuel economy. These results indicate that improvements in APU
efficiency have the largest effect on fuel economy. ADVISOR was used to verify these
results for the Virginia Tech FC-HEV.
5
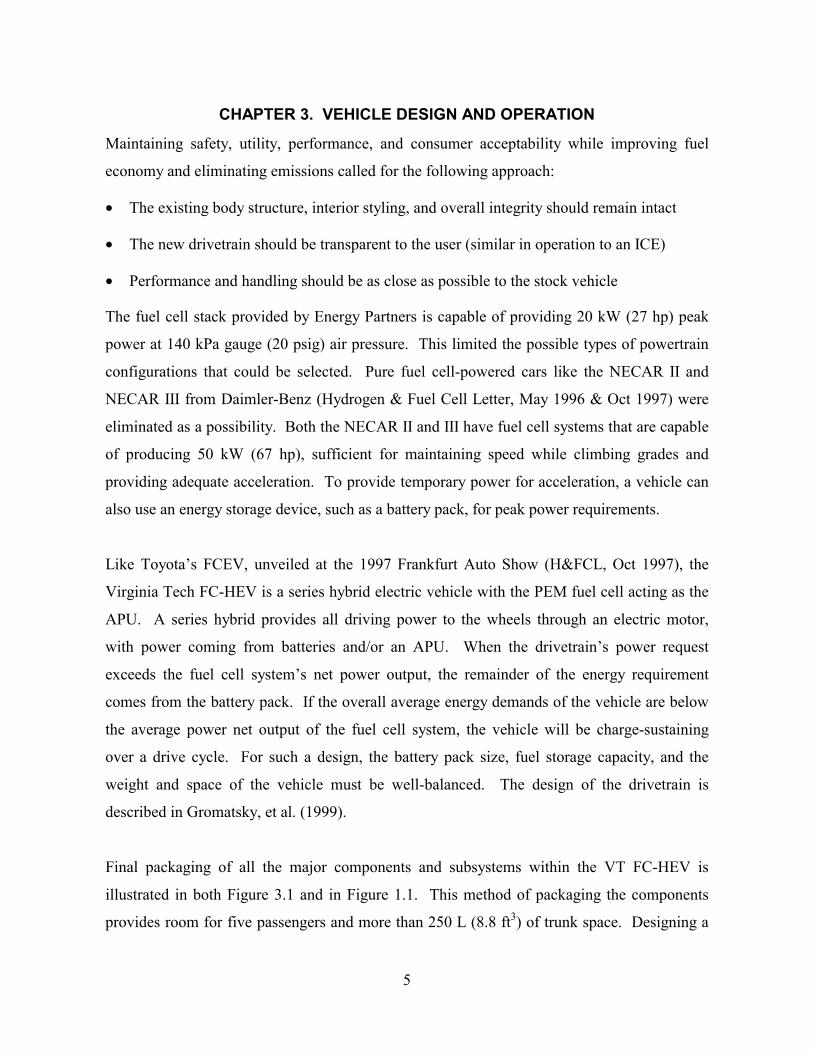
CHAPTER 3. VEHICLE DESIGN AND OPERATION
Maintaining safety, utility, performance, and consumer acceptability while improving fuel
economy and eliminating emissions called for the following approach:
• The existing body structure, interior styling, and overall integrity should remain intact
• The new drivetrain should be transparent to the user (similar in operation to an ICE)
• Performance and handling should be as close as possible to the stock vehicle
The fuel cell stack provided by Energy Partners is capable of providing 20 kW (27 hp) peak
power at 140 kPa gauge (20 psig) air pressure. This limited the possible types of powertrain
configurations that could be selected. Pure fuel cell-powered cars like the NECAR II and
NECAR III from Daimler-Benz (Hydrogen & Fuel Cell Letter, May 1996 & Oct 1997) were
eliminated as a possibility. Both the NECAR II and III have fuel cell systems that are capable
of producing 50 kW (67 hp), sufficient for maintaining speed while climbing grades and
providing adequate acceleration. To provide temporary power for acceleration, a vehicle can
also use an energy storage device, such as a battery pack, for peak power requirements.
Like Toyota’s FCEV, unveiled at the 1997 Frankfurt Auto Show (H&FCL, Oct 1997), the
Virginia Tech FC-HEV is a series hybrid electric vehicle with the PEM fuel cell acting as the
APU. A series hybrid provides all driving power to the wheels through an electric motor,
with power coming from batteries and/or an APU. When the drivetrain’s power request
exceeds the fuel cell system’s net power output, the remainder of the energy requirement
comes from the battery pack. If the overall average energy demands of the vehicle are below
the average power net output of the fuel cell system, the vehicle will be charge-sustaining
over a drive cycle. For such a design, the battery pack size, fuel storage capacity, and the
weight and space of the vehicle must be well-balanced. The design of the drivetrain is
described in Gromatsky, et al. (1999).
Final packaging of all the major components and subsystems within the VT FC-HEV is
illustrated in both Figure 3.1 and in Figure 1.1. This method of packaging the components
provides room for five passengers and more than 250 L (8.8 ft3) of trunk space. Designing a
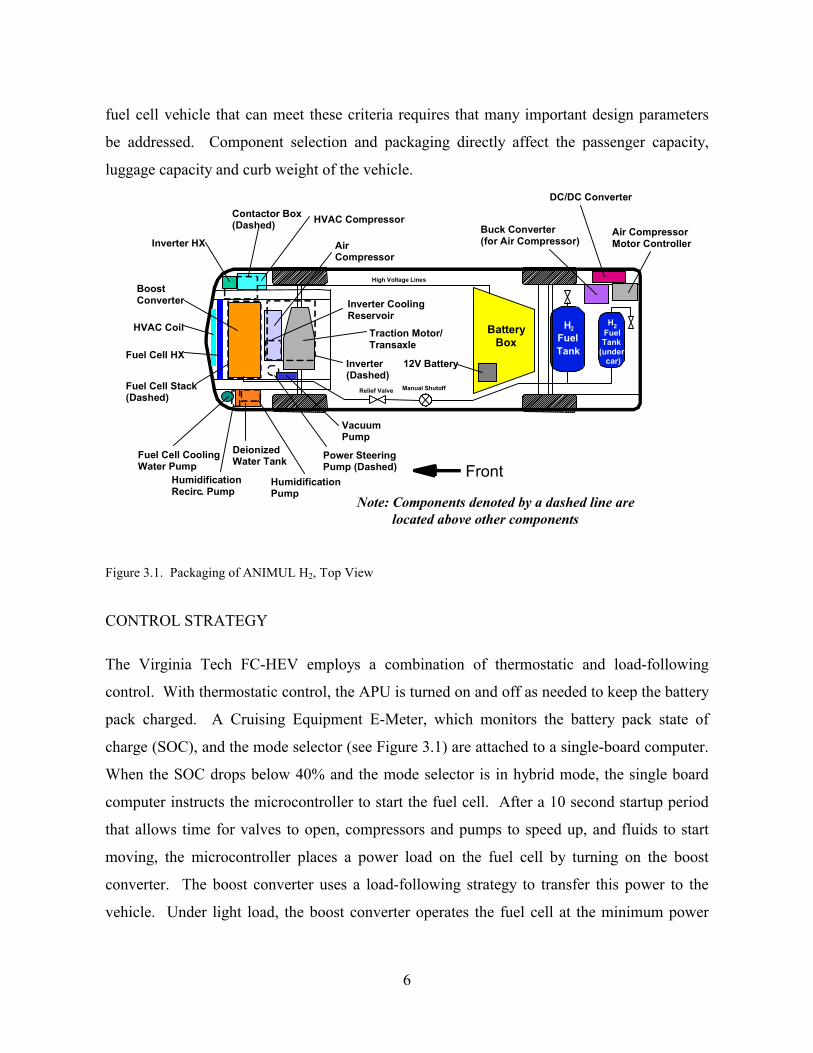
6
fuel cell vehicle that can meet these criteria requires that many important design parameters
be addressed. Component selection and packaging directly affect the passenger capacity,
luggage capacity and curb weight of the vehicle.
Fuel Cell HX
HVAC Coil BatteryBox
H2FuelTank
Fuel Cell Stack(Dashed)
VacuumPump
Contactor Box(Dashed)
Traction Motor/Transaxle
HVAC Compressor
Front
H2FuelTank
(undercar)12V BatteryInverter
(Dashed)
Buck Converter(for Air Compressor)
Air CompressorMotor Controller
DC/DC Converter
HumidificationRecirc. Pump
DeionizedWater Tank
BoostConverter
AirCompressor
Fuel Cell CoolingWater Pump
Power SteeringPump (Dashed)
Note: Components denoted by a dashed line are located above other components
HumidificationPump
Inverter CoolingReservoir
Inverter HX
High Voltage Lines
Manual ShutoffRelief Valve
Figure 3.1. Packaging of ANIMUL H2, Top View
CONTROL STRATEGY
The Virginia Tech FC-HEV employs a combination of thermostatic and load-following
control. With thermostatic control, the APU is turned on and off as needed to keep the battery
pack charged. A Cruising Equipment E-Meter, which monitors the battery pack state of
charge (SOC), and the mode selector (see Figure 3.1) are attached to a single-board computer.
When the SOC drops below 40% and the mode selector is in hybrid mode, the single board
computer instructs the microcontroller to start the fuel cell. After a 10 second startup period
that allows time for valves to open, compressors and pumps to speed up, and fluids to start
moving, the microcontroller places a power load on the fuel cell by turning on the boost
converter. The boost converter uses a load-following strategy to transfer this power to the
vehicle. Under light load, the boost converter operates the fuel cell at the minimum power

7
required to sustain battery SOC. This allows the fuel cell to produce power at a more efficient
rate and minimizes losses due to battery charge/discharge efficiencies.
The use of a fuel cell as the APU requires a controller that is capable of managing every
aspect of fuel cell operation as well as interfacing with the user and the drivetrain. A two-
controller system is used to meet this need. A Z-180-based microcontroller is used to startup,
monitor, and shutdown the fuel cell. The microcontroller features direct driving of relays and
solenoids from its digital ports, 18-Mhz clock speed, 11 analog-to-digital ports, and the ability
to expand the number of ports and A-to-D channels with expansion boards. Although a single
microcontroller would normally be powerful enough to support all vehicle functions, a
separate single board computer provides the user interface through an LCD screen and a mode
selector, shown in Figure 3.1. This computer reads information from two devices that track
energy transfer between the electric vehicle systems, E-Meter and a Kilowatt-hour+2 meter,
and also from two other devices, the electric drivetrain and the vehicle mode selector which is
controlled by the driver. It then instructs the microcontroller to turn on the fuel cell, and
provides the driver with real information on the operation of the fuel cell.
Controlling the fuel cell operation correctly requires a control algorithm that safely starts,
monitors, and shuts down the fuel cell under all operating conditions. Areas critical to fuel
cell system operation, including pressures and temperatures of the supply-side hydrogen and
air flows, the stack cooling loop, and the stack voltage, are continuously monitored.
Individual cells within the fuel cell stack are monitored in groups of four (for a total of 28
groups) to prevent operation of the stack if it is not performing properly and to detect
individual cell failures early. Custom built analog isolation amplifier circuits are used to
isolate the controller from the fuel cell stack’s high voltage output.
VEHICLE OPERATING MODES
A simple, traditional driver control interface is a must for today’s consumers. Drivers of
vehicles with advanced powertrains should not be bothered with dozens of switches or
complex aircraft-like cockpit displays. The HEVT driver interface satisfies this need by

8
using a transmission-style mode selector for control of pure electric mode, hybrid electric
mode, fuel-cell-on mode, and idle charge mode as shown in Figure 3.1. In Pure EV mode, the
fuel cell is locked out and the car will run in electric mode only for a range limited by battery
capacity. In Hybrid mode, the battery SOC dictates the operation of the fuel cell. When
battery SOC reaches about 40%, the controller enables the fuel cell APU power until the
batteries are charged to 80%.
Figure 3.1. Mode Selector Layout
The Fuel Cell mode is for situations when continuous operation of the fuel cell is required,
such as long grade climbs. Selection of this mode makes an unconditional request for fuel
cell operation to the APU controller. A variation of this mode is the Idle Charge mode, which
disables the electric drivetrain and allows battery charging at a higher than normal voltage to
quickly replenish the battery pack.

9
CHAPTER 4. SUBSYSTEM DESIGN AND TESTING
This section will detail the design, development, operation, and testing of the subsystems that
support the operation of the fuel cell stack. In most cases the systems were first tested
individually, separate from the vehicle itself. As the entire system was finished and integrated
into the vehicle chassis, full system tests were run. Data acquired during all of these phases
was used for verification of design parameters vs. operating parameters and for the modeling
development that paralleled the construction of the vehicle systems.
FUEL CELL STACK
A rendered CAD model of the fuel cell stack is shown in Figure 4.1. It is a next generation
design built by Energy Partners, Inc. using membrane electrode assemblies (MEA’s) from W.
L. Gore, Inc. The fuel cell incorporates a small active area and advanced flow distribution.
Figure 4.1. The Energy Partners 20 kW NG2000 Fuel Cell
The smaller active area allows for better control of operating conditions within the stack,
which results in significant improvements in performance. Advances in membrane, electrode,
and collector plate materials all contribute to the stack performance. Current densities of over
1000 mA/cm2 (155 mA/in2) at 0.6 V are possible. At 140 kPa gauge (20 psig), the 110-cell
stack shown in Figure 4.1 achieves 20 kW (27 hp) at 60 V with a power to volume ratio of 0.6
W/cm3 and a power to weight ratio of 314 W/kg.

10
NG2000-110 POLARIZATION CURVE(20kW stack)
405060708090
100110
0 100 200 300 400 500CURRENT (Amps)
VOLT
AG
E (V
dc)
30 PSIG20 PSIG10 PSIG
Date: 8-26-98 H2/air stoic: 1.5/2.0Cell #: 5x10-050 Temp. (deg. C): 60Active area (cm^2): 292 H2/air humid: 60%# of cells: 110
Figure 4.2. Fuel Cell Polarization Curve
Figure 4.2 summarizes the performance of the fuel cell at 70, 140, and 210 kPa gauge (10, 20,
and 30 psig). The fuel cell is operated in ANIMUL H2 at approximately 70 kPa gauge (10
psig) producing 60 V DC (nominal). As Figure 4.2 indicates, the stack can produce anywhere
from 290 to 370 A at this voltage level, depending on the operating pressure.
FLUID SYSTEMS INTEGRATION
Successful fuel cell integration depends on the successful operation of several important
subsystems. While the fuel cell stack is certainly the heart of the system it cannot run without
air handling components, a custom air humidification system, a custom hydrogen
humidification system, a deionized water tank, a fuel cell cooling loop, an air-water separator,
and more. Figure 4.3 shows how the major fuel cell subsystems are tied into other systems on
the vehicle.

11
Fuel In
AirIn
Fan Fan
HydrogenStorage
BatteryPack
Boost Converter
Off BoardBatteryCharger
ElectricityIn
HeatRejection
Fuel Purge
AirExhaust
DC/DCConv
HVACComp
Inv
TractionMotor/
Inverter
AirComp
InvHVACLoad
Air Compressor
Figure 4.3. Fuel Cell Subsystems on board the Virginia Tech FC-HEV
The design and construction of these systems are based on the required operating conditions
of the fuel cell: 70 kPa gauge (10 psig) air at 60°C (158°F) with >80% relative humidity,
hydrogen at 70 kPa gauge (10 psig) with >80% relative humidity, and water flowing at 57
lpm (15 gpm) less than 60° C (140° F) at the outlet of the stack. The fuel cell will become
contaminated if any of the components in the air, water, or hydrogen systems are made of
anything other than an inert substance such as stainless steel, titanium, certain grades of
rubber, or Teflon. This specification dictates that many of the components have to be custom-
built or ordered from laboratory supply companies, since most commonly available
automotive components are mild steel or low-grade rubber.
AIR COMPRESSION AND HUMIDITY SUBSYSTEM
The air supply subsystem provides the fuel cell with clean air at >80% relative humidity and a
maximum temperature of 60° C (158° F). An air system schematic is shown in Figure 4.4.
Humidification is accomplished through the use of water spray-injection. Water flow to the
humidity chamber is controlled by a negative feedback loop that controls the water injectors
based solely on humidity level at the output of the chamber. Liquid water accumulates inside
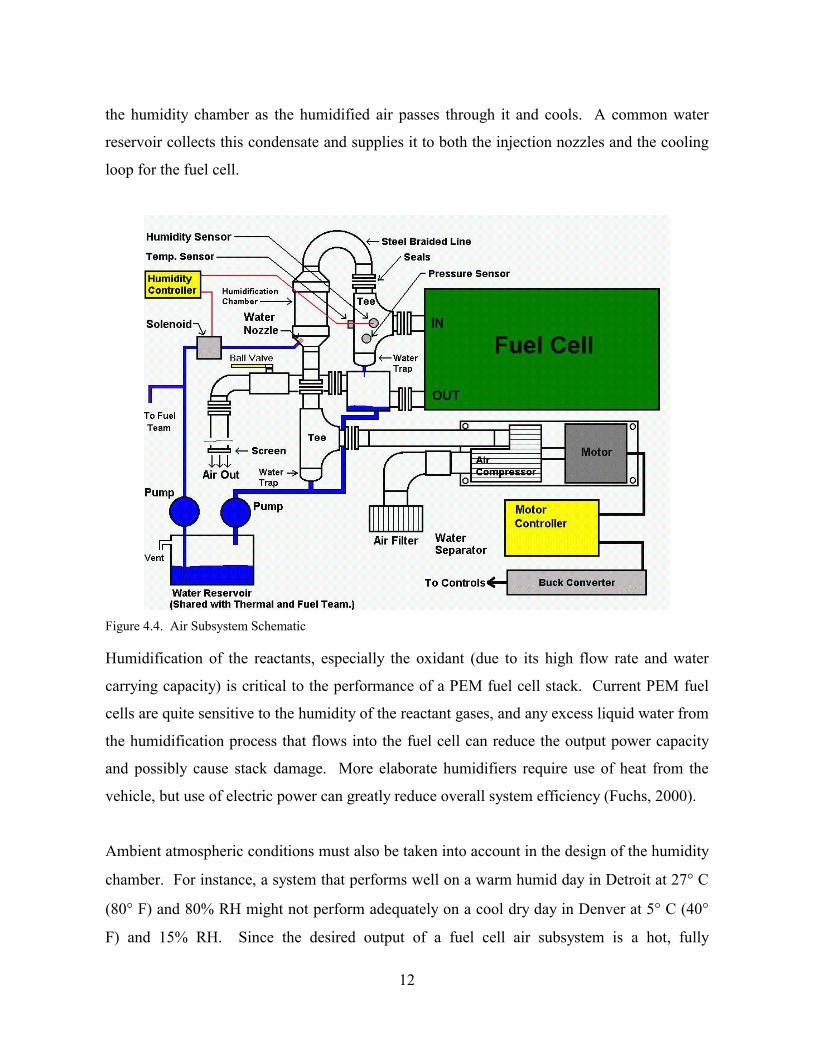
12
the humidity chamber as the humidified air passes through it and cools. A common water
reservoir collects this condensate and supplies it to both the injection nozzles and the cooling
loop for the fuel cell.
Figure 4.4. Air Subsystem Schematic
Humidification of the reactants, especially the oxidant (due to its high flow rate and water
carrying capacity) is critical to the performance of a PEM fuel cell stack. Current PEM fuel
cells are quite sensitive to the humidity of the reactant gases, and any excess liquid water from
the humidification process that flows into the fuel cell can reduce the output power capacity
and possibly cause stack damage. More elaborate humidifiers require use of heat from the
vehicle, but use of electric power can greatly reduce overall system efficiency (Fuchs, 2000).
Ambient atmospheric conditions must also be taken into account in the design of the humidity
chamber. For instance, a system that performs well on a warm humid day in Detroit at 27° C
(80° F) and 80% RH might not perform adequately on a cool dry day in Denver at 5° C (40°
F) and 15% RH. Since the desired output of a fuel cell air subsystem is a hot, fully
13
humidified stream of air, a cold and dry inlet condition presents a challenge. Compared to a
warm and moist inlet condition, the cold and dry case requires more heating and the addition
of much more water to obtain such an output. This natural effect of temperature affecting the
moisture carrying capacity of air means that steps must be taken to produce a controlled
subsystem that ensures proper output conditions regardless of ambient atmospheric
conditions. Such a subsystem could involve responsive control techniques or a naturally
compensating subsystem such as an overdesigned membrane humidifier.
In addition to ambient condition effects on the air supply subsystem, temperature differentials
between subsystems must also be considered. Large discrepancies between reactant
temperatures and fuel cell cooling water temperatures can lead to flooding due to the
condensation of water from the reactant streams or overly dry conditions as hot reactants
absorb water from the membranes inside the stack.
0
20
40
60
80
100
0 200 400 600 800 1000 1200 1400Time (s)
Air Temp (C)Air Humidity (RH%)Water Temp (C)
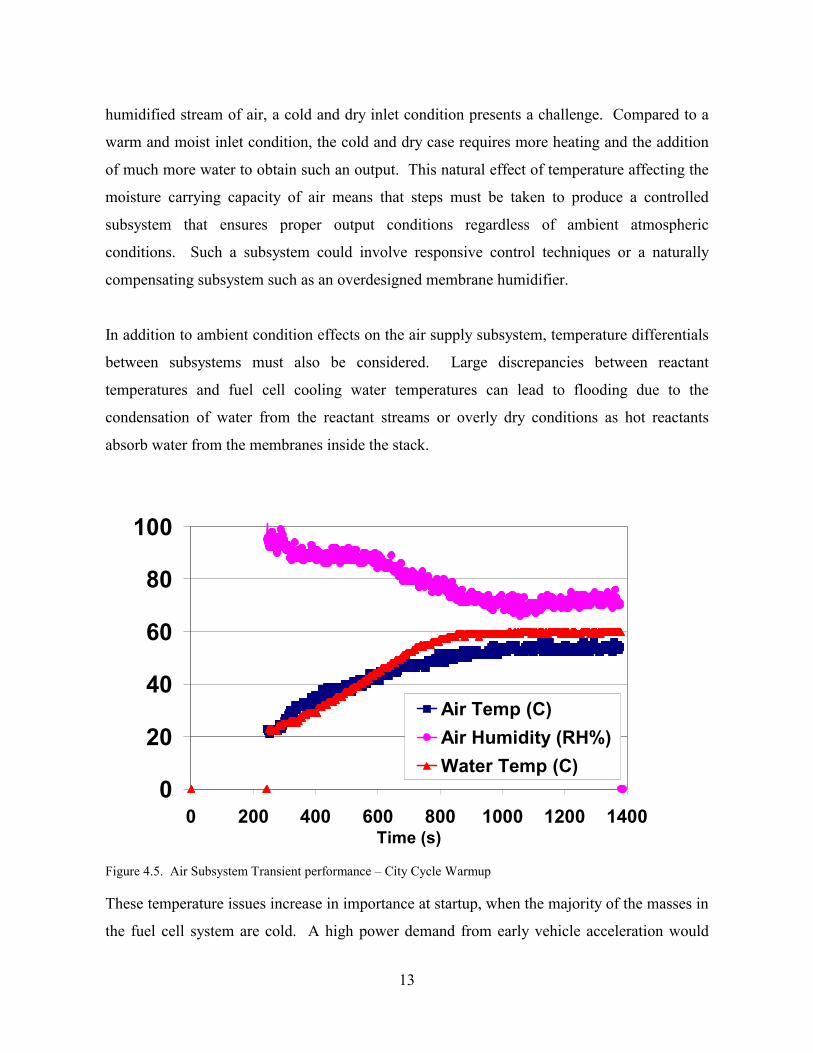
Figure 4.5. Air Subsystem Transient performance – City Cycle Warmup
These temperature issues increase in importance at startup, when the majority of the masses in
the fuel cell system are cold. A high power demand from early vehicle acceleration would

14
yield hot air at the outlet of the compressor, producing a temperature imbalance that is
compounded by the fact that the water injected into the humidification chamber from the
cooling reservoir is also cold, as seen in Figure 4.5.
Water-Air Separator
Due to the chemical reaction inside the fuel cell stack, the air exhaust stream from the fuel
cell contains water droplets and vapor. To maintain the water level in the deionized water
tank, the water in the air exhaust stream must be captured. This is accomplished by using an
air/water separator. This relatively simple device slows down exhaust velocity in an enlarged,
muffler-like chamber before sending the exhaust out of the car. By slowing down the air,
entrained droplets have a chance to fall and collect at the base of the chamber. After
separation, the water is pumped back to the coolant reservoir tank using a self-priming
diaphragm pump.
Air Subsystem Power Flow
The oxidant for this fuel cell is air, supplied at 1415 slpm (50 cfm) and 70 kPa (10 psig) by a
7000 rpm screw compressor. Initial testing showed that 4 to 5 kilowatts of electrical power,
nearly 25% of the fuel cell’s total output, would be needed at the input to the air compressor
motor controller to create a 140 kPa (20 psig) air stream. While this high pressure allowed for
improved fuel cell performance over 10 psig operation, the overall system efficiency was
lowered due to the high parasitic energy demand.
Energy StorageSystem
250-400VDC
Buck Converter150V regulated
Motor Controller100-200VDC
DC-BrushlessMotor Drive
Fuel Cell Stack
ScrewCompressor
Figure 4.6. Air Compression Subsystem Power Flow
15
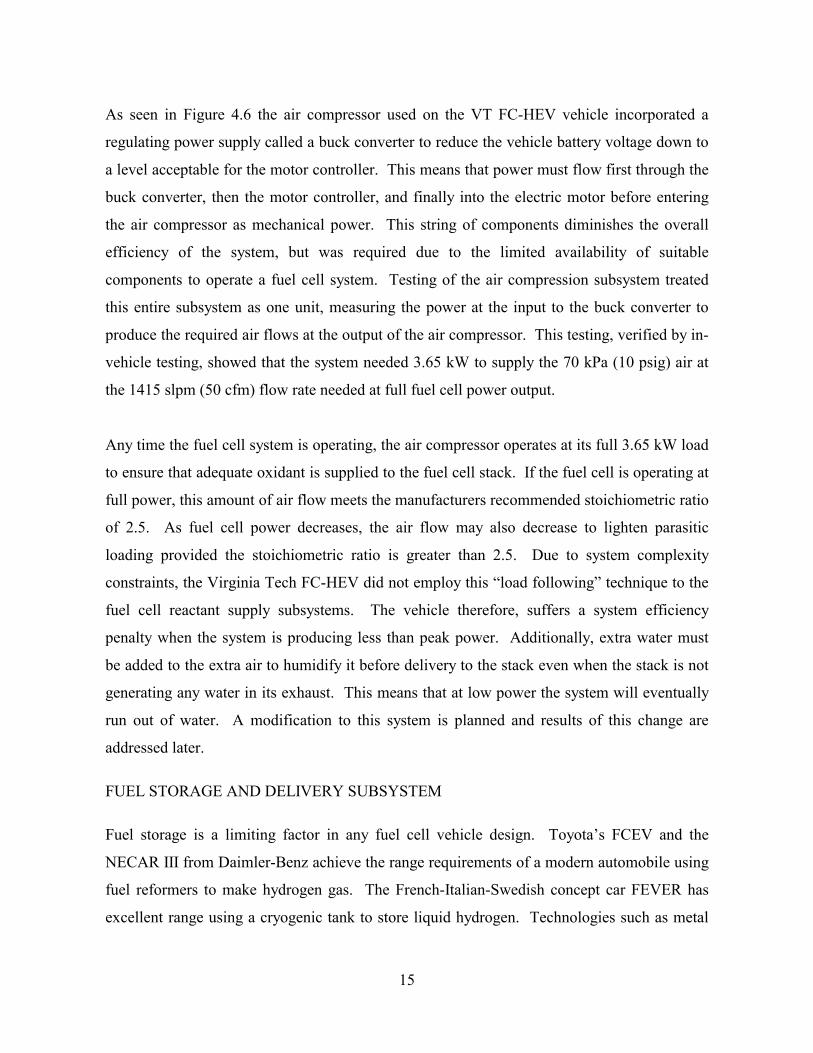
As seen in Figure 4.6 the air compressor used on the VT FC-HEV vehicle incorporated a
regulating power supply called a buck converter to reduce the vehicle battery voltage down to
a level acceptable for the motor controller. This means that power must flow first through the
buck converter, then the motor controller, and finally into the electric motor before entering
the air compressor as mechanical power. This string of components diminishes the overall
efficiency of the system, but was required due to the limited availability of suitable
components to operate a fuel cell system. Testing of the air compression subsystem treated
this entire subsystem as one unit, measuring the power at the input to the buck converter to
produce the required air flows at the output of the air compressor. This testing, verified by in-
vehicle testing, showed that the system needed 3.65 kW to supply the 70 kPa (10 psig) air at
the 1415 slpm (50 cfm) flow rate needed at full fuel cell power output.
Any time the fuel cell system is operating, the air compressor operates at its full 3.65 kW load
to ensure that adequate oxidant is supplied to the fuel cell stack. If the fuel cell is operating at
full power, this amount of air flow meets the manufacturers recommended stoichiometric ratio
of 2.5. As fuel cell power decreases, the air flow may also decrease to lighten parasitic
loading provided the stoichiometric ratio is greater than 2.5. Due to system complexity
constraints, the Virginia Tech FC-HEV did not employ this “load following” technique to the
fuel cell reactant supply subsystems. The vehicle therefore, suffers a system efficiency
penalty when the system is producing less than peak power. Additionally, extra water must
be added to the extra air to humidify it before delivery to the stack even when the stack is not
generating any water in its exhaust. This means that at low power the system will eventually
run out of water. A modification to this system is planned and results of this change are
addressed later.
FUEL STORAGE AND DELIVERY SUBSYSTEM
Fuel storage is a limiting factor in any fuel cell vehicle design. Toyota’s FCEV and the
NECAR III from Daimler-Benz achieve the range requirements of a modern automobile using
fuel reformers to make hydrogen gas. The French-Italian-Swedish concept car FEVER has
excellent range using a cryogenic tank to store liquid hydrogen. Technologies such as metal

16
hydride and carbon nanotubes are under development both here in the U.S. and abroad as
possible methods to overcome hydrogen storage obstacles. Unfortunately, HEVT was unable
to obtain any of these advanced hydrogen fuel storage systems. Thiokol conformable
composite tanks that are capable of storing compressed hydrogen at 35 MPa (5000 psi) will
not be available until sometime during 2001. This left few design alternatives beyond
compressed natural gas storage technology operating at lower pressure.
In an effort to minimize weight, two carbon-fiber composite tanks were used to store the
hydrogen gas. A tank measuring 89 cm x 33 cm (35" x 13.1") was located in the trunk, and a
56 cm x 25 cm (22" x 10") was placed under the trunk. The smaller 26 L (1590 in3) tank was
placed beneath the trunk in the space previously occupied by the spare tire well. The larger
45 L (1.56 ft3) tank was placed inside the trunk between the rear shock towers and as far back
in the trunk as possible, to maximize the available trunk space. These tanks provided a total
volume of 71 L (2.51 ft3) at 25 MPa (3600 psi). This capacity is equivalent to 1.3 gallons of
gasoline and provided for an estimated fuel range of 63 km (40 mi) based on charge-
depleting, SOC-corrected fuel economy data presented later in this work. As designed fuel
economy using load following air compressor control would provide a range of 60-70 miles.
Compressed hydrogen at 25 MPa (3600 psi) has only about 5% of the energy contained in the
same volume of gasoline while providing three times as much energy per unit mass. The total
volume required to achieve a range of 560 km (350 mi) would be more than 620 L (22 ft3).
Because of this large volume, carrying enough hydrogen on-board the car to meet the range
requirement becomes very difficult to achieve while maintaining acceptable trunk space.
Fuel Delivery
On the fuel side of the fuel cell stack, pressurized hydrogen from the storage tanks requires no
addition of energy as it flows through pressure regulators into the 70 kPa (10 psig) fuel lines
and recirculation loop. The humidity chamber for the hydrogen is a small inline chamber that
includes a water injection fogging nozzle. The chamber itself is a 38 mm (1.5 in) diameter
CPVC pipe approximately 150 mm (6 in) long. Hydrogen enters the chamber at one end and
flows straight through to the exit on the opposite end. Water is injected into the chamber

17
through the wall of the pipe with a water fogging nozzle. The chamber also includes a drain
to allow excess water to flow out to a water storage tank located below the humidification
chamber. This tank releases the excess water to the atmosphere via a solenoid valve when the
fuel cell is not operating.
Testing has confirmed that humidification of the fuel supply to the fuel cell is not a difficult
task. The warm-up period for the fuel cell is normally a difficult period for achieving the
desired humidity. Yet even during this period, humidity levels of 75% are easily attained.
This is well above the 60% minimum recommended for stack startup. When the stack is at its
operating temperature (about 60° C), the hydrogen vaporizes the water as soon as it is ejected
from the nozzle and provides the fuel cell with the needed moisture. Since any liquid water
entering the fuel cell would greatly impact cell performance, a water separator is incorporated
into the system to remove droplets. A solenoid valve located downstream of the fuel cell
purges the fuel subsystem of hydrogen during shut-down.
22”X12”
35”X13.1”
Fill Port w/Check Valve
PR1: Pres.Sensor
PR3&T1Sensor
PR2: Pres.Sensor
PressureRegulator
Dome LoadedPressure Regulator toMatch Air Pressure
H1: HumiditySensor
WaterSeparator
S5: InjectionSolenoid
FuelCell
PressureRelief Valve
Water Storage
Water PumpShare w/ Air Team
ManualShutoff
ManualShutoff
ManualShutoff
FoggingNozzle
Disconnects toremove Fuel Cell
S2: SafetySolenoid
~8 psi.
~15 psi.<3600 psi.T=ambient
~10 psi.
~60 deg. C
<3600 -> ~150 psi.
Engine Compartment
Trunk
~10 psi.
HumidificationChamber
Re-circulationPumps
S6: Bleed &Purge Solenoid
FlashArrestor
Water return from Separator
S3: Start-upSolenoid
M1:ThermalMass FlowMeter
(H2 Sensor)
(H2 Sensor)S1: TankSolenoid
Air Tap~10 psi.
P1
P2
S4: NormallyOpen Solenoid-PreventsShutdown SystemVacuum/Pressure
Tank Pres.Relief Valves
Figure 4.7. Fuel Storage and Delivery Subsystems
18
The fuel delivery subsystem shown in Figure 4.8 is designed to store hydrogen gas in two
tanks at 25 MPa (3600 psi) and deliver it at a maximum of 370 slpm (13 scfm) at 239 kPa (20
psig). An inline shutoff solenoid downstream of the storage tanks allows the tanks to be
isolated from the rest of the system when the fuel cell is not in use. Upstream of the solenoid,
a tee junction leads to the fill port, which is located under the vehicle’s stock fuel filler door.
The fill port is equipped with a check valve to prevent the escape of hydrogen to the
environment.
After the fill port, a manual control regulator reduces the hydrogen pressure from a storage
level as high as 25 MPa (3600 psi) down to 1.0 MPa (150 psi). The second pressure
regulator, which reduces the pressure down to 169 kPa (10 psig), is a differential tracking
regulator. This regulator is a dome-loaded design to allow for pressure-matching with the air
supply line to the fuel cell. A pressure tap from the fuel cell air supply line serves as the
reference pressure for the regulator dome. It also incorporates a positive bias spring on the
dome to provide a positive pressure bias on the output of the regulator. This feature is
designed to compensate for the pressure losses in the hydrogen supply lines between the low-
pressure regulator at the rear of the vehicle and the fuel cell at the front of the vehicle. While
this design reduced the use of long high pressure lines that could leak, it proved to be an
obstacle to obtaining high power from the fuel cell. The pressure drop due to line losses in
the long low pressure fuel lines caused the fuel to drop to as low as one half the desired
operating pressure of 169 kPa (10 psig).
Recirculation is implemented in the fuel subsystem by incorporating two pumps after the fuel
cell to form a closed loop hydrogen subsystem. These pumps make it possible to recirculate
unused humidified hydrogen gas from the fuel cell to improve cell performance. Hydrogen
recirculation is imperative in order to maximize fuel usage and system efficiency.
Refueling
Refueling gasoline-powered vehicles has become a very casual process. However, this
relaxed method cannot be applied to hydrogen refueling. Special attention must be paid to the
unique hazards of hydrogen. One concern for refueling is static electricity igniting any

19
leaking hydrogen. Therefore, a hydrogen fueled vehicle needs to be electrically grounded
before filling the tanks. A second concern of refueling is preventing the vehicle from driving
away while the refueling nozzle is still attached to the fill port. This concern has been
addressed using electric interlocks. A switch is connected to the door of the fill port. Once
the door is opened, a solenoid allows hydrogen to flow into the storage tanks. More
importantly, the switch prevents the drivetrain from being activated, and thus the vehicle
cannot be driven away while the refueling nozzle is still connected to the fill port. For
additional information on hydrogen safety measures implemented on ANIMUL H2, please see
Appendix II.
FUEL CELL COOLING SUBSYSTEM
Fuel cell stack temperature distribution is another item that is critical to the successful
operation of a PEM fuel cell. Insufficient coolant flow can cause uneven temperature
distribution across the stack, resulting in various portions of the stack behaving differently
and perhaps being damaged.
Figure 4.8. Thermal System Schematic
Heat Exchanger
FuelCell
Pump (to humidification)
D/IBed
WaterReservoir
Sensor tankSensor tank

20
The thermal system removes excess heat from the fuel cell. A deionized water loop is used
with a crossflow heat exchanger. The thermal loop consists of a 12V DC pump, deionizer,
water reservoir, sensor tanks, and the heat exchanger. Figure 4.8 shows a schematic of the
thermal system.
Water is delivered to the fuel cell at 76 lpm (15 gpm) and at 25 lpm (5 gpm) to the resin-bed
deionizer at 103 kPa (15 psig). The pump is a custom combination of a 250 W (1/3 hp) motor
with magnetic-drive seal-less head and stainless steel impeller. The deionization loop is in
parallel with the main supply line, separating water from the main flow just before the fuel
cell. About 75% of the flow continues into the fuel cell, while the remainder is sent to the
deionizer. The deionizer is similar in shape, size and function to household water purification
systems, allowing the user to easily service the unit. The main reservoir, which holds all
water reserves for the thermal and humidification systems, is positioned to use gravity to help
prime the pump. Small sensor tanks are strategically located at the fuel cell inlet and outlet to
house instrumentation for measuring the pressure drop and temperature rise across the fuel
cell stack.
The control system for the thermal loop monitors water temperature, pressure, flow,
conductivity, and reservoir level. Table 2 lists the sensor types, parameters, and actions.

21
Table 4.1. Sensor Functions Sensor Type Normal Operation Excitation
State
Controlled
Action
Tin Temperature/
Conductivity
Probe
55 to 65 °°°°C T=57 °°°°C
T=60 °°°°C
T≥≥≥≥65 °°°°C
Start Fan 1
Start Fan 2
Shut Cell Down
Pin Pressure
Transducer
69 to 103 kPa
(10 to 20 psi)
P<10 psi
P>20 psi
Shut Cell Down
Shut Cell Down
Conductivity Temperature/
Conductivity
Probe
0 to 4 µµµµS C>4 µµµµS Shut Cell Down
Flow Flow Meter 57 to 110 l/m
(15 to 29 gpm)
Flow<15 gpm Shut Cell Down
Tout RTD 60 to 70 °°°°C ∆∆∆∆T>5 C
∆∆∆∆T>7 C
Warn Driver
Shut Cell Down
Pout Pressure
Transducer
69 to 103 kPa (10 to
20 psi) ∆∆∆∆P>7 psi
∆∆∆∆P>10 psi
Warn Driver
Shut Cell Down
The fuel cell cooling subsystem on-board the VT FC-HEV was designed to remove
approximately 25 kW of heat energy from the water. The heat exchanger is constructed of
316 stainless welded steel tubing with copper fins and with twin low-profile 12VDC fans in a
‘push’ configuration. However, installation of the exchanger into the tightly packed engine
bay of the vehicle limited the air flow to the exchanger and cut its capacity significantly.
22
EPA Highway Cycle - Fuel Cell Temp.
010203040506070
0 200 400 600 800Time (sec)
Tem
p. (C
)Max Temp
System Shutdown Restart
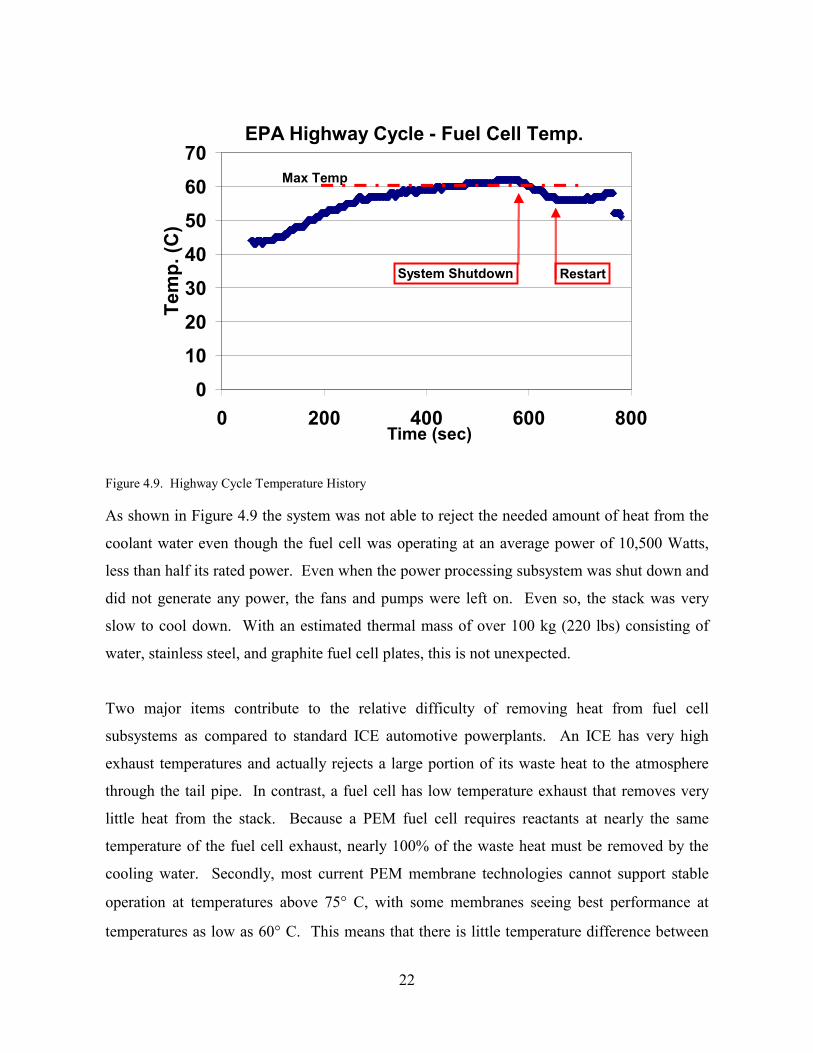
Figure 4.9. Highway Cycle Temperature History
As shown in Figure 4.9 the system was not able to reject the needed amount of heat from the
coolant water even though the fuel cell was operating at an average power of 10,500 Watts,
less than half its rated power. Even when the power processing subsystem was shut down and
did not generate any power, the fans and pumps were left on. Even so, the stack was very
slow to cool down. With an estimated thermal mass of over 100 kg (220 lbs) consisting of
water, stainless steel, and graphite fuel cell plates, this is not unexpected.
Two major items contribute to the relative difficulty of removing heat from fuel cell
subsystems as compared to standard ICE automotive powerplants. An ICE has very high
exhaust temperatures and actually rejects a large portion of its waste heat to the atmosphere
through the tail pipe. In contrast, a fuel cell has low temperature exhaust that removes very
little heat from the stack. Because a PEM fuel cell requires reactants at nearly the same
temperature of the fuel cell exhaust, nearly 100% of the waste heat must be removed by the
cooling water. Secondly, most current PEM membrane technologies cannot support stable
operation at temperatures above 75° C, with some membranes seeing best performance at
temperatures as low as 60° C. This means that there is little temperature difference between
23
the ambient air available to cool the system and the system itself. Combined with the
requirement that the cooling water must reject nearly all of the waste heat, heat loads can
quickly double compared to those of a normal automobile.
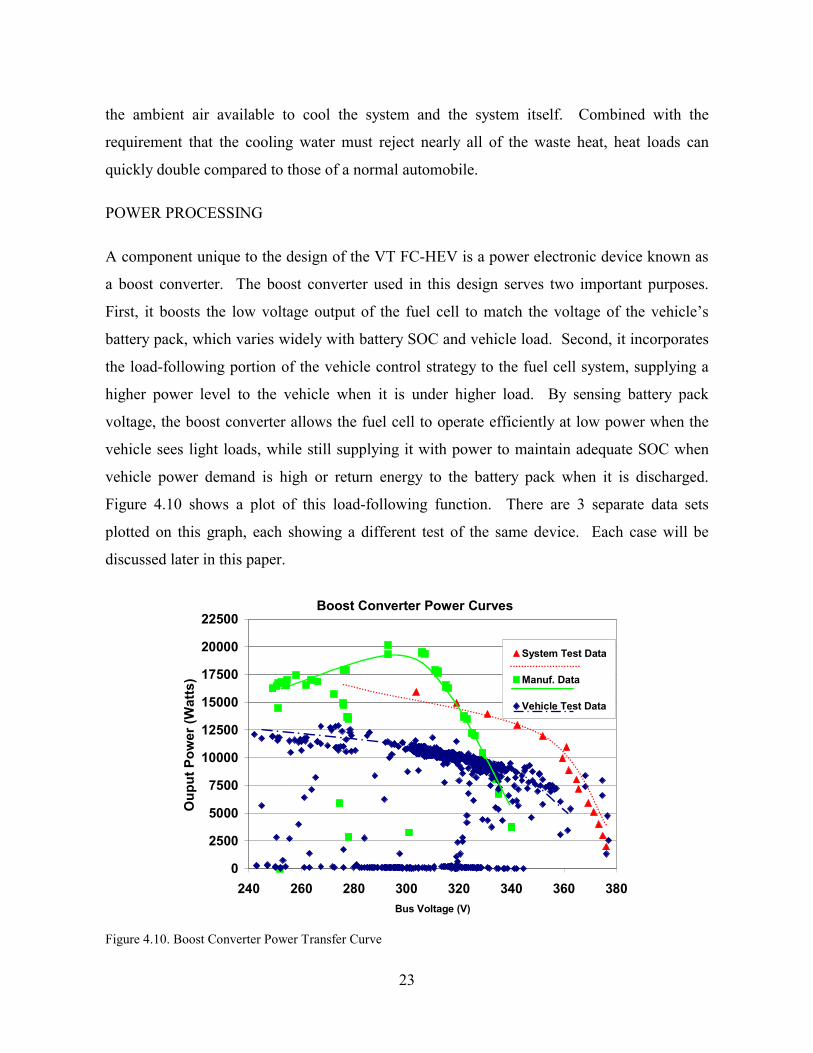
POWER PROCESSING
A component unique to the design of the VT FC-HEV is a power electronic device known as
a boost converter. The boost converter used in this design serves two important purposes.
First, it boosts the low voltage output of the fuel cell to match the voltage of the vehicle’s
battery pack, which varies widely with battery SOC and vehicle load. Second, it incorporates
the load-following portion of the vehicle control strategy to the fuel cell system, supplying a
higher power level to the vehicle when it is under higher load. By sensing battery pack
voltage, the boost converter allows the fuel cell to operate efficiently at low power when the
vehicle sees light loads, while still supplying it with power to maintain adequate SOC when
vehicle power demand is high or return energy to the battery pack when it is discharged.
Figure 4.10 shows a plot of this load-following function. There are 3 separate data sets
plotted on this graph, each showing a different test of the same device. Each case will be
discussed later in this paper.
Boost Converter Power Curves
0
2500
5000
7500
10000
12500
15000
17500
20000
22500
240 260 280 300 320 340 360 380Bus Voltage (V)
Oup
ut P
ower
(Wat
ts)
System Test Data
Manuf. Data
Vehicle Test Data
Figure 4.10. Boost Converter Power Transfer Curve
24
Power Processing – Operating Strategy
Human safety is incorporated into the boost converter by isolating the high voltage electronics
of the system from the vehicle chassis and from the environment. However, when
specifically considering the design of this component’s function and performance, it was
safety of the fuel cell stack itself that was most important. The fuel cell provided by Energy
Partners was made possible through a one-time grant from the Department of Energy that did
not include any warrantee coverage or extra money for repair. Failure to carefully plan
measures that would protect the stack could doom the success of a two year project. There
are two types of limits in place to protect the stack, a maximum current limit set to 300 amps,
and a minimum voltage limit of 60V, both recommended by the fuel cell manufacturer. With
a proper reactant supply subsystems installed and these limits in place, the fuel cell is properly
protected from being overloaded. Regardless of fuel cell voltage, the boost converter will not
allow higher currents under any condition. Should fuel cell voltage drop below 60 V, it can
be inferred that inadequate reactants are available for the power requested. In this case, the
power drawn from the stack is scaled back until voltage rises again. If the fuel cell voltage
should fall below 55 V, the boost converter will completely shut down, removing load from
the fuel cell.
When specifying the operating controls of the boost converter in the preliminary design
phases, the best available example of a successful hybrid control strategy was that of
ANIMUL, the vehicle built by students at Virginia Tech that placed first in the 1996
FutureCar Challenge. This propane-fueled series hybrid featured a constant speed alternator
with an open circuit voltage of approximately 400 V. When connected to the battery pack
used in ANIMUL, the alternator produced about 10 kW at 350 V. When the vehicle was
under high load and the battery pack was at 250 V, the generator produced 20 kW. This
configuration proved effective in maintaining the battery pack state of charge in ANIMUL
during city and highway driving.
Since the fuel cell stack’s open circuit voltage is 110 V, operation by direct connection to the
battery pack was not an option. The boost converter provided a way to boost the voltage of

25
the fuel cell up to match the voltage of the battery pack. Since a system that provided full
power at 250 V and no power at 400 V was so successful in the past, it was decided that an
attempt to make the fuel cell system operate in a similar manner would give the best chance
for success. Based on this assumption and additional information about the fuel cell stack, the
boost converter was designed to give full power at any voltage below 300 V, and give zero
power transfer at 380 V. This range is slightly tighter than before, but assures that energy
transfers at a rate fast enough to maintain the battery pack SOC and allows the fuel cell to
operate at medium to light loads a majority of the time. Because fuel cells are more efficient
at light loads than engines, operation in this region allows for higher fuel economy.
To define this operation, a “power transfer curve” was developed for the boost converter. By
monitoring the voltage of the battery pack, the boost converter demands a certain load from
the fuel cell stack and processes this power from the low voltage of the fuel cell up to the
battery pack voltage. Figure 4.10 shows the relationship between battery pack voltage and
power transfer.
The boost converter needed to be a simple device from an external control standpoint.
Because of the complexity of the other systems within the vehicle and the team’s limited
experience with fuel cells, controls were embedded within as many systems as possible. This
included the boost converter, as it was needed the most complex control of all the subsystems
in the vehicle. Another reason for embedding control into the boost converter was that the
fuel cell controller was not a particularly powerful device and its microprocessor was heavily
taxed with other operations even without load control considerations. Simplicity in
integration was also important and led to a design that was constructed to meet the space
constraints within the vehicle. The end result was a boost converter that fit into the vehicle,
operated on a pre-programmed ‘power transfer curve,’ and was turned on and off by a single
12V control signal.
Power Processing – Design Realization
Preliminary power transfer curves for the boost converter were produced from two out-of-
vehicle test runs and are displayed with vehicle test data in Figure 4.10. The first test was

26
relatively noisy data provided by the manufacturer of the unit. In an effort to verify the
accuracy of this data and to gain a better understanding of how the device would function in a
hybrid vehicle, a test session was arranged on an Aerovironment ABC-150 controllable DC
power source that could simulate the operation of the fuel cell. The boost converter was
tested to approximately 80% of full power, limited by the maximum current available from
the ABC-150. An attempt to model the fuel cell polarization curve (shown in Figure 4.2) was
implemented on the ABC-150 by using a straight-line approximation. This approximation
was coded into a script file that varied the ABC-150’s voltage levels to match 138kPa (20psi)
fuel cell performance data collected by Energy Partners. However, the ABC-150 was slow to
respond to this script file; and it could not properly simulate the fuel cell’s power curve at
light load. Despite these limitations, the results of this test were good, both in verifying the
manufacturers data and in learning more about the operating characteristics of the boost
converter.
The final test of the boost converter was performed in the vehicle after all systems were
operational. It is important to note that the fuel cell itself was slightly damaged prior to
dynamometer testing of the vehicle. It’s output voltage was not as high as desired, causing
the boost converter to prevent the fuel cell from delivering maximum power in this damaged
state. This affects the power transfer curve of the fuel cell system and prevents the vehicle
from receiving as much power as it needs to maintain battery state of charge.
Further vehicle testing prior to competition showed that the load-following strategy built into
the boost converter was not aggressive enough to maintain adequate SOC during vehicle
operation. To remedy this, the vehicle buss voltage was lowered by changing the number of
batteries in the string to 27, for a nominal voltage of 324 V. Seeing this lower average
voltage, the boost converter would go to a higher average power level (see Figure 4.10) and to
help maintain a higher battery SOC.
Power transfer in HEV’s is important to control because the loading on a vehicle drivetrain
changes greatly over varying driving conditions (city, highway, hills, etc.). While the

27
Virginia Tech boost converter took the large and complicated responsibility of power transfer
control away from the onboard computer, it did not allow the power transfer strategy to
change as other vehicle systems changed around it.
TESTING
To acquire data about a vehicle for the purposes of characterizing its operation often requires
an off-board computer and many additional sensors. Since it was known prior to the test that
these facilities would not be available, other methods had to be developed. The vehicle
control system, developed by undergraduate engineering students at Virginia Tech, serves to
monitor operating parameters of the fuel cell system and of the vehicle level components and
then to make decisions that allow the vehicle to function properly. This system consists of
sensors and student-built signal conditioners that are fed into the input channels of a
microprocessor control board. The secondary purpose of the control system is to support the
research and analysis discussed here by also operating as a data logging system. After this
information is used to make control decisions, it is sent out over a serial data line to an
onboard computer that logs the 60 channels of sensor information whenever the vehicle is in
operation.
Data of vehicle power flows are collected using a data acquisition system that tracks energy
generation by the fuel cell system and energy flow to and from the batteries. This system
consists of two parts, an E-Meter and a Kilowatt-hour+2 meter, both produced by Cruising
Equipment Company. Each serves as a high voltage and high current meters to measure the
power transfer between the batteries, drivetrain, and fuel cell. They also perform a discrete-
integration function to track the amount of net energy flow, represented as kilowatt-hours and
amp-hours. After collecting this information, each unit streams its data to the main onboard
computer for display and for data-logging.
Sensors in the vehicle incorporate custom-built components that measure temperature,
pressure, humidity, flow, and DC current. In each case, the sensors are factory-built,
calibrated devices from several laboratory-quality instrumentation companies. To interface

28
these items with the microcontroller, instrumentation-grade operational amplifier boards are
placed in line, conditioning the signals to be within the range of available data acquisition
boards, typically 0-5 V. These sensors and instrumentation amps proved to be extremely
reliable, and accurate over the ranges in which they were operated.
When operating, the Z-180 based fuel cell control system makes measurements and decisions
from the sensors discussed above at varying sample rates depending on priority, i.e. ranked by
how critical each measurement is to the safe operation of the fuel cell system. The voltage of
each group of four cells is checked as often as possible. Five samples at a time are averaged
to remove any noise that may be present in the measurement, so as to prevent any unintended
system shutdowns. This averaged data is then checked roughly once per second to see that it
falls within operable bounds for the fuel cell. Other sensors, such as temperature sensors are
read less often. The thermal capacitance of the cooling system is so large that changes occur
slowly. However transients caused by incurred while driving the vehicle that don’t affect the
thermal system quickly can greatly affect other measurements such as cell voltage.
Consequently, cell voltage is monitored more frequently than any other data channel on the
vehicle. All of this data is kept up to date in memory and is output to a hard disk data file on
a second by second basis.
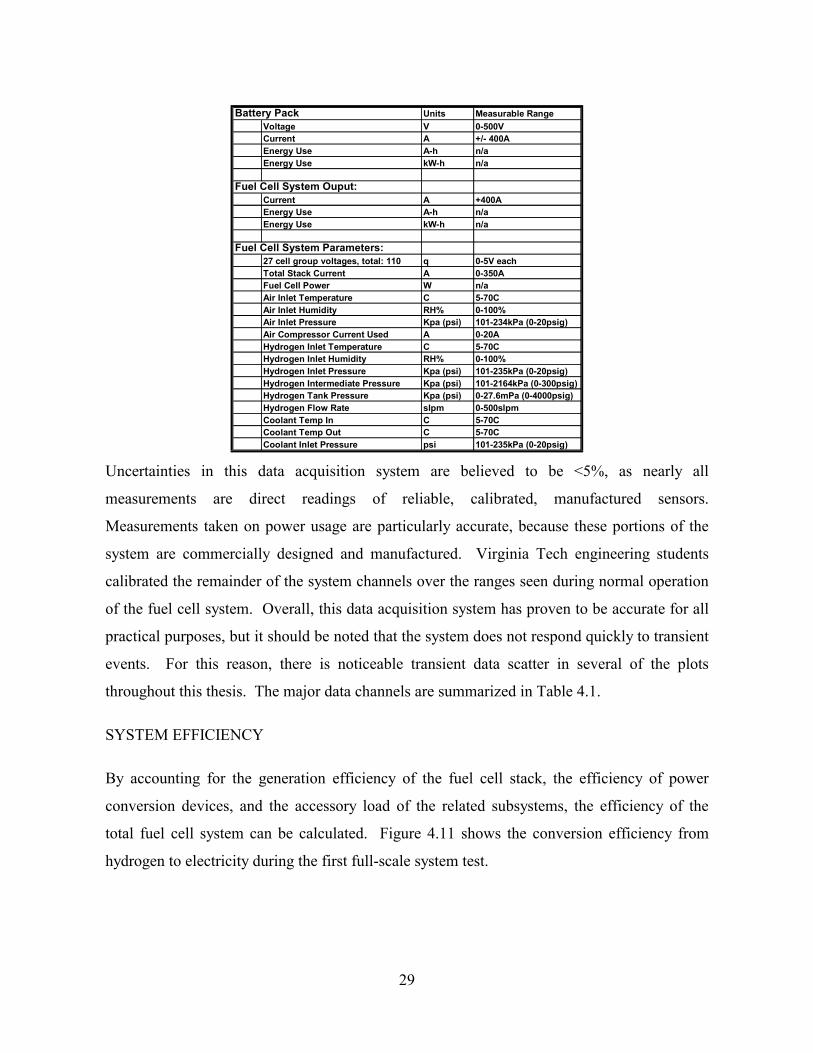
Table 4.2. Main Sensor Channels
29
Battery Pack Units Measurable RangeVoltage V 0-500VCurrent A +/- 400AEnergy Use A-h n/aEnergy Use kW-h n/a
Fuel Cell System Ouput:Current A +400AEnergy Use A-h n/aEnergy Use kW-h n/a
Fuel Cell System Parameters:27 cell group voltages, total: 110 q 0-5V eachTotal Stack Current A 0-350AFuel Cell Power W n/aAir Inlet Temperature C 5-70CAir Inlet Humidity RH% 0-100%Air Inlet Pressure Kpa (psi) 101-234kPa (0-20psig)Air Compressor Current Used A 0-20AHydrogen Inlet Temperature C 5-70CHydrogen Inlet Humidity RH% 0-100%Hydrogen Inlet Pressure Kpa (psi) 101-235kPa (0-20psig)Hydrogen Intermediate Pressure Kpa (psi) 101-2164kPa (0-300psig)Hydrogen Tank Pressure Kpa (psi) 0-27.6mPa (0-4000psig)Hydrogen Flow Rate slpm 0-500slpmCoolant Temp In C 5-70CCoolant Temp Out C 5-70CCoolant Inlet Pressure psi 101-235kPa (0-20psig)
Uncertainties in this data acquisition system are believed to be <5%, as nearly all
measurements are direct readings of reliable, calibrated, manufactured sensors.
Measurements taken on power usage are particularly accurate, because these portions of the
system are commercially designed and manufactured. Virginia Tech engineering students
calibrated the remainder of the system channels over the ranges seen during normal operation
of the fuel cell system. Overall, this data acquisition system has proven to be accurate for all
practical purposes, but it should be noted that the system does not respond quickly to transient
events. For this reason, there is noticeable transient data scatter in several of the plots
throughout this thesis. The major data channels are summarized in Table 4.1.
SYSTEM EFFICIENCY
By accounting for the generation efficiency of the fuel cell stack, the efficiency of power
conversion devices, and the accessory load of the related subsystems, the efficiency of the
total fuel cell system can be calculated. Figure 4.11 shows the conversion efficiency from
hydrogen to electricity during the first full-scale system test.

30
VT Fuel Cell System Efficiency, 10psi Based on System Test Data - 4/27/99
0
5
10
15
20
25
30
35
0 2500 5000 7500 10000 12500Net System Power (W)
Eff (
%)
Figure 4.11. Preliminary Test Data: System Efficiency
This system efficiency data is based on static-load testing of the vehicle’s power systems and
is a good representation of how the Virginia Tech fuel cell system performs over a variety of
loads. This is a first attempt by Virginia Tech researchers to build a fuel cell system and there
is much room for improvement, this data compares well to test results from other research on
fuel cell systems (Friedman, 1998).

31
CHAPTER 5. DYNAMOMETER TEST RESULTS
Vehicle testing was performed at a Ford’s Allen Park Test Laboratories, a full-scale
automotive test facility equipped with roller dynamometers capable of performing a range of
tests including the EPA city and highway driving cycles used to certify production
automobiles. These ‘traces’ are shown in Figure 5.1 and are also known as the Federal Urban
Driving Schedule (FUDS) and the Highway Fuel Economy Test (HWFET). The FUDS is
1369 seconds long, covering a distance of 12 km (7.45 miles) at an average speed of 31.6
km/h (19.59 mph). In contrast, the HWFET is 765 seconds long covering 16.5 km (10.26
miles) at an average speed of 77.9 km/h (48.3 mph). The Virginia Tech FC-HEV completed
each of these tests running on hydrogen as a fuel cell hybrid vehicle.
0.0
10.0
20.0
30.0
40.0
50.0
60.0
70.0
0 200 400 600 800 1000 1200 1400Time (s)
Vehi
cle
Spee
d (m
ph)
CityHighway
Figure 5.1. EPA City and Highway Driving Cycle Speed Traces
Dynamometer tests were successfully completed. However, problems that developed prior to
testing prevented the vehicle from operating as a charge sustaining hybrid vehicle as it was
originally designed. Damage to the hydrogen fuel cell prevented it from reaching the higher
operating points that would have provided enough power to maintain the charge in the vehicle
battery pack. Because of the reduced power output from the fuel cell, a net amount of energy
was withdrawn from the battery pack during the testing, which would have halted operation
32
after the batteries were discharged completely. Had the damage not occurred, it is believed
that the system would have been able to sustain its charge during successive driving cycles
until the onboard hydrogen storage was depleted.
VEHICLE AND SYSTEM EFFICIENCY
As seen in Figures 5.2 and 5.3, peak efficiency of the Virginia Tech fuel cell system is
comparable with that of conventional energy generation systems and is somewhat less than
what has recently been made possible in lightweight diesel and DI-gasoline engines.
Although fuel cells have amazing efficiency potential at both design and off-design, the
engineering challenge is not trivial when all aspects of operating a fuel cell system are
considered. Poor attention to detail can quickly yield a system that barely produces any net
power at all. When viewing the data presented from the HEVT’s work, one must consider
that this particular fuel cell system was built completely by undergraduate students with no
prior experience with fuel cells and little more than a list of guidelines to start with. Their
achievement is an impressive show of ingenuity and persistence. Given only eight months to
complete their task, there is much room for improvement in the control and operation of the
system itself and in the integration of the system into the Chevrolet Lumina chassis. Items for
improvement, discussed later in this chapter, include weight reduction, air compressor load,
and control strategy optimization.

33
City Cycle - Fuel Cell Efficiencies
0
0.1
0.2
0.3
0.4
0.5
0.6
0.7
0.8
0 2500 5000 7500 10000 12500 15000Power (Watts)
Eff (
%/1
00)
Stack Efficiency
System Efficiency
(Gross Stack Power)
(Net System Power)
Figure 5.2. City - Electric Generation Efficiencies
Highway Cycle - Fuel Cell Efficiencies
0
0.1
0.2
0.3
0.4
0.5
0.6
0.7
0.8
0 2500 5000 7500 10000 12500Power (watts)
Eff (
%/1
00)
Stack Efficiency
System Efficiency
(Gross Stack Power)
(Net System Power)
Figure 5.3. Highway - Electric Generation Efficiencies

34
An average efficiency for ANIMUL H2 as a hybrid electric vehicle for each drive cycle can be
estimated by dividing the total amount of energy required at the wheels by the total energy
required as input to the fuel cell.
η =WheelEnergy
FuelCellInputEnergy
An average efficiency for the drivetrain can also be calculated in this manner using the energy
at the battery terminals in place of the fuel cell input energy. The wheel, fuel cell, and battery
energies are taken from an ADVISOR simulation that assumed a 4.4-kW accessory load (a
combined load number for all pumps, fans, compressors, and other components required to
operate the fuel cell subsystems and the vehicle systems) and included regenerative braking.
Table 5.1 shows the results of these calculations. Table 5.1. System Efficiencies
Cycle FC system (peak) Chemical to electrical
Drivetrain (avg) Electric to mechanical
Vehicle + Drivetrain (avg) Electrical to mechanical (pver
drive cycle - not incl. fuel cell)
City (FUDS) 35.5% 75.1% 66%
Highway(HWFET) 29.8% 84.4% 73%
SUGGESTED IMPROVEMENTS AND OTHER ISSUES
To put a vehicle of this type into full scale production, countless changes would need to be
made to both the fuel cell systems and to the vehicle itself. Mass has a large impact on
vehicle efficiency and the VT FC-HEV weight 2000 kg (4400 lb) which is 30% heavier than a
stock Chevrolet Lumina. When designing fuel cell vehicles, it is difficult to fit the
components required for such a system into the space left by removing a gasoline tank and
combustion engine. A vehicle design that is driven by fuel cell packaging from the start can
incorporate innovative use of lightweight materials and components to reduce overall vehicle
weight. The estimated fuel economy for a redesign of the Virginia Tech FC-HEV built this
way is 50 miles per gallon of gasoline equivalent energy, or nearly twice the stock vehicle’s
35
fuel mileage. To achieve the PNGV goal of three times stock fuel economy will require new
vehicle technology to be designed into the vehicle from the start.
The fuel cell stack in the VT FC-HEV was rated at 0.6 V/cell, but during operation on the
dynamometer was pushed to lower than desired cell voltages. Because fuel cell efficiency is
directly proportional to cell voltage, this operating condition had a detrimental impact on
overall system efficiency. A fuel cell stack can be rated at any cell voltage, which means that
while a higher selected nominal cell voltage would result in a larger stack size, it would be a
more efficient system overall (Fuchs, 2000).
Another area of improvement that would significantly increase the overall fuel cell system
efficiency is air compressor load-following control (Friedman, 1998). At high loads, the air
compressor must supply maximum flow, consuming large amounts of power. However, if the
stack is under a light load it is ideal for the air compressor to provide a minimum flow to
boost system efficiency. Because the Virginia Tech FC-HEV does not currently have such a
system, efficiency at low system power is very poor. To be mass-producible, an air
compression system would need to be made of a low cost material such as plastic,
accommodate water injection to aid in humidification, eliminate bulky external humidifiers,
and operate without a separate and costly electric motor drive.
Some approaches to air compression include operation at ambient or near-ambient conditions,
eliminating the need for an expensive compression system with high parasitic loads. Yet an
issue related to the laws of thermodynamics and the balance of water in the system arises
where at low system pressure not enough water can be collected through simple means to
supply a pre-stack standard humidification system. Several manufacturers are attempting to
work around this problem through the use of membranes that are self-humidifying or by using
a stack design that does the humidification internally. These would certainly be valuable
technologies as they also help address the issue of deionized water freezing inside
conventional humidification designs at startup conditions below 0° C (32° F).
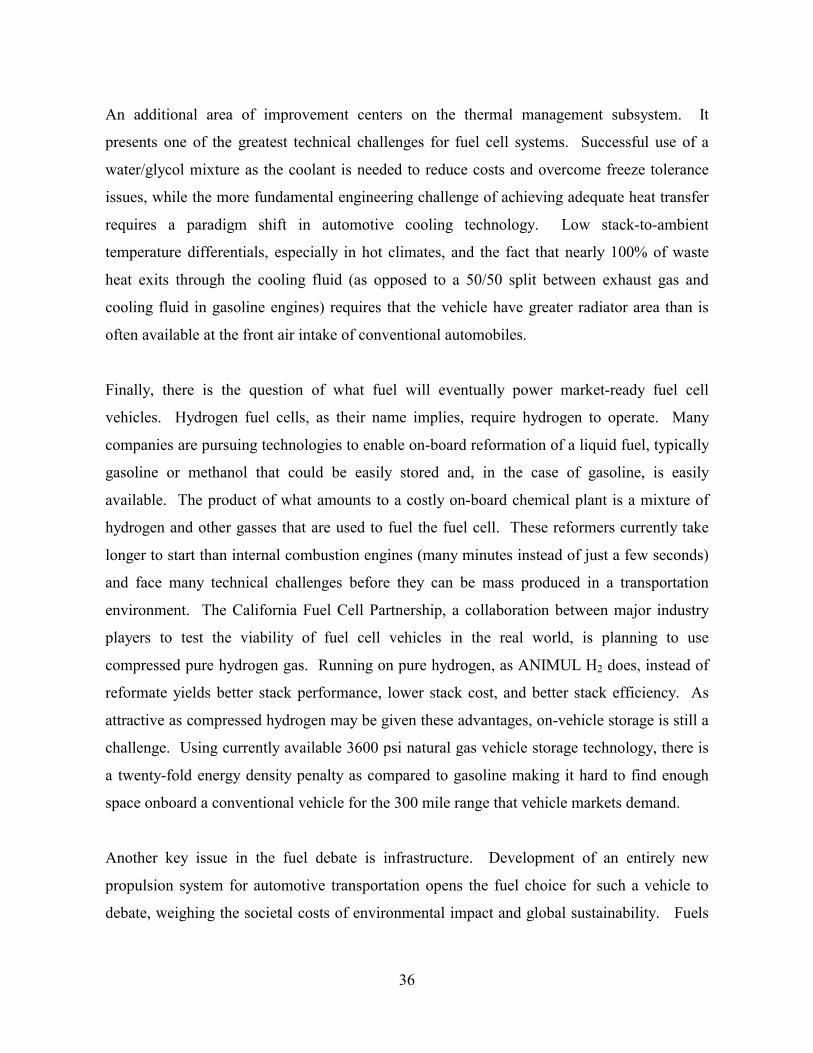
36
An additional area of improvement centers on the thermal management subsystem. It
presents one of the greatest technical challenges for fuel cell systems. Successful use of a
water/glycol mixture as the coolant is needed to reduce costs and overcome freeze tolerance
issues, while the more fundamental engineering challenge of achieving adequate heat transfer
requires a paradigm shift in automotive cooling technology. Low stack-to-ambient
temperature differentials, especially in hot climates, and the fact that nearly 100% of waste
heat exits through the cooling fluid (as opposed to a 50/50 split between exhaust gas and
cooling fluid in gasoline engines) requires that the vehicle have greater radiator area than is
often available at the front air intake of conventional automobiles.
Finally, there is the question of what fuel will eventually power market-ready fuel cell
vehicles. Hydrogen fuel cells, as their name implies, require hydrogen to operate. Many
companies are pursuing technologies to enable on-board reformation of a liquid fuel, typically
gasoline or methanol that could be easily stored and, in the case of gasoline, is easily
available. The product of what amounts to a costly on-board chemical plant is a mixture of
hydrogen and other gasses that are used to fuel the fuel cell. These reformers currently take
longer to start than internal combustion engines (many minutes instead of just a few seconds)
and face many technical challenges before they can be mass produced in a transportation
environment. The California Fuel Cell Partnership, a collaboration between major industry
players to test the viability of fuel cell vehicles in the real world, is planning to use
compressed pure hydrogen gas. Running on pure hydrogen, as ANIMUL H2 does, instead of
reformate yields better stack performance, lower stack cost, and better stack efficiency. As
attractive as compressed hydrogen may be given these advantages, on-vehicle storage is still a
challenge. Using currently available 3600 psi natural gas vehicle storage technology, there is
a twenty-fold energy density penalty as compared to gasoline making it hard to find enough
space onboard a conventional vehicle for the 300 mile range that vehicle markets demand.
Another key issue in the fuel debate is infrastructure. Development of an entirely new
propulsion system for automotive transportation opens the fuel choice for such a vehicle to
debate, weighing the societal costs of environmental impact and global sustainability. Fuels

37
should be judged on their ability to improve fuel efficiency, lower total system cost, and
reduce environmental impact on a well-to-wheels basis, i.e. tracking fuel impact through
extraction, refining, distribution, and on-vehicle usage.

38
CHAPTER 6. MODELING AND VALIDATION
ADVISOR is a simulation package based on Simulink block diagrams and supported by
Matlab data files that contain vehicle configuration, control, and performance data. Unlike
other simulation packages, which are set up only as executable code, these files are by their
nature the source code for the simulation. Because of their graphical nature and
straightforward construction, the block diagrams are almost self-documenting, making
modification relatively easy. This also makes ADVISOR well suited for collaboration
between researchers and for distribution to the public. The graphical user interface (GUI)
from release 2.2 of ADVISOR is shown in Figure 6.1.
Figure 6.1. ADVISOR GUI, Vehicle Setup Screen
ADVISOR incorporates many drivetrain types including conventional internal combustion
engines (ICE’s), electric, series and parallel hybrid, and fuel cell hybrid models (Wipke,
Cuddy, and Burch, 1999). The fuel cell model that was originally integrated into ADVISOR
2.1 provided a temporary way of including a fuel cell hybrid simulation capability in a
modeling package originally designed for ICE hybrids. However, this is not an ideal method
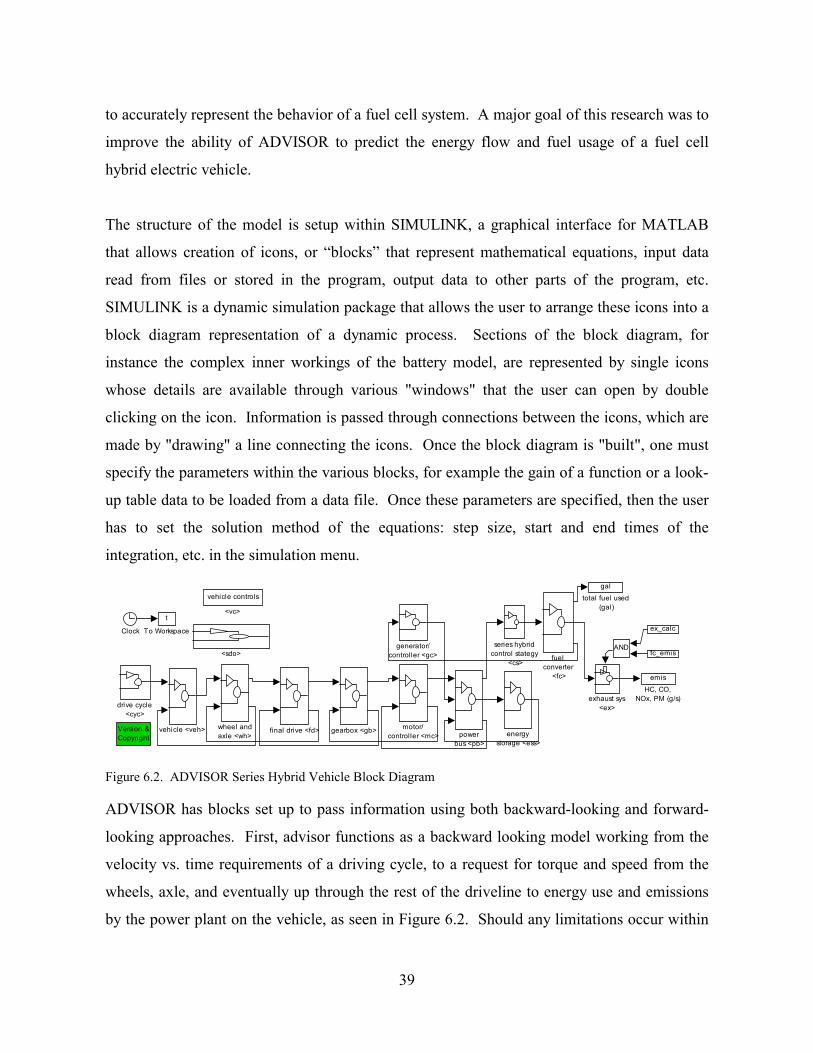
39
to accurately represent the behavior of a fuel cell system. A major goal of this research was to
improve the ability of ADVISOR to predict the energy flow and fuel usage of a fuel cell
hybrid electric vehicle.
The structure of the model is setup within SIMULINK, a graphical interface for MATLAB
that allows creation of icons, or “blocks” that represent mathematical equations, input data
read from files or stored in the program, output data to other parts of the program, etc.
SIMULINK is a dynamic simulation package that allows the user to arrange these icons into a
block diagram representation of a dynamic process. Sections of the block diagram, for
instance the complex inner workings of the battery model, are represented by single icons
whose details are available through various "windows" that the user can open by double
clicking on the icon. Information is passed through connections between the icons, which are
made by "drawing" a line connecting the icons. Once the block diagram is "built", one must
specify the parameters within the various blocks, for example the gain of a function or a look-
up table data to be loaded from a data file. Once these parameters are specified, then the user
has to set the solution method of the equations: step size, start and end times of the
integration, etc. in the simulation menu.
wheel andaxle <wh>
vehicle <veh>
gal
total fuel used (gal)
series hybridcontrol stategy
<cs>
powerbus <pb>
motor/controller <mc>
generator/controller <gc>
gearbox <gb>
fuelconverter
<fc>
final drive <fd>
exhaust sys<ex>
energystorage <ess>
drive cycle<cyc>
fc_emis
ex_calct
To Workspace
Version &Copyright
AND
emis
HC, CO,NOx, PM (g/s)
Clock
vehicle controls
<vc>
<sdo>
Figure 6.2. ADVISOR Series Hybrid Vehicle Block Diagram
ADVISOR has blocks set up to pass information using both backward-looking and forward-
looking approaches. First, advisor functions as a backward looking model working from the
velocity vs. time requirements of a driving cycle, to a request for torque and speed from the
wheels, axle, and eventually up through the rest of the driveline to energy use and emissions
by the power plant on the vehicle, as seen in Figure 6.2. Should any limitations occur within

40
any of the blocks that make up the vehicle driveline, for instance a maximum speed or current
limit of an electric motor, ADVISOR uses its forward-looking capabilities to pass this
limitation back down through the model’s blocks to calculate the actual flow of power
through the vehicle’s components resulting in calculation of true speed, energy use, and
emissions production from the vehicle.
FUEL CELL SUBSYSTEMS
The goal of an ADVISOR model is to produce a computer simulation of the energy storage,
energy generation, and energy flow within a vehicle that is required to propel it along at a
particular speed versus time trace. Figure 4.3 shows the systems that store and generate
energy aboard the VT FC-HEV and that are incorporated into the modified ADVISOR model
developed for ADVISOR 2.2. The following section will detail the development of new
blocks to represent the components of the VT FC-HEV within SIMULINK.
Fuel Cell Stack
Energy Partners, Inc. (EP) completed fuel cell stack performance testing in a laboratory
setting under controlled conditions before shipping. This testing was verified by system tests
at Virginia Tech and by on-vehicle testing at the FutureCar Challenge. Data from this test is
labeled as IN HEV in Figure 6.3. Although the stack did not perform as well in the vehicle as
it did in the laboratory, the differences can be explained by quality of reactant streams as well
as minor damage to the stack that occurred prior to testing in the vehicle.
The fuel cell stack is modeled as a one dimensional lookup table, producing an efficiency
output based on an electrical power request. The electric power request is divided by the
efficiency to produce a number representing the power required in fuel to produce that
amount of electricity from the fuel cell stack.
41
40
50
60
70
80
90
100
110
0 200 400 600 800 1000 1200 CURRENT DENSITY (mA/cm^2)
STACK VOLTAGE
@170kPa (EP) @170kPa (IN HEV)
Date: 5-19-99 H2/air stoic: ~1.2/2.0 # of cells: 110 Temp. (deg. C): 60 Active area (cm^2): 292 H2/air humid (deg. C): 60
Figure 6.3. Polarization Curve, Manufacturer vs. FC-HEV
It is possible to model a fuel cell stack in a much more fundamental manner, incorporating
electrochemistry, thermal characteristics, and mass transfer, but such a model is not necessary
for vehicle level performance analysis as accomplished in ADVISOR.
Accessory Loads
To operate a fuel cell system, there are peripherals that inherently consume power as they
support the reaction of gasses within the fuel cell. In the Virginia Tech system, these loads
have been grouped into two areas. The first is a power value in watts equivalent to the rate of
energy consumption by the air compressor subsystem. The second is a value that represents
all other fuel cell accessories required to operate the fuel cell system, including thermal
control through a water cooling loop with pump and fans, humidification control pumps,
water recovery using 2 small pumps, and fans that provide cooling for both the fuel cell and
power electronics. These constant loads were lumped together with the air compressor load to
create an accessory power block (Figure 6.4) in addition to existing vehicle accessories

42
1Power draw from buss
acc_lossesTo Workspace3Sum
Product
air_compressor_pwr
Air Comp Power Usage (W)
DC_DC_pwr
13.8 V DC/DC Power Usage (W)(pumps, fans, electronic loads)
1On signal from Control Strat.
Figure 6.4. Accessory Load Block
The accessory block shows how the air compressor power is incorporated as a simple constant
load accessory of the fuel cell system. This block also incorporates the additional 12V loads
incurred by pumps and fans that are mentioned above.
Boost Converter
As discussed in Chapter 4, ANIMUL H2’s load following control for the fuel cell power level
is incorporated in the boost converter. This unit needs only two inputs: buss voltage from the
battery pack (energy storage system) and an on/off signal from the control system (Figure
6.5).
2
Power RequiredFrom Fuel Cell
1
Boost Convoutput power onto bus (W)
limit to max and min
cs_ pwr
bc_pwr_out_aTo Workspace9
bus_voltage
To Workspace4bc_eff
To Workspace3fc_pwr_out
To Workspace1
Product2
Product1
Product
???
Look-Up Table - Output Pwr given bus_voltage
???
Look-Up TableIn:bus_voltage Out: eff%
Limit CurrentOutput of Boost
[bus_voltage]
From<ess>
BlockNOTES
>=0
1
On/Off signal from control strategy
Figure 6.5. Boost Converter Block
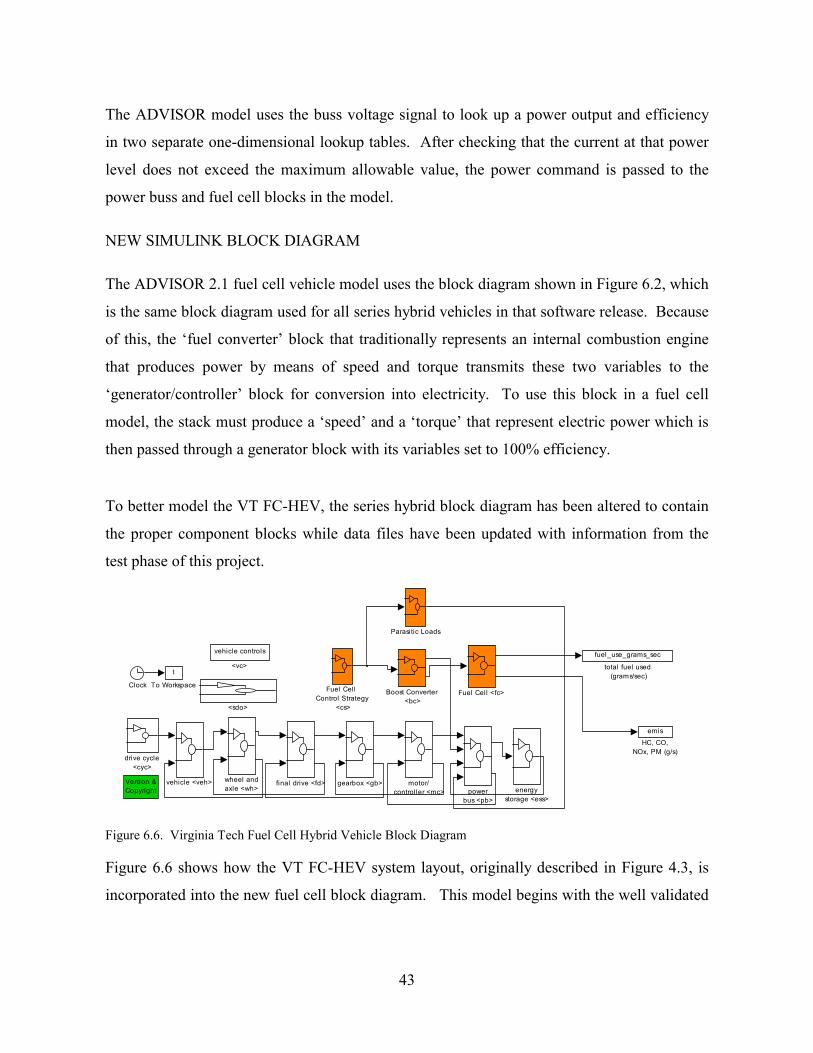
43
The ADVISOR model uses the buss voltage signal to look up a power output and efficiency
in two separate one-dimensional lookup tables. After checking that the current at that power
level does not exceed the maximum allowable value, the power command is passed to the
power buss and fuel cell blocks in the model.
NEW SIMULINK BLOCK DIAGRAM
The ADVISOR 2.1 fuel cell vehicle model uses the block diagram shown in Figure 6.2, which
is the same block diagram used for all series hybrid vehicles in that software release. Because
of this, the ‘fuel converter’ block that traditionally represents an internal combustion engine
that produces power by means of speed and torque transmits these two variables to the
‘generator/controller’ block for conversion into electricity. To use this block in a fuel cell
model, the stack must produce a ‘speed’ and a ‘torque’ that represent electric power which is
then passed through a generator block with its variables set to 100% efficiency.
To better model the VT FC-HEV, the series hybrid block diagram has been altered to contain
the proper component blocks while data files have been updated with information from the
test phase of this project.
wheel andaxle <wh>
vehicle <veh>
fuel_use_grams_sec
total fuel used (grams/sec)
powerbus <pb>
motor/controller <mc>
gearbox <gb>final drive <fd>energy
storage <ess>
drive cycle<cyc>
t
To Workspace
Parasitic Loads
Version &Copyright
emis
HC, CO,NOx, PM (g/s)
Fuel Cell <fc>Fuel Cell Control Strategy
<cs>
ClockBoost Converter
<bc>
vehicle controls
<vc>
<sdo>
Figure 6.6. Virginia Tech Fuel Cell Hybrid Vehicle Block Diagram
Figure 6.6 shows how the VT FC-HEV system layout, originally described in Figure 4.3, is
incorporated into the new fuel cell block diagram. This model begins with the well validated

44
electric drivetrain model that exists within ADVISOR (Senger, Merkle, and Nelson, 1998)
and adds the components that make up the fuel cell system in the current VT FC-HEV.
VALIDATION OF THE MODEL WITH VEHICLE DATA
Differences between the designed operating parameters for the vehicle and the way the
vehicle actually functioned during the dynamometer testing (discussed in chapter five), the
original model that was based on component data prior to vehicle construction had to be
altered slightly before validation. The main change was to the power transfer model in the
boost converter. Because the fuel cell was not able to produce the expected power, the boost
converter was limited in the amount of power it could supply to the vehicle, effectively
operating on a different power transfer curve, as seen in the ‘vehicle test data’ in Figure 4.10.
This power transfer characteristic was altered in the model to produce a behavior that matched
the reduction in available power, so that the model could emulate the way the vehicle actually
performed. Similarly the battery pack’s operational characteristics fell outside the range
previously expected, and the model data was adjusted to represent pack performance data as
measured during the test.
It is immediately apparent that the plots of data from the boost converter manufacturer, from
out-of-vehicle testing, and from in-vehicle testing do not totally agree (See Figure 4.10). The
reason for this lies within the fundamental design of the boost converter, as much of the
internal controls that relate its output power to output voltage are preprogrammed to account
for changes of both input and output voltages. Changes in these voltages greatly affect the
power transfer of the system. Even more importantly the boost converter protected the fuel
cell from being overloaded. An abnormally low fuel cell voltage, such as that caused by fuel
cell damage present during the test, would cause the boost converter to limit power output. It
is important to note that the vehicle test data and the system data do follow very similar trends
During normal operation, a decrease in battery voltage at the output terminals would cause an
increase in power transfer. During times when the fuel cell was unable to provide the
requested power and its voltage fell due to overloading, the boost converter would relax its
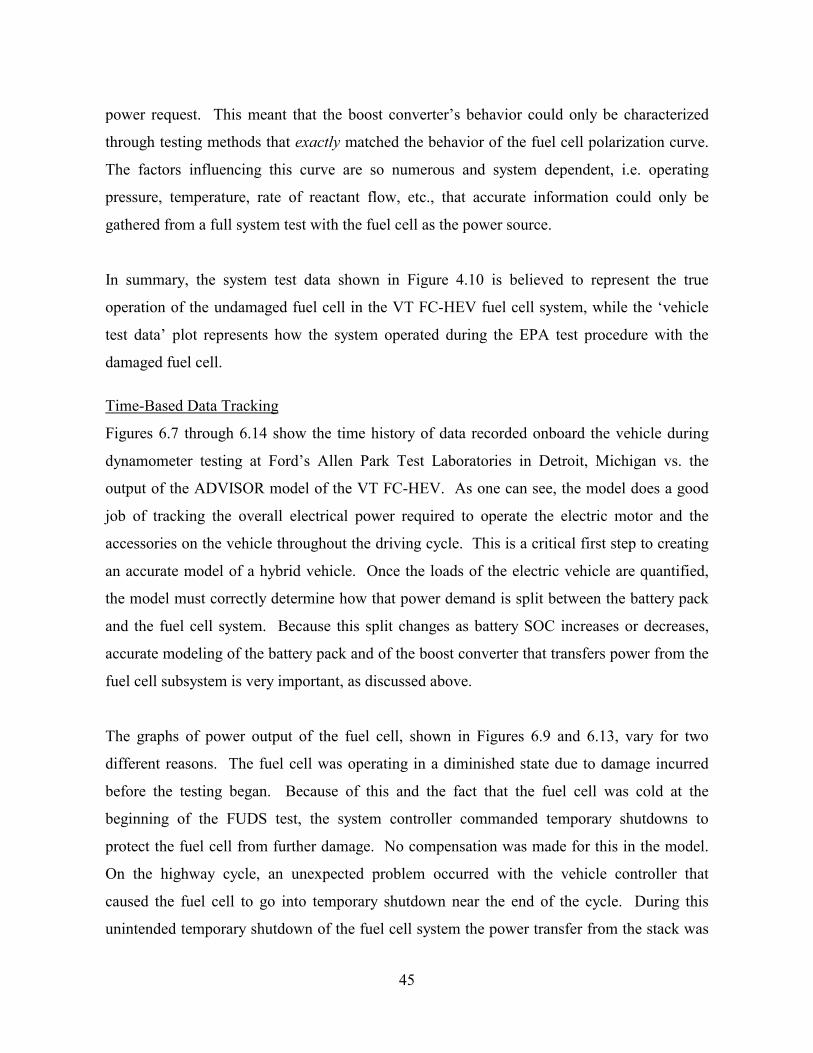
45
power request. This meant that the boost converter’s behavior could only be characterized
through testing methods that exactly matched the behavior of the fuel cell polarization curve.
The factors influencing this curve are so numerous and system dependent, i.e. operating
pressure, temperature, rate of reactant flow, etc., that accurate information could only be
gathered from a full system test with the fuel cell as the power source.
In summary, the system test data shown in Figure 4.10 is believed to represent the true
operation of the undamaged fuel cell in the VT FC-HEV fuel cell system, while the ‘vehicle
test data’ plot represents how the system operated during the EPA test procedure with the
damaged fuel cell.
Time-Based Data Tracking
Figures 6.7 through 6.14 show the time history of data recorded onboard the vehicle during
dynamometer testing at Ford’s Allen Park Test Laboratories in Detroit, Michigan vs. the
output of the ADVISOR model of the VT FC-HEV. As one can see, the model does a good
job of tracking the overall electrical power required to operate the electric motor and the
accessories on the vehicle throughout the driving cycle. This is a critical first step to creating
an accurate model of a hybrid vehicle. Once the loads of the electric vehicle are quantified,
the model must correctly determine how that power demand is split between the battery pack
and the fuel cell system. Because this split changes as battery SOC increases or decreases,
accurate modeling of the battery pack and of the boost converter that transfers power from the
fuel cell subsystem is very important, as discussed above.
The graphs of power output of the fuel cell, shown in Figures 6.9 and 6.13, vary for two
different reasons. The fuel cell was operating in a diminished state due to damage incurred
before the testing began. Because of this and the fact that the fuel cell was cold at the
beginning of the FUDS test, the system controller commanded temporary shutdowns to
protect the fuel cell from further damage. No compensation was made for this in the model.
On the highway cycle, an unexpected problem occurred with the vehicle controller that
caused the fuel cell to go into temporary shutdown near the end of the cycle. During this
unintended temporary shutdown of the fuel cell system the power transfer from the stack was

46
turned off but the accessories were left on. This meant that the fuel cell subsystems, such as
pumps and fans, were using power from the battery pack. To more accurately model this
occurrance, the model’s fuel cell system started later than the vehicle’s fuel cell during the
actual test, but this is accounted for by the fact that the fuel cell was off for a matching
amount of time at the end of the cycle. During times when this shutdown occurred on the
vehicle, the additional energy required from the batteries shows up as a divergence in the amp
hour data plots, as shown in Figures 6.10 and 6.14.
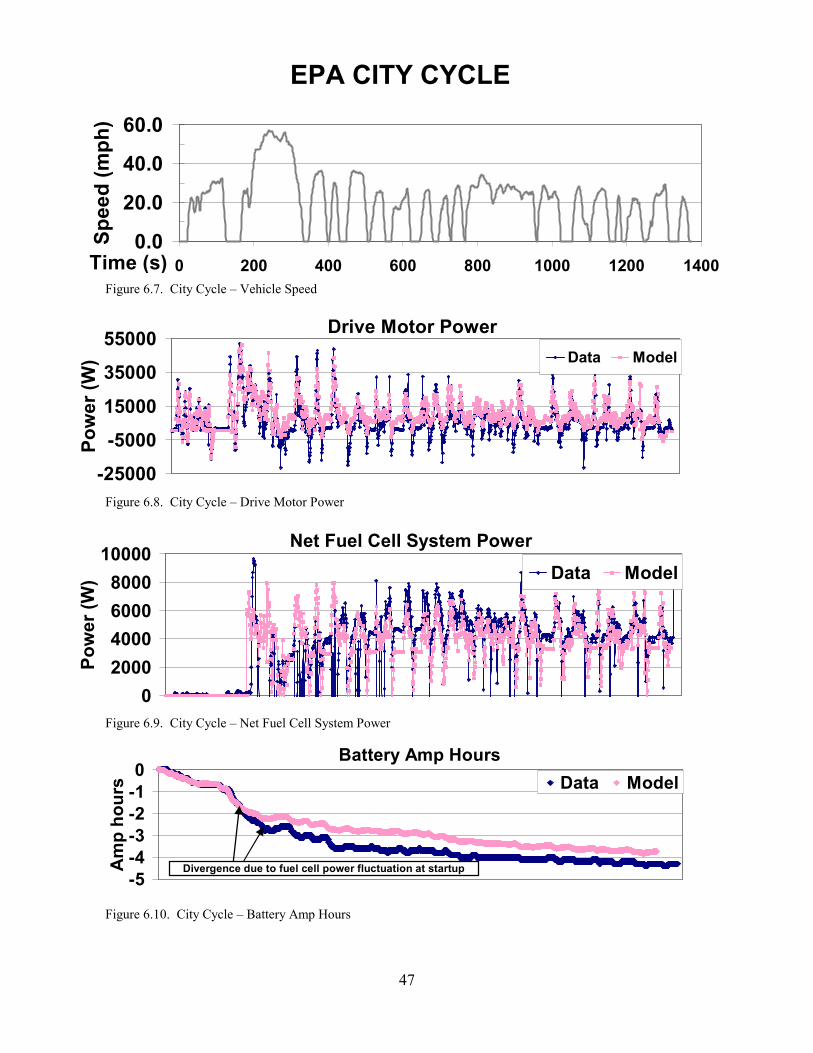
0.0
20.0
40.0
60.0
0 200Time (s)
Spee
d (m
ph)
Figure 6.7. City Cycle – Vehicle
-25000-500015000
3500055000
Pow
er (W
)
Figure 6.8. City Cycle – Drive M
02000400060008000
10000
Pow
er (W
)
Figure 6.9. City Cycle – Net Fue
-5-4-3-2-10
Am
p ho
urs
Divergence due to
Figure 6.10. City Cycle – Batter
EPA CITY CYCLE47
400 600 800 1000 1200 1400 Speed
Drive Motor PowerData Model
otor Power
Net Fuel Cell System PowerData Model
l Cell System Power
Battery Amp HoursData Model
fuel cell power fluctuation at startup
y Amp Hours
48
0.020.040.060.0
0 100 200 300 400 500 600 700 800
Spee
d (m
ph)
Figure 6.11. Highway Cycle – Vehicle Speed
Drive Motor Power
-40000-20000
0200004000060000
Pow
er (W
) Data Model
Figure 6.12. Highway Cycle – Drive Motor Power
Net Fuel Cell System Power
02000400060008000
10000
Pow
er (W
) Data Model
Figure 6.13. Highway Cycle – Net Fuel Cell system Power
Battery Amp Hours
-8-6-4-20
Am
p ho
urs Model Data
Divergence due to unintended fuel cell shutdown in testing
Figure 6.14. Highway Cycle – Battery Amp Hours
EPA HIGHWAY CYCLE
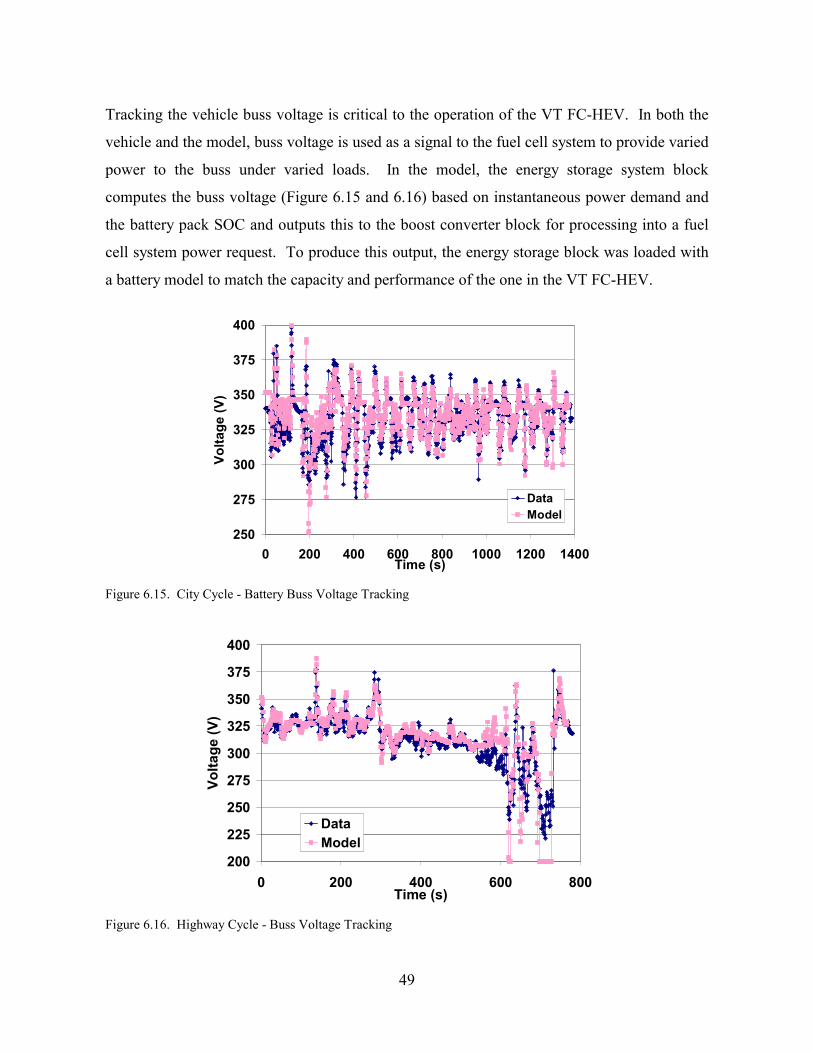
49
Tracking the vehicle buss voltage is critical to the operation of the VT FC-HEV. In both the
vehicle and the model, buss voltage is used as a signal to the fuel cell system to provide varied
power to the buss under varied loads. In the model, the energy storage system block
computes the buss voltage (Figure 6.15 and 6.16) based on instantaneous power demand and
the battery pack SOC and outputs this to the boost converter block for processing into a fuel
cell system power request. To produce this output, the energy storage block was loaded with
a battery model to match the capacity and performance of the one in the VT FC-HEV.
250
275
300
325
350
375
400
0 200 400 600 800 1000 1200 1400Time (s)
Volta
ge (V
)
DataModel
Figure 6.15. City Cycle - Battery Buss Voltage Tracking
200
225
250
275
300
325
350
375
400
0 200 400 600 800Time (s)
Volta
ge (V
)
DataModel
Figure 6.16. Highway Cycle - Buss Voltage Tracking

50
Further proof that tracking of the buss voltage and the upstream calculation of net power
generated by the fuel cell system are accurate is shown in Figure 6.15. On a reduced time
scale of 100 seconds and a reduced power scale of 4500 W, the vehicle data and model results
match very well.
4000
5500
7000
8500
300 320 340 360 380 400Time (s)
Pow
er (W
)
Data Model
Figure 6.17. Detailed Data Tracking
Energy Consumption
The fuel use numbers shown in Figure 6.1 combine the energy used from the energy storage
system, which was recharged with power generated at a power plant, with the hydrogen fuel
used to generate power in the fuel cell system. Table 6.1. Energy Usage
Energy Flow
(Watt-hrs)
Fuel Cell
System
Battery
Use
Motor and
Accessory Use
City 2725 1185 3910
Highway 3035 3540 6575

51
Had the fuel cell system been functioning at full power, the energy storage system would have
remained nearly charged and the majority of the power would have been generated directly
from hydrogen. Fuel economy values listed in Table 6.2 are also taken from dynamometer
data. These values represent the EPA unadjusted miles per gallon gasoline equivalent of the
vehicle. Table 6.2. Gasoline-equivalent Fuel Economy
MPGGE Highway City VT_FuelCell Model Prediction
28.3 29.1
Data: from tank pressure 26.8 29.1
Overall Energy Consumption
As shown in Figures 6.16 and 6.17, total electric energy use and generation is very similar
between modeling and testing, validating the viability of the vehicle and boost converter
models. Overall fuel use is slightly off in the highway driving cycle but was very accurate in
the city cycle. This is due in part to the fact that the data used to predict fuel use was
averaged over the both the city and highway cycles. Because the city cycle is nearly twice as
long as the highway cycle, the fuel use during this period has a greater impact on the averaged
data than the highway cycle.
0
500
1000
1500
2000
2500
3000
Model Data
Ener
gy (W
-hou
r)
BatteryFuel Cell

52
Figure 6.18. City Cycle - Total Energy Use
0
1000
2000
3000
4000
5000
6000
Model Data
Ener
gy (k
W-h
our)
BatteryFuel Cell
Figure 6.19. Highway Cycle - Total Energy Use
Other factors that have an effect on the data include thermal issues, since the fuel cell system
was fully warmed up on the highway cycle and performed differently than when it underwent
a cold-start during the city cycle. The model did not incorporate thermal compensation and
could not incorporate this effect in final fuel economy numbers.
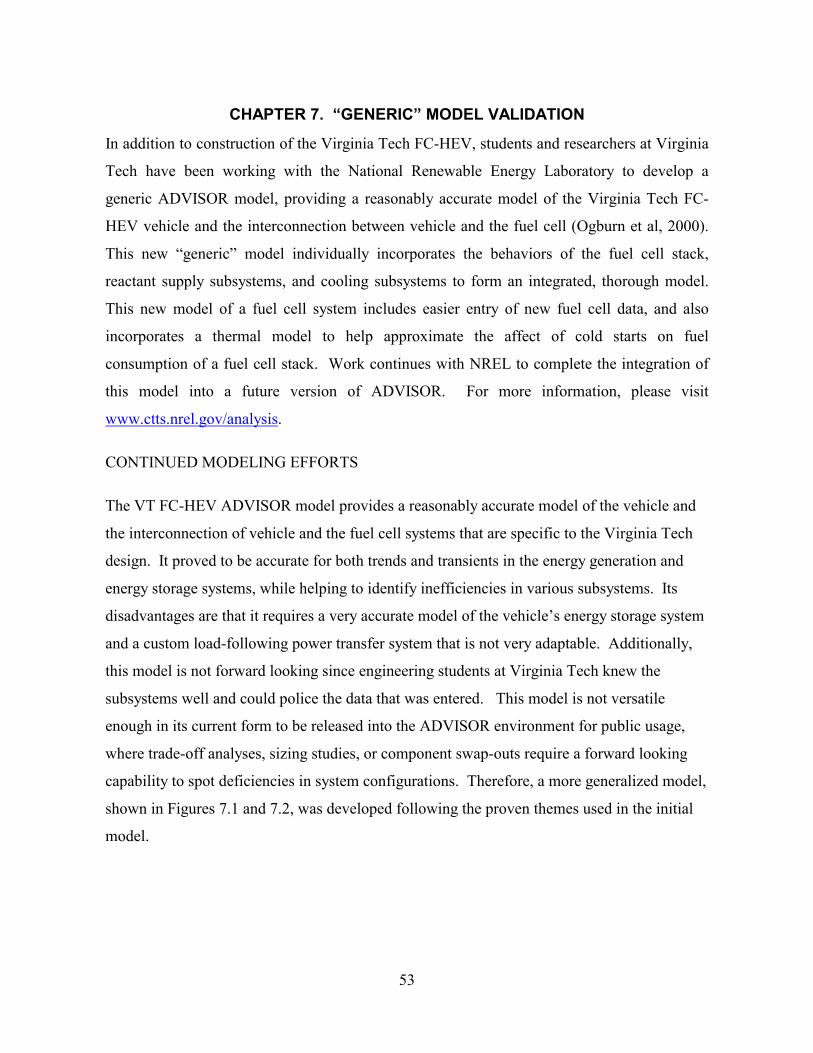
53
CHAPTER 7. “GENERIC” MODEL VALIDATION
In addition to construction of the Virginia Tech FC-HEV, students and researchers at Virginia
Tech have been working with the National Renewable Energy Laboratory to develop a
generic ADVISOR model, providing a reasonably accurate model of the Virginia Tech FC-
HEV vehicle and the interconnection between vehicle and the fuel cell (Ogburn et al, 2000).
This new “generic” model individually incorporates the behaviors of the fuel cell stack,
reactant supply subsystems, and cooling subsystems to form an integrated, thorough model.
This new model of a fuel cell system includes easier entry of new fuel cell data, and also
incorporates a thermal model to help approximate the affect of cold starts on fuel
consumption of a fuel cell stack. Work continues with NREL to complete the integration of
this model into a future version of ADVISOR. For more information, please visit
www.ctts.nrel.gov/analysis.
CONTINUED MODELING EFFORTS
The VT FC-HEV ADVISOR model provides a reasonably accurate model of the vehicle and
the interconnection of vehicle and the fuel cell systems that are specific to the Virginia Tech
design. It proved to be accurate for both trends and transients in the energy generation and
energy storage systems, while helping to identify inefficiencies in various subsystems. Its
disadvantages are that it requires a very accurate model of the vehicle’s energy storage system
and a custom load-following power transfer system that is not very adaptable. Additionally,
this model is not forward looking since engineering students at Virginia Tech knew the
subsystems well and could police the data that was entered. This model is not versatile
enough in its current form to be released into the ADVISOR environment for public usage,
where trade-off analyses, sizing studies, or component swap-outs require a forward looking
capability to spot deficiencies in system configurations. Therefore, a more generalized model,
shown in Figures 7.1 and 7.2, was developed following the proven themes used in the initial
model.

54
wheel andaxle <wh>
vehicle <veh>
fuel_use_gram s_sec
to ta l fue l used (gram s/sec)
powerbus <pb>
m otor/control le r <m c>
gearbox <gb>
fuel ce l l hybridcontrol sta tegy
<cs>fuel ce l l
system <fc>
fina l d ri ve <fd>energy
storage <ess>
drive cycle<cyc>
t
T o Workspace
Version &Copyright
Clock
vehicle controls
<vc>
<sdo>
Figure 7.1. Generic Fuel Cell Model
3fue l use (g /s)
2e m is in fo
1Net pw r out a (W )
prev fue l us e (g /s )
S u m
S U MFue l C e ll S tac k Au x ila rie s 1Auxilarie s
1pw r req
(W )
Figure 7.2. Generic Fuel Cell Model – System Level Details
The data files have been included to show the final format chosen by NREL. For more
information on the formatting as well as the basics of how to modify ADVISOR 2.2 to
properly model a specific fuel cell vehicle, please see Appendix II.
Validation of the "Generic Fuel Cell Model"
This model of a fuel cell system in ADVISOR is designed to integrate the new "Generic Fuel
Cell Model" into the default series hybrid vehicle model for comparison to data from the 1999
FutureCar Challenge. Several major changes, partially shown in Figure 7.2, have been made
from the original VT_FUELCELL model discussed up to this point, in an attempt to better

55
represent actual fuel cell systems.
wh ee l a ndaxle <wh >
ve h icle <ve h>
ga l
to ta l fue l u sed (g a l )
p rev va l ue
po we rbu s <pb >
m oto r/co n tro l le r <m c>
ge arb ox <g b>
fu e lco nverte r
< fc> fo r fue lce l l
fin a l d rive < fd>
exha ust sys<e x>
en erg ysto ra ge <ess>
drive cycle<cyc>
fc_em is
ex_ca lc
t
T o Workspa ce
T e rm ina to r
Ve rsi on &Co pyrigh t
AND
em is
HC, CO,NO x, PM (g /s)
Fu e l Ce l l Co n tro l S tra teg y
<cs>
Cl ockBo ost Co nverte r
<bc>
ve h icle con tro ls
<vc>
<sdo >
Figure 7.3. Generic Fuel Cell Model – modified for comparison to the VT_FUELCELL model.
The goal of these changes was to produce a model that is more straightforward and allows
user access to system level and stack parameters. Figures 7.4 and 7.5 compare the 1999
FutureCar Challenge data to the “Generic Model” results. Rather than use the standard series
power follower control strategy found in ADVISOR, a boost converter style of power request
based on buss voltage was used to command the power level of the fuel cell system block.
The re-integration of the boost converter block’s power command function into the new
‘generic’ fuel cell system model is shown in Figure 7.4.
0
2500
5000
7500
10000
0 250 500 750 1000 1250Time (s)
Pow
er (W
)
Data Model
Figure 7.4. City Cycle - Fuel Cell System Power Tracking
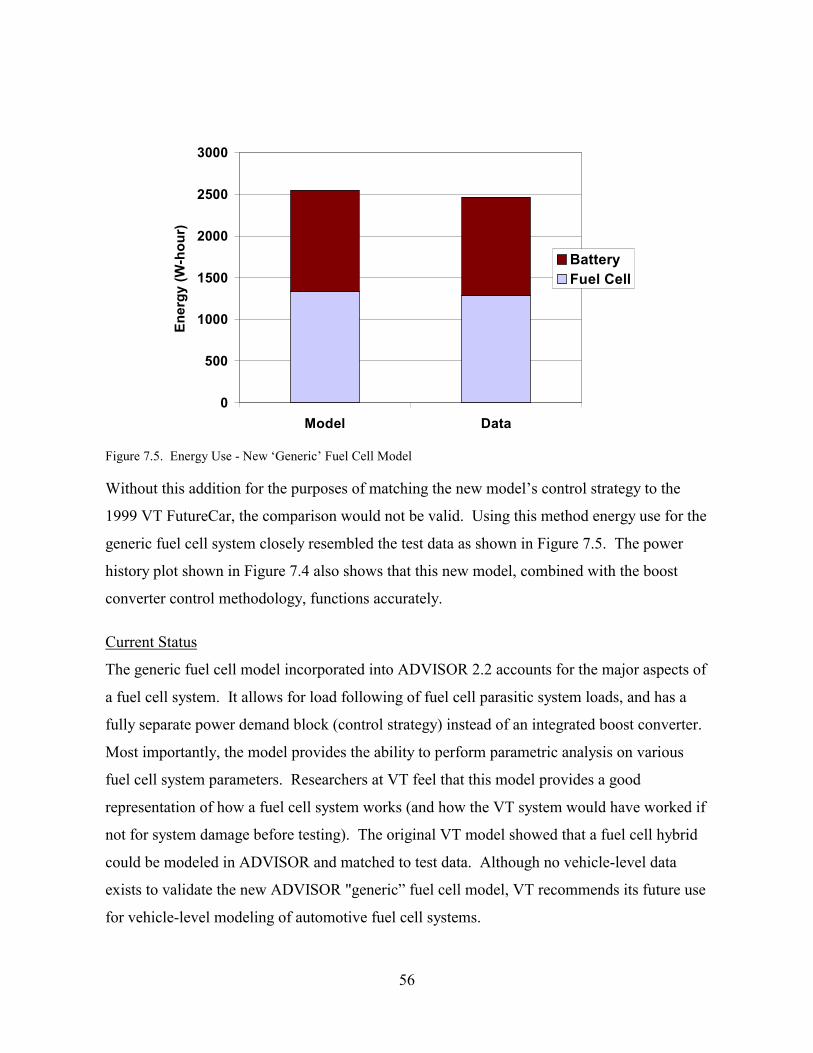
56
0
500
1000
1500
2000
2500
3000
Model Data
Ener
gy (W
-hou
r)
BatteryFuel Cell
Figure 7.5. Energy Use - New ‘Generic’ Fuel Cell Model
Without this addition for the purposes of matching the new model’s control strategy to the
1999 VT FutureCar, the comparison would not be valid. Using this method energy use for the
generic fuel cell system closely resembled the test data as shown in Figure 7.5. The power
history plot shown in Figure 7.4 also shows that this new model, combined with the boost
converter control methodology, functions accurately.
Current Status
The generic fuel cell model incorporated into ADVISOR 2.2 accounts for the major aspects of
a fuel cell system. It allows for load following of fuel cell parasitic system loads, and has a
fully separate power demand block (control strategy) instead of an integrated boost converter.
Most importantly, the model provides the ability to perform parametric analysis on various
fuel cell system parameters. Researchers at VT feel that this model provides a good
representation of how a fuel cell system works (and how the VT system would have worked if
not for system damage before testing). The original VT model showed that a fuel cell hybrid
could be modeled in ADVISOR and matched to test data. Although no vehicle-level data
exists to validate the new ADVISOR "generic” fuel cell model, VT recommends its future use
for vehicle-level modeling of automotive fuel cell systems.
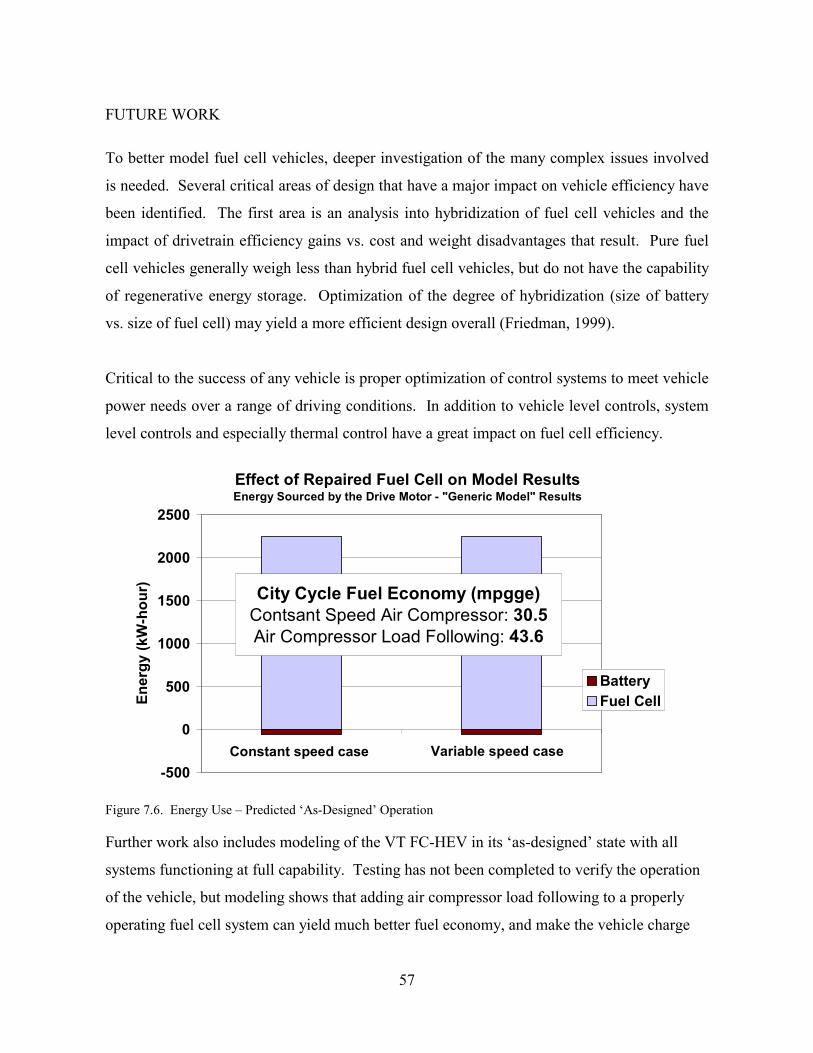
57
FUTURE WORK
To better model fuel cell vehicles, deeper investigation of the many complex issues involved
is needed. Several critical areas of design that have a major impact on vehicle efficiency have
been identified. The first area is an analysis into hybridization of fuel cell vehicles and the
impact of drivetrain efficiency gains vs. cost and weight disadvantages that result. Pure fuel
cell vehicles generally weigh less than hybrid fuel cell vehicles, but do not have the capability
of regenerative energy storage. Optimization of the degree of hybridization (size of battery
vs. size of fuel cell) may yield a more efficient design overall (Friedman, 1999).
Critical to the success of any vehicle is proper optimization of control systems to meet vehicle
power needs over a range of driving conditions. In addition to vehicle level controls, system
level controls and especially thermal control have a great impact on fuel cell efficiency.
Effect of Repaired Fuel Cell on Model ResultsEnergy Sourced by the Drive Motor - "Generic Model" Results
-500
0
500
1000
1500
2000
2500
Model Dyno
Ener
gy (k
W-h
our)
BatteryFuel Cell
City Cycle Fuel Economy (mpgge)Contsant Speed Air Compressor: 30.5 Air Compressor Load Following: 43.6
Constant speed case Variable speed case
Figure 7.6. Energy Use – Predicted ‘As-Designed’ Operation
Further work also includes modeling of the VT FC-HEV in its ‘as-designed’ state with all
systems functioning at full capability. Testing has not been completed to verify the operation
of the vehicle, but modeling shows that adding air compressor load following to a properly
operating fuel cell system can yield much better fuel economy, and make the vehicle charge

58
sustaining over the EPA driving cycles. As seen in Figure 7.6, the electric motor consumes
all its electrical energy from the fuel cell system, maintaining the charge level of the battery
pack. However, when load following is added to the air compressor, significant reductions in
parasitic energy consumption are made apparent in the fuel economy numbers. In this case,
fuel economy improvements of 40% are predicted for air compressor control improvements to
ANIMUL H2.
59
CHAPTER 8. CONCLUSIONS
The Hybrid Electric Vehicle Team of Virginia Tech was successful in its attempt to convert a
5-passenger sedan to a Fuel Cell Hybrid Electric Vehicle. Testing of the fuel cell system and
vehicle components yielded data that was used to determine overall fuel cell system
efficiency, vehicle energy flow, and fuel usage.
A 20 kW fuel cell can be used in a series hybrid configuration to obtain good performance
from a mid-size sedan, such as a Chevrolet Lumina. This system provides performance
characteristics, such as acceleration, handling, and consumer acceptability, which meet or
exceed those of the stock vehicle. Although the volume of the compressed hydrogen fuel
storage system limits driving range, other advanced fuel storage technologies are rapidly
improving. Soon these hydrogen fuel storage and delivery systems will be small enough to
integrate their volume into the design of the vehicle to provide adequate range in a mid-size
sedan.
The conversion of an existing conventional vehicle and limitations of the FutureCar
Challenge rules prevent large reductions in mass needed to improve the energy efficiency of
the vehicle. The estimated fuel economy after system improvements are made to the Virginia
Tech FC-HEV is nearly 45 miles per gallon of gasoline equivalent energy or nearly twice
(2X) the stock vehicle. To achieve the PNGV goal of 3X will require new vehicle
technologies to be designed into the vehicle from the start. The present hydrogen powered
design is a zero emission vehicle at the exhaust pipe, but the source of hydrogen and refueling
infrastructure must be investigated to determine the overall effect on the environment and
greenhouse gas emissions.
Test data validated the new ADVISOR fuel cell system model. Testing of the fuel cell system
and vehicle components yielded data that was used to determine overall fuel cell system
efficiency, vehicle energy flow, and fuel usage. Using this data, a model of the VT FC-HEV
was incorporated into ADVISOR. This model included a power sharing model to determine
the load sharing between the fuel cell and the energy storage system for a given vehicle power
demand while accurately representing the vehicle as it performed during real world testing.
Comparison to vehicle test data shows that total fuel cell system energy production, total

60
energy usage from the vehicle energy storage system, and total vehicle electrical energy use
agree to within 10% in all cases. The error between measured and predicted fuel economy
was 1% on the city driving cycle and 6% on the highway driving cycle.

61
REFERENCES
1. Cuddy, M., and Wipke, K., 1996, “ADVISOR, Advanced vehicle simulator, New opportunities for screening advanced components,” Proceedings of the Annual Automotive Technology Development Customer’s Coordination Meeting, Oct. 28 - Nov. 1, 1996, Dearborn, Mi.
2. Wipke, K., Cuddy, M., Burch, S., 1999, "ADVISOR 2.1: A User-Friendly Advanced Powertrain Simulation Using a Combined Backward/Forward Approach," IEEE Transactions on Vehiclular Technology, Vol. 48, No. 6, November 1999.
3. Freidman, D.J., and Moore, R.M., 1998, “PEM Fuel Cell System Optimization,” Proceedings of the Second International Symposium on Proton Conducting Membrand Fuel Cells, The Electrochemical Society, inc., Pennington, NJ (1998).
4. M. Fuchs, F. Barbir, A. Husar and J. Neutzler, D. J. Nelson, M. J. Ogburn, and P. Bryan (2000), " Performance of an Automotive Fuel Cell Stack," Proceedings of the 2000 Future Car Congress, April 2-6, Arlington, VA, SAE paper 2000-01-1529.
5. William Luttrell, Brian King, Scott Postle, Robert Fahrenkrog, Michael Ogburn, Douglas J. Nelson, (2000), "Integration of Fuel Cell Technology into the Virginia Tech 1999 Hybrid Electric FutureCar," Proceedings of the 1999 FutureCar Challenge, June 2-9, 1999, Auburn Hills, MI, SAE Paper 2000-01-0592, SP-1521, pp. 103-117.
6. “Hydrogen & Fuel Cell Letter”, Editor and Publisher: Peter Hoffman, Grinnell Street P.O. Box 14 Rhinecliff NY 12574.
7. M. J. Ogburn, D. J. Nelson, K. Wipke, and T. Markel (2000), "Modeling and Validation of a Fuel Cell Hybrid Vehicle," Proceedings of the 2000 Future Car Congress, April 2-6, Arlington, VA, SAE paper 2000-01-1566.
8. Senger, R. D., M. A. Merkle, and D. J. Nelson (1998), "Design and Performance of the 1997 Virginia Tech Hybrid Electric FutureCar," Proceedings of the 1997 FutureCar Challenge, SAE SP-1359, pp. 99-112.
9. Senger, R. D., M. A. Merkle, and D. J. Nelson (1998), "Validation of ADVISOR as a Simulation Tool for a Series Hybrid Electric Vehicle," Technology for Electric and Hybrid Vehicles, Proceedings of the 1998 SAE Intl. Congress, Detroit, MI, Feb. 23-26, SAE Paper 981133, SP-1331, pp 95-115.
10. Sperling, D., 1995, “Future Drive: Electric Vehicles and Sustainable Transportation,” Island Press, Washington, D.C.
11. Freidman, D.J., 1999, “Maximizing Direct-Hydrogen PEM Fuel Cell Vehicle Efficiency – Is Hybridization Necessary?,” Society of Automotive Engineers 1999-01-0530. SP 1425
12. M. J. Ogburn and D. J. Nelson (2000), "Systems Integration and Performance Issues in a Fuel Cell Hybrid Electric Vehicle," Proceedings of the 2000 SAE Int'l Congress, Detroit, MI, March 2-6, 2000, SAE Paper 2000-01-0376, in Fuel Cell Power for Transportation 2000, SP-1505, pp. 125 - 137.
13. Thomas, S., and Zalbowitz, M., 1999, “Fuel Cells – Green Power” Los Alamos National Laboratory, Available at http://education.lanl.gov/resources/fuelcells/.

62
APPENDIX I. HYDROGEN SAFETY
The dangers of hydrogen use have been well documented by scientists and engineers for
many years. Well publicized examples of catastrophic disasters have led to public concerns
and fears accompanying hydrogen use. Today, hydrogen is used safely on a daily basis all
over the world in space programs, chemical processing, and power plants, with few fatal
incidents. HEVT has made every effort to ensure safe development, operation, and storage of
ANIMUL H2.
All components of the hydrogen storage and delivery system have been chosen with safety as
the first concern. Flashback arrestors were added following the storage tanks and each
pressure relief valve. Flashback arrestors prevent air from entering the system where
hydrogen is discharged and, in case of an accident, prevent flames from reaching the
hydrogen in the storage tanks.
Hydrogen detectors have been implemented in case hydrogen leaks from any of the
components of the system. Detectors are located in the trunk, passenger compartment, and
the fuel cell compartment. The controller monitors each detector. If hydrogen of a level of
10% the lower explosive limit is detected, an 85-decibel alarm will sound and the controller
will activate a number of safety interlocks. These interlocks include honking the car’s horn to
alert bystanders and opening its trunk to release any explosive mixtures of gas
Purging of hydrogen is required when the vehicle is turned off. When the this occurs, the
bleed / purge solenoid is opened, releasing the hydrogen. All relief valves and the purge
solenoid are plumbed into one pipe that discharges through a flashback arrestor at the back of
the vehicle.
An independent safety system was designed into all the crucial operating systems of the
vehicle. The stock Lumina airbag deployment system has been retained to protect the
passengers in the event of a collision. An inertial crash sensor is located under the hood to
disable the electric drivetrain in the event of a 6-12 g collision. A second crash sensor shuts

63
off the hydrogen flow at the tanks and stops the fuel cell system. A remote, cable operated
Halon fire suppression system will cover the motor compartment, battery box, and fuel tanks
in the event of an on-board fire.
Emergency disconnect switches provide a method to quickly disconnect the main high voltage
system. Levers, located beside the driver’s left leg and in the fuel filler door, are connected to
stainless steel cables that activate a physical shutdown sequence. First the 12 V power to the
contactors is disconnected, allowing any enabled contactors time to interrupt high voltage
current flow. This is then followed by physically disconnecting the main 324 V system
connector, all in one pull of the Emergency Disconnect Lever.

64
APPENDIX II. ADVISOR 2.2 MODIFICATIONS
This appendix will outline changes required to ADVISOR 2.2 to tailor the included fuel cell
vehicle model to a specific vehicle, using VT’s ANIMUL H2 as an example vehicle.
Notes:
1: ADVISOR is well documented in HTML format. This appendix is meant add to, not
replace, that documentation. For further details on setting up a vehicle test, see section 2.1.1
of that documentation, "Defining a Vehicle."
2: After downloading ADVISOR from www.ctts.nrel.gov/analysis, you'll need a full version
of MATLAB and SIMULINK installed a computer of reasonable capabilities. A Pentium II,
333 Mhz, with at least 64 MB RAM is adequate.
3: Altered files mentioned in the text of this discussion on selecting powertrain components
can be found at the end of this appendix.
ADVISOR's main system configuration window is the "vehicle input" screen. It allows the
high level choice of powering a vehicle with a conventional Internal Combustion Engine
(ICE) driveline or one that is electric, series or parallel hybrid electric, or fuel cell based.
Within each of these driveline types, you may select specific components from some or all of
the eleven possible component classifications, depending on which are applicable to that
driveline: Fuel Converter, Generator, Torque Coupling, Motor Controller, Exhaust
Aftertreatment, Transmission, Wheel, Vehicle, Energy Storage, Powertrain Control,
Accessories.
Fuel Converter
The fuel converter represents an ICE or a fuel cell that converts energy from a consumable
chemical fuel in a storage system into a different form, either mechanical energy or in the case
of the fuel cell, electrical energy. The generic fuel cell model in advisor allows 3 ways to
enter data: through a link to Argonne National Labs GCTool fuel cell modeler, using power
65
vs. efficiency curves, or with more commonly accepted voltage vs. current polarization
curves. ANIMUL H2's fuel converter file is fc_epi20.m, representing an Energy Partners
20kW pure hydrogen stack operated at 10psi, and including system-level parasitic power
consumption data for items such as water pumps and air compressors. Note: Though the
number of cells and active area of the membranes is required data, voltage and current are
entered as full stack values, not single cell or mA/cm^2.
Generator/Controller
This file converts an ICE's mechanical energy into electrical energy for use in a series or
parallel hybrid, but is not used in the fuel cell model.
Torque Coupling
Files of this type are not used in the fuel cell model.
Motor Controller
The motor controller represents the electrical model of 2 physical components, an electric
motor and the power electronics that drive that motor. Both permanent magnet and ac
induction motors are available at a variety of power levels. The file mc_ac83.m represents the
GE-EV2000, an 83kW (peak) AC-induction drive and motor that is used in ANIMUL H2.
This unit was that was originally developed in 2 forms, one of which powered the Ford
Ecostar electric vehicle. This file is unchanged from its original ADIVISOR 2.2 format.
Exhaust Aftertreatment
Files of this type are not used in the fuel cell model.
Transmission
Conventional and parallel hybrid vehicles typically have some form of a transmission
between the fuel converter and road. However, most series and fuel cell vehicles have a
constant ratio electric drive coupled to the wheels. In this situation ADVISOR automatically
selects tx_1spd.m, a single speed transmission.
66
Wheel/Axle
The wheel and axle model combines a number of tractive and braking effects into a single
file. Included are the effects of losses in the axle bearings, wheel and axle inertia, tire slip,
and braking. Braking data also accounts for the ratio of effectiveness between friction brakes
and regenerative braking. For example, at low speed friction brakes are required (regen is
inefficient at low speed) and at high speed a certain percentage of required braking torque is
allowed to come from the electric motor (if allowed by the motor/controller file)
Vehicle
The vehicle file contains variables representative of vehicle glider characteristics. Rolling
resistance of the tires, aerodynamic drag coefficient, frontal area, and mass of the vehicle
(without drivetrain) are all included. ANIMUL H2's data is contained in the file
veh_vtfuelcell.m.
Energy Storage
The variables in the Energy Storage System file define performance parameters for a single
battery of the type used in the vehicle's the battery pack. By choosing the number of battery
'modules' on board, ADVISOR calculates the total voltage and current capabilities of the
'pack,' which varies with instantaneous energy storage. As the state of charge rises and falls
between maximum capacity (SOC = 1.0) and total discharge (SOC = 0.0), ADVISOR keeps
track of battery performance onboard the vehicle. ANIMUL H2 uses 27 sealed lead acid
batteries rated at 16 amp-hours, with data saved in ess_pb16.m.
Powertrain Control
A proper understanding of a vehicles powertrain control system is critical to accurate
modeling of a vehicle. Because the details of control strategies typically vary greatly and
depend depending on many things, including component characteristics and design
philosophy, ADVISOR incorporates a relatively basic hybrid control strategy. It merely
varies within a given maximum and minimum power command window, attempting to

67
maintain battery state of charge within a given desired low and high state of charge window.
ANIMUL H2 operates on this same basic principle but takes its fuel cell system power
command from a "boost converter." Because a different block in the block diagram and data
file are used, the normal ADVISOR Powertrain Control block is completely removed and
replaced with a new block. This block must read ESS buss voltage from MATLAB, use a
one-dimensional lookup table to determine power output, and send this output to the fuel cell
system block. When the system is on and SOC is within a 40%-80% window, the boost
converter requests power from the fuel cell system based on this ESS voltage. The file
bc_vtboostconverter.m stores data for this function.
Accessories
This file contains a single variable representing a constant electric load on the power buss due
to vehicle accessories such as headlights and powertrain "hotel loads" such as cooling fans.
The file acc_hybrid.m is used when modeling ANIMUL H2.
File List Disclaimer: These files are from the ADVISOR 2.2 model of HEVT's ANIMUL H2
and are not guaranteed to work in any other version of ADVISOR. When modifying
ADVISOR for specific vehicles, it is generally best to modify an existing component file to fit
the new component to ensure compatibility of variable formats and data structures.
List of Altered Files: fc_epi20.m veh_vtfuelcell.m ess_pb16.m bc_vtboostconverter.m % ADVISOR Data file: FC_EPI20.m % % Data source: Data compiled by HEVT from Energy Partners. % % Data confidence level: % % Notes: Data represents 10psi operation of a 20kW EP fuel cell stack. % % >>>>>> PROPRIETARY DATA <<<<<<<< %
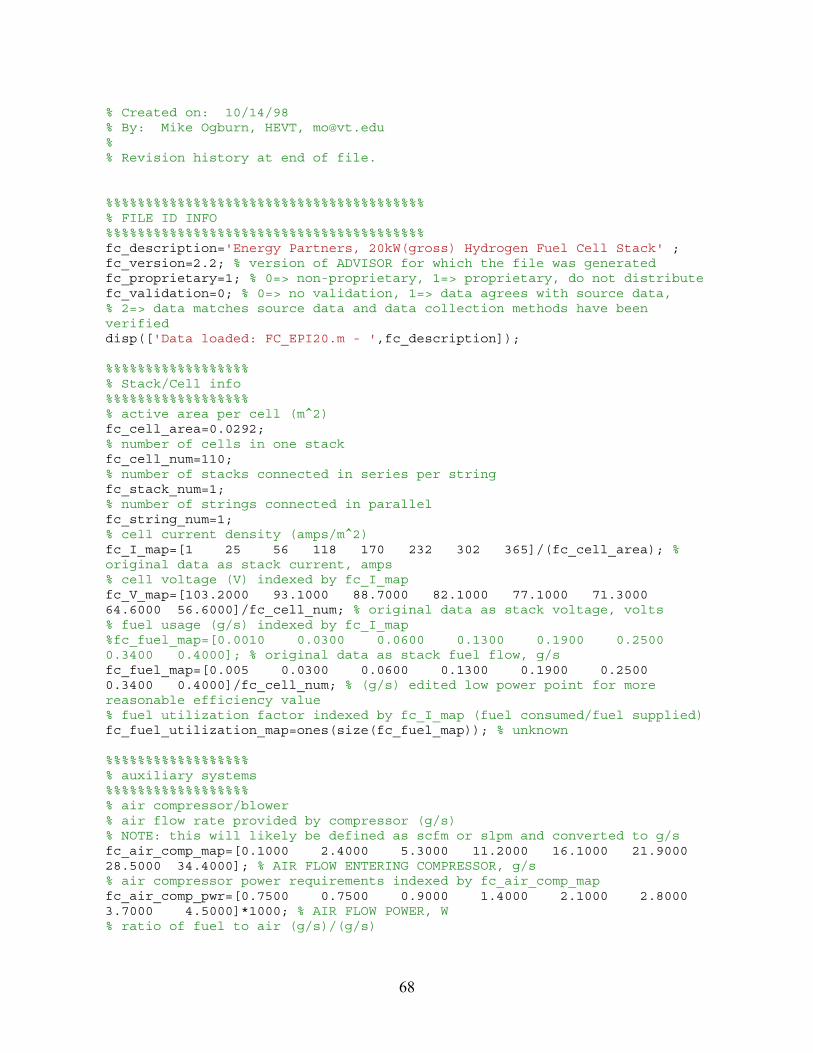
68
% Created on: 10/14/98 % By: Mike Ogburn, HEVT, [email protected] % % Revision history at end of file. %%%%%%%%%%%%%%%%%%%%%%%%%%%%%%%%%%%%%%%% % FILE ID INFO %%%%%%%%%%%%%%%%%%%%%%%%%%%%%%%%%%%%%%%% fc_description='Energy Partners, 20kW(gross) Hydrogen Fuel Cell Stack' ; fc_version=2.2; % version of ADVISOR for which the file was generated fc_proprietary=1; % 0=> non-proprietary, 1=> proprietary, do not distribute fc_validation=0; % 0=> no validation, 1=> data agrees with source data, % 2=> data matches source data and data collection methods have been verified disp(['Data loaded: FC_EPI20.m - ',fc_description]); %%%%%%%%%%%%%%%%%% % Stack/Cell info %%%%%%%%%%%%%%%%%% % active area per cell (m^2) fc_cell_area=0.0292; % number of cells in one stack fc_cell_num=110; % number of stacks connected in series per string fc_stack_num=1; % number of strings connected in parallel fc_string_num=1; % cell current density (amps/m^2) fc_I_map=[1 25 56 118 170 232 302 365]/(fc_cell_area); % original data as stack current, amps % cell voltage (V) indexed by fc_I_map fc_V_map=[103.2000 93.1000 88.7000 82.1000 77.1000 71.3000 64.6000 56.6000]/fc_cell_num; % original data as stack voltage, volts % fuel usage (g/s) indexed by fc_I_map %fc_fuel_map=[0.0010 0.0300 0.0600 0.1300 0.1900 0.2500 0.3400 0.4000]; % original data as stack fuel flow, g/s fc_fuel_map=[0.005 0.0300 0.0600 0.1300 0.1900 0.2500 0.3400 0.4000]/fc_cell_num; % (g/s) edited low power point for more reasonable efficiency value % fuel utilization factor indexed by fc_I_map (fuel consumed/fuel supplied) fc_fuel_utilization_map=ones(size(fc_fuel_map)); % unknown %%%%%%%%%%%%%%%%%% % auxiliary systems %%%%%%%%%%%%%%%%%% % air compressor/blower % air flow rate provided by compressor (g/s) % NOTE: this will likely be defined as scfm or slpm and converted to g/s fc_air_comp_map=[0.1000 2.4000 5.3000 11.2000 16.1000 21.9000 28.5000 34.4000]; % AIR FLOW ENTERING COMPRESSOR, g/s % air compressor power requirements indexed by fc_air_comp_map fc_air_comp_pwr=[0.7500 0.7500 0.9000 1.4000 2.1000 2.8000 3.7000 4.5000]*1000; % AIR FLOW POWER, W % ratio of fuel to air (g/s)/(g/s)
69
fc_fuel_air_ratio=1/60; % unknown % fuel pump (for liquid fuels only) % fuel flow rate provided by fuel pump (g/s) % NOTE: this will likely be defined as scfm or slpm and converted to g/s fc_fuel_pump_map=[0 1000]; % fuel pump power requirements indexed by fc_fuel_pump_map fc_fuel_pump_pwr=[0 0]; % W, for gaseous fuels set to [0 0] % coolant pump % coolant flow rate provided by pump (g/s) % NOTE: this will likely be defined as scfm or slpm and converted to g/s fc_coolant_pump_map=[0.1000 2.4000 5.3000 11.2000 16.1000 21.9000 28.5000 34.4000]; % g/s, unknown % coolant pump power requirements indexed by fc_coolant_pump_map fc_coolant_pump_pwr=[0.7500 0.7500 0.9000 1.4000 2.1000 2.8000 3.7000 4.5000]/10*1000; % W, unknown % fixed coolant flow rate fc_coolant_flow_rate=75; % g/s, unknown % coolant specific heat capacity fc_coolant_cp=4.1843; % J/(g*K) water %fc_coolant_cp=(0.5*4.1843+0.5*2.474); % J/(g*K) 50/50 water/ethylene glycol blend % water pump (for alcohol fuels only) % water flow rate provided by water pump (g/s) % NOTE: this will likely be defined as scfm or slpm and converted to g/s fc_water_pump_map=[0 1000]; % g/s % water pump power requirements indexed by fc_water_pump_map fc_water_pump_pwr=[0 0]; % W % supply ratio of fuel to water fc_fuel_water_ratio=1/10; %%%%%%%%%%%%%%%%%%%%%%%%%%%%%%%%%%%%%%%% % OTHER DATA %%%%%%%%%%%%%%%%%%%%%%%%%%%%%%%%%%%%%%%% fc_fuel_cell_model=1; % 1--> polarization curves, 2--> pwr vs. eff, 3--> gctool model fc_fuel_type='Gaseous Hydrogen'; % fuel type used %%%%%%%%%%%%%%%%%%%%%%%%%%%%%%%%%%%%%%%% % THERMAL MODEL DATA %%%%%%%%%%%%%%%%%%%%%%%%%%%%%%%%%%%%%%%% % design point operating temperature fc_cell_temp_design=60; %C (IDEAL OPERATING TEMPERATURE) % design point operating pressure fc_cell_press_design=69; % kpa (GAUGE PRESSURE) % fuel cell actual operating pressure fc_cell_press=69; % kPA, placeholder actual pressure can be calculated % fan on temp fc_tstat_hi_temp=65; % C % fan off temp fc_tstat_lo_temp=55; % C % heat exchanger surface area fc_hx_area=5; % m^2, unknown
70
% heat exchanger mean heat transfer coefficient with fan on fc_hx_htc_hi=35; % W/(m^2*K), unknown % heat exchanger mean heat transfer coefficient with fan off fc_hx_htc_lo=0.01; % W/(m^2*K), unknown % coolant initial temp - move to init_conds later fc_coolant_init_temp=20; % variables not applicable to a fuel cell but needed for thermal models fc_tstat=94; % C engine coolant thermostat set temperature (typically 95 +/- 5 C) fc_cp=500; % J/kgK ave cp of engine (iron=500, Al or Mg = 1000) fc_h_cp=500; % J/kgK ave cp of hood & engine compartment (iron=500, Al or Mg = 1000) fc_ext_sarea=0.3; % m^2 exterior surface area of engine fc_hood_sarea=1.5; % m^2 surface area of hood/eng compt. fc_emisv=0.8; % emissivity of engine ext surface/hood int surface fc_hood_emisv=0.9; % emissivity hood ext fc_h_air_flow=0.0; % kg/s heater air flow rate (140 cfm=0.07) fc_cl2h_eff=0.7; % -- ave cabin heater HX eff (based on air side) fc_c2i_th_cond=500; % W/K conductance btwn engine cyl & int fc_i2x_th_cond=500; % W/K conductance btwn engine int & ext fc_h2x_th_cond=10; % W/K conductance btwn engine & engine compartment fc_ex_pwr_frac=[0.40 0.30]; % -- frac of waste heat that goes to exhaust as func of engine speed % fuel cell mass calculation fc_max_pwr=17.5; % kW peak engine power fc_base_mass=6.0*fc_max_pwr; % kg mass of the fuel cell stack, assuming mass penalty of 6 kg/kW fc_acc_mass=9.0*fc_max_pwr; % kg mass of fuel cell accy's, electrics, cntrl's - assumes mass penalty of 6 kg/kW fc_fuel_mass=3.0*fc_max_pwr; % kg mass of fuel and fuel tank fc_mass=fc_base_mass+fc_acc_mass+fc_fuel_mass; % kg total engine/fuel system mass %fc_mass=170; % (kg), mass of the engine %This data only defined as placeholder in block diagram - will not be used in simulations % vector of powers indexed by fc_I_map - only need as a place holder in simulink block 8/13/99 fc_pwr_map=fc_I_map.*fc_V_map*fc_cell_area*fc_cell_num*fc_stack_num*fc_string_num; % vector of eff indexed by fc_I_map - only need as a place holder in simulink block 8/13/99 fc_eff_map=fc_pwr_map./(fc_fuel_map*fc_cell_num)./fc_fuel_lhv; %%%%%%%%%%%%%%%%%%%%%%%%%%%%%%%%%%%%%%%% % REVISION HISTORY %%%%%%%%%%%%%%%%%%%%%%%%%%%%%%%%%%%%%%%% % 10/14/98 (MJO): Set to represent the VTFUELCELL power output, with % boost converter efficiencies and air compressor losses %

71
% 12/30/98 (MJO): reworked to incorporate the BD_FCELL design changes. % % 5/20/99 (MJO): updated to 2.1, added 10psi eff% curves % 8/9/99:tm revised to include input data to work with *_mod 8/9/99 version % 9/14/99:tm cosmetic changes % 9/21/99:tm updated to work with new fuel cell block diagram
% ADVISOR data file: VEH_VTFUELCELL.m % % Data source: % % Data confirmation: % % Notes: Defines road load parameters for a hypothetical small car, roughly % based on a 1994 Saturn SL1 vehicle. % % Created on: 23-Jun-1998 % By: MRC of NREL, [email protected] % % Revision history at end of file. %%%%%%%%%%%%%%%%%%%%%%%%%%%%%%%%%%%%%%%%%%%%%%%%%%%%%%%%%%%%%%%%%%%%%%%%%%% %%%%%%%%%%%%%%%%%%%%%%%%%%%%%%%%%%%%%% % FILE ID INFO %%%%%%%%%%%%%%%%%%%%%%%%%%%%%%%%%%%%%% veh_description='Virginia Tech Fuel Cell Hybrid Electric Vehicle'; veh_version=2.1; % version of ADVISOR for which the file was generated veh_proprietary=0; % 0=> non-proprietary, 1=> proprietary, do not distribute veh_validation=0; % 0=> no validation, 1=> data agrees with source data, % 2=> data matches source data and data collection methods have been verified disp(['Data loaded: VEH_VTFUELCELL - ',veh_description]) %%%%%%%%%%%%%%%%%%%%%%%%%%%%%%%%%%%%%% % PHYSICAL CONSTANTS %%%%%%%%%%%%%%%%%%%%%%%%%%%%%%%%%%%%%% veh_gravity=9.81; % m/s^2 veh_air_density=1.2; % kg/m^3 %%%%%%%%%%%%%%%%%%%%%%%%%%%%%%%%%%%%%% % VEHICLE PARAMETERS %%%%%%%%%%%%%%%%%%%%%%%%%%%%%%%%%%%%%% % Note on vehicle mass: % The actual average vehicle mass of a 1994 Saturn SL1 5spd is 2325 pounds. % If you wish to accurately set your totalvehicle mass % to this value in the A2 GUI, you should use the mass override % checkbox and enter in the value 1191, which is (2325+300)/2.205 = 1191 kg, which comes from

72
% adding on 300 lbs of EPA test mass, and then converting pounds to kilograms. % The glider mass below is just an estimate that gives 2325 pounds for a 95 kW % scaled SI95 engine in a conventional vehicle with 5-speed transmission. veh_glider_mass=(3300/2.205)-440; % (kg), vehicle mass w/o propulsion system (fuel converter, % exhaust aftertreatment, drivetrain, motor, ESS, generator) veh_CD=0.32; % (--), coefficient of aerodynamic drag veh_FA=2.04; % (m^2), frontal area % for the eq'n: rolling_drag=mass*gravity*(veh_1st_rrc+veh_2nd_rrc*v) veh_1st_rrc=0.011; % (goodyear A) veh_2nd_rrc=0; % (s/m) % fraction of vehicle weight on front axle when standing still veh_front_wt_frac=0.6; % (--) % height of vehicle center-of-gravity above the road veh_cg_height=0.5; % (m), estimated for 1995 Saturn SL % vehicle wheelbase, from center of front tire patch to center of rear patch veh_wheelbase=2.75; % (m), 1995 Saturn SL (GM Impact is 2.51 m) veh_cargo_mass=136; %kg cargo mass %%%%%%%%%%%%%%%%%%%%%%%%%%%%%%%%%%%%%%%% % REVISION HISTORY %%%%%%%%%%%%%%%%%%%%%%%%%%%%%%%%%%%%%%%% % Created 8/21/98 KW % Modified 10/14/98 MO; Changed data to approximate the VT Fuel Cell Hybrid Lumina % 04-Nov-1999: automatically updated to version 2.2
% ADVISOR data file: ESS_PB16.m % % Data source: % Testing done by Virginia Tech % % Data confirmation: % % Notes: % These parameters describe the Hawker Genesis 12V26Ah10EP sealed % valve-regulated lead-acid (VRLA) battery. % % Created on: 30-Jun-1998 % By: MRC, NREL, [email protected] % % Revision history at end of file. %%%%%%%%%%%%%%%%%%%%%%%%%%%%%%%%%%%%%%%%%%%%%%%%%%%%%%%%%%%%%%%%%%%%%%%%%%% %%%%%%%%%%%%%%%%%%%%%%%%%%%%%%%%%%%%%%%% % FILE ID INFO %%%%%%%%%%%%%%%%%%%%%%%%%%%%%%%%%%%%%%%% ess_description='Hawker Genesis 12V16Ah10EP VRLA - INTERPOLATED, NOT VALIDATED'; ess_version=2.2; % version of ADVISOR for which the file was generated
73
ess_proprietary=0; % 0=> non-proprietary, 1=> proprietary, do not distribute ess_validation=0; % 0=> no validation, 1=> data agrees with source data, % 2=> data matches source data and data collection methods have been verified disp(['Data loaded: ESS_PB16_mo - ',ess_description]) ess_on=1 %%%%%%%%%%%%%%%%%%%%%%%%%%%%%%%%%%%%%%%% % SOC RANGE over which data is defined %%%%%%%%%%%%%%%%%%%%%%%%%%%%%%%%%%%%%%%% ess_soc=[0:.1:1]; % (--) %%%%%%%%%%%%%%%%%%%%%%%%%%%%%%%%%%%%%%%% % Temperature range over which data is defined %%%%%%%%%%%%%%%%%%%%%%%%%%%%%%%%%%%%%%%% ess_tmp=[0 22 40]; % (C) %%%%%%%%%%%%%%%%%%%%%%%%%%%%%%%%%%%%%%%% % LOSS AND EFFICIENCY parameters %%%%%%%%%%%%%%%%%%%%%%%%%%%%%%%%%%%%%%%% % Parameters vary by SOC horizontally, and temperature vertically ess_max_ah_cap=[ 16 16 16 ]; % (A*h), max. capacity at C/5 rate, indexed by ess_tmp % average coulombic (a.k.a. amp-hour) efficiency below, indexed by ess_tmp ess_coulombic_eff=[ .9 .9 .9 ]; % (--); % module's resistance to being discharged, indexed by ess_soc and ess_tmp ess_r_dis=[ 70.4 53.1 35.9 28.5 21.2 20.4 19.6 19.7 19.9 20.0 20.1 70.4 53.1 35.9 28.5 21.2 20.4 19.6 19.7 19.9 20.0 20.1 70.4 53.1 35.9 28.5 21.2 20.4 19.6 19.7 19.9 20.0 20.1 %40.7 37.0 33.8 26.9 19.3 15.1 13.1 12.3 11.7 11.8 12.2 %40.7 37.0 33.8 26.9 19.3 15.1 13.1 12.3 11.7 11.8 12.2 %40.7 37.0 33.8 26.9 19.3 15.1 13.1 12.3 11.7 11.8 12.2 ]/1000; % (ohm) % module's resistance to being charged, indexed by ess_soc and ess_tmp ess_r_chg=[ 43.3 43.0 42.8 42.6 42.5 42.5 42.6 60.3 78.1 88.3 98.6 43.3 43.0 42.8 42.6 42.5 42.5 42.6 60.3 78.1 88.3 98.6 43.3 43.0 42.8 42.6 42.5 42.5 42.6 60.3 78.1 88.3 98.6 ]/1000; % (ohm) % module's open-circuit (a.k.a. no-load) voltage, indexed by ess_soc and ess_tmp ess_voc=[ 11.5 11.7 11.9 12.0 12.2 12.3 12.4 12.6 12.7 12.9 13.1 11.5 11.7 11.9 12.0 12.2 12.3 12.4 12.6 12.7 12.9 13.1 11.5 11.7 11.9 12.0 12.2 12.3 12.4 12.6 12.7 12.9 13.1

74
]; % (V) %%%%%%%%%%%%%%%%%%%%%%%%%%%%%%%%%%%%%%% % LIMITS %%%%%%%%%%%%%%%%%%%%%%%%%%%%%%%%%%%%%%%% ess_min_volts=9.5; ess_max_volts=15.5; %%%%%%%%%%%%%%%%%%%%%%%%%%%%%%%%%%%%%%%% % OTHER DATA %%%%%%%%%%%%%%%%%%%%%%%%%%%%%%%%%%%%%%%% ess_module_mass=11; % (kg), mass of a single ~12 V module ess_module_num=27; %a default value for number of modules % battery thermal model ess_th_calc=1; % -- 0=no ess thermal calculations, 1=do calc's ess_mod_cp=660; % J/kgK ave heat capacity of module ess_set_tmp=35; % C thermostat temp of module when cooling fan comes on ess_mod_sarea=0.2; % m^2 total module surface area exposed to cooling air ess_mod_airflow=0.07/5; % kg/s cooling air mass flow rate across module (140 cfm=0.07 kg/s at 20 C) ess_mod_flow_area=0.0025; % m^2 cross-sec flow area for cooling air per module (10-mm gap btwn mods) ess_mod_case_thk=2/1000; % m thickness of module case ess_mod_case_th_cond=0.20; % W/mK thermal conductivity of module case material ess_air_vel=ess_mod_airflow/(1.16*ess_mod_flow_area); % m/s ave velocity of cooling air ess_air_htcoef=30*(ess_air_vel/5)^0.8; % W/m^2K cooling air heat transfer coef. ess_th_res_on=((1/ess_air_htcoef)+(ess_mod_case_thk/ess_mod_case_th_cond))/ess_mod_sarea; % K/W tot thermal res key on ess_th_res_off=((1/4)+(ess_mod_case_thk/ess_mod_case_th_cond))/ess_mod_sarea; % K/W tot thermal res key off (cold soak) % set bounds on flow rate and thermal resistance ess_mod_airflow=max(ess_mod_airflow,0.001); ess_th_res_on=min(ess_th_res_on,ess_th_res_off); clear ess_mod_sarea ess_mod_flow_area ess_mod_case_thk ess_mod_case_th_cond ess_air_vel ess_air_htcoef %%%%%%%%%%%%%%%%%%%%%%%%%%%%%%%%%%%%%%%% % REVISION HISTORY %%%%%%%%%%%%%%%%%%%%%%%%%%%%%%%%%%%%%%%% % 6/30/98 (MC): converted from E_HAWKER.M % 10/13/98:mc recomputed ess_max_ah_cap and renamed file (from ESS_PB20) % for consistency with other files % 02/09/99 (SDB): added thermal model inputs % 2/4/99 ss: added ess_module_num=25; % 3/15/99:ss updated *_version to 2.1 from 2.0 % 8/5/99:ss deleted all peukert coefficient and data(no longer needed in advisor model)
75
% added limits 'ess_max_volt' and 'ess_min_volt' %9/9/99: vhj changed variables to include thermal modeling (matrices, not vector), added ess_tmp %11/4/99 mike ogburn converted this to 2.2
% ADVISOR data file: BC_VTBOOSTCONVERTER.m% % Data source: % SOLEQ corp and HEVT % % Data confirmation: % % Notes: % custom built for HEVT's 20kW Energy Partners Fuel Cell % % Created on: 12/30/98 % By: MJO, VaTech, [email protected] % % Revision history at end of file. %%%%%%%%%%%%%%%%%%%%%%%%%%%%%%%%%%%%%%%%%%%%%%%%%%%%%%%%%%%%%%%%%%%%%%%%%%%%%%%% %%%%%%%%%%%%%%%%%%%%%%%%%%%%%%%%%%%%%%%% % FILE ID INFO %%%%%%%%%%%%%%%%%%%%%%%%%%%%%%%%%%%%%%%% bc_description='SOLEQ boost converter, custom built for 20kW Energy Partners Fuel Cell'; bc_version=2.0; % version of ADVISOR for which the file was generated bc_proprietary=0; % 0=> non-proprietary, 1=> proprietary, do not distribute bc_validation=0; % 0=> no validation, 1=> data agrees with source data, % 2=> data matches source data and data collection methods have been verified disp(['Data loaded: BC_VTBOOSTCONVERTER - ',bc_description]) %%%%%%%%%%%%%%%%%%%%%%%%%%%%%%%%%%%%%%%% % Lookup Tables and contants for the Boost Converter %%%%%%%%%%%%%%%%%%%%%%%%%%%%%%%%%%%%%%%% % (V), input index for power map v_bus=[ 262 271 280 288 295 303 311 320 329 340 350 380 ]; % 290 330 370 % (W), output power map indexed by buss_voltage bc_pwr_out=[ 11790 12320 12530 12500 12100 11600 11000 10200 9200 8300 6600 200 ]; % for bd_vtfuelcell bc_pwr_out_request=[ 7700 7700 7700 7700 7700 7700 7300 6500 5600 4800 4000 200 ]; % for generic fuel cell % (%), output eff map indexed by buss_voltage bc_eff=[ 92 92 92 92 92 92 93 93 92 90 90 90 ]/100; %93 92 92 % minimum power draw bc_min_pwr=400;

76
%%%%%%%%%%%%%%%%%%%%%%%%%%%%%%%%%%%%%%%% % DEFAULT SCALING %%%%%%%%%%%%%%%%%%%%%%%%%%%%%%%%%%%%%%%% % (--), used to scale fc_map_spd to simulate a faster or slower running engine bc_pwr_scale=1.0; % (--), used to scale fc_map_trq to simulate a higher or lower torque engine bc_pwr_scale=1.0; bc_mass=70 % kilograms %%%%%%%%%%%%%%%%%%%%%%%%%%%%%%%%%%%%%%%% % OTHER DATA %%%%%%%%%%%%%%%%%%%%%%%%%%%%%%%%%%%%%%%% bc_max_crnt=75; %amps %%%%%%%%%%%%%%%%%%%%%%%%%%%%%%%%%%%%%%%% % REVISION HISTORY %%%%%%%%%%%%%%%%%%%%%%%%%%%%%%%%%%%%%%%% %created 12/30/98 MJO, VaTech, [email protected] %updated 5/20/99 MJO, VaTech, [email protected] Added new Boost data for 10psi fuelcell operation.

77
VITA
Michael Ogburn graduated with a B.S. in Mechanical Engineering from Virginia Tech in
1998. As a senior, he became interested in applications of fuel cells for transportation and
worked as both a member and leader in the Hybrid Electric Vehicle Team to develop a
vehicle that placed first in the 1998 FutureCar Challenge. He entered graduate school in the
fall of 1998 working as a Graduate Research Assistant to Dr. Douglas Nelson, modeling fuel
cell vehicles under a contract with the National Renewable Energy Laboratory. Continuing in
his role of Team Leader preparing for the 1999 Future Car Challenge, HEVT’s efforts put
ANIMUL H2 in second place, also earning it the honor of being America's first non-OEM 5-
passenger fuel cell vehicle. After graduating with a Masters in Mechanical Engineering in
May of 2000, Mr. Ogburn will work as a fuel cell systems engineer for Ford Motor
Company’s TH!NK Technologies group.