alternative fuel and conventional vehicle air … fuel and conventional vehicle air pollutant...
TRANSCRIPT
Alternative Fuel and Conventional
Vehicle Air Pollutant Emissions
Andrew Burnham
Argonne National Laboratory
Clean Cities Webinar
January 28, 2015
Outline of Presentation
Introduction of Air Pollutant Emissions and AFLEET Tool
Air Pollutant Trends
Heavy-Duty Diesel and AFV Emissions
Light-Duty Gasoline and AFV Emissions
2

3
Introduction of Air Pollutant Emissions and AFLEET Tool
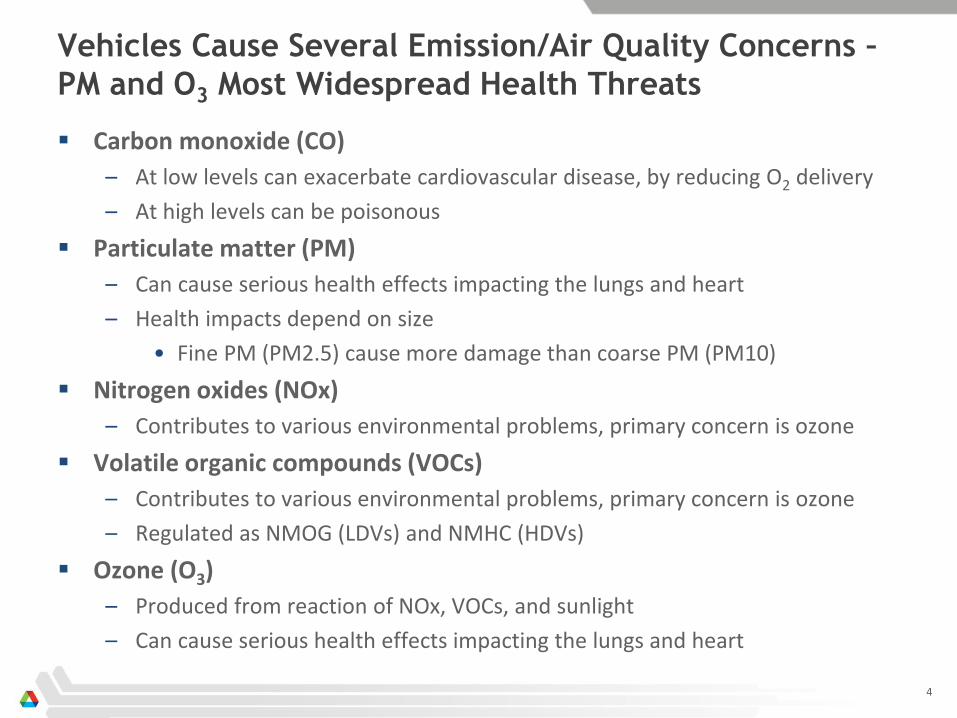
Vehicles Cause Several Emission/Air Quality Concerns –
PM and O3 Most Widespread Health Threats
4
Carbon monoxide (CO)
– At low levels can exacerbate cardiovascular disease, by reducing O2 delivery
– At high levels can be poisonous
Particulate matter (PM)
– Can cause serious health effects impacting the lungs and heart
– Health impacts depend on size
• Fine PM (PM2.5) cause more damage than coarse PM (PM10)
Nitrogen oxides (NOx)
– Contributes to various environmental problems, primary concern is ozone
Volatile organic compounds (VOCs)
– Contributes to various environmental problems, primary concern is ozone
– Regulated as NMOG (LDVs) and NMHC (HDVs)
Ozone (O3)
– Produced from reaction of NOx, VOCs, and sunlight
– Can cause serious health effects impacting the lungs and heart
Argonne has Supported DOE’s Clean Cities with Tool
Development for 15+ Years
5
AirCRED (1998-2007)
– Estimated O3 precursor & CO emission credits from AFVs for SIPs
Clean Cities AOI 4 Emissions Benefit Tool (2009)
– Estimated GHG & air pollutant benefits of Recovery Act grant proposals
AFLEET Tool (2013-present)
– Estimates cost of ownership, petroleum use, GHGs, & air pollutants of light- and heavy-duty vehicles
– AFLEET Tool & user manual available at: http://greet.es.anl.gov/afleet
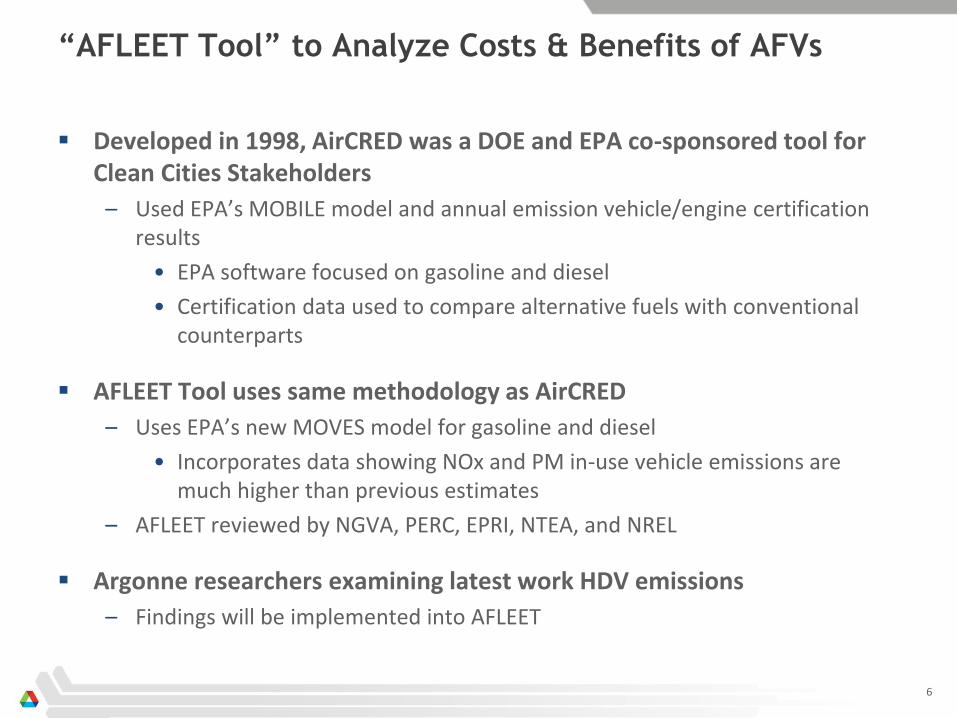
“AFLEET Tool” to Analyze Costs & Benefits of AFVs
6
Developed in 1998, AirCRED was a DOE and EPA co-sponsored tool for Clean Cities Stakeholders
– Used EPA’s MOBILE model and annual emission vehicle/engine certification results
• EPA software focused on gasoline and diesel
• Certification data used to compare alternative fuels with conventional counterparts
AFLEET Tool uses same methodology as AirCRED
– Uses EPA’s new MOVES model for gasoline and diesel
• Incorporates data showing NOx and PM in-use vehicle emissions are much higher than previous estimates
– AFLEET reviewed by NGVA, PERC, EPRI, NTEA, and NREL
Argonne researchers examining latest work HDV emissions
– Findings will be implemented into AFLEET
7
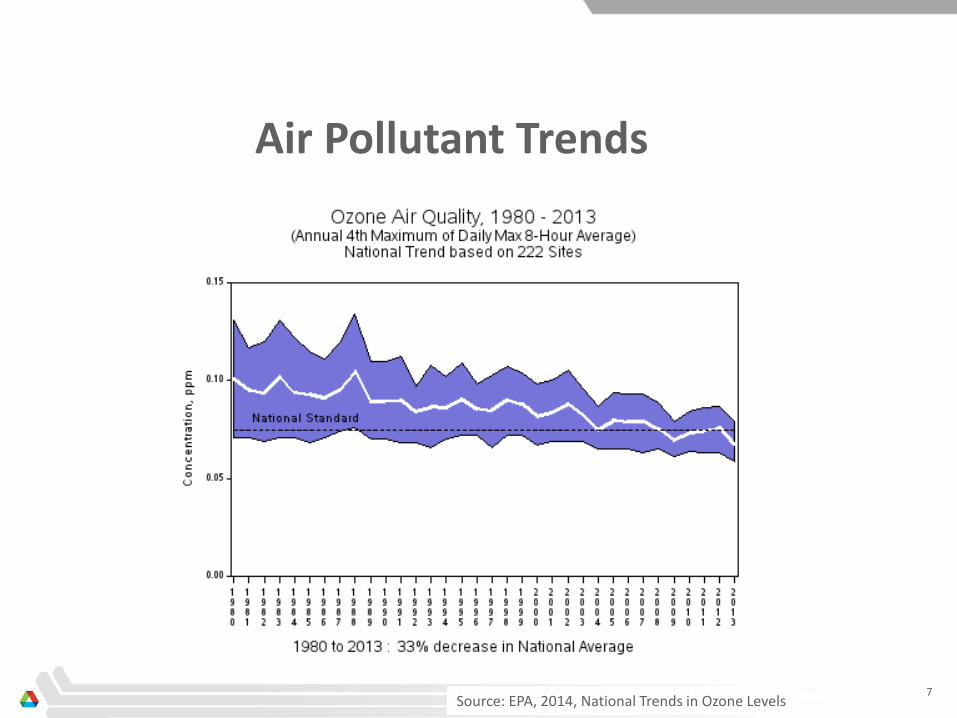
Air Pollutant Trends
Source: EPA, 2014, National Trends in Ozone Levels
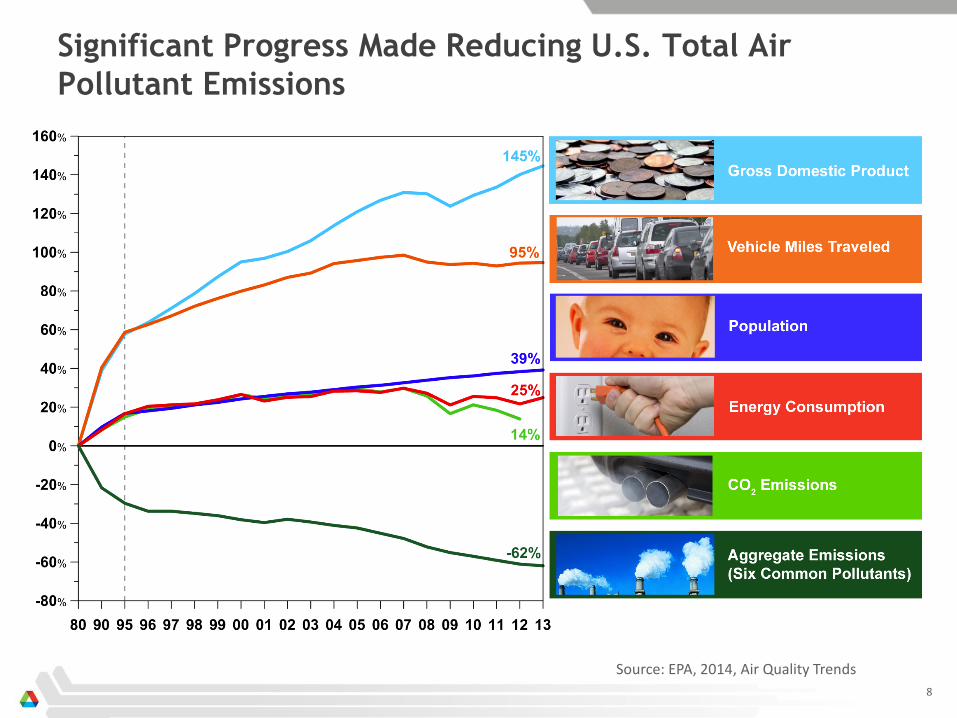
Significant Progress Made Reducing U.S. Total Air
Pollutant Emissions
8
Source: EPA, 2014, Air Quality Trends
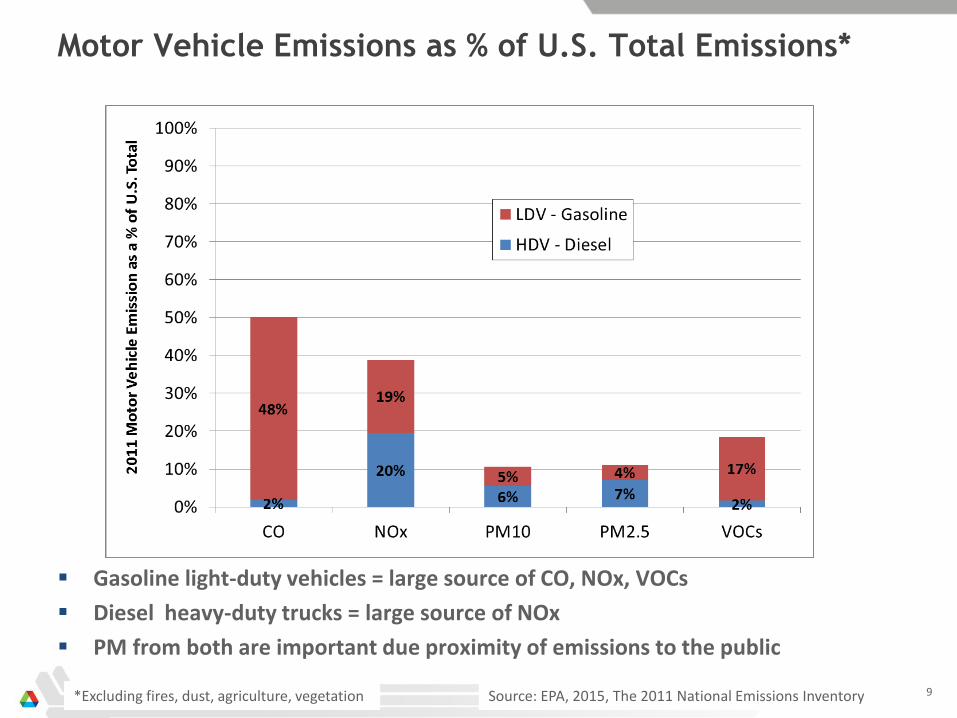
Motor Vehicle Emissions as % of U.S. Total Emissions*
9 Source: EPA, 2015, The 2011 National Emissions Inventory
Gasoline light-duty vehicles = large source of CO, NOx, VOCs
Diesel heavy-duty trucks = large source of NOx
PM from both are important due proximity of emissions to the public
*Excluding fires, dust, agriculture, vegetation
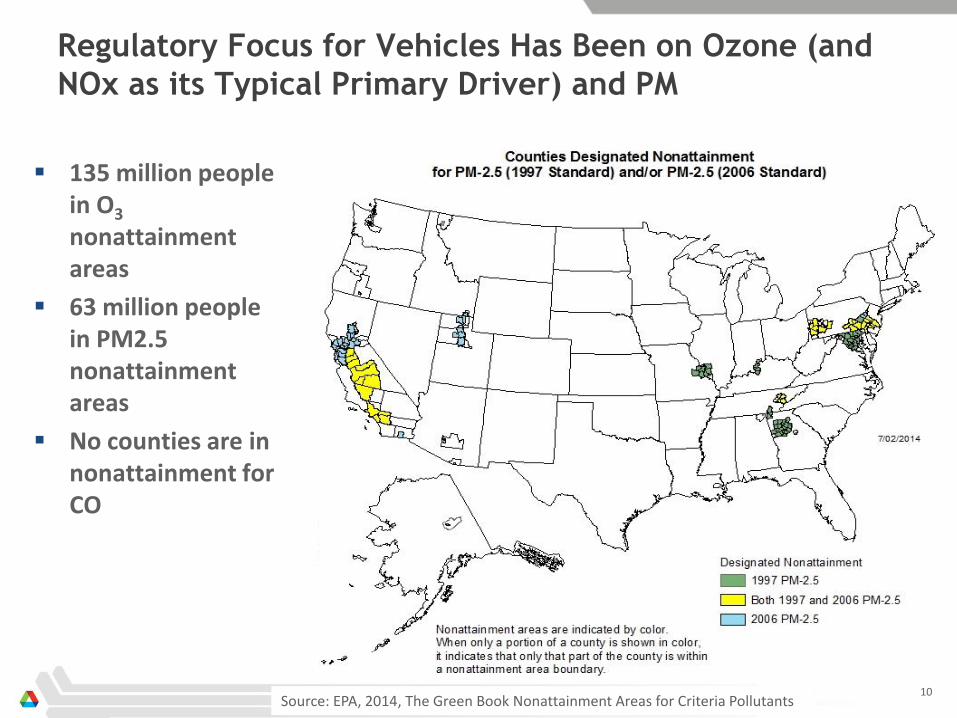
Regulatory Focus for Vehicles Has Been on Ozone (and
NOx as its Typical Primary Driver) and PM
135 million people in O3 nonattainment areas
63 million people in PM2.5 nonattainment areas
No counties are in nonattainment for CO
10 Source: EPA, 2014, The Green Book Nonattainment Areas for Criteria Pollutants
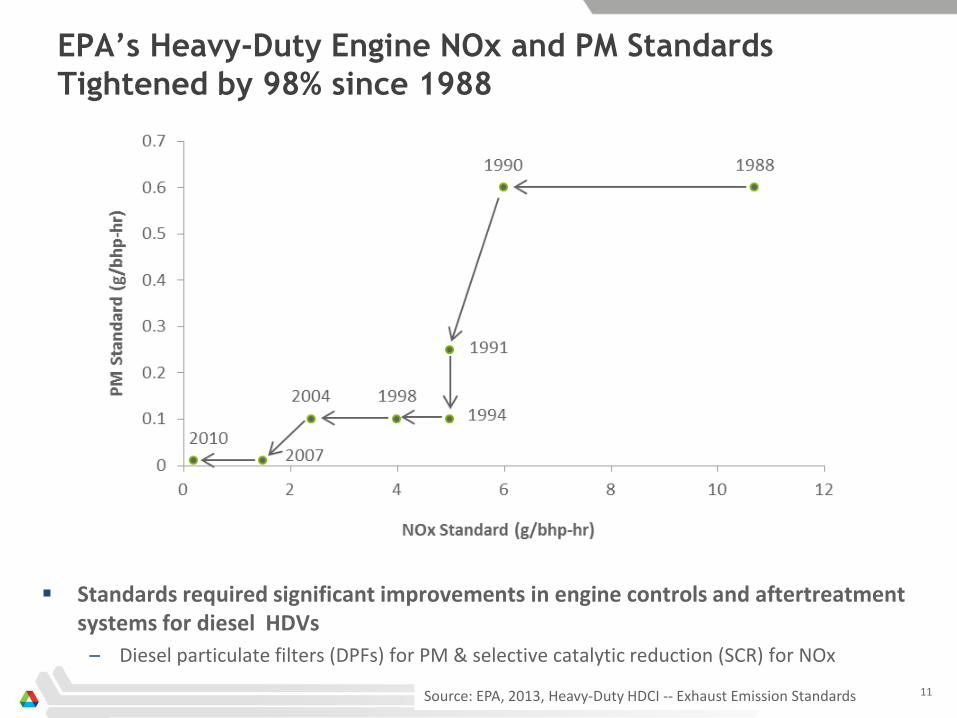
EPA’s Heavy-Duty Engine NOx and PM Standards
Tightened by 98% since 1988
11 Source: EPA, 2013, Heavy-Duty HDCI -- Exhaust Emission Standards
Standards required significant improvements in engine controls and aftertreatment systems for diesel HDVs
– Diesel particulate filters (DPFs) for PM & selective catalytic reduction (SCR) for NOx

EPA’s HD Standard for CO hasn’t changed since 1985
Regulations switched from total hydrocarbons to non-methane hydrocarbons in 2004
12 Source: EPA, 2013, Heavy-Duty HDCI -- Exhaust Emission Standards
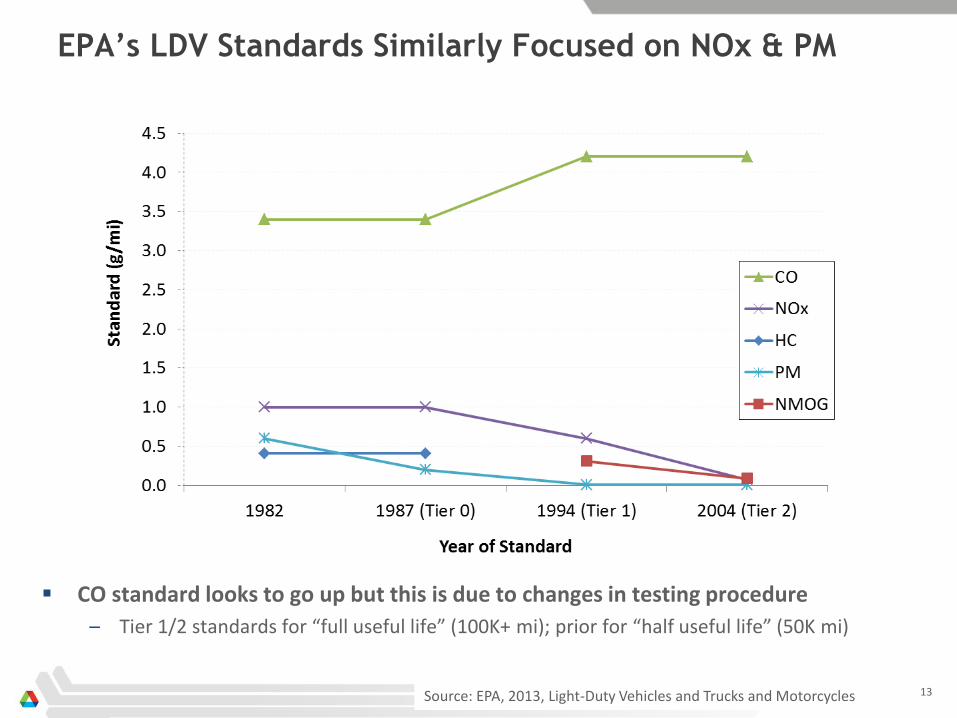
CO standard looks to go up but this is due to changes in testing procedure
– Tier 1/2 standards for “full useful life” (100K+ mi); prior for “half useful life” (50K mi)
13 Source: EPA, 2013, Light-Duty Vehicles and Trucks and Motorcycles
EPA’s LDV Standards Similarly Focused on NOx & PM
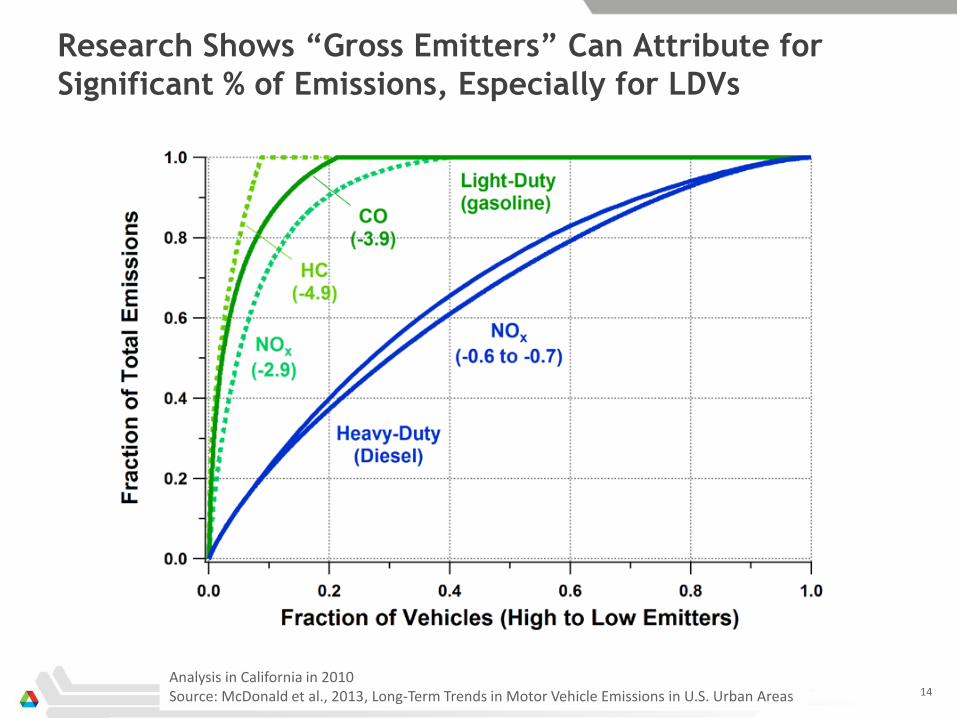
Research Shows “Gross Emitters” Can Attribute for
Significant % of Emissions, Especially for LDVs
14 Analysis in California in 2010 Source: McDonald et al., 2013, Long-Term Trends in Motor Vehicle Emissions in U.S. Urban Areas
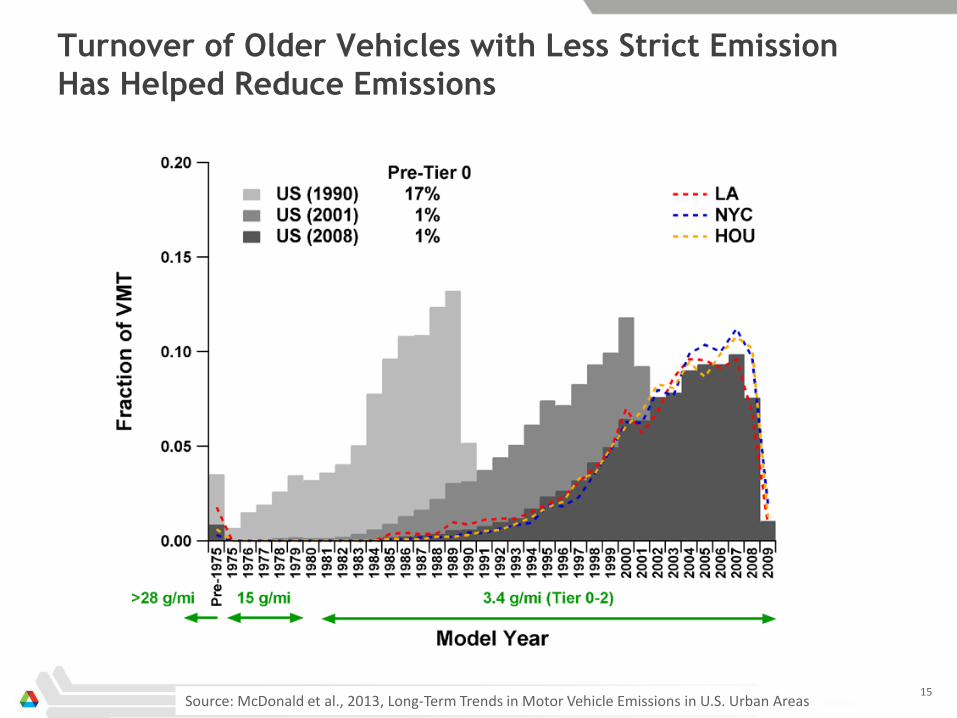
Turnover of Older Vehicles with Less Strict Emission
Has Helped Reduce Emissions
15 Source: McDonald et al., 2013, Long-Term Trends in Motor Vehicle Emissions in U.S. Urban Areas
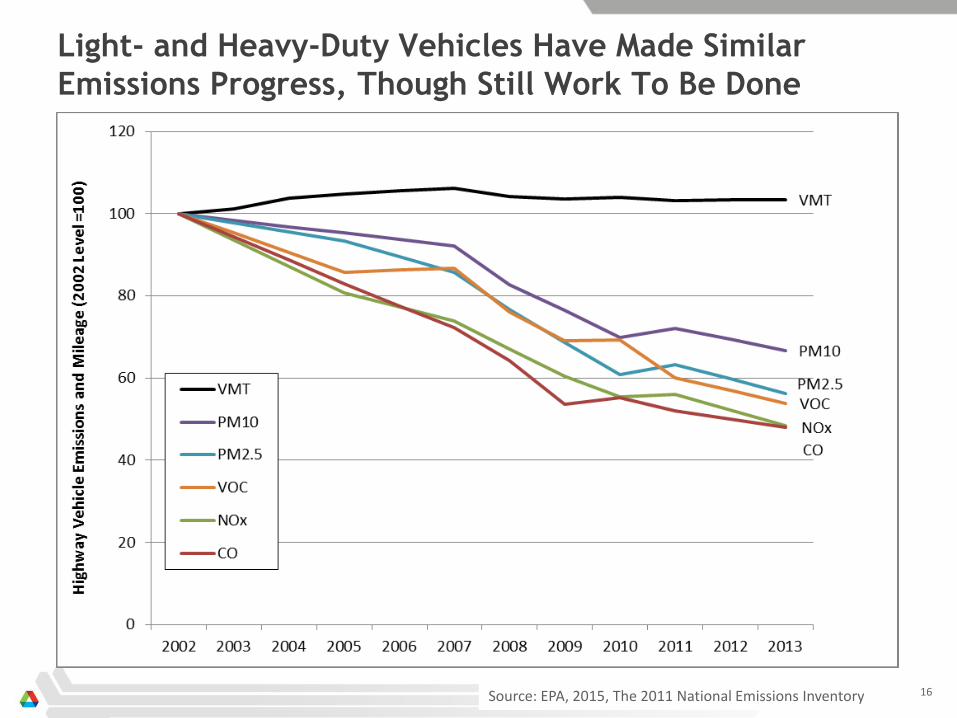
Light- and Heavy-Duty Vehicles Have Made Similar
Emissions Progress, Though Still Work To Be Done
16 Source: EPA, 2015, The 2011 National Emissions Inventory

17
Heavy-Duty Diesel and AFV Emissions
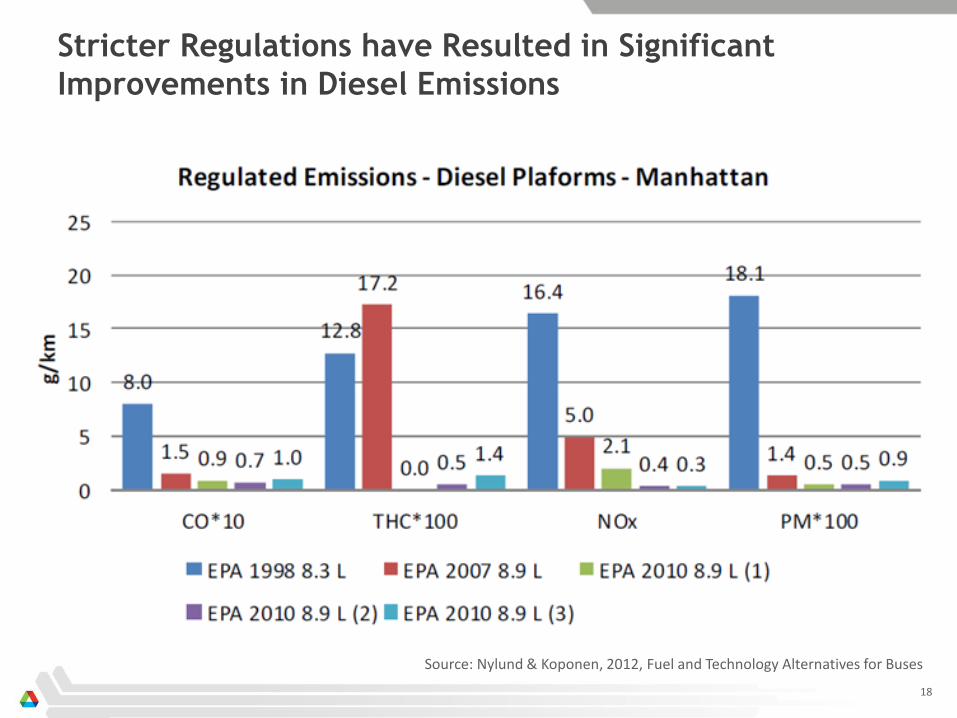
Stricter Regulations have Resulted in Significant
Improvements in Diesel Emissions
Source: Nylund & Koponen, 2012, Fuel and Technology Alternatives for Buses
18
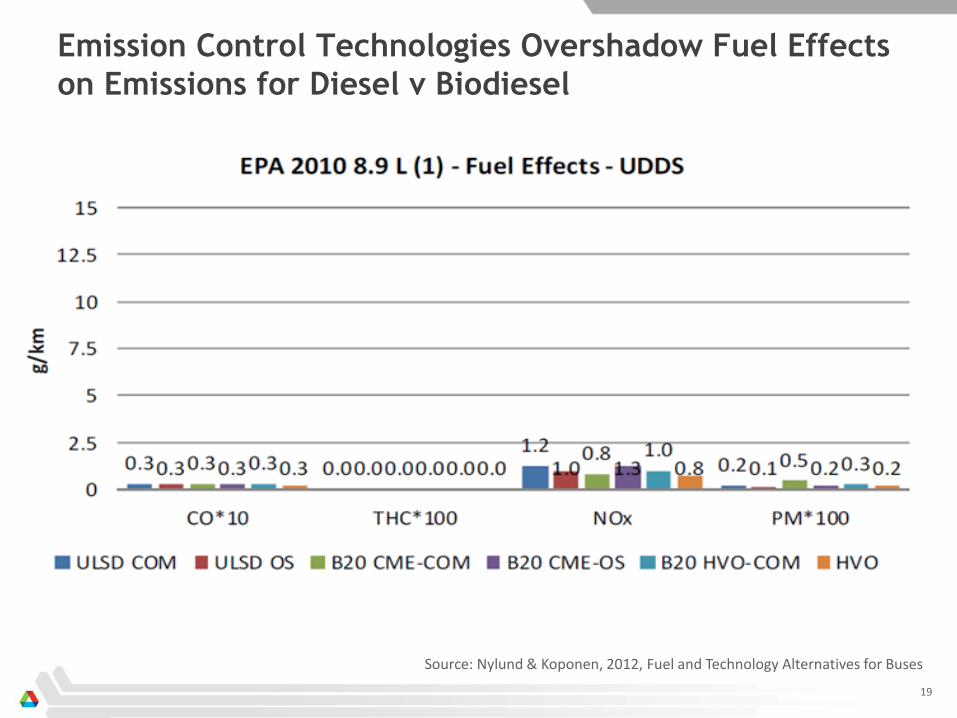
Emission Control Technologies Overshadow Fuel Effects
on Emissions for Diesel v Biodiesel
Source: Nylund & Koponen, 2012, Fuel and Technology Alternatives for Buses
19
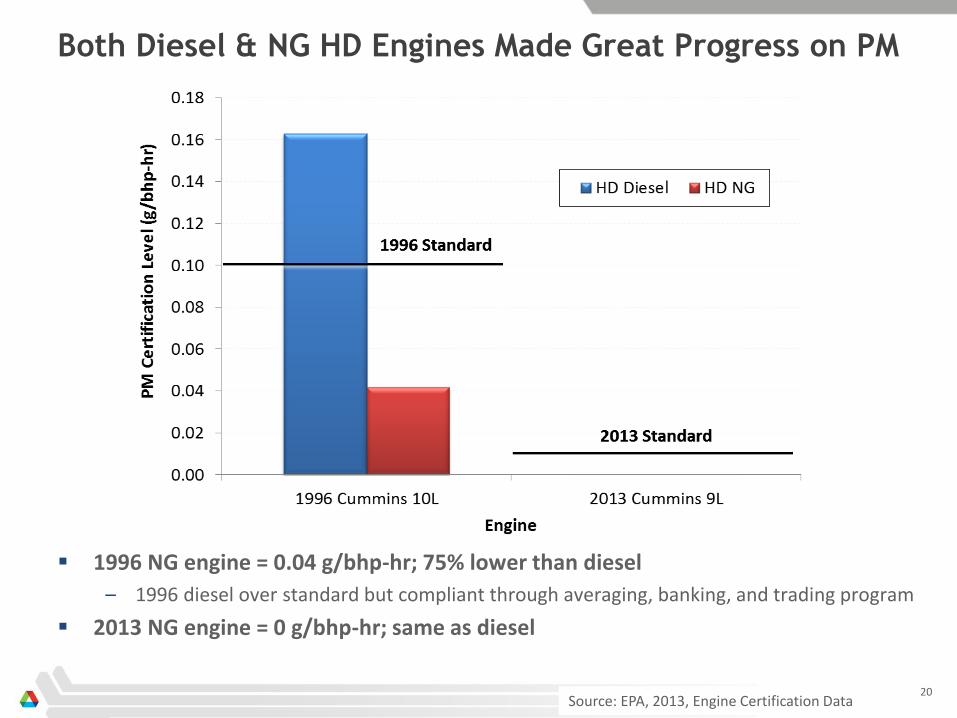
Both Diesel & NG HD Engines Made Great Progress on PM
1996 NG engine = 0.04 g/bhp-hr; 75% lower than diesel
– 1996 diesel over standard but compliant through averaging, banking, and trading program
2013 NG engine = 0 g/bhp-hr; same as diesel
20 Source: EPA, 2013, Engine Certification Data
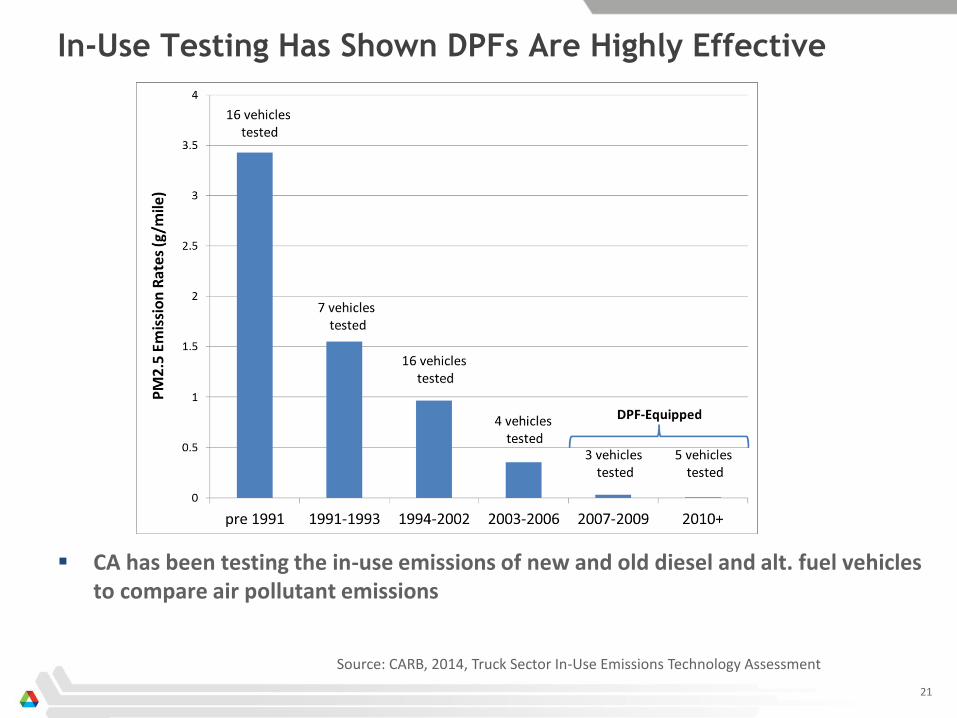
In-Use Testing Has Shown DPFs Are Highly Effective
CA has been testing the in-use emissions of new and old diesel and alt. fuel vehicles to compare air pollutant emissions
21
Source: CARB, 2014, Truck Sector In-Use Emissions Technology Assessment
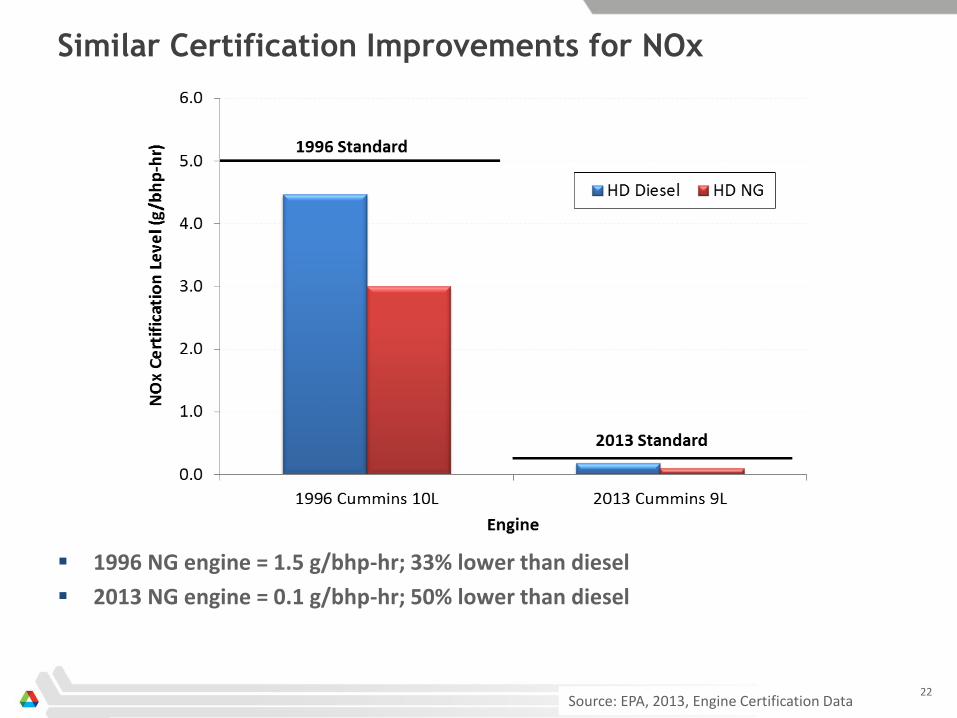
1996 NG engine = 1.5 g/bhp-hr; 33% lower than diesel
2013 NG engine = 0.1 g/bhp-hr; 50% lower than diesel
22
Similar Certification Improvements for NOx
Source: EPA, 2013, Engine Certification Data
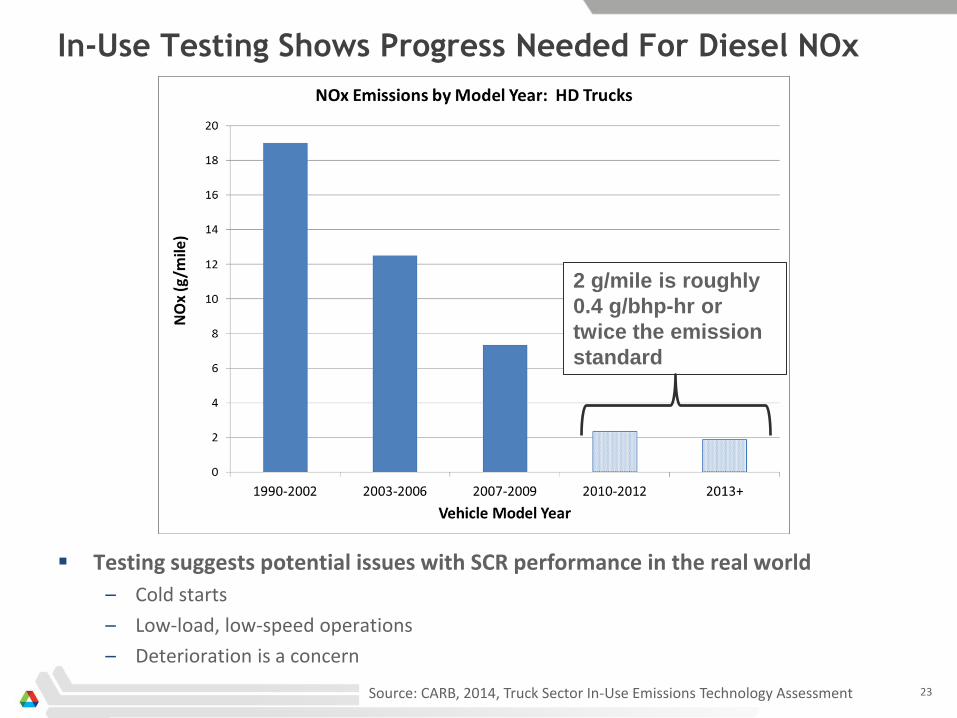
Testing suggests potential issues with SCR performance in the real world
– Cold starts
– Low-load, low-speed operations
– Deterioration is a concern
23 Source: CARB, 2014, Truck Sector In-Use Emissions Technology Assessment
In-Use Testing Shows Progress Needed For Diesel NOx
2 g/mile is roughly
0.4 g/bhp-hr or
twice the emission
standard
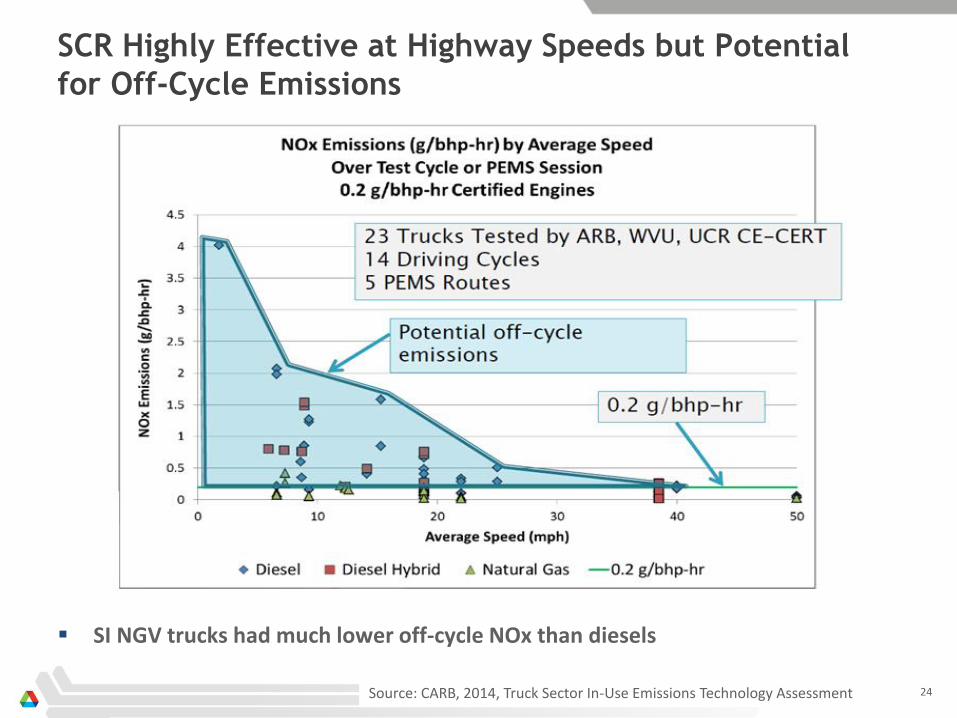
24
SI NGV trucks had much lower off-cycle NOx than diesels
SCR Highly Effective at Highway Speeds but Potential
for Off-Cycle Emissions
Source: CARB, 2014, Truck Sector In-Use Emissions Technology Assessment
25
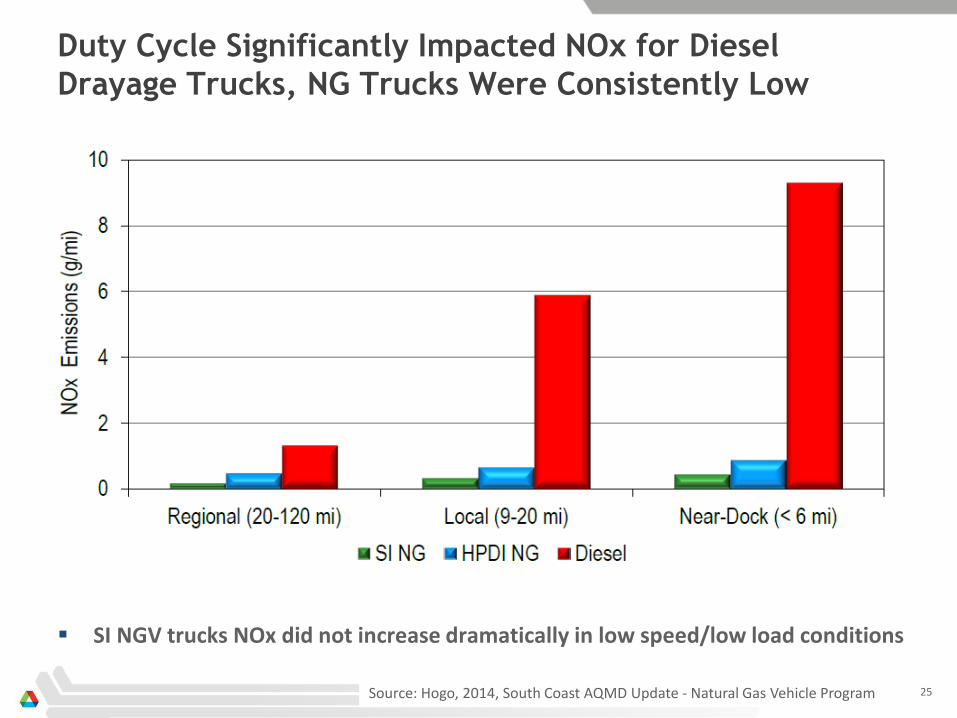
SI NGV trucks NOx did not increase dramatically in low speed/low load conditions
Duty Cycle Significantly Impacted NOx for Diesel
Drayage Trucks, NG Trucks Were Consistently Low
Source: Hogo, 2014, South Coast AQMD Update - Natural Gas Vehicle Program

NG Spark-Ignited HD Engines Significantly Higher CO
Emissions than Diesel
Differences in engine types and aftertreatment cause difference in CO
– CI diesel use lean burn (more O2 to oxidize CO to CO2) combustion with oxidation catalyst
– SI NG use stoichiometric (less O2 available) and no oxidation catalyst 26
Source: EPA, 2013, Engine Certification Data
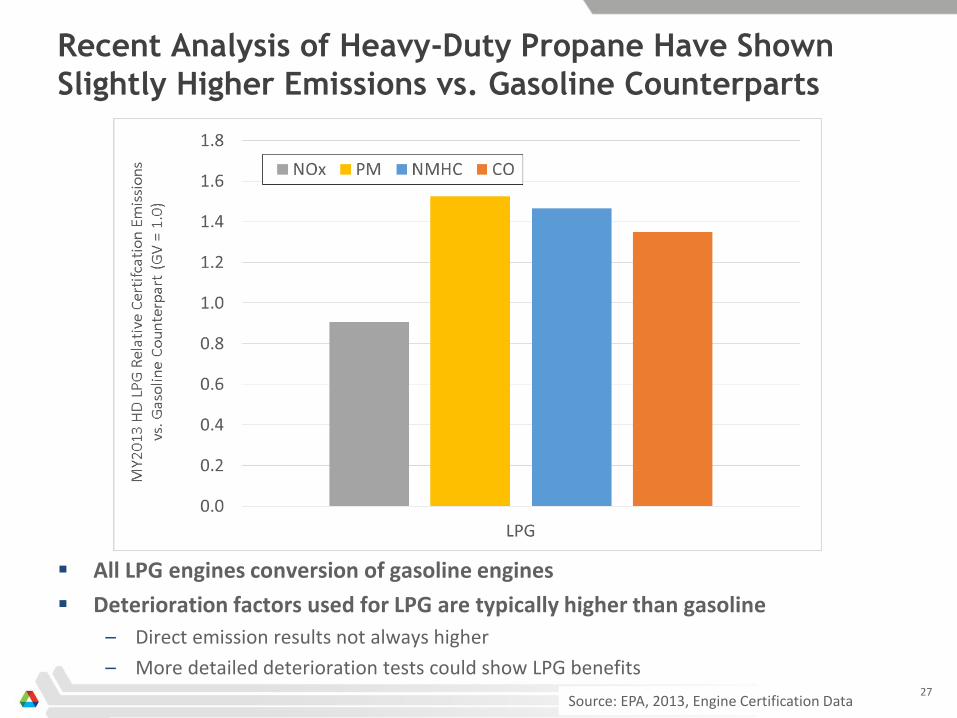
Recent Analysis of Heavy-Duty Propane Have Shown
Slightly Higher Emissions vs. Gasoline Counterparts
All LPG engines conversion of gasoline engines
Deterioration factors used for LPG are typically higher than gasoline
– Direct emission results not always higher
– More detailed deterioration tests could show LPG benefits 27
Source: EPA, 2013, Engine Certification Data
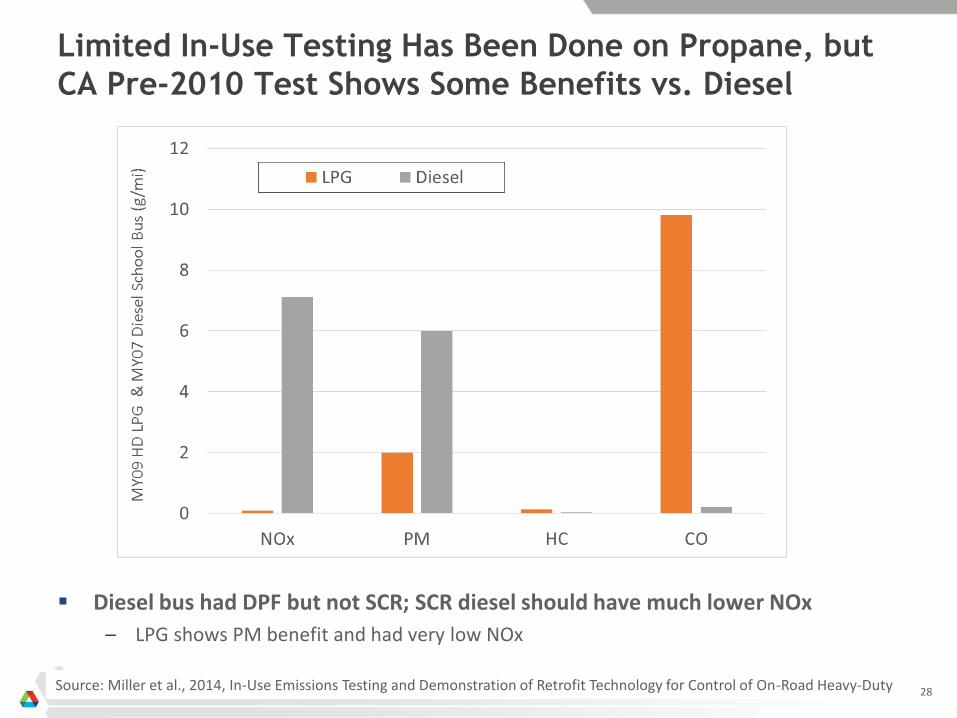
28
Diesel bus had DPF but not SCR; SCR diesel should have much lower NOx
– LPG shows PM benefit and had very low NOx
Limited In-Use Testing Has Been Done on Propane, but
CA Pre-2010 Test Shows Some Benefits vs. Diesel
Source: Miller et al., 2014, In-Use Emissions Testing and Demonstration of Retrofit Technology for Control of On-Road Heavy-Duty
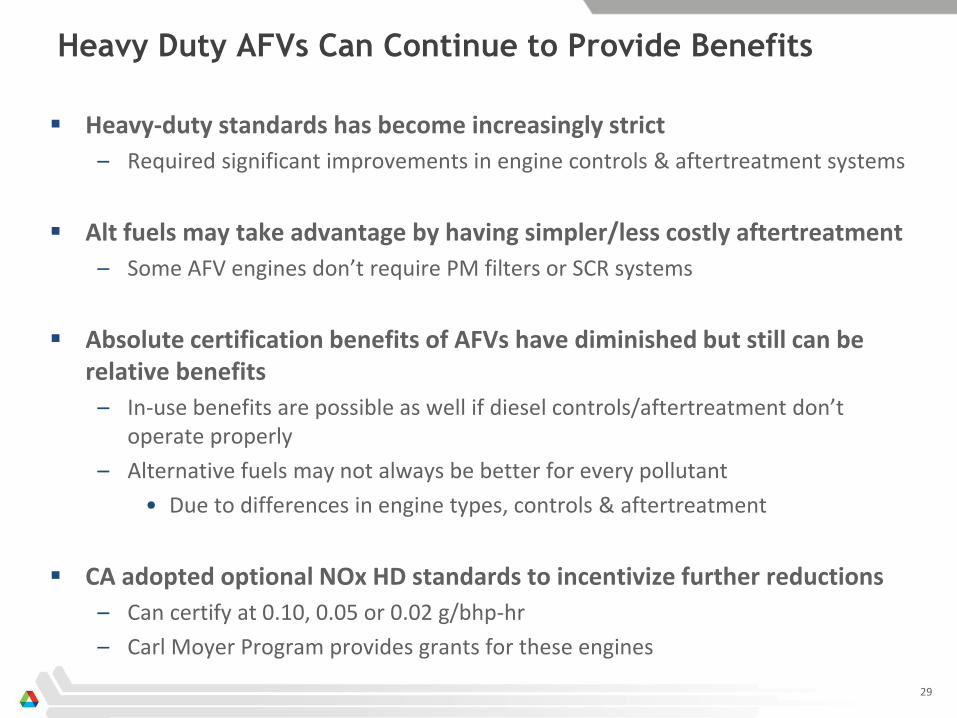
Heavy Duty AFVs Can Continue to Provide Benefits
Heavy-duty standards has become increasingly strict
– Required significant improvements in engine controls & aftertreatment systems
Alt fuels may take advantage by having simpler/less costly aftertreatment
– Some AFV engines don’t require PM filters or SCR systems
Absolute certification benefits of AFVs have diminished but still can be relative benefits
– In-use benefits are possible as well if diesel controls/aftertreatment don’t operate properly
– Alternative fuels may not always be better for every pollutant
• Due to differences in engine types, controls & aftertreatment
CA adopted optional NOx HD standards to incentivize further reductions
– Can certify at 0.10, 0.05 or 0.02 g/bhp-hr
– Carl Moyer Program provides grants for these engines
29
30
Light-Duty Gasoline and AFV Emissions
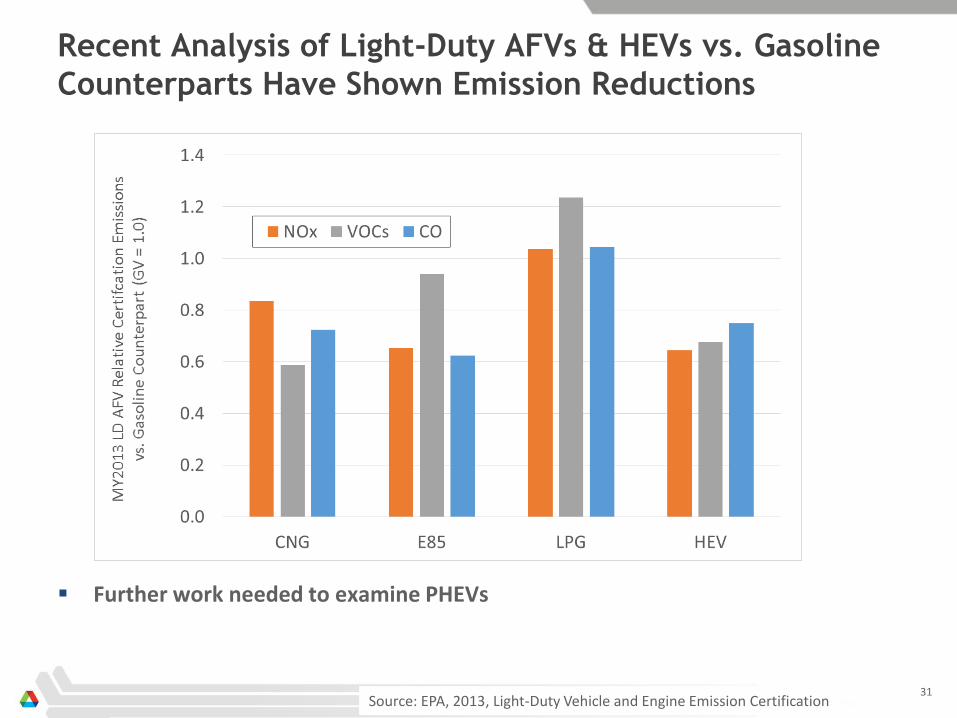
Recent Analysis of Light-Duty AFVs & HEVs vs. Gasoline
Counterparts Have Shown Emission Reductions
Further work needed to examine PHEVs
31 Source: EPA, 2013, Light-Duty Vehicle and Engine Emission Certification

Research has Shown Gasoline Direct Injection (GDI)
LDVs Increase PM2.5
GDI engine market share increased from 4% in MY09 to 38% in MY14
– Trend is to use downsized GDI engines with turbocharging
• Maintain performance while improving fuel economy
– Testing has show that GDI vehicles can increase PM (mass) by ~10x
• Also increases the number of fine particulates
– Technical solutions being developed
• Particulate filters
– May provide opportunity for AFVs, HEVs and PEVs
• Lower incremental cost?
32
Source: Khalek, 2011, Particle Emissions from Direct Injection Gasoline Engines
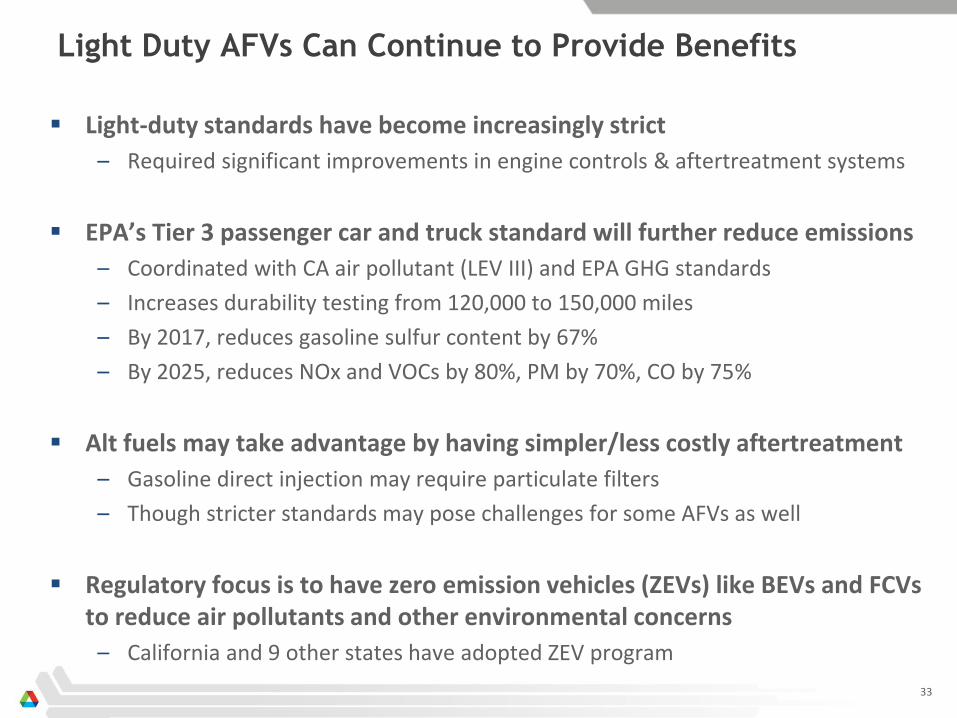
Light Duty AFVs Can Continue to Provide Benefits
Light-duty standards have become increasingly strict
– Required significant improvements in engine controls & aftertreatment systems
EPA’s Tier 3 passenger car and truck standard will further reduce emissions
– Coordinated with CA air pollutant (LEV III) and EPA GHG standards
– Increases durability testing from 120,000 to 150,000 miles
– By 2017, reduces gasoline sulfur content by 67%
– By 2025, reduces NOx and VOCs by 80%, PM by 70%, CO by 75%
Alt fuels may take advantage by having simpler/less costly aftertreatment
– Gasoline direct injection may require particulate filters
– Though stricter standards may pose challenges for some AFVs as well
Regulatory focus is to have zero emission vehicles (ZEVs) like BEVs and FCVs to reduce air pollutants and other environmental concerns
– California and 9 other states have adopted ZEV program
33
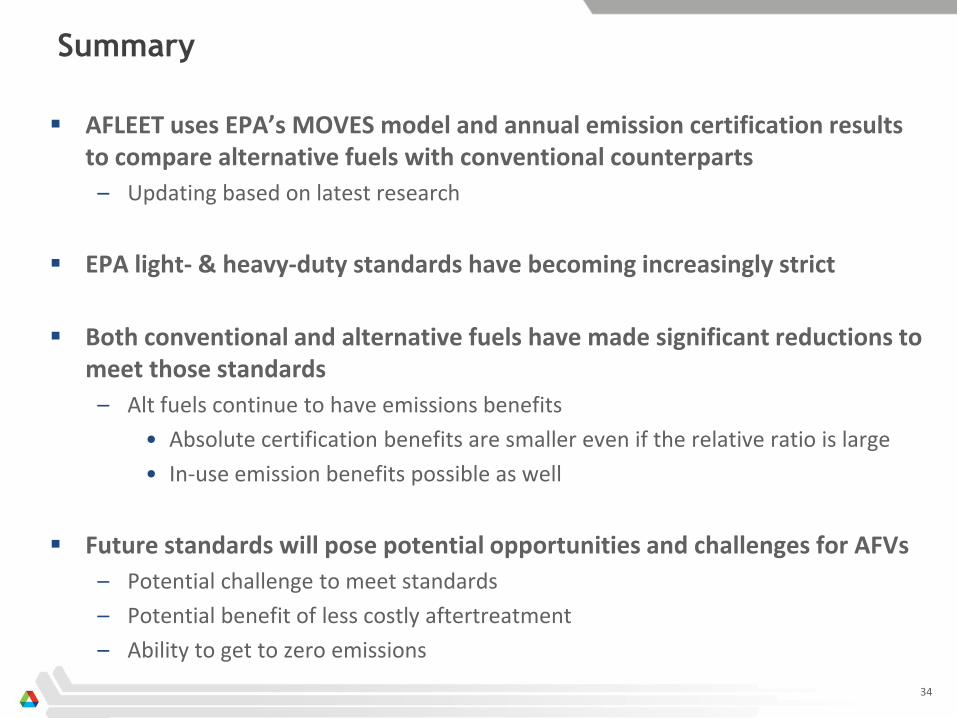
Summary
AFLEET uses EPA’s MOVES model and annual emission certification results to compare alternative fuels with conventional counterparts
– Updating based on latest research
EPA light- & heavy-duty standards have becoming increasingly strict
Both conventional and alternative fuels have made significant reductions to meet those standards
– Alt fuels continue to have emissions benefits
• Absolute certification benefits are smaller even if the relative ratio is large
• In-use emission benefits possible as well
Future standards will pose potential opportunities and challenges for AFVs
– Potential challenge to meet standards
– Potential benefit of less costly aftertreatment
– Ability to get to zero emissions
34
Thank you!!!
Argonne National Laboratory’s work is supported by the U.S. Department of Energy, Office of Energy Efficiency and Renewable Energy
This work has been supported and assisted by:
Linda Bluestein: U.S. Department of Energy
Dennis Smith: U.S. Department of Energy
Hao Cai: Argonne National Laboratory
Michael Wang: Argonne National Laboratory
Marcy Rood Werpy: Argonne National Laboratory
For additional information contact:
35

36
Backup Slides
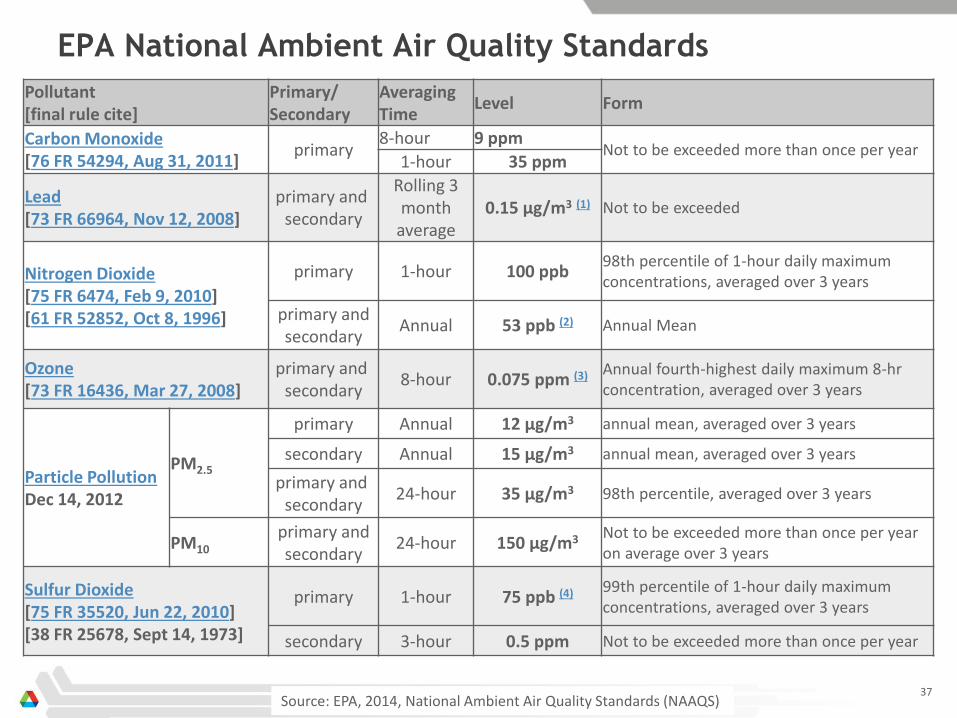
EPA National Ambient Air Quality Standards
Pollutant [final rule cite]
Primary/ Secondary
Averaging Time
Level Form
Carbon Monoxide [76 FR 54294, Aug 31, 2011]
primary 8-hour 9 ppm
Not to be exceeded more than once per year 1-hour 35 ppm
Lead [73 FR 66964, Nov 12, 2008]
primary and secondary
Rolling 3 month
average 0.15 μg/m3 (1) Not to be exceeded
Nitrogen Dioxide [75 FR 6474, Feb 9, 2010] [61 FR 52852, Oct 8, 1996]
primary 1-hour 100 ppb 98th percentile of 1-hour daily maximum concentrations, averaged over 3 years
primary and secondary
Annual 53 ppb (2) Annual Mean
Ozone [73 FR 16436, Mar 27, 2008]
primary and secondary
8-hour 0.075 ppm (3) Annual fourth-highest daily maximum 8-hr concentration, averaged over 3 years
Particle Pollution Dec 14, 2012
PM2.5
primary Annual 12 μg/m3 annual mean, averaged over 3 years
secondary Annual 15 μg/m3 annual mean, averaged over 3 years
primary and secondary
24-hour 35 μg/m3 98th percentile, averaged over 3 years
PM10 primary and secondary
24-hour 150 μg/m3 Not to be exceeded more than once per year on average over 3 years
Sulfur Dioxide [75 FR 35520, Jun 22, 2010] [38 FR 25678, Sept 14, 1973]
primary 1-hour 75 ppb (4) 99th percentile of 1-hour daily maximum concentrations, averaged over 3 years
secondary 3-hour 0.5 ppm Not to be exceeded more than once per year
37 Source: EPA, 2014, National Ambient Air Quality Standards (NAAQS)
38
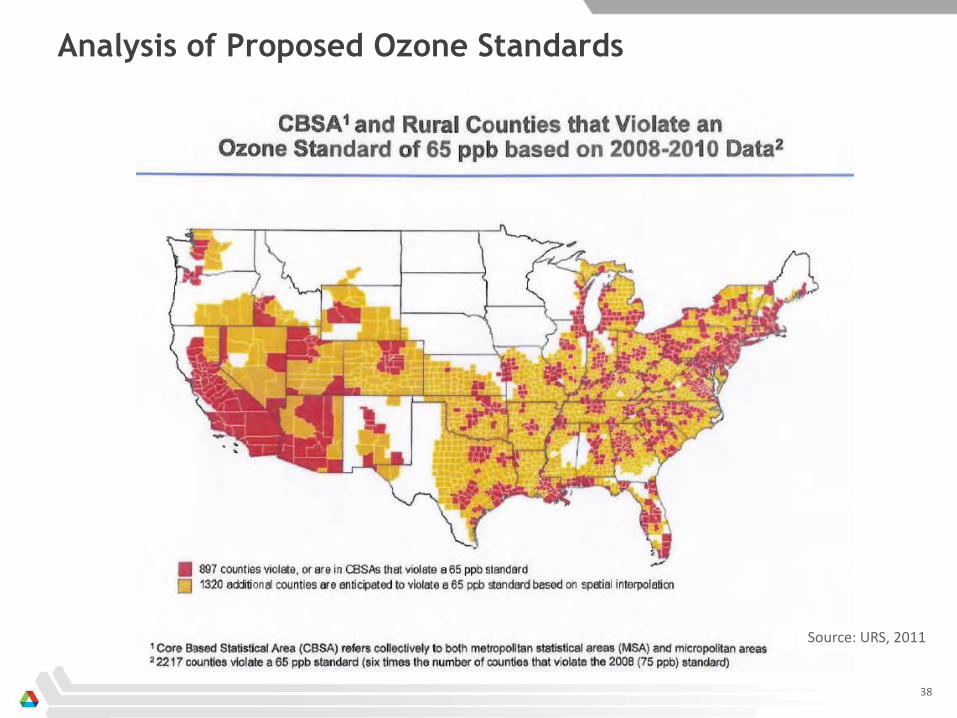
Source: URS, 2011
Analysis of Proposed Ozone Standards

39
Source: EPA, 2014, Proposed Revisions to National Ambient Air Quality Standards for Ozone
Analysis of Proposed Ozone Standards

Analysis of Proposed Ozone Standards
40
Source: EPA, 2014, Proposed Revisions to National Ambient Air Quality Standards for Ozone