system for monitoring an industrial process and determining sensor
TRANSCRIPT
United States Patent [191 Gross et al.
llllllllllllllllllllllllllllllllllllllllllllllllllllllllllllllllllllllllll 459675A
Patent Number:
[45] Date of Patent:
[11] 5,459,675 * Oct. 17, 1995
[54]
[75]
[73]
[*l
[21]
[22]
SYSTEM FOR MONITORING AN INDUSTRIAL PROCESS AND DETERMINING SENSOR STATUS
Inventors: Kenneth C. Gross, Bolingbrook; Kristin K. Hoyer, Chicago, both of 111.; Keith E. Humenik, Columbia, Md.
Assignee: ARCH Development Corporation, Chicago, 111.
Notice: ‘ The portion of the term of this patent subsequent to Apr. 25, 2012 has been disclaimed.
Appl. No.: 68,713
Filed: May 27, ‘1993
Related U.S. Application Data
Continuation-impart of Ser. No. 827,776, Jan. 29, 1992, Pat. No. 5,223,207.
Int. Cl.6 ............................... ,. G21C 7/36; G06F 7/00
U.S. Cl. ........................ .. 364/492; 364/576; 376/215; 376/216; 376/217; 395/914; 395/915
Field of Search ................................... .. 376/215, 216,
376/217; 395/914, 915; 364/492, 576, 554
References Cited U.S. PATENT DOCUMENTS
3,710,082 1/1973 Sloane et al. ......................... .. 235/151
3,848,115 11/1974 Sloane et al. 235/151 4,060,716 11/1977 Pekrulet al. 364/576 4,133,039 1/1979 Eichenlaub 364/554 4,215,340 7/1980 Lejon ..... .. 340/507
4,275,447 6/1981 Ruiz 364/494 4,292,129 9/1981 Barry .. ...... .. 176/2
4,399,095 6/1983 Morris .... .. 376/216
4,435,751 3/1984 Hori etal .. 364/574 4,598,271 7/1986 W'ziglietal ...... .. 340/511
4,611,197 9/1986 Sansky . . . . . . . . . . . .. 340/552
4,627,954 12/1986 Leroy et a1 376/216 4,658,245 4/1987 Dye etal 340/683 4,697,170 9/1987 Hoekman 340/551 4,707,687 11/1987 Thomas et al. ....................... .. 340/680
NONWIIIlE
0AM 00111611011
I'RIUUINCY-DUIAIN ANALYSIS OF DIFFERINCI FUNCll?N
FOURIER-COIWDSITE CUNSIRUEIIDN USING I: "1611151 100111111 H0015
SET
01' SERIAL CDllRllAllON FUURIUI CUWOSIIE
I [ISIIER KAPPA IESI 10R RUBUSINESS 0N RESlDUAl FUNCTION
USING
KOIWGORDFSIIRNOV 1151 FOR "1111111155 0" RESIDUAL lllNlIllUli
4,707,688 ll/l987 Thomas . . . . . . . . . . .. 340/680
4,715,000 12/1987 Premerlani . . . . . . . . . .. 364/484
4,744,242 5/1988 Anderson et al. .. 73/104 4,758,964 7/1988 Bittner et al. ..... .. . 364/508
4,772,445 9/1988 Nasrallah et al. .. . 376/245
4,783,307 1l/l988 Galligan et al. 376/217 4,803,040 2/1989 Gross . . . . . . . . . . . . . . . . . .. 376/216
4,816,208 3/1989 Woods et al. 376/259 4,849,741 7/1989 Thomas ......... .. . 340/683
4,923,117 5/1990 Adams et al. .. 236/94 4,977,390 12/1990 Saylor et al. ................. .. 340/521
4,990,302 2/1991 Oda et al. ............................. .. 376/216
(List continued on next page.)
OTHER PUBLICATIONS
“Spectrum-Transformed Sequential Testing Method for Sig nal Validation Applications,” Gross, et al., 8th Power Plant Dynamics, Control & Testing Symp., Knoxville, Tenn., May 1992.
(List continued on next page.)
Primary Examiner—Donald P. Walsh Assistant Examiner——Chrisman D. Carroll Attorney, Agent, or Firm—Reinhart, Boerner, Van Deuren, Norris & Rieselbach
[57] ABSTRACT
A method and system for monitoring an industrial process and a sensor. The method and system include generating a ?rst and second signal characterislic of an industrial process variable. One of the signals can be an arti?cial signal
9 generated by an auto regressive moving average technique. After obtaining two signals associated with one physical variable, a difference function is obtained by determining the arithmetic difference between the two pairs of signals over time. A frequency domain transformation is made of the difference function to obtain Fourier modes describing a composite function. A residual function is obtained by subtracting the composite function from the diiference func tion and the residual function (free of nonwhite noise) is analyzed by a statistical probability ratio test.
22 Claims, 7 Drawing Sheets
tiks’l?'itsf‘r'nk RISIDUAL nmcuou
nun-warms lESl FOR N?llllllll‘t uu RESIDUAL runcuuu
STORE AHFLIIUDE, PHASE AND mtcutucv CUIIIAINID IN rumour CWF'GSIIE
IlllllE MIA
GAUSSIAN
N01 AUIU CORRILHEIJ

5,459,675 Page 2
U.S. PATENT DOCUMENTS
4/1991 Takeuchi et a1. ..................... .. 376/217
6/1991 Watanabe et a1. .... .. 6/1991 Impink, Jr. et a1. 4/1992 Morton et a1. ........ ..
8/1992 Nishirnoto et a1. 3/1993 Erin et a1. ............. .. 6/1993 Gross et a1. .......................... .. 376/216
OTHER PUBLICATIONS
“Sensor failure detection in dynamical systems by Kalman ?ltering methodology,” Turkcan, Netherlands Energy Research Foundation, The Netherlands & O. Ciftcioglu, Istanbul Technical University, Turkey, Dynamics and Con trol in Nuclear Power Stations, BNES, London, 1991, pp. 133-139. “Plant Monitoring and Signal Validation at HFIR,” Mullens, Oak Ridge National Laboratory, Instrumentation & Controls Div., Oak Ridge, Tenn., pp. 2.01-2.12. “An Expert System for Sensor Data Validation and Mal function Detection,” Hasharni, et al., presented at American Nuclear Society Topical Meeting, Aug. 31-Sep. 2, 1987, Snowbird, Utah. “On-Line Test of Signal Validation Software on the Lobi-MOD2 Facility in Ispra, Italy,” Prock et al., Nuclear Technology, vol. 97, Jan. 1992, pp. 52-62. “Spike Energy in Fault Analysis/Machine Condition Moni toring,” Shea et al. “Loose Part Monitor Sensor Validation, Impact Detection, and Characterization,” Allen, Nuclear Power Journal, May-Jun. 1989, pp. 80, 82, 84 & 91. “Reactor Operations” Arti?cial Intelligence Applications to Improve Nuclear Plant Operations, Quallis, et al, 1988 Winter Meeting, Washington, DC, International Confer ence on Nuclear Fission Fifty Years of Process in Energy Security. “Control and Instrumentation,” Upadhyaya, Nuclear Safety, vol. 26, No. 1, Jan-Feb. 1985, pp. 32-42. “A Methodology for the Design and Analysis of a Sensor Failure Detection Network,” Chou, et al, Nuclear Technol ogy, vol. 101, Jan. 1993, pp. 101-109. “Validation of Smart Sensor Technologies for Instrument Calibration Reduction in Nuclear Power Plants,” Hashe main, et al, NUREG/CR-5903, pp. i-ix and 1-154. “Intelligent Interfaces to Expert Systems Illustrated by a Programmable Signal Validation System,” Frogner, Expert Systems Applications for the Electric Power Industry, vol. 1, 1991, pp. 243-256. “Validation of Critical Signals for the Safety Parameter Display System,” NP-5066M, Research Project 2292-1, Final Report, Apr. 1987. “Fault-Tolerant Plant Operations Systems I: A Tutorial on Concepts,” Dove (NASA), pp. 370-374. “Fault-Tolerant Plant Operations Systems H: Reports on
5,009,833 5,023,045 5,024,801 5,103,402 5,140,858 5,192,493 5,223,207
Experience in Implementation,” Blanca?or, et al, pp. 375-379. “Microcomputer-Based Fault Detection Using Redundant Sensors,” Polenta, et al, IEEE Transactions on Nuclear Science, vol. 24, No. 5, Sep.-Oct. 1988, pp. 905-912. “Construction and Evaluation of Fault Detection Network for Signal Validation,” Ning et al, IEEE Transactions on Nuclear Science, vol. 39, No. 4, 1992, pp. 943-947. “Early Fault Detection and Diagnosis in Finnish Nuclear Power Plants,” Eklund, et al, Progress in Nuclear Energy, 1988, vol. 21, pp. 479-487. “Fault Detection Method Using Power Supply Spectrum Analysis,” Electronics Letters 27th Sep. 1990 vol. 26, No. 28. “Process Hypercube Comparison for Signal Validation,” Holbert, IEEE Transactions on Nuclear Science, vol. 38, No. 2, Apr. 1991, pp. 803-811. “Algorithm-Based Fault Detection for Signal Processing Applications,” Reddy et al, IEEE Transactions on Comput ers, vol. 39, No. 10, Oct. 1990, pp. 1304-1308. “Signal Validation Techniques and Power Plant Applica tions,” Divakaruni, et al, Progress in Nuclear Energy, vol. 22, No. 3, pp. 181-213, 1988. “Power Signal Validation for Taiwan Research Reactor,” Lee, et al, Nuclear Technology, vol. 84, Jan. 1989, pp. 7-13. “Instrument Fault Detection in a Pressurized Water Reactor Pressurizer,” Clark, et al, Nuclear Technology, vol. 56, Jan. 1982, pp. 23-32. “An Integrated Signal Validation System for Nuclear Power Plants,” Holbert, et al, Nuclear Technology, vol. 92, Dec. 1990, pp. 411-427. “On-Line Signal Validation and Feedback Control in a Nuclear Reactor,” Ray, et al, pp. 38.01-38.09. “Signal Validation with Control Room Information-Processing Computers,” Belblidia, et al, Progress in Nuclear Energy, vol. 12, No. 10, pp. 551-558, 1985. “Expert Systems application to Plant Diagnosis and Sensor Data Validation,” Hasherni, et al, Power Plant Dynamics, Control & Testing Symposium, 6th Proceedings, Apr. 14-16, 1986, Knoxville, Tenn. “An Expert System for Real-Tim Diagnostics and Control,” Christie, et al, ANS Topical Meeting on Computer Appli cations for Nuclear Power Plan Operation and Control, Sep. 1985, pp. 671-676. “Knowledge-Based Systems in Process Fault Diagnosis,” Sudduth, Nuclear Engineering and Design, vol. 112, 1989, pp. 195-209. “Condition Monitoring of Machinery Using Motor Current Signature Analysis (MCSA),” Kryter. “Sensor Fault Monitoring and Process Diagnostics,” Upadhyaya, et al, Tennessee Industries Week, vol. 1, Aug. 16-18, 1989.

US. Patent 0a. 17, 1995 Sheet 1 0f 7 5,459,675
i I I I I I I > I I l I l . l l IF 0
_ _ _ _ Q
_ _ _ _
_ _ _ .1
_ _ _ - _
-||_|||_ 1 | | 1 1 I | 1. Fulfil» |_|||--w
_ _ _ -- _
_ _ _ _
_ _ _ l. _ n _ _ _ If _ T
_ _ _ _ O
rlLillfL a | . . | ||_||.| 11.11:.-4
_ _ . w a _
_ _ 0Q 5 k h _ _ _ ll _
_ _ _ ‘v _
_ _ _ _
5 5 5 O 5 5 5 2 0. 2 5
7. 9. 2 9. 7. Rm 0 O O O 0
N m w H m U _ _
1 .1 1 Emma
581mg
US. Patent Oct. 17, 1995 Sheet 2 of 7 5,459,675
1 0.1 0.01 1 0.001
929,. 4%"
-| 11111111 1 Illlllll
(Ill Illlllll
2 1| 0 4|. 2 O 0 O _ _
all 4' 41
1: N: .5
0 1 3 1 0.01 0.1
FREQUENCY, Hz 0.001

US. Patent 0a. 17, 1995 Sheet 3 of 7 5,459,675
0.5
5%? 54
0.1 0.3 POWER, kw
go $2.52


US. Patent Oct. 17, 1995 Sheet 5 0f 7 5,459,675
‘9.714 d
I ‘115..
‘ T .m, 1 l . i I l
I II’, I | A
I “1,1,1 . L k I
100
400 250 200 150 100
—100 250 200 150 100 50
100 —
0..
——100
$6
250 200 Y 150 100 50
| 250
| 200
| | 100 150 TIME, SECONDS
50
US. Patent
52?. SA
on. 17, 1995 Sheet 6 of 7
DATA COLLECTION I
FREQUENCY-DOMAIN ANALYSIS OF DIFFERENCE FUNCTION
FOURIER-COMPOSITE CONSTRUCTION USING k HIGHEST FOURIER MODES
FILTERING OF SERIAL CORRELATION USING FOURIER COMPOSITE
NONWHITE -(——————-——-—
FISHER KAPPA TEST FOR ROBUSTNESS 0N RESIDUAL FUNCTION
KOLMOCOROV~SMIRNOV TEST FOR WHITENESS ON RESIDUAL FUNCTION
NONCAUSSIAN
AUTO
D'ANCOSTINA-PEARSON TEST FOR WHITENESS ON RESIDUAL FUNCTION
GAUSSIAN CORRELATED RUN—OF~SICNS TEST FOR NORMALITY
ON RESIDUAL FUNCTION
NOT AUTO CORRELATED
STORE AMPLITUDE, PHASE AND FREQUENCY CONTAINED IN FOURIER COMPOSITE
PHASE 2 I
5,459,675

US. Patent Oct. 17, 1995 Sheet 7 of 7 5,459,675
959,. 63%
I I PHASE I DATA I
CONSTRUCT SERIALLY CORRELATEO COMPONENTS USING PHASE I INFORMATION
FILTER SERIAL CORRELATION FROM SIGNAL TO OBTAIN RESIDUAL FUNCTION
EXPERT SYSTEM

5,459,675 1
SYSTEM FOR MONITORING AN INDUSTRIAL PROCESS AND DETERMINING
SENSOR STATUS
The United States Government has rights in this inven tion pursuant to Contract W~3l-109-ENG-38 between the U.S. Department of Energy and the University of Chicago. This application is a continuation-in-part of U.S. Ser. No. 07/827,776, ?led Jan. 29, 1992, now U.S. Pat. No. 5,223, 207.
The present invention is concerned generally with a system and method for reliably monitoring industrial pro cesses having nonwhite noise characteristics. More particu larly, the invention is concerned with a system and method for removal of nonwhite noise elements or serially corre lated noise, allowing reliable supervision of an industrial process and/or operability of sensors monitoring the process.
Conventional parameter-surveillance schemes are sensi tive only to gross changes in the mean value of a process, or to large steps or spikes that exceed some threshold limit check. These conventional methods suffer from either large numbers of false alarms (if thresholds are set too close to normal operating levels) or a large number of missed (or delayed) alarms (if the thresholds are set too expansively). Moreover, most conventional methods cannot perceive the onset of a process disturbance or sensor deviation which gives rise to a signal below the threshold level for an alarm condition.
In another conventional monitoring method, the Sequen tial Probability Ratio Test (“SPRT”) has found wide appli cation as a signal validation tool in the nuclear reactor industry. Two features of the SPRT technique make it attractive for parameter surveillance and fault detection: (1) early annunciation of the onset of a disturbance in noisy process variables, and (2) the SPRT technique has user speci?able false-alarm and missed-alarm probabilities. One important drawback of the SPRT technique that has limited its adaptation to a broader range of nuclear applications is the fact that its mathematical formalism is founded upon an assumption that the signals it is monitoring are purely Gaussian, independent (white noise) random variables.
It is therefore an object of the invention to provide an improved method and system for continuous evaluation and/or modi?cation of industrial processes and/or sensors monitoring the processes.
It is another object of the invention to provide a novel method and system for statistically processing industrial process signals having virtually any form of noise signal.
It is a further object of the invention to provide an improved method and system for operating on an industrial process signal to remove unwanted serially correlated noise signals. 4
It is still an additional object of the invention to provide a novel method and system utilizing a pair of signals to generate a difference function to be analyzed for alarm information.
It is still a further object of the invention to provide an improved method and system including at least one sensor for providing a real signal characteristic of a process and a predicted sensor signal allowing formation of a difference signal between the predicted and real signal for subsequent analysis free from nonwhite noise contamination.
It is also an object of the invention to provide a novel method and system wherein a difference function is foraged from two sensor signals, and/or pairs of signals and non white noise is removed enabling reliable alarm analysis of the sensor signals.
10
25
35
45
55
60
65
2 It is yet an additional object of the invention to provide
an improved method and system utilizing variable pairs of sensors for determining both sensor degradation and indus trial process status.
Other objects, features and advantages of the present invention will be readily apparent from the following description of the preferred embodiments thereof, taken in conjunction with the accompanying drawings described below.
BRIEF DESCRIPTION OF THE DRAWINGS
FIG. 1 illustrates the speci?ed output of a pump’s power output over time;
FIG. 2 shows a Fourier composite curve ?t to the pump spectral output of FIG. 1;
FIG. 3 illustrates a residual function characteristic of the diiference between FIGS. 1 and 2;
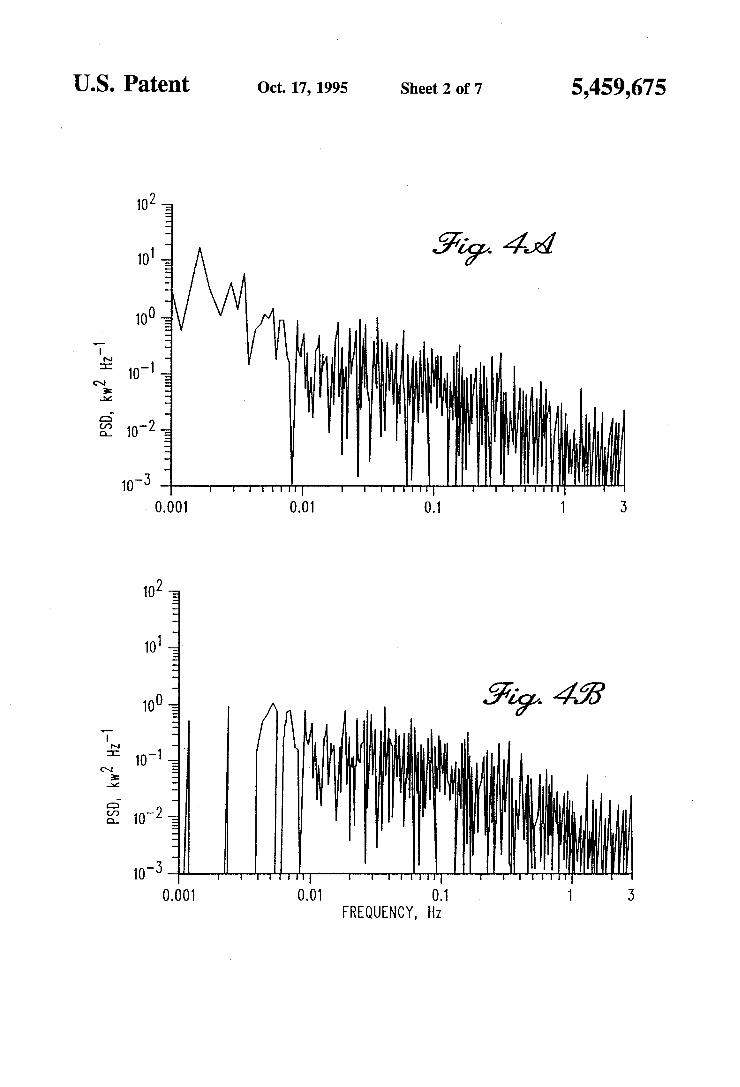
FIG. 4A shows a periodogram of the spectral data of FIG. 1 and FIG. 4B shows a periodogram of the residual function of FIG. 3;
FIG. SA illustrates a noise histogram for the pump power output of FIG. 1 and FIG. 5B illustrates a noise histogram for the residual function of FIG. 3;
FIG. 6A shows an unmodi?ed delayed neutron detector signal from a ?rst sensor and FIG. 6B is for a second neutron sensor; FIG. 6C shows a difference function characteristic of the difference between data in FIG. 6A and 6B and FIG. 6D shows the data output from a SPRT analysis with alarm conditions indicated by the diamond symbols;
FIG. 7A illustrates an unmodi?ed delayed neutron detec tor signal from a ?rst sensor and FIG. 7B is for a second neutron sensor; FIG. 7C shows a difference function for the difference between the data of FIG. 7A and 7B and FIG. 7D shows the result of using the instant invention to modify the difference function to provide data free of serially correlated noise to the SPRT analysis to generate alarm information and with alarm conditions indicated by the diamond signals; and
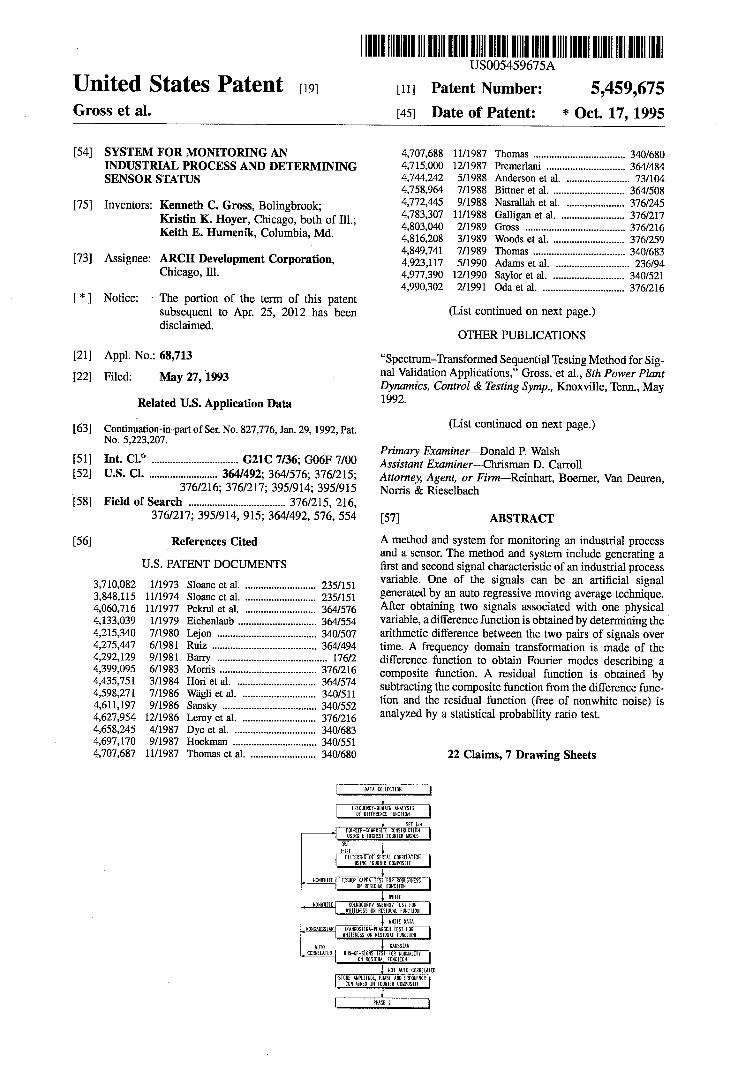
FIG. 8 illustrates a schematic functional ?ow diagram of the invention with FIG. 8A showing a ?rst phase of the method of the invention and FIG. 8B shows the application of the method of the invention.
DETAJLED DESCRIPTION OF PREFERRED EMBODIMENTS
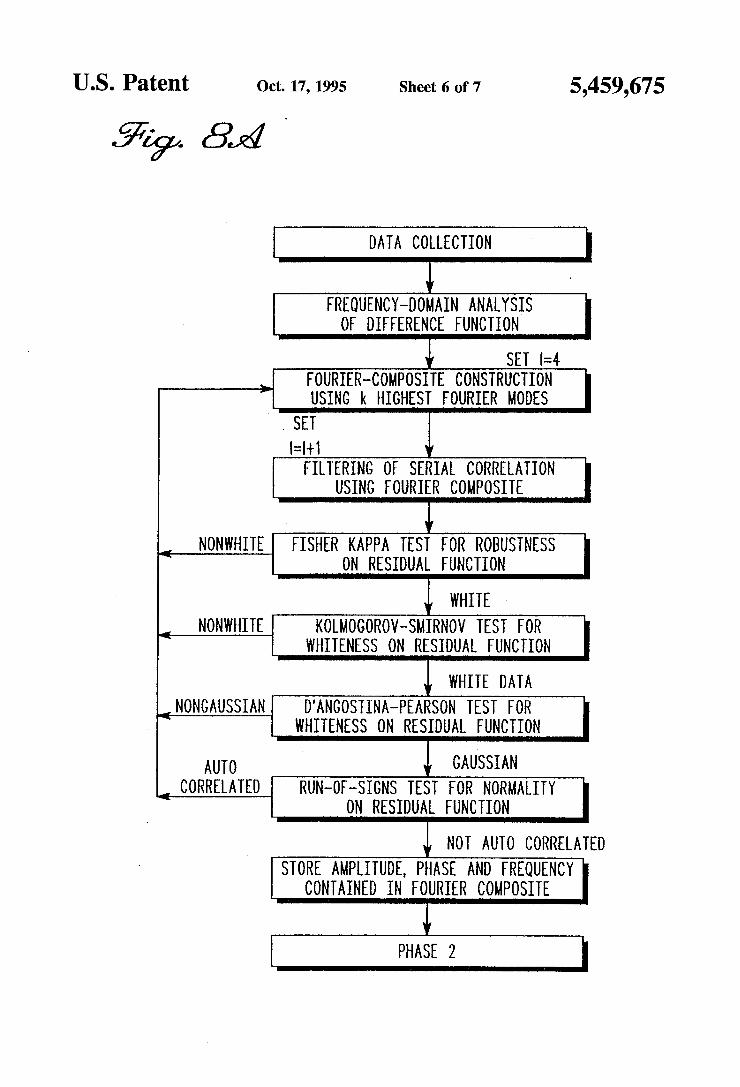
In a method of the invention signals from industrial process sensors can be used to modify or terminate degrad ing or anomalous processes. The sensor signals are manipu lated to provide input data to a statistical analysis technique, such as a process entitled Spectrum Transformed Sequential Testing (“SPRT”). Details of this process and the invention therein are disclosed in U.S. patent application 07/827,776, now U.S. Pat. No. 5,223,207, which is incorporated by reference herein in its entirety. A further illustration of the use of SPRT for analysis of data bases is set forth in the copending application ?led contemporaneously, entitled “Processing Data Base Information Having Nonwhite Noise,” also incorporated by reference herein in its entirety (Ser. No. 08/068,712). The procedures followed in a pre ferred method are shown generally in FIG. 8. In performing such a preferred analysis of the sensor signals, a dual transformation method is performed, insofar as it entails both a frequency-domain transformation of the original time-series data and a subsequent time-domain transforma~
5,459,675 3
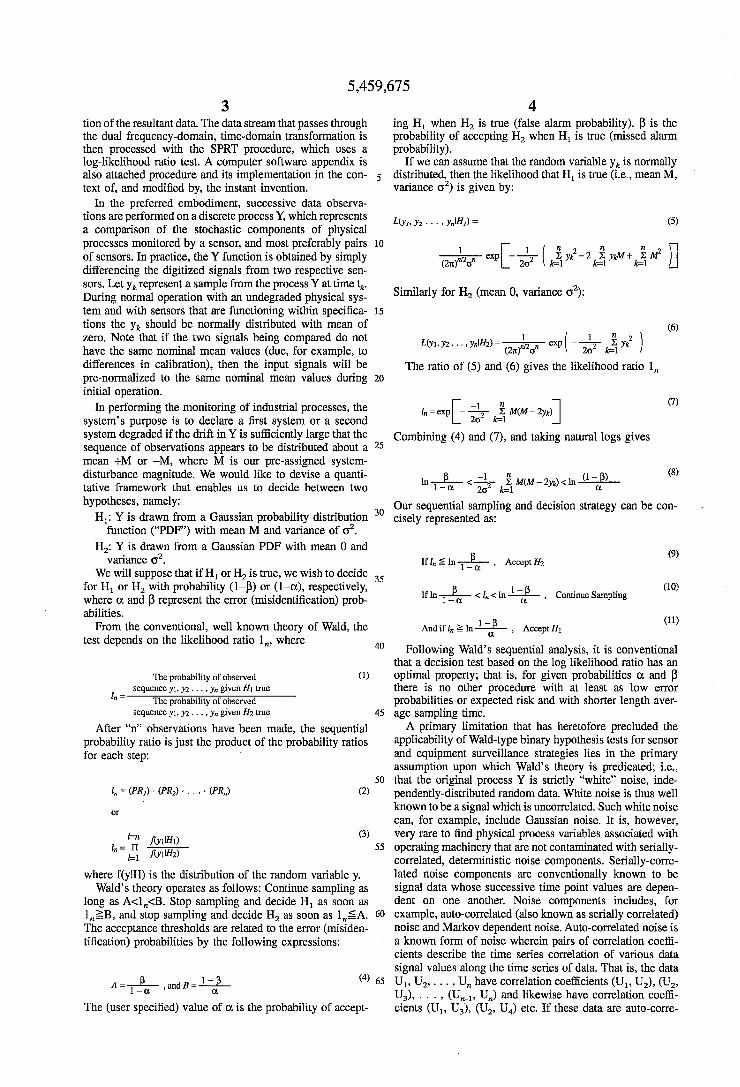
tion of the resultant data. The data stream that passes through the dual frequency-domain, time-domain transformation is then processed with the SPRT procedure, which uses a log-likelihood ratio test. A computer software appendix is also attached procedure and its implementation in the con text of, and modi?ed by, the instant invention.
In the preferred embodiment, successive data observa~ tions are performed on a discrete process Y, which represents a comparison of the stochastic components of physical processes monitored by a sensor, and most preferably pairs of sensors. In practice, the Y function is obtained by simply differencing the digitized signals from two respective sen sors. Let yk represent a sample from the process Y at time tk. During normal operation with an undegraded physical sys tem and with sensors that are functioning within speci?ca tions the yk should be normally distributed with mean of zero. Note that if the two signals being compared do not have the same nominal mean values (due, for example, to differences in calibration), then the input signals will be pre-nonnalized to the same nominal mean values during initial operation.
In performing the monitoring of industrial processes, the system’s purpose is to declare a ?rst system or a second system degraded if the drift in Y is sufficiently large that the sequence of observations appears to be distributed about a mean +M or -M, where M is our pre-assigned system disturbance magnitude. We would like to devise a quanti tative framework that enables us to decide between two hypotheses, namely:
H1: Y is drawn from a Gaussian probability distribution function (“PDF”) with mean M and variance of 02.
H2: Y is drawn from a Gaussian PDF with mean 0 and variance 62.
We will suppose that if H1 or H2 is true, we wish to decide for H1 or H2 with probability (l—[5) or (1—(X), respectively, where 06 and [3 represent the error (misidenti?cation) prob abilities. From the conventional, well known theory of Wald, the
test depends on the likelihood ratio 1”, where
The probability of observed (1) sequence y1, y2 . . . , y" given H1 true
" : The probability of observed
sequence y1, y2 . . . , y" given H2 true
After “n” observations have been made, the sequential probability ratio is just the product of the probability ratios for each step:
1,. = (PR1) - (PR2) - - - - - (PR,.) (2)
where f(ylH) is the distribution of the random variable y. Wald’s theory operates as follows: Continue sampling as
long as A<1,,<B. Stop sampling and decide H1 as soon as lniB, and stop sampling and decide H2 as soon as l,,__<_A. The acceptance thresholds are related to the error (misiden ti?cation) probabilities by the following expressions:
The (user speci?ed) value of oz is the probability of accept
5
10
20
30
60
65
4 ing H1 when H2 is true (false alarm probability). [3 is the probability of accepting H2 when H1 is true (missed alarm probability).
If we can assume that the random variable yk is normally distributed, then the likelihood that H1 is true (i.e., mean M, variance 02) is given by:
L(yh Y2 - - s , ynlHI) = (5)
g 2 2 g M iii/12) — + yk blyk b1
Similarly for H2 (mean 0, variance 02):
n (6) 2
IP21 Yk The ratio of (5) and (6) gives the likelihood ratio 1,,
l — _1 §MM 2 (7) n—BXP[_F k=1 ( — J’k):|
Combining (4) and (7), and taking natural logs gives
(8)
Our sequential sampling and decision strategy can be con cisely represented as:
(9) If I,, § ln-1—_§a— , Accept H2
E 1 _ E (10) If ln 1 _ a < 1,, < ln a , Continue Sampling
(11) , Accept H1 Amman-L10?
Following Wald’s sequential analysis, it is conventional that a decision test based on the log likelihood ratio has an optimal property; that is, for given probabilities 0t and [3 there is no other procedure with at least as low error probabilities or expected risk and with shorter length aver age sampling time. A primary limitation that has heretofore precluded the
applicability of Wald-type binary hypothesis tests for sensor and equipment surveillance strategies lies in the primary assumption upon which Wald’s theory is predicated; i.e., that the original process Y is strictly “white” noise, inde pendently-distributed random data. White noise is thus well known to be a signal which is uncorrelated. Such white noise can, for example, include Gaussian noise. It is, however, very rare to ?nd physical process variables associated with operating machinery that are not contaminated with serially correlated, deterministic noise components. serially-corre lated noise components are conventionally known to be signal data whose successive time point values are depen dent on one another. Noise components includes, for example, auto-correlated (also known as serially correlated) noise and Markov dependent noise. Auto-correlated noise is a known form of noise wherein pairs of correlation coeffi cients describe the time series correlation of various data signal values along the time series of data. That is, the data U1, U2, . . . , U" have correlation coe?icients (U1, U2), (U2, U3), . . . , (U,,_,, U") and likewise have correlation coe?i
cients (U1, U3), (U2, U4) etc. If these data are auto-corre

5,459,675 5
lated, at least some of the coef?cients are non-zero. Markov dependent noise on the other hand is a very special form of correlation between past and future data signals. Rather, given the value of Uk, the values of U,,, n>k, do not depend on the values of U, where j<k. This implies the correlation pairs (U,, U,,) given the value U,,, are all zero. If, however, the present value is imprecise, then the correlation coe?i cients may be nonzero. This invention can overcome this limitation to conventional surveillance strategies by inte grating the Wald sequential-test approach with a new dual transformation technique. This symbiotic combination of frequency-domain transformations and time-domain trans formations produces a tractable solution to a particularly di?icult problem that has plagued signal-processing special ists for many years.
In the preferred embodiment of the method shown in detail in FIG. 8, serially-correlated data signals from an industrial process can be rendered amenable to the SPRT testing methodology described hereinbefore. This is prefer ably done by performing a frequency-domain transforma tion of the original difference function Y. A particularly preferred method of such a frequency transformation is accomplished by generating a Fourier series using a set of highest “1” number of modes. Other procedures for render ing the data amenable to SPRT methods includes, for example, auto regressive techniques, which can accomplish substantially similar results described herein for Fourier analysis. In the preferred approach of Fourier analysis to determine the “1” highest modes (see FIG. 8A):
1 (12) a0 2
Y, : T + 2 (am cos mm: +bm sin mm!) m=l
where aO/2 is the mean value of the series, am and b,,, are the Fourier coei?cients corresponding to the Fourier frequency mm, and N is the total number of observations. Using the Fourier coe?icients, we next generate a composite function, X,, using the values of the largest harmonics identi?ed in the Fourier transformation of Y,. The following numerical approximation to the Fourier transform is useful in deter mining the Fourier coe?icients a", and b,,,. Let x, be the value of X, at the jth time increment. Then assuming 21: periodicity and letting (nm=21tm/N, the approximation to the Fourier transform yields:
1v-1 (13)
for 0<m<N/2. Furthermore, the power spectral density (“PSD”) function for the signal is given by 1m where
a"? + b,,,2 (14) lm = N-2—
To keep the signal bandwidth as narrow as possible without distorting the PSD, no spectral windows or smoothing are used in our implementation of the frequency-domain trans formation. In analysis of a pumping system of the EBR-II reactor of Argonne National Laboratory, the Fourier modes corresponding to the eight highest 1", provide the amplitudes and frequencies contained in X,. In our investigations for the particular pumping system data taken, the highest eight 1", modes were found to give an accurate reconstruction of X, while reducing most of the serial correlation for the physical variables we have studied. In other industrial processes, the analysis could result in more or fewer modes being needed
15
20
25
30
35
45
50
55
60
65
6 to accurately construct the functional behavior of a com posite curve. Therefore, the number of modes used is a variable which is iterated to minimize the degree of non white noise for any given application. As noted in FIG. 8A a variety of noise tests are applied in order to remove serially correlated noise. The reconstruction of X, uses the general form of Eqn.
(12), where the coe?icients and frequencies employed are those associated with the eight highest PSD values. This yields a Fourier composite curve (see end of ?owchart in FIG. 8A) with essentially the same correlation structure and the same mean as Y,. Finally, we generate a discrete residual function R, by dilferencing corresponding values of Y, and X,. This residual function, which is substantially devoid of serially correlated contamination, is then processed with the SPRT technique described hereinbefore.
In a speci?c example application of the above referenced methodology, certain variables were monitored from the Argonne National Laboratory reactor EBR-II. In particular, EBR-ll reactor coolant pumps (RCPs) and delayed neutron (DN) monitoring systems were tested continuously to dem onstrate the power and utility of the invention. The RCP and DN systems were chosen for initial application of the approach because SPRT-based techniques have already been under development for both the systems. All data used in this investigation were recorded during full-power, steady state operation at EBR-II. The data have been digitized at a 2-per~second sampling rate using 214 (16,384) observations for each signal of interest.
FIGS. 1-3 illustrate data associated with the preferred spectral ?ltering approach as applied to the EBR-II primary pump power signal, which measures the power (in kW) needed to operate the pump. The basic procedure of FIG. 8 was then followed in the analysis. FIG. 1 shows 136 minutes of the original signal as it was digitized at the 2-Hz sampling rate. FIG. 2 shows a Fourier composite constructed from the eight most prominent harmonics identi?ed in the original signal. The residual function, obtained by subtracting the Fourier composite curve from the raw data, is shown in FIG. 3. Periodograms of the raw signal and the residual function have been computed and are plotted in FIG. 4. Note the presence of eight depressions in the periodograrn of the residual function in FIG. 4B, corresponding to the most prominent periodicities in the original, un?ltered data. His~ tograms computed from the raw signal and the residual function are plotted in FIG. 5. For each histogram shown we have superimposed a Gaussian curve (solid line) computed from a purely Gaussian distribution having the same mean and variance. Comparison of FIG. 5A and 5B provide a clear demonstration of the effectiveness of the spectral ?ltering in reducing asymmetry in the histogram. Quantitatively, this decreased asymmetry is re?ected in a decrease in the skew ness (or third moment of the noise) from 0.15 (raw signal) to 0.10 (residual function).
It should be noted here that selective spectral ?ltering, which we have designed to reduce the consequences of serial correlation in our sequential testing scheme, does not require that the degree of nonnormality in the data will also be reduced. For many of the signals we have investigated at EBR-II, the reduction in serial correlation is, however, accompanied by a reduction in the absolute value of the skewness for the residual function. To quantitatively evaluate the improvement in whiteness
effected by the spectral ?ltering method, we employ the conventional Fisher Kappa white noise test. For each time series we compute the Fisher Kappa statistic from the de?ning equation t,01000

5,459,675 7
where 1((nk) is the PSD function (see Eq. 14) at discrete frequencies (11k, and 1(L) signi?es the largest PSD ordinate identi?ed in the stationary time series. The Kappa statistic is the ratio of the largest PSD ordinate
for the signal to the average ordinate for a PSD computed from a signal contaminated with pure white noise. For EBR-II the power signal for the pump used in the present example has a K of 1940 and 68.7 for the raw signal and the residual function, respectively. Thus, we can say that the spectral ?ltering procedure has reduced the degree of non whiteness in the signal 'by a factor of 28. Strictly speaking, the residual function is still not a pure white noise process. The 95% critical value for Kappa for a time series with 214 observations is 12.6. This means that only for computed Kappa statistics lower than 12.6 could we accept the null hypothesis that the signal is contaminated by pure white noise. The fact that our residual function is not purely white is reasonable on a physical basis because the complex interplay of mechanisms that in?uence the stochastic com ponents of a physical process would not be expected to have a purely white correlation structure. The important point, however, is that the reduction in nonwhiteness effected by the spectral ?ltering procedure using only the highest eight harmonics in the raw signal has been found'to preserve the pre-speci?ed false alarm and missed alarm probabilities in the SPRT sequential testing procedure (see below). Table I summarizes the computed Fisher Kappa statistics for thir teen EBR-H plant signals that are used in the subject surveillance systems. In every case the table shows a sub stantial improvement in signal whiteness. The complete SPRT technique integrates the spectral
decomposition and ?ltering process steps described herein before with the known SPRT binary hypothesis procedure. The process can be illustratively demonstrated by applica tion of the SPRT technique to two redundant delayed neu tron detectors (designated AND A and DND B) whose signals were archived during long-term normal (i.e., unde graded) operation with a steady DN source in EBR-II. For demonstration purposes a SPRT was designed with a false alarm rate, on, of 0.01. Although this value is higher than we would designate for a production surveillance system, it gives a reasonable frequency of false alarms so that asymp totic values of ot can be obtained with only tens of thousands of discrete observations. According to the theory of the SPRT technique, it can be easily proved that for pure white noise (such as Gaussian), independently distributed pro cesses, or provides an upper bound to the probability (per observation interval) of obtaining a false alarm—~i.e., obtain ing a “data disturbance” annunciation when, in fact, the signals under surveillance are undegraded.
FIGS. 6 and 7 illustrate sequences of SPRT results for raw DND signals and for spectrally-whitened DND signals, respectively. In FIGS. 6A and 6B, and 7A and 7B, respec~ tively, are shown the DN signals from detectors DND-A and DND-B. The steady-state values of the signals have been normalized to zero.
TABLE I
Effectiveness of Spectral Filtering for Measured Plant Signals
Fisher Kappa Test Statistic (N = 16,384)
Plant Variable I.D. Raw Signal Residual Function
Pump 1 Power 1940 68.7 Pump 2 Power 366 52.2
20
25
30
40
45
50
55
60
8
TABLE I-continued
Effectiveness of Spectral Filtering for Measured Plant Signals
Fisher Kappa Test Statistic (N = 16,384)
Plant Variable 1.D. Raw Signal Residual Function
Pump 1 Speed 181 25.6 Pump 2 Speed 299 30.9 Pump 1 Radial Vibr (top) 123 67.7 Pump 2 Radial Vibr (top) 155 65.4 Pump 1 Radial Vibr (bottom) 1520 290.0 Pump 2 Radial Vibr (bottom) 1694 80.1 DN Monitor A 96 39.4 DN Monitor B 81 44.9 DN Detector 1 86 36.0 DN Detector 2 149 44.1 DN Detector 3 13 8.2
Normalization to adjust for differences in calibration factor or viewing geometry for redundant sensors does not affect the operability of the SPRT. FIGS. 6C and 7C in each ?gure show point wise differences of signals DND-A and DND-B. It is this difference function that is input to the SPRT technique. Output from the SPRT method is shown for a 250-second segment in FIGS. 6D and 7D.
Interpretation of the SPRT output in FIGS. 6D and 7D is as follows: When the SPRT index reaches a lower threshold, A, one can conclude with a 99% con?dence factor that there is no degradation in the sensors. For this demonstration A is equal to 4.60, which corresponds to false-alarm and missed alarrn probabilities of 0.01. As FIGS. 6D and 7D illustrate, each time the SPRT output data reaches A, it is reset to zero and the surveillance continues.
If the SPRT index drifts in the positive direction and exceeds a positive threshold, B, of +4.60, then it can be concluded with a 99% con?dence factor that there is deg radation in at least one of tile sensors. Any triggers of the positive threshold are signi?ed with diamond symbols in FIGS. 6D and 7D. In this case, since we can certify that tile detectors were functioning properly during the time period our signals were being archived, any triggers of the positive threshold are false alarms.
If we extend su?iciently the surveillance experiment illustrated in FIG. 6D, we can get an asymptotic estimate of the false alarm probability or. We have performed this exercise using l000-observation windows, tracking the fre quency of false alarm trips in each window, then repeating the procedure for a total of sixteen independent windows to get an estimate of the variance on this procedure for evalu ating or. The resulting false-alarm frequency for the raw, un?ltered, signals is ot=0.07330 with a variance of 0.000075. The very small variance shows that there would be only a negligible improvement in our estimate by extending the experiment to longer data streams. This value of or is signi?cantly higher than the design value of ot=0.01, and illustrates the danger of blindly applying a SPRT test tech nique to signals that may be contaminated by excessive serial correlation. The data output shown in FIG. 7D employs the complete
SPRT technique shown schematically in FIG. 8. When we repeat the foregoing exercise using 16 independent 1000 observation windows, we obtain an asymptotic cumulative false-alarm frequency of 0.009142 with a variance of 0.000036. This is less than (i.e., more conservative than) the design value of ot=0.01, as desired.
It will be recalled from the description hereinbefore regarding one preferred embodiment, we have used the eight

5,459,675
most prominent harmonics in the spectral ?ltration stage of the SPRT technique. By repeating the foregoing empirical procedure for evaluating the asymptotic values of or, we have found that eight modes are su?icient for the input variables shown in Table I. Furthermore, by simulating subtle degradation in individual signals, we have found that the presence of serial correlation in raw signals gives rise to excessive missed-alarm probabilities as well. In this case spectral whitening is equally effective in ensuring that - pre-speci?ed missed-alarm probabilities are not exceeded using the SPRT technique
In another different form of the invention, it is not necessary to have two sensor signals to form a difference function. One sensor can provide a real signal characteristic of an ongoing process and a record arti?cial signal can be generated to allow formation of a difference function. Tech niques such as an auto regressive moving average (ARMA) methodology can be used to provide the appropriate signal, such as a DC level signal, a cyclic signal or other predictable signal. Such an ARMA method is a well-known procedure for generating arti?cial signal values, and this method can even be used to learn the particular cyclic nature of a process being monitored enabling construction of the arti?cial sig nal. The two signals, one a real sensor signal and the other an
arti?cial signal, can thus be used in the same manner as described hereinbefore for two real sensor signals. The difference function Y is then formed, transformations per formed and a residual function is determined which is free of serially correlated noise.
Fourier techniques are very effective in achieving a whit ened signal for analysis, but there are other means to achieve substantially the same results using a different analytical methodology. For example, ?ltration of serial correlation can be accomplished by using the autoregressive moving average (ARMA) method. This ARMA technique estimates the speci?c correlation structure existing between sensor points of an industrial process and utilizes this correlation estimate to effectively ?lter the data sample being evaluated. A technique has therefore been devised which integrates
frequency-domain ?ltering with sequential testing method ology to provide a solution to a problem that is endemic to industrial signal surveillance. The subject invention particu larly allows sensing slow degradation that evolves over a long time period (gradual decalibration bias in a sensor, appearance of a new radiation source in the presence of a noisy background signal, wear out or buildup of a radial rub in rotating machinery, etc. ). The system thus can alert the operator of the incipience or onset of the disturbance long before it would be apparent to visual inspection of strip chart or CRT signal traces, and well before conventional threshold limit checks would be tripped. This permits the operator to terminate, modify or avoid events that might otherwise challenge technical speci?cation guidelines or availability goals. Thus, in many cases the operator can schedule cor rective actions (sensor replacement or recalibration; com ponent adjustment, alignment, or rebalancing; etc.) to be performed during a scheduled system outage.
Another important feature of the technique which distin guishes it from conventional methods is the built-in quan titative false-alarm and missed-alarm probabilities. This is quite important in the context of high-risk industrial pro cesses and applications. The invention makes it possible to apply formal reliability analysis methods to an overall system comprising a network of interacting SPRT modules that are simultaneously monitoring a variety of plan vari ables. This amenability to formal reliability analysis meth
2O
25
30
35
40
45
50
55
60
65
10 odology will, for example, greatly enhance the process of granting approval for nuclear-plant applications of the invention, a system that can potentially save a utility mil lions of dollars per year per reactor.
While preferred embodiments of the invention have been shown and described, it will be clear to those skilled in the art that various changes and modi?cations can be made without departing from the invention in its broader aspects as set forth in the claims provided hereinafter. What is claimed is: 1. A method of testing at least one of an industrial process
and at least a ?rst and second sensor for determining fault conditions therein, comprising the steps of:
operating the at least ?rst and second sensor to redun dantly detect at least one physical variable of the industrial process to provide a ?rst signal from said ?rst sensor and a second signal from said second sensor, each said signal being characteristic of the one physical variable;
obtaining a difference function characteristic of the arith metic difference pairwise between said ?rst signal and said second signal at each of a plurality of different times of sensing the one physical variable;
obtaining a frequency domain transformation of said ?rst difference function to procure Fourier coe?icients cor responding to Fourier frequencies;
generating a composite function over time domain using the Fourier coe?icients;
obtaining a residual function over time by determining the arithmetic difference between the difference function and the composite function, the residual function hav ing reduced serially correlated noise;
operating on the residual function using computer means for performing a statistical analysis technique to deter mine whether an alarm condition is present in at least one of the industrial process and the at least ?rst and second sensor, the residual function including white noise characteristics of an uncorrelated function of reduced skewness relative to the difference function and being input to the statistical analysis technique; and
said at least ?rst and second sensor providing alarm information to an operator of the industrial process allowing modi?cation of at least one of the industrial process and said at least ?rst and second sensor when an alarm condition is detected.
2. The method described is claim 1 wherein said computer means comprises an arti?cial intelligence system.
3. The method as de?ned in claim 1 wherein the residual function further comprises reduced Markov dependent noise.
4. The method as de?ned in claim 1 wherein the industrial process comprises at least one of a chemical process, a mechanical process and an electrical operational process.
5. The method as de?ned in claim 1 wherein the step of obtaining Fourier coe?icients comprise iteratively determin ing the minimum number of Fourier harmonics able to generate the composite function,
6. The method as de?ned in claim 1 further including at least one of the steps of modifying the industrial process or changing the sensor responsive to the alarm condition.
7. A method of testing at least one of an industrial process and a sensor for determining fault conditions therein, com prising the steps of:
operating at least one sensor to detect at least one physical variable of the industrial process to provide a real signal from said one sensor;

5,459,675 11
generating an arti?cial signal characteristic of the one physical variable;
obtaining a difference function characteristic of the dif ference pairwise between said real signal and said arti?cial signal at each of a plurality of diiferent times of sensing the one physical variable;
obtaining a frequency domain transformation of said difference function;
generating a composite function over a time domain; obtaining a residual function over time by determining the
dilference between the difference function and the composite function;
operating on the residual function using a computer means for performing a statistical analysis technique to determine whether an alarm condition is present in at least one of the industrial process and the at lest one sensor, the residual function including white noise characteristics of an uncorrelated signal of reduced skewness relative to the difference function and being input to the statistical analysis technique; and
said at least one sensor providing alarm information to an operator of the industrial process allowing modi?cation of at least one of the industrial process and the at least one sensor when an alarm condition is detected.
8. The method as de?ned in claim 7 wherein the step of obtaining a frequency domain transformation comprises performing a Fourier transformation.
9. The method as de?ned in claim 7 wherein the steps of obtaining a composite function over time comprises per forming an auto regressive moving average analysis.
10. The method as de?ned in claim 7 further including the step of determining a difference function for both the arti ?cial signal and the real signal, as well as a separate pair of real signals.
11. The method as de?ned in claim 7 wherein the residual function further comprises reduced Markov dependent noise.
12. The method as de?ned in claim 8 wherein the step of obtaining a frequency domain transformation comprises obtaining Fourier coef?cients iteratively to determine the minimum number of Fourier harmonics able to generate the composite function.
13. A system for testing at least one of an industrial process and a sensor for determining a fault condition therein, comprising:
at least a ?rst sensor to detect at least one physical variable of the industrial process to provide a real signal from said ?rst sensor;
?rst means for generating a second signal for comparison with said real signal from said ?rst sensor;
second means for determining a difference function char acteristic of the arithmetic difference pairwise between said real signal and said second signal at each of a plurality of different times of sensing the one physical variable;
third means for obtaining a residual function over time by means for determining the arithmetic difference between the difference function and the composite function, the residual function including white noise characteristics of an uncorrelated signal of reduced skewness;
fourth means for operating on the residual function including a computer means for performing a statistical analysis technique and for determining whether an alarm condition is present in at least one of the indus
20
25
30
35
40
45
50
55
60
65
12 trial process and the at least ?rst sensor and with said second means, said third means, and said fourth means cooperatively providing a function comprised of said white noise characteristics of uncorrelated signal of reduced skewness relative to the difference function as an input to the statistical analysis technique; and
means for providing information allowing modi?cation of at least one of the industrial process and the at least ?rst sensor when an alarm condition is detected.
14. The system as de?ned in claim 13 ?rrther including means for obtaining a frequency domain transformation of said difference function.
15. The system as de?ned in claim 13 wherein said computer means comprises an arti?cial intelligence system.
16. The system as de?ned in claim 13 wherein said means for generating a second signal comprises computer means for executing a computer program.
17. The system as de?ned in claim 16 wherein the computer program includes an autoregressive moving aver age procedure.
18. The system as de?ned in claim 13 wherein the system includes at least one pair of sensors for detecting each of the physical variables.
19. The system as de?ned in claim 13 wherein said computer means executes a computer program including a statistical probability ratio test on the residual function.
20. The system as de?ned in claim 13 further including means for changing at least one of the industrial process and substituting another sensor for a defective sensor.
21. A method of testing at least one of an industrial process and at least a ?rst and second sensor for determining fault conditions therein, comprising the steps of:
operating the at least ?rst and second sensor to redun dantly detect at least one physical variable of the industrial process to provide a ?rst signal from said ?rst sensor and a second signal from said second sensor, each said signal being characteristic of the one physical variable;
obtaining a di?‘erence function characteristic of the arith metic difference pairwise between said ?rst signal and said second signal at each of a plurality of different times of sensing the one physical variable;
obtaining a frequency domain transformation of said ?rst difference function to procure Fourier coe?icients cor responding to Fourier frequencies;
generating a composite function over time domain using the Fourier coe?icients;
obtaining a residual function over time by determining the arithmetic diiference between the difference function and the composite function, the residual function including white noise characteristics of an uncorrelated function of reduced skewness relative to the difference function;
operating on the residual function using computer means for performing a statistical analysis technique to deter mine whether an alarm condition is present in at least one of the industrial process and the at least ?rst and second sensor; and
said at least a ?rst and second sensor providing alarm information to an operator of the industrial process allowing modi?cation of at least one of the industrial process and the at least ?rst and second sensor when an alarm condition is detected.
22. A method of testing at least one of an industrial process and at least one sensor for determining fault condi tions therein, comprising the steps of:

5,459,675 13
operating the at least one sensor to detect at least one physical variable of the industrial process to provide a real signal from said at least one sensor;
generating an arti?cial signal characteristic of the one physical variable;
obtaining a difference function characteristic of the dif ference pairwise between said real signal and said arti?cial signal at each of a plurality of different times of sensing the one physical variable;
obtaining a frequency domain transformation of said difference function;
generating a composite function over a time domain; obtaining a residual function over time by determining the
difference between the difference function and the
10
14 composite function, the residual function compn'sing white noise characteristics of an uncorrelated signal of reduced skewness relative to the di?erence function;
operating on the residual function using a computer means for performing a statistical analysis technique to determine whether an alann condition is present in at least one of the industrial process and the at least one sensor; and
said at least one sensor providing alarm information to an operator of the industrial process allowing modi?cation of at least one of the industrial process and the at least one sensor when an alarm condition is detected.

UNITED STATES PATENT AND TRADEMARK OFFICE
CERTIFICATE OF CORRECTION
PATENT NO. : 5 , 459 , 675
DATED I Oct. 17, 1995
lNVENTOR(S) : Kenneth C. Gross, et al
It is certi?ed that error appears in the above~indenti?ed patent and that said Letters Patent is hereby corrected as shown below:
Col. 1, Line 64, cancel "forage" and insert --formed-;
Col. 3, Line 5, before the word procedure, insert
--hereto covering the SPRT--;
Col. 4, Line 59, cancel "includes," and insert --include--;
Col. 6, Line 67, cancel "t,01000" and after the word equation, insert
N -l
K = t% zltwkn 1(L) (15) k=l
Col. 7, Line 36, cancel "AND" and insert -DND-;
Col. 8, Line 37, cancel "tile" and insert --the--;
Col. 8, Line 39, cancel "tile" and insert --the--;
Col. 10, Line 47 (Appln. Pg. 11 Line 26), cancel "is" and insert --in--;
Col. 10, Line 58 (Appln. Pg. 16, Line 8), cancel "," and insert --,--.
Col. 11, Line 17, cancel "lest" and insert —-least—;
C01. 12,L1ne 60, cancel "a". d and 86316 d this
Thirteenth Day of August, 1996
Ami.- [iwq W BRUCE LEHMAN ‘
AtIESling O?cer Commissioner of Palenrs and Trademarks‘