system appendpdf cover-forpdf - tspace repository: … · 60 is transferred to soil in the form of...
TRANSCRIPT

Draft
Estimating net climate impacts of timber production and
utilization in fossil-fuel intensive material and energy substitution
Journal: Canadian Journal of Forest Research
Manuscript ID cjfr-2016-0525.R1
Manuscript Type: Article
Date Submitted by the Author: 21-Mar-2017
Complete List of Authors: Alam, Ashraful; University of Eastern Finland, Faculty of Science and
Forestry Strandman, Harri; University of Eastern Finland, Forest Kellomäki, Seppo; University of Eastern Finland, Joensuu Campus, School of Forest Sciences, Faculty of Science and Forestry Kilpeläinen, Antti; University of Eastern Finland, School of Forest Sciences, Faculty of Science and Forestry
Keyword: Forest management, life cycle assessment, substitution, timber, materials
Please Select from this Special Issues list if applicable:
N/A
https://mc06.manuscriptcentral.com/cjfr-pubs
Canadian Journal of Forest Research

Draft
1
Title 1
2
Estimating net climate impacts of timber production and utilization in fossil-fuel 3
intensive material and energy substitution 4
5
*Ashraful Alam, Harri Strandman, Seppo Kellomäki and Antti Kilpeläinen 6
Address: 7
University of Eastern Finland, Faculty of Science and Forestry, School of Forest 8
Sciences, P.O. Box 111, FI-80101 Joensuu, Finland 9
10
*Corresponding author: 11
Name: Ashraful Alam 12
Address: University of Eastern Finland, Faculty of Science and Forestry, School of 13
Forest Sciences, P.O. Box 111, FI-80101 Joensuu, Finland 14
E-mail: [email protected]; Tel. +358 40 039 2628; Telefax: +358 294 457 316 15
16
Co-author’s e-mail addresses: 17
[email protected]; [email protected]; [email protected] 18
19
20
21
22
23
24
25
Page 1 of 45
https://mc06.manuscriptcentral.com/cjfr-pubs
Canadian Journal of Forest Research
Draft
2
Abstract 26
We utilized an ecosystem model and life cycle assessment tool for studying carbon 27
flows between the ecosystem, technosystem and atmosphere for scenarios utilizing 28
forest biomass (bio-system) against fossil-fuel intensive materials (fossil-system). The 29
net climate impacts were studied for a Norway spruce (Picea abies (L.) Karst.) stand 30
over two consecutive rotation periods (2x80 years) in the boreal conditions in central 31
Finland (62˚N, 29˚E). The effects of alternative forest management on the carbon 32
dynamics in the bio-system were studied in comparison with the fossil-system, by 33
using an unmanaged and baseline thinning regime. The results showed that the bio-34
system produced carbon benefits compared to the similar system with the use of fossil-35
fuel intensive materials and energy. The unmanaged stand stored the highest amount of 36
carbon and retained carbon the longest when solely the ecosystem was considered. 37
Studying the ecosystem and the technosystem together, the bio-system was found 38
effective in storing and increasing the residence of carbon with or without changing the 39
life span of biomass-based products. We found that the increase of the life span of 40
biomass-based products could reduce emissions up to 0.28 t CO2.ha-1.year-1 depending 41
on the management regimes over the study period. The increased stocking regimes 42
could increase negative net climate impact by 47% over the study period, compared to 43
the use of baseline thinning in bio-system. The proper climate mitigation strategies 44
should consider the benefits from forest management and forest biomass in storing 45
carbon into both the ecosystem and technosystem. 46
47
Key words: Forest management, life cycle assessment, materials, substitution, timber, 48
net climate impact. 49
50
Page 2 of 45
https://mc06.manuscriptcentral.com/cjfr-pubs
Canadian Journal of Forest Research

Draft
3
1. Introduction 51
Forests and forest biomass offer several ways to mitigate climate change, for example 52
by (i) increasing the carbon density in existing forests (i.e., ecosystem) and (ii) 53
increasing the use of biomass-based products in order to increase both carbon stored in 54
products (i.e., technosystem) and substitution of fossil carbon. Thus, the substitution of 55
fossil-fuel intensive materials and energy with renewable forest biomass is a feasible 56
option in limiting the emissions of carbon dioxide (CO2). In the forest ecosystem, 57
atmospheric carbon is sequestrated by the growing trees, and the carbon stored in 58
biomass is released back to the atmosphere in the detritus cycle, where carbon in trees 59
is transferred to soil in the form of litter for decay. Similarly, carbon in forest biomass 60
used in the technosystem for materials and energy is emitted into the atmosphere 61
through the combustion and degradation in time perspective (i.e., residence time) 62
specific for different materials (Gustavsson et al. 2006; Kilpeläinen et al. 2013). The 63
amount of CO2 in the atmosphere is, therefore, affected through a balance between 64
uptake and emission processes occurring in both the ecosystem and technosystem (e.g., 65
Alam et al. 2013; Sathre et al. 2013; Kilpeläinen et al. 2013). 66
The potential of the forest ecosystem to sequester and store carbon depends on 67
the tree species, the growing conditions, and management controlling the overall 68
ecosystem dynamics (Dixon et al. 1994; Jandla et al. 2007; Alam et al. 2013; Routa et 69
al. 2013). The carbon density in the ecosystem is affected by the stock building into 70
growing trees and soil as related to the management. The amount of carbon stored in 71
forest ecosystems further depends on the frequency and timing of thinning. The harvest 72
(intensity) affects the yield and share of timber (i.e., pulpwood and sawlogs), thus 73
affecting the potential role of forest biomass in substituting fossil intensive materials 74
(Kilpeläinen et al. 2013; Smyth et al. 2014). 75
Page 3 of 45
https://mc06.manuscriptcentral.com/cjfr-pubs
Canadian Journal of Forest Research

Draft
4
In general, the carbon storage in the forest ecosystem is largest in the 76
unmanaged mature or old-growth forests (e.g., Klein et al. 2013), thus giving an 77
ultimate reference to identify the management and harvest effect on the carbon 78
sequestration in the forest ecosystem. Carbon balance in unmanaged forests reach to a 79
stable phase (at mature stage) between the carbon uptake in net production and carbon 80
emissions in heterotrophic production (heterotrophic respiration) from decaying litter 81
and humus. In such forests, net production refers to the ingrowth of seedlings and their 82
growth in canopy gaps created by the death of trees in the long-term dynamics between 83
regeneration, growth, and mortality. Until now, the carbon dynamics in mature 84
unmanaged forests is poorly known, but Luyssaert et al. (2008), for example, claim 85
that “old-growth forests with tree losses do not necessarily become carbon sources, as 86
has been observed in even-aged plantations”. 87
When evaluating climate impact for timber production and utilization, it is 88
important to consider factors such as net sequestration, degradation/combustion and 89
substitution effects of forest products as integrated. In this respect, carbon residence 90
time is a useful way to track and identify carbon bound in forest growth (Kellomäki et 91
al. 2013), but how long will carbon remain in the ecosystem and related technosystem 92
depend on the management of the forest ecosystem and the properties of materials in 93
use. Substituted materials, timing of substitution and life span of the biomass products 94
also affect climate impact calculation. Most studies are concentrated separately for 95
forest management (e.g., Klein et al. 2013) and biomass utilization (Buchanan et al. 96
1999, Hammond et al. 2008), and usually do not cover the carbon sequestration 97
combined with substitution effects of biomass under proper management. 98
In this context, we investigated the net climate impacts of the production and 99
use of timber in substituting fossil-fuel intensive materials and fossil energy. This was 100
Page 4 of 45
https://mc06.manuscriptcentral.com/cjfr-pubs
Canadian Journal of Forest Research

Draft
5
done by comparing annual net CO2 exchanges between the forest based bio-system and 101
fossil-system. The model-based analysis is subjected to a Norway spruce (Picea abies 102
(L.) Karst.) stand growing in a medium fertile site (Myrtillus site type) in the boreal 103
conditions in central Finland (62˚N, 29˚E) over two consecutive rotation periods. The 104
management regimes of the bio-system included the baseline thinning (i.e., biomass 105
was harvested and utilized following the current recommendation (Äijälä et al. 2014)), 106
thinning with increased stocking (basal area through rotation 20% higher than in 107
baseline thinning) and decreased stocking (basal area 20% lower than in the baseline 108
thinning). In the reference fossil-system, baseline thinning and unmanaged regimes 109
were used as management regimes. 110
111
2. Methods, calculations and sensitivity analysis 112
2.1. Study approach 113
System boundaries and outlines of calculations 114
Bio-system included the forest production and the utilization chain for one hectare of 115
forest land (Figure 1). Two consecutive rotations over 80 years were used. At the 116
beginning of simulation, a stand with 2500 seedlings per hectare was established. 117
During the rotation, two to three thinnings were done before the final felling and the 118
second rotation followed the same management procedure as used in the first rotation. 119
Technosystem, included manufacturing, utilization of biomass products (pulp, sawn 120
wood) and waste wood from milling processes for substituting fossil-fuel intensive 121
materials and energy (plastic, concrete or steel, coal), and end-use of products. 122
123
In the analysis, the fossil- and bio-systems were compared, with the focus on (Figure 124
1): 125
Page 5 of 45
https://mc06.manuscriptcentral.com/cjfr-pubs
Canadian Journal of Forest Research
Draft
6
(i) the substitution and climate impacts including dynamics of carbon flows in 126
ecosystems; 127
(ii) carbon balance in the ecosystem and technosystem; 128
(iii) retention of carbon in the ecosystem and technosystem; and 129
(iv) performance of carbon in the ecosystem and technosystem under varying 130
management regimes. 131
132
Place for Figure 1. 133
134
Both systems provided the same energy or material services. Therefore, the 135
substitution calculation for each category of forest products were used: (i) sawn wood 136
materials substituted concrete or steel with their equal share (for a square meter of wall 137
or apartment building with same thermal transmittance), (ii) pulp materials substituted 138
polyethylene (e.g., for disposable plastic items assuming that both are similar in 139
weight), and (iii) waste wood items substituted coal (for energy generation in same 140
unit, MWh). Based on this classification, we first calculated the embodied emissions 141
for each product (Table 1). Thereafter, this was scaled to our functional unit (i.e., tCO2 142
emissions per ha of forest land). The scaling factor was specific for different materials 143
and fuel, and it ranged from 0.41 in coal to 3.82 in concrete (Sathre and O’Connor 144
2010; Cavalli 2015). 145
In the calculations, wood density of 400 kg m-3 and carbon content of 50% 146
were used for the dry wood (Lamlom and Savidge, 2003; Saranpää 2003). In using 147
biomass, 50% of the harvested pulpwood and sawlogs were converted into useable 148
pulp and sawn wood products (the rest being waste wood). The embodied carbon 149
emissions in materials (products) include all the emissions in different phases, from 150
Page 6 of 45
https://mc06.manuscriptcentral.com/cjfr-pubs
Canadian Journal of Forest Research

Draft
7
producing and providing raw material and manufacturing raw material to materials in 151
terms of carbon dioxide (CO2). In estimating embodied emissions, the productivity and 152
fuel consumption of necessary machines are based on the available literature (Table 1). 153
With regard to reabsorption of CO2 during the life span of concrete, 8% of that emitted 154
in the production was re-fixed by carbonation (Gajda 2001; Gustavsson et al. 2006; 155
Dodoo et al. 2009). 156
157
Place for Table 1. 158
159
Net climate impacts (I) 160
The difference in net CO2 exchange between fossil-system (IFOS) and bio-system (IBIO) 161
gives an annual value indicating the net climate impact, I (Equation 1) (Kilpeläinen et 162
al. 2011; 2013; 2015). The value of the net climate impact can be positive or negative. 163
The negative net climate impact indicates that the bio-system is producing lower 164
emissions compared to its corresponding fossil-system, while a positive impact means 165
that produced emissions are higher for the bio-system. 166
167
Net climate impact (I) = Bio-system (IBIO) – Fossil-system (IFOS) (1) 168
169
To calculate the net climate impacts (I), we estimated the annual net CO2 exchange for 170
both bio-system (IBIO) and fossil-system (IFOS), including the flow of carbon in an 171
ecosystem (NEE) and technosystem (NTE-B or NTE-F). The equations are provided in 172
Table 2 for bio- and fossil-system. 173
174
Place for Table 2. 175
Page 7 of 45
https://mc06.manuscriptcentral.com/cjfr-pubs
Canadian Journal of Forest Research

Draft
8
176
In the calculations, the flow of carbon to the forest ecosystem (sequestration of carbon 177
in biomass growth) and technosystem (sequestration of carbon in concrete) had 178
negative values, indicating the removal of carbon from the atmosphere and storing it in 179
the forest ecosystem and concrete. The values were positive for carbon flows back to 180
the atmosphere. 181
182
2.2 Computations for annual net CO2 exchange (IBIO and IFOS) 183
Net ecosystem CO2 exchange (NEE) for alternative and reference management 184
A gap-type forest ecosystem model (SIMA) (Kellomäki et al. 1992a, b; Kellomäki et 185
al. 2008) was used to calculate the net ecosystem CO2 exchange (NEE) (see equation 3, 186
6). The growth of trees in plantation or as established naturally is controlled by the 187
temperature conditions, the availability of light, soil water and nitrogen and the CO2 188
concentration in the atmosphere. The risk of trees to die in a given year is related to the 189
competition between trees reducing growth. Trees may further die randomly. Organic 190
matter in litter and dead trees ends up in the soil, and decays, releasing CO2 and 191
nitrogen. Management controls the ecosystem dynamics including regeneration 192
(natural regeneration, planting of given species in a desired spacing), frequency and 193
intensity of thinning, and final felling at the end of selected rotation. For more details 194
of the model and its performance, see Kellomäki et al. (1992a, b); Kellomäki et al. 195
(2008); Routa et al. (2011). 196
The simulations were done for Norway spruce grown on a site of medium 197
fertility (Myrtillus site type (MT)) in the boreal conditions (central Finland, Joensuu 198
region: 62˚39΄N, 29˚37΄E, temperature sum 1150–1200 degree-days). The initial 199
condition of the simulation was a managed stand felled for planting before the start of 200
Page 8 of 45
https://mc06.manuscriptcentral.com/cjfr-pubs
Canadian Journal of Forest Research
Draft
9
the simulation. Similar initial conditions were used for alternative management 201
regimes, with 67 t mass.ha-1 of litter and humus on soil (Kellomäki et al. 2008). 202
Regardless of management options, the initial stand was an even-aged one, with the 203
diameter at the breast height of 2.5 cm. The stand density 2500 seedlings per hectare 204
was used in planting. 205
The simulations were extended over 160 years including two 80-year rotations, 206
which represented the same management. The management included the baseline 207
thinning (i.e., biomass was harvested and utilized following the current 208
recommendation (Äijälä et al. 2014)), thinning with increased stocking (basal area 209
through rotation 20% higher than in baseline thinning) and decreased stocking (basal 210
area 20% lower than in the baseline thinning). At the end of both 80-year periods, all 211
the timber (pulpwood and sawlogs) were removed in the final felling. 212
The same total period (160 years) and initial conditions were used in the 213
unmanaged stand excluding thinning and final felling, but natural regeneration was 214
allowed throughout the study period. In the simulations, the sequestration of carbon 215
(�seq) indicates annual growth of stems, branches, foliage, coarse and fine roots. The 216
decomposition of soil organic matter (�decomp) includes CO2 emissions from litter and 217
humus layer of the forest floor. The annual difference between sequestration and 218
emissions indicates the net ecosystem CO2 exchange (NEE). 219
220
Net technosystem CO2 exchange (NTE) 221
In the bio-system, net technosystem CO2 exchange (NTE-B) was calculated following 222
the Equations (4), including the carbon emitted in management, biomass harvest, 223
logistics and manufacturing (Cman) and the carbon emitted from the use of biomass-224
based products (Cbio). The biomass from each thinning and final felling was assorted 225
Page 9 of 45
https://mc06.manuscriptcentral.com/cjfr-pubs
Canadian Journal of Forest Research

Draft
10
into energy biomass and timber. In converting timber for pulp and sawn wood, the 226
emissions represent heat and electricity needed in milling processes. First, the timber 227
was assorted into pulpwood and sawlogs; i.e., the diameter of stem part >17 cm 228
indicates sawlogs and the diameter 6.5–17 cm of stem part pulpwood. The rest of stem 229
< 6.5cm of diameter (stem top) remains in the forest ecosystem as branches, needles 230
and stump-root system. Thereafter, the pulpwood and sawlogs were converted into 231
usable form of pulp and sawn wood. The emissions from the use of biomass-based 232
products (Cbio) were calculated by applying Equation (8) adopted from Karjalainen et 233
al. (1994): 234
235
�� = � −�
��� �(8) 236
where PU is the fraction of products in use; a (120), b (5), d (120) are dimensionless 237
fixed parameters regardless of the product’s life span; c (year-1) is the life span of a 238
product. The c value is dependent on the utilized life span, e.g., from 0.65 for short-life 239
up to 0.0275 for long-life; and t (year) is time. The half-life values were used in such a 240
way that short-life corresponds to the use pulp and long-life was for sawn wood (Table 241
2). Carbon in waste wood originating from pulpwood and sawlogs is released 242
completely in the first year of their use. 243
244
In the fossil-system, the calculation of net technosystem CO2 exchange (NTE-F) 245
followed the Equation (7), where Cseq-con represents carbon sequestered in concrete and 246
Cfos is the carbon emitted from the manufacture and use of fossil-fuel intensive 247
materials and energy. The emissions of carbon from the use of fossil resources were 248
based on their life span and calculated following the Equation 8. For simplification, the 249
Page 10 of 45
https://mc06.manuscriptcentral.com/cjfr-pubs
Canadian Journal of Forest Research

Draft
11
life span of fossil-fuel intensive materials was assumed similar as in biomass based 250
products. 251
252
2.3 Retention and stocks of carbon in forest ecosystem and technosystem 253
During sequestration, carbon enters into the forest ecosystem and may retain there for 254
several decades depending, e.g., on frequency and intensity of thinning, rotation length 255
and the decomposition rate of litter and humus (Kellomäki et al. 2013). Similarly, the 256
carbon in biomass used in the technosystem may be retained from a year to several 257
decades depending on the timing of the harvest and the life span of the products. The 258
duration of carbon retention in the ecosystem or technosystem is referred to as the 259
residence time ( ) (Equation 9). The residence time is obtained by dividing the stock 260
of carbon (e.g., t CO2.ha-1) in the ecosystem or technosystem by the emission rate (q, 261
e.g., t CO2 ha-1.year-1) from a system: 262
263
264
(9) 265
266
Carbon stocks refer to the carbon in stems, branches, leaves and the stump-roots 267
system in growing trees, dead trees including decaying wood, and litter and humus in 268
the forest floor. In the simulation, the initial values of the humus layer was estimated 269
123 t CO2.ha-1, based on the amount of litter and humus related to the site type and 270
temperature sum (Kellomäki et al. 2008). Technosystem carbon stock refers to the 271
carbon bound in stem wood that was moved from the ecosystem to the technosystem 272
for utilization. 273
274
q
Stock
systemathroughflowcarbonofRate
carbonholdtosystemaofCapacity==τ
Page 11 of 45
https://mc06.manuscriptcentral.com/cjfr-pubs
Canadian Journal of Forest Research

Draft
12
2.4. Sensitivity analysis 275
Sensitivity analysis was done in order to assess the efficiency of carbon management in 276
the forest ecosystem and in the use of forest-based carbon in materials in substituting 277
fossil-fuel intensive materials. In the sensitivity analysis, the thinning intensity with 278
increasing/decreasing stocking in relation to baseline thinning regime indicated how 279
sensitive the net climate impact was to the management (Table 3), with changes in the 280
subsequent potential to replace fossil-fuel intensive materials in the technosystem. In 281
the technosystem, the sensitivity of net climate impacts were analyzed by changing the 282
share of waste wood and the life span of the products in use. In the reference situation, 283
the share of waste wood in pulping and sawing was 50% of the total timber used in 284
milling process (Sipi 2002). In both cases, the value of waste wood was reduced to 285
30% or increased to 70% (Table 3). 286
Furthermore, the life span of products based on pulp and sawn wood was 287
changed, applying the half-life approach, i.e., the year when half of the original mass 288
was lost in use under the changed degradation rate compared to the reference situation. 289
The reference life span for sawn wood was used based on the IPCC greenhouse gas 290
reporting for Finland (Statistics Finland 2015). The reference life span value used for 291
pulp was three times longer than that reported, assuming that pulp fibers are reused 5–7 292
times, with a 70% collection rate of original fibers (Finnish Forest Industries 2015). 293
294
Place for Table 3. 295
296
3. Results 297
3.1 Net ecosystem CO2 exchange (NEE) 298
Page 12 of 45
https://mc06.manuscriptcentral.com/cjfr-pubs
Canadian Journal of Forest Research
Draft
13
In general, CO2 emissions from ecosystem exceeded the sequestration in the very early 299
phase of the stand development (seedlings stage, < 10 years), resulting in the net CO2 300
increase in the atmosphere regardless of management (Figure 2). In the next phase 301
(10–60 years), the CO2 sequestration substantially exceeded the CO2 emission. This 302
also held for the mature phase (60–80 years) regardless of the management. Over the 303
whole simulation period (160-year), forests sequestered more carbon than released. 304
The mean net ecosystem CO2 exchange (NEE) ranged from -468 to -658 g CO2.m-305
2.year-1 during the simulation period. The sequestration was the largest under the 306
thinning with increased stocking. The sequestration exceeded substantially that under 307
the baseline thinning, and further under the thinning with decreased stocking. 308
Similarly, the increased stocking through rotations indicated an increasing time of 309
carbon residence in the ecosystem. 310
311
Place for Figure 2. 312
313
3.2 Carbon stocks in ecosystem and technosystem 314
Ecosystem carbon stocks 315
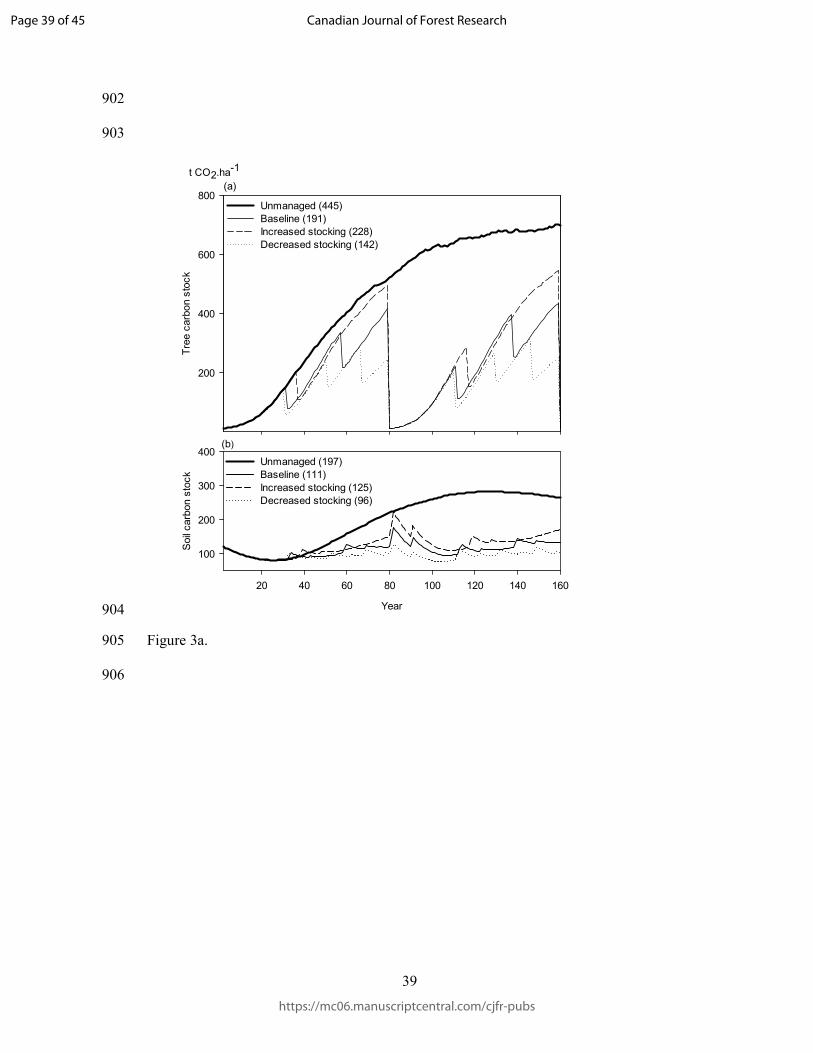
Over the 160-year simulation period, the average CO2 stocks in trees and soil were the 316
highest (445 and 197 t CO2.ha-1) in the stand without management, while under the 317
baseline thinning the average CO2 stock in trees was 191 and 111 t CO2.ha-1 in soil 318
(Figure 3a). Compared to baseline thinning, the increased stocking enhanced the 319
average ecosystem carbon stocks (both in tree and soil) by 17%, while the decreased 320
stocking reduced by 21% the average CO2 stock in the ecosystem. 321
322
Place for Figure 3a. 323
Page 13 of 45
https://mc06.manuscriptcentral.com/cjfr-pubs
Canadian Journal of Forest Research

Draft
14
324
Technosystem carbon stocks and emissions 325
The gross increase of carbon stocks (t CO2.ha-1) in cumulative values is shown in 326
Figure 3b (panel a). Over two rotation periods (160-year), the highest total carbon in 327
timber yield (734 t CO2.ha-1) was gained in baseline thinning. The corresponding value 328
in cubic meter was 1003 m3.ha-1. Compared to baseline thinning, the timber yield was 329
reduced by 11% under the thinning with decreased stocking, and 4% under the 330
increased stocking in thinning (Figure 3b). This was mainly due to the lower yield of 331
sawlogs, while the pulpwood yield increased by 3% and 10% compared to baseline 332
thinning for the corresponding management regimes. Under the thinning with 333
decreased stocking, the flows of CO2 to the technosystem started one year (year 31) 334
earlier than under the baseline thinning. Similarly, the carbon stock in the 335
technosystem started to accumulate five years later than under the baseline thinning, 336
when the thinning with increased stocking was used. Under no management, all of the 337
biomass were left in the ecosystem. 338
339
Place for Figure 3b. 340
341
Over the simulation period, the average carbon stocks in the technosystem were 39, 38, 342
33 t CO2.ha-1 under the baseline thinning, and under thinning with decreased stocking 343
and increased stocking, if the emissions from waste wood (Figure 3b, panel b) and 344
wood products (Figure 3b, panel c) were taken into account in the calculation. During 345
the first rotation, the highest average CO2 stocks in the technosystem were for the 346
management with decreased stocking (15 t CO2.ha-1) representing more frequent of 347
thinnings than the other management regimes. However, this was not the case for the 348
Page 14 of 45
https://mc06.manuscriptcentral.com/cjfr-pubs
Canadian Journal of Forest Research
Draft
15
second rotation, where carbon stocks decreased by 12 and 11% for increased stocking 349
and decreased stocking, respectively, compared to that under the baseline thinning. At 350
the end of the simulation period carbon stocks were 152, 115, 160 t CO2.ha-1 for 351
baseline thinning and the thinning with decreased and increased stocking, respectively. 352
353
3.3 Residence time of carbon in ecosystem and technosystem 354
The value of mean carbon residence time (year) varied among the management 355
regimes depending on the timing and intensity of thinning and the utilization of 356
biomass in the technosystem (Table 4). In both the first and second rotation, the mean 357
residence time of ecosystem carbon was the highest under no management, but it was 358
the lowest when carbon in the technosystem was added in the calculation. In the 359
ecosystem and technosystem together, the highest value was for management with the 360
baseline thinning (Table 4). 361
362
Place for Table 4. 363
364
In the ecosystem, the mean carbon residence time over the whole simulation period 365
increased by about 11% for management with increased stocking and decreased by 366
about 18% for decreased stocking compared to baseline thinning. In the technosystem, 367
the carbon residence time was the highest for the decreased stocking in the ecosystem 368
due to higher intensity of biomass flow from the ecosystem to the technosystem. 369
Compared to baseline thinning, the mean residence time of carbon in the technosystem 370
decreased by about 24% under the increased stocking in the ecosystem and increased 371
by about 4% under the decreased stocking in the ecosystem. 372
373
Page 15 of 45
https://mc06.manuscriptcentral.com/cjfr-pubs
Canadian Journal of Forest Research

Draft
16
3.4 Effects of forest management on carbon stocks and residence time - sensitivity 374
analysis 375
Comparing to the baseline management, the increased stocking increased carbon 376
stocks, carbon emissions and carbon residence time, while these values were reduced 377
under the decreased tree stocking. In the technosystem, the changes in the life span of 378
materials substantially affected the mean carbon stock and the mean residence 379
regardless of management regimes (Figure 4). The longer life span of pulp and sawn 380
products increased both carbon stocks (53-56%) and carbon residence time (103-381
124%), and decreased emissions (7-8%), compared to the reference life span in the 382
technosystem. The trend is the opposite in the case of using a shorter life span than in 383
the reference, meaning that carbon stocks and residence time were reduced upto 47 and 384
62% respectively, but slightly increased the technosystem emissions (upto 4%) 385
compared to the reference life span. 386
Similarly, the changes in the share of wood for different products and 387
processing waste (waste wood) clearly altered the carbon flow through the 388
technosystem. The increased share of wood for wood products from 50% to 70% in 389
total harvested biomass substantially increased the carbon stocks in the technosystem, 390
but did not affect carbon emissions or carbon residence time in the technosystem 391
(Figure 4). However, the decreased share of wood to 30% in the total harvested 392
biomass decreased carbon stocks, but did not affect emissions or residence time in the 393
technosystem. 394
395
Place for Figure 4. 396
397
3.5 Net CO2 exchange of the bio-system (IBIO) and fossil-system (IFOS) 398
Page 16 of 45
https://mc06.manuscriptcentral.com/cjfr-pubs
Canadian Journal of Forest Research

Draft
17
399
Figure 5 shows the annual cumulative net CO2 exchanges of the fossil-system (IFOS) 400
and bio-system (IBIO) and the values shown at the end of line corresponded the sum of 401
IBIO and IFOS values over the 160-year period. 402
Until year 20, both bio- and fossil-systems were a source of carbon due to a 403
higher decay rate of soil organic matter. The bio-system gained the substitution 404
benefits from the initiation of the first thinning regardless of the management regimes. 405
In the regimes using baseline and increased stocking, IBIO was always lower with 406
respect to that of IFOS (Figure 5, a, b). Under the decreased stocking regime, the IBIO did 407
not completely overtake the corresponding fossil-system (Figure 5, c). When the 408
unmanaged stand was used as a reference (Figure 5, d), the fossil-system benefitted 409
mainly from the higher rate of carbon sequestration until the unmanaged stand became 410
mature. Thereafter, the benefit decreased substantially as indicated by the sum of IBIO 411
and IFOS calculated for different components in bio-system and fossil-system (Figure 412
6). 413
414
Place for Figure 5. 415
416
Place for Figure 6. 417
418
3.6 Net climate impact of the bio-system 419
Difference in net CO2 exchange between bio-system and fossil-system (net climate 420
impact, I) and separately for ecosystem (net ecosystem impact) and technosystem (net 421
technosystem impact) part are shown in Figure 7. Net ecosystem impact was the 422
highest for the increased stocking benefiting the bio-system. The technosystem impact 423
Page 17 of 45
https://mc06.manuscriptcentral.com/cjfr-pubs
Canadian Journal of Forest Research

Draft
18
were always negative and bio-system gained benefits due to substitution. The net 424
climate impacts ranged from -2 to -332 t CO2.ha-1. The negative net climate impact 425
was the highest for management providing increased stocking, and the net climate 426
impact was near zero for the decreased stocking (Figure 7). 427
428
Place for Figure 7. 429
430
In Figure 8, the net climate impact is for the varying life span of products under 431
alternative management regimes. Clearly, the longer the life span, the higher the 432
negative net climate impact, with the greatest benefits obtained by management with 433
increased stocking. The effect of the life span was small during the first rotation (1–80 434
years), but it became larger when the temporal dimension was extended to 160 years. 435
On average, the net climate impacts ranged from 32 to -244 t CO2.ha-1 during the first 436
rotation, and from 18 to -371 t CO2.ha-1 for the whole study period (1–160 years), 437
depending on the management regime. 438
439
Place for Figure 8. 440
441
442
4. Discussion and conclusions 443
This study investigated the net climate impacts when forest biomass (bio-system) was 444
used to substitute fossil-fuel intensive materials and energy (fossil-system). The net 445
climate impact was calculated by comparing the net CO2 exchange between the fossil- 446
and the bio-system, where both the systems produced similar output in terms of 447
materials and energy. The net CO2 exchange included the emissions from production, 448
Page 18 of 45
https://mc06.manuscriptcentral.com/cjfr-pubs
Canadian Journal of Forest Research
Draft
19
combustion and utilization of the materials and fuels in combination with ecosystem 449
carbon dynamics (sequestration and emissions). Inclusion of ecosystem carbon 450
dynamics in the fossil-system enabled to account the net climate impacts for biomass 451
against alternative references (i.e., unmanaged and baseline) (Alam et al. 2013; 452
Kilpeläinen et al. 2013; Hoover et al. 2014; Skog et al. 2014; Røyne et al. 2016). 453
Again, alternative forest management used in the bio-system enabled to assess the 454
effects of forest management on the biomass production and their subsequent potential 455
for fossil-fuel intensive materials substitution (Lippke et al. 2011). Thus, our approach 456
made it possible to track down the entire carbon flows over the period studied, as they 457
are related to both the production and use of forest products against the use of fossil-458
fuel intensive materials with respect to substitution and climate change mitigation. 459
Carbon sequestration into ecosystem, carbon emissions from soil, and amount 460
of harvested biomass were simulated using a forest ecosystem model over two 461
consecutive rotations (2 x 80 years). This was done for a boreal Norway spruce stand 462
growing on medium fertile site (Myrtillus type) in eastern Finland (62˚39΄N, 29˚37΄E) 463
under varying forest management regimes. The effects of any natural disturbances 464
were excluded from the simulations, because natural disturbances, e.g., fire and snow, 465
have not been a major concern in managed forests and also because weather and 466
topography lack most features that could contribute to extreme fire risk, for example, 467
in the Finnish boreal conditions (e.g., Zeng et al. 2006; Tanskanen 2007). 468
Our simulation showed that ecosystem carbon stock was the highest in 469
unmanaged stand compared to that of managed forests. From the climate change 470
mitigation point of view, this may not be a feasible option since it is not possible for a 471
forest ecosystem to store unlimited mass of carbon (Karjalainen 1995). This is because 472
after the mature phase of stand development, forests reach an equilibrium between 473
Page 19 of 45
https://mc06.manuscriptcentral.com/cjfr-pubs
Canadian Journal of Forest Research

Draft
20
regeneration, growth, and mortality (e.g., Eriksson et al. 2007; Lundmark et al. 2014) 474
in the time perspective of 120 to 140 years in boreal conditions. In our case, the 475
equilibrium was reached even earlier between systems, when unmanaged regime was 476
used in the reference fossil-system, due to the combined effects of two reasons: 477
diminishing rate of carbon sequestration and the emissions from the use of fossil 478
materials. Temporal aspects, both the starting point and the duration of study periods, 479
was also crucial in net climate impact calculations. The reference fossil-system (with 480
unmanaged) overtook the corresponding net CO2 exchange in the bio-system (with 481
baseline thinning), which in turn, increased the negative net climate impacts in the bio-482
system. According to the results the unmanaged forests provided only limited 483
possibilities for climate change mitigation compared to the possibilities to store carbon 484
in wood based materials and to substitute materials and fuels in energy production. Our 485
results support earlier studies (Klein et al. 2013, Krug et al. 2012) and indicated that 486
drawing a system boundary excluding carbon storage and substitution effects of 487
harvested biomass may produce variable results as seen, for example in Naudts et al. 488
(2016). 489
When reference fossil-system (with unmanaged regime) were compared with 490
bio-system (with baseline thinning), the average avoided emissions over the study 491
period was estimated 0.38 tCO2.m-3 (avoided emissions per utilized m3 of timber). Our 492
value is lower compared to a range of 0.47 - 0.72 in earlier studies (Werner et al. 2010; 493
Lundmark et al. 2014; Braun et al. 2016). The variability in the results occurred due to 494
variations in system boundaries and assumptions made between these studies. Another 495
reason, may be even more important, is the use of consequential life cycle approach in 496
our analysis (i.e., difference in sequestration/emissions between alternative systems) 497
resulted a value lower to them. When baseline thinning was used in reference fossil-498
Page 20 of 45
https://mc06.manuscriptcentral.com/cjfr-pubs
Canadian Journal of Forest Research

Draft
21
system, the highest net climate benefits were gained for the bio-system that used the 499
increased stocking regime, while a decreased stocking regime appeared to give lower 500
net climate benefit than in the baseline. This is caused by a higher number of thinning 501
in decreased stocking regime compared to others, thus reduced the production potential 502
of forests and on-site carbon storage, especially during the last part of the rotation 503
(Liski et al. 2001; Kaipainen et al. 2004; Alam et al. 2012). 504
Our results showed that the decrease in carbon residence time in ecosystem 505
caused by extracting timber from forests could be compensated for by increasing 506
carbon stocks in the technosystem carbon pools. The highest mean carbon residence 507
time in the ecosystem was found under the unmanaged regime, while in the 508
technosystem it was the highest under the decreased stocking regime, because carbon 509
flow increased from the ecosystem to the technosystem in this regime due to increased 510
intensity and number of thinnings. Nevertheless, decreased stocking regime could not 511
increase the net climate impact mainly due to the fact that development of carbon stock 512
based on long-life products (i.e., sawn wood) was reduced in this regime unlike other 513
studied managed regimes. However, assessing the technosystem and the ecosystem 514
together, carbon residence time increased substantially in managed stands (Skog et al. 515
2014), mostly under the baseline thinning regime. If the temporal aspects are taken into 516
account, the climate benefits due to substitution started to gain after the first thinning 517
(time taken 31-37 year since stand establishment), which continued to increase over 518
time due to accumulated utilization of harvested biomass, in line with the studies 519
published earlier (see e.g., Sathre et al. 2013; Haus et al. 2014). However, the major 520
share of benefits was obtained mainly during the second rotation if the substitution 521
benefits gained during the first rotation were accumulated for the whole study period 522
(160-year). But, the benefits may be realized more quickly if the analysis were 523
Page 21 of 45
https://mc06.manuscriptcentral.com/cjfr-pubs
Canadian Journal of Forest Research
Draft
22
extended to a regional or national level with constant biomass supply and carbon 524
sequestration (Kilpeläinen et al. 2015). 525
Our analysis at stand level fits well the objective of the study since it could 526
follow the difference in carbon dynamics between the fossil- and the bio-system as 527
well as identify emissions those were sourced from the production phase of materials 528
to the phase until their end use. There can be used other materials from forest biomass 529
than the ones used in our study, but drawbacks to this are to define equivalent in 530
functionality for alternative materials replaced and lack of comparative studies that 531
include complete material information (Smyth et al. 2014). Our use of alternative 532
materials for sawn wood (in concrete and steel) and pulp (e.g., in disposable plastic 533
cups or packaging) seem reasonable (Hocking 1994; Sathre and O’Connor 2010; 534
Werner et al. 2010; Dahlgren et al. 2015), but an alternative use for pulp products can 535
be at the end of their life span replacing, for example fossil-fuel intensive energy (e.g., 536
coal). When replacing coal, additional substitution benefits are gained in the bio-537
system since emissions for pulp products are already counted earlier and at this point 538
of their use they can be assumed carbon neutral. Our sensitivity analysis also revealed 539
that efficient use of wood products could gain substantial benefits given that they retain 540
carbon longer over time in the biosphere, from 14–20 years in the reference life span 541
up to 32–40 years in the long-life span, resulting an increased net climate benefits. But 542
all these affects are strongly linked with forest management activities and its further 543
effect on carbon sequestration capacity of forest ecosystem. In order to realize their 544
positive impacts on climate there is a need for development in both forest management 545
and timber utilization activities (Soimakallio et al. 2016). 546
To summarize, we found that decrease in carbon stocks in ecosystem caused by 547
extracting timber from forests could be compensated for by increasing carbon stocks in 548
Page 22 of 45
https://mc06.manuscriptcentral.com/cjfr-pubs
Canadian Journal of Forest Research
Draft
23
the technosystem carbon pools. This increased net climate benefit of timber production 549
and utilization compared to the similar system with the use of fossil-fuel intensive 550
materials and energy. Tracking carbon over its life cycle helped to assess the net 551
climate impacts of the entire production and utilization chain of forest biomass. This 552
approach sets the basis for the development of carbon accounting procedures (IPCC 553
2006, 2014; Skog 2008) whenever forest biomass moves from ecosystem and builds up 554
the carbon stocks in various parts of technosystem (e.g., energy system or wood 555
product system) and substitute for fossil-fuel intensive materials. At both the 556
ecosystem and technosystem levels, the management and utilization of forests can be 557
an effective strategy for storing and increasing residence time of carbon with or 558
without changing the life span of the products. By doubling the life span of the 559
biomass products, the emissions of 0.24 – 0.28 t CO2.ha-1.year-1 could be avoided, 560
depending on the management regimes and the study period. Even without changing 561
the life span, increased stocking in thinning regimes could increase negative net 562
climate impact by 47% over the study period, compared to the baseline thinning. The 563
study suggests that future climate mitigation strategies should obtain the benefits from 564
forest management and forest biomass to encourage changes in forest management to 565
mitigate carbon emissions. 566
567
Acknowledgements 568
This work was funded by the Kone Foundation for the project for post-doctoral 569
research work. 570
Page 23 of 45
https://mc06.manuscriptcentral.com/cjfr-pubs
Canadian Journal of Forest Research

Draft
24
References 571
Äijälä, O., Koistinen, A., Sved, J., Vanhatalo, K., and Väisänen, P. (2014). 572
Recommendations for Forest Management in Finland. (in Finnish: Hyvän 573
metsänhoidon suositukset – METSÄNHOITO), Forestry Development Centre Tapio 574
publications, 264 p. (in Finnish). 575
Alam, A., Kilpeläinen, A., and Kellomäki, S. 2012. Impacts of initial stand density and 576
thinning regimes on energy wood production and management-related CO2 577
emissions in boreal ecosystems. Eur. J. For. Res. 131:655–667. doi: 578
10.1007/s10342-011-0539-8. 579
Alam, A., Kellomäki, S., Kilpeläinen, A., and Strandman, H. 2013. Effects of stump 580
extraction on the carbon sequestration in Norway spruce forest ecosystems under 581
varying thinning regimes with implications for fossil fuel substitution. Glob. 582
Change Biol. Bioenergy, 5: 445–458. doi: 10.1111/gcbb.12010. 583
Boustead, I. 2005. Eco-profiles of the European Plastics Industry—low density 584
polyethylene (LDPE). Plastic Europe, 19 p. 585
Braun, M., Fritz, D., Weiss, P., Braschel, N., Büchsenmeister, R., Freudenschuß, A., 586
Gschwantner, T., Jandl, R., Ledermann, T., Neumann, M., Pölz, W., Schadauer, K., 587
Schmid, C., Schwarzbauer, P., and Stern T. 2016. A holistic assessment of 588
greenhouse gas dynamics from forests to the effects of wood products use in 589
Austria, Carbon Management, 7(5-6): 271-283. doi: 590
10.1080/17583004.2016.1230990 591
Buchanan, A.H., and Levine, S.B. 1999. Wood-based building materials and 592
atmospheric carbon emissions. Environ. Sci. Policy. 2(6): 427–437. 593
Page 24 of 45
https://mc06.manuscriptcentral.com/cjfr-pubs
Canadian Journal of Forest Research

Draft
25
Cavalli, R. 2015. Environmental assessment of MHM wooden building system. 594
Dissertation, Dip. Territorio e Sistemi Agro-Forestali, Università Degli Studi Di 595
Padova, Padova. 596
Dahlgren, L., Stripple, H., and Oliveira, F. 2015. Life cycle assessment: Comparative 597
study of virgin fibre based packaging products with competing plastic materials. 598
Stockholm. Available from http://www.billerudkorsnas.com/PageFiles/20097/LCA_ 599
report_BillerudKorsnas2015_Final.pdf [accessed 12 March 2017]. 600
Dixon, R.K., Solomon, A.M., Brown, S., Houghton, R.A., Trexier, M.C., and 601
Wisniewski, J. 1994. Carbon Pools and Flux of Global Forest Ecosystems. Science, 602
263(5144): 185-190. doi: 10.1126/science.263.5144.185. 603
Dodoo, A., Gustavsson, L., and Sathre, R. 2009. Carbon implications of end-of-life 604
management of building materials. Resour. Conserv. Recycl. 53(5): 276–286. 605
Eriksson, E., Gillespie, A.R., Gustavsson, L., Lnagvall, O., Olsson, M., Sathre, R., and 606
Stendahl, J. 2007. Integrated carbon analysis of forest management practices and 607
wood substitution. Can. J. For. Res. 37: 671-681. doi: 10.1139/X06-257. 608
Finnish Forest Industries 2015. Towards 2020—the forest industry’s environmental 609
and responsibility commitments progress report. Helsinki. Available from 610
https://www.forestindustries.fi/mediabank/6273.pdf [accessed 30 November 2016]. 611
Gajda, J. 2001. Absorption of Atmospheric Carbon Dioxide by Portland Cement 612
Concrete. R&D Serial No. 2255a, Portland Cement Association, Skokie IL, USA. 613
Gustavsson, L., Börjesson, P., Johansson, B., and Svenningsson, P. 1995. Reducing 614
CO2 emissions by substituting biomass for fossil fuels. Energy, 20: 1097–1113. 615
Gustavsson, L., Pingoud, K., and Sathre, R. 2006. Carbon dioxide balance of wood 616
substitution: comparing concrete- and wood-framed buildings. Mitigation Adapt. 617
Strateg. Glob. Chang. 11: 667–691. doi: 10.1007/s11027-006-7207-1. 618
Page 25 of 45
https://mc06.manuscriptcentral.com/cjfr-pubs
Canadian Journal of Forest Research

Draft
26
Hammond, G.P., and Jones, C.I. 2008. Embodied energy and carbon in construction 619
materials. In Proceedings of the Institution of Civil Engineers. Energy, 161(2). pp. 620
87-98. ISSN 1751-4223 621
Hammond, G.P., and Jones, C.I. 2011. Inventory of Carbon & Energy (ICE) Version 622
2.0. Sustainable Energy Research Team (SERT), Department of Mechanical 623
Engineering, University of Bath, UK. 624
Haus, S., Gustavsson, L., and Sathre, R. 2014. Climate mitigation comparison of 625
woody biomass systems with the inclusion of land-use in the reference fossil 626
system. Biomass Bioenergy, 65: 136-144. 627
Hocking, M. B. 1994. Reusable and Disposable Cups: An Energy-Based Evaluation. 628
Environmental Management, 18(6): 889-899. 629
Hoover, C., Birdsey, R., Goines, B., Lahm, P., Marland, G., Nowak, D., Prisley, S., 630
Reinhardt, E., Skog, K., Skole, D., Smith, J., Trettin, C., and Woodall, C. 2014. 631
Chapter 6: Quantifying Greenhouse Gas Sources and Sinks in Managed Forest 632
Systems. In Quantifying greenhouse gas fluxes in agriculture and forestry: Methods 633
for entity-scale inventory. Edited by Eve, M., Pape, D., Flugge, M., Steele, R., 634
Man, D., Riley-Gilbert, M. and Biggar, S. Tech. Bull. 1939. Washington, DC: U.S. 635
Department of Agriculture, Office of the Chief Economist: 6-1-6.114 636
IPCC (Intergovernmental Panel for Climate Change) 2006. 2006 IPCC Guidelines for 637
National Greenhouse Gas Inventories. Edited by the National Greenhouse Gas 638
Inventories Programme, Eggleston H.S., Buendia L., Miwa K., Ngara T. and 639
Tanabe K. IGES, Japan. 640
IPCC (Intergovernmental Panel for Climate Change) 2014. 2013 Revised 641
Supplementary Methods and Good Practice Guidance Arising from the Kyoto 642
Page 26 of 45
https://mc06.manuscriptcentral.com/cjfr-pubs
Canadian Journal of Forest Research
Draft
27
Protocol. Edited by Hiraishi, T., Krug, T., Tanabe, K., Srivastava, N., Baasansuren, 643
J., Fukuda, M., Troxler, T.G. IPCC, Switzerland. 644
Jandla, R., Lindnerb, M., Vesterdalc, L., Bauwensd, B., Baritze, R., Hagedornf, F., 645
Johnsong, D.W., Minkkinenh, K., and Byrnei, K.A. 2007. How strongly can forest 646
management influence soil carbon sequestration? Geoderma, 137(3–4): 253–268. 647
Kaipainen, T., Liski, J., Pussinen, A., and Karjalainen, T. 2004. Managing carbon sinks 648
by changing rotation length in European forests. Environ. Sci. Policy, 7: 205–219. 649
Karjalainen, T., Kellomäki, S., and Pussinen, A. 1994. Role of wood-based products in 650
absorbing atmospheric carbon. Silva Fenn. 28(2): 67–80. 651
Karjalainen, T. 1995. The carbon sequestration potential of unmanaged forest stands in 652
Finland under changing climatic conditions. Biomass Bioenergy, 5(6): 313-329. 653
Kellomäki, S., Väisänen, H., Hänninen, H., Kolström, T., Lauhanen, R., Mattila, U., 654
and Pajari, B. 1992a. A simulation model for the succession of the boreal forest 655
ecosystem. Silva Fenn. 26: 1-18. 656
Kellomäki, S., Väisänen, H., Hänninen, H., Kolström, T., Lauhanen, R., Mattila, U., 657
and Pajari, B. 1992b. SIMA: a model for forest succession based on the carbon and 658
nitrogen cycles with application to silvicultural management of the forest 659
ecosystem. Silva Carelica, 22: 85 p. 660
Kellomäki, S., Peltola, H., Nuutinen, T., Korhonen, K.T., and Strandman, H. 2008. 661
Sensitivity of managed boreal forests in Finland to climate change, with 662
implications for adaptive management. Philos. Trans. R. Soc. B. 363: 2341–2351. 663
Kellomäki, S., Kilpeläinen, A., and Alam, A. 2013. Effects of bioenergy production on 664
carbon sequestration in forest ecosystems. In Forest BioEnergy Production: 665
Management, Carbon Sequestration and Adaptation. Edited by Kellomäki, S., 666
Kilpeläinen, A., Alam, A. Springer publications New York. pp. 125-158. 667
Page 27 of 45
https://mc06.manuscriptcentral.com/cjfr-pubs
Canadian Journal of Forest Research
Draft
28
Kilpeläinen, A., Alam, A., Strandman, H., and Kellomäki, S. 2011. Life cycle 668
assessment tool for estimating net CO2 exchange of forest production. Glob. Change 669
Biol. Bioenergy, 3(6): 461-471. DOI: 10.1111/j.1757-1707.2011.01101.x 670
Kilpeläinen, A., Strandman, H., Kellomäki, S., and Seppälä, J. 2013. Assessing the net 671
atmospheric impacts of wood production and utilization. Mitigation Adapt. Strateg. 672
Glob. Chang. 19(7): 955-968. DOI 10.1007/s11027-013-9454-2. 673
Kilpeläinen, A., Torssonen, P., Strandman, H., Kellomäki, S., Asikainen, A., and 674
Peltola, H. 2015. Net climate impacts of forest biomass production and utilization in 675
managed boreal forests. Glob. Change Biol. Bioenergy, 8(2): 307–316. doi: 676
10.1111/gcbb.12243. 677
Kjellsen, K.O., Guimaraes, M., and Nilsson, Å. 2005. The CO2 balance of concrete in a 678
life cycle perspective. Nordic Innovation Centre, Oslo. 679
Klein, D., Höllerl, S., Blaschke, M., and Schulz, C. 2013. The Contribution of 680
Managed and Unmanaged Forests to Climate Change Mitigation—A Model 681
Approach at Stand Level for the Main Tree Species in Bavaria. Forests, 4: 43-69. 682
Krug, J., Koehl, M., and Kownatzki, D. 2012. Revaluing unmanaged forests for 683
climate change mitigation, Carbon Balance and Management, 7 (11) doi: 684
10.1186/1750-0680-7-11. 685
Lamlom, S.H., and Savidge, R.A. 2003. A reassessment of carbon content in wood: 686
variation within and between 41 North American species. Biomass and Bioenergy, 687
25: 381-388. doi:10.1016/S0961-9534(03)00033-3 688
Lippke, B., Oneil, E., Harrison, R., Skog, K., Gustavsson, L., and Sathre, R. 2011. Life 689
cycle impacts of forest management and wood utilization on carbon mitigation: 690
knowns and unknowns. Carbon Manag. 2(3): 303-333. doi: 10.4155/cmt.11.24. 691
Page 28 of 45
https://mc06.manuscriptcentral.com/cjfr-pubs
Canadian Journal of Forest Research
Draft
29
Liski, J., Pussinen. A., Pingoud, K., Mäkipää, R., and Karjalainen, T. 2001. Which 692
rotation length is favorable for carbon sequestration? Can. J. For. Res. 31: 2004–693
2013. 694
Lundmark, T., Bergh, J., Hofer, P., Lundström, A., Nordin, A., Poudel, B., Sathre, R., 695
Taverna, R., and Werner, F. 2014. Potential roles of Swedish forestry in the context 696
of climate change mitigation. Forests, 5(4): 557-578. doi:10.3390/f5040557, 697
Luyssaert, S., Schulze, E.D., Börner, A., Knohl, A., Hessenmöller, D., Law, B.E., 698
Ciais, P., and Grace, J. 2008. Old-growth forests as global carbon sinks. Nature, 699
455: 213-215. doi:10.1038/nature07276. 700
Naudts, K., Chen, Y., McGrath, M.J., Ryder, J., Valade, A., Otto, J., and Luyssaert, S. 701
2016. Europe’s forest management did not mitigate climate warming. Science, 351 702
(6273): 597-600. doi: 10.1126/science.aad7270, 703
Routa, J., Kellomäki, S., Kilpeläinen, A., Peltola, H. and Strandman, H. 2011. Effects 704
of forest management on the carbon dioxide emissions of wood energy in integrated 705
production of timber and energy biomass. Glob. Change Biol. Bioenergy, 3(6): 706
483–497. doi: 10.1111/j.1757-1707.2011.01106.x. 707
Routa, J., Pyörälä, P., Alam, A., Kilpeläinen, A., Peltola, H., and Kellomäki, S. 2013. 708
Integrated production of timber and energy biomass in forestry. In Forest BioEnergy 709
Production: Management, Carbon Sequestration and Adaptation. Edited by 710
Kellomäki, S., Kilpeläinen, A., and Alam, A. Springer publications New York. pp 711
57-80. 712
Røyne, F., Peñalozac, D., Sandin, G., Berlin, J., and Svanström, M. 2016. Climate 713
impact assessment in life cycle assessments of forest products: implications of 714
method choice for results and decision-making. J. Cleaner Prod. 116: 90-99. doi: 715
http://dx.doi.org/10.1016/j.jclepro.2016.01.009 716
Page 29 of 45
https://mc06.manuscriptcentral.com/cjfr-pubs
Canadian Journal of Forest Research
Draft
30
Saranpää, P. 2003. Wood density and growth. In Wood quality and its biological basis. 717
Edited by Barnett, J.R., Jeronimidis, G. Blackwell publishing Oxford. pp. 87-117. 718
Sathre, R., and O’Connor, J. 2010. Meta-analysis of greenhouse gas displacement 719
factors of wood product substitution. Environ. Sci. Policy, 13: 104–114. 720
Sathre, R., Gustavsson, L., and Haus, S. 2013. Time Dynamics and Radiative Forcing 721
of Forest Bioenergy Systems. In Forest BioEnergy Production: Management, 722
Carbon Sequestration and Adaptation. Edited by S. Kellomäki, A. Kilpeläinen, A. 723
Alam. Springer Publications, New York. pp. 185-206. 724
Sipi, M. 2002. Puutuoteteollisuus 5. Sahatavaratuotanto. Helsinki, Opetushallitus, 213 725
p. (In Finnish). 726
Skog, K.E. 2008. Sequestration of carbon in harvested wood products for the United 727
States. Forest Products Journal, 58(6): 56‐72. 728
Skog, K.E., McKinley, D.C., Birdsey, R.A., Hines, S.J., Woodall, C.W., Reinhardt, 729
E.D., and Vose, J.M. 2014. Chapter 7: Managing carbon. In Climate Change and 730
United States Forests. Edited by Peterson, D.L., Vose, J.M., Patel-Weynand, T. 731
Adv. Glob. Change Res. 57: pp 151-182. 732
Smyth, C.E., Stinson, G., Neilson, E., Lemprière, T.C., Hafer, M., Rampley, G.J., and 733
Kurz, W.A. 2014. Quantifying the biophysical climate change mitigation potential 734
of Canada’s forest sector. Biogeosciences, 11: 3515–3529. doi:10.5194/bg-11-3515-735
2014. 736
Soimakallio, S., Saikku, L., Valsta, L., and Pingoud K. 2016. Climate Change 737
Mitigation Challenge for Wood Utilization – The Case of Finland. Environ. Sci. 738
Technol. 50: 5127−5134. doi: 10.1021/acs.est.6b00122. 739
Statistics Finland 2015. Greenhouse gas emissions in Finland 1990-2013. National 740
Inventory Report. Weblink: http://unfccc.int/national_reports/annex_i_ghg 741
Page 30 of 45
https://mc06.manuscriptcentral.com/cjfr-pubs
Canadian Journal of Forest Research
Draft
31
_inventories/national_inventories_submissions/items/8812.php [accessed 8 March 742
2016]. 743
Tanskanen, H. 2007. Fuel conditions and fire behavior characteristics of managed 744
Picea abies and Pinus sylvestris forests in Finland. PhD thesis, Department of 745
Forest Ecology, The University of Helsinki, Helsinki. 746
UPM. 2010a. Carbon footprint statement. UPM-Kymmene Corporation. 747
UPM. 2010b. Environmental product declaration – pulp. UPM-Kymmene Corporation. 748
Werner, F., Taverna, R., Hofer, P., Thürig, E., Kaufmann, E. 2010. National and global 749
greenhouse gas dynamics of different forest management and wood use scenarios: a 750
model-based assessment. Environmental Science & Policy, 13: 72-85. 751
doi:10.1016/j.envsci.2009.10.004. 752
Zeng, H., Peltola, H., Talkkari, A., Strandman, H., Venäläinen, A., Wang, K., and 753
Kellomäki, S. 2006. Simulations of the influence of clear-cutting on the risk of wind 754
damage on a regional scale over a 20-year period. Can. J. For. Res. 36: 2247–2258. 755
756
757
758
759
760
761
762
763
764
Page 31 of 45
https://mc06.manuscriptcentral.com/cjfr-pubs
Canadian Journal of Forest Research
Draft
32
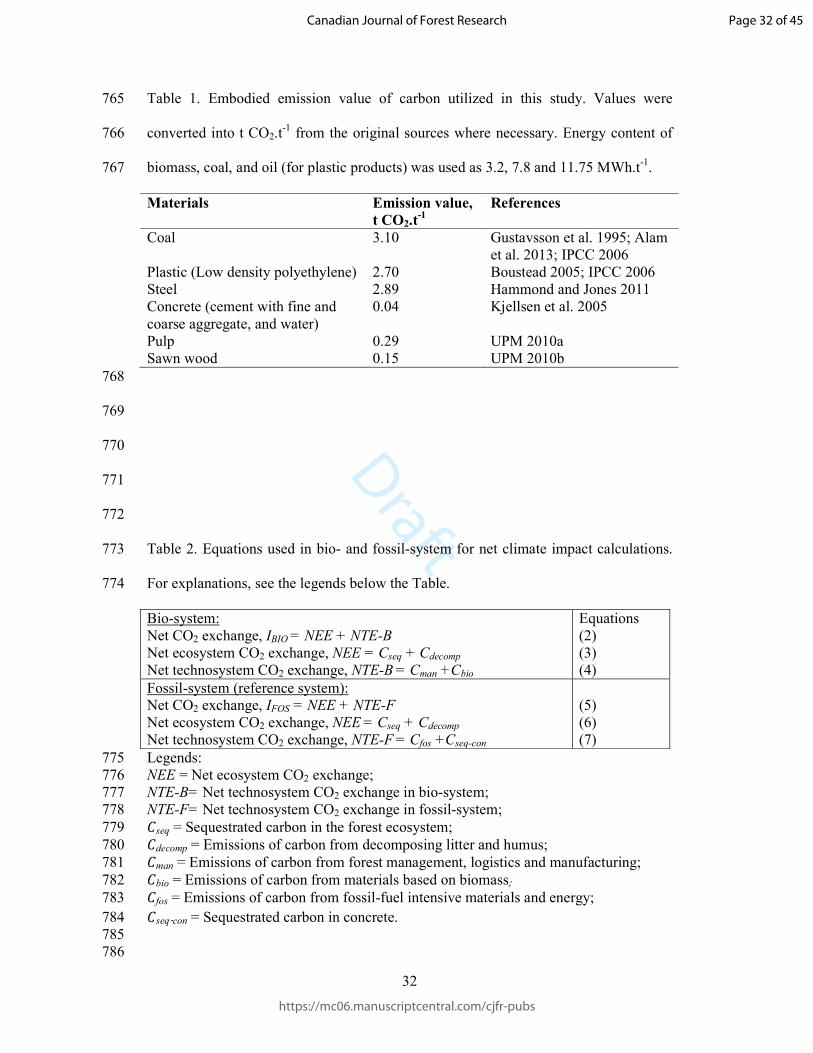
Table 1. Embodied emission value of carbon utilized in this study. Values were 765
converted into t CO2.t-1 from the original sources where necessary. Energy content of 766
biomass, coal, and oil (for plastic products) was used as 3.2, 7.8 and 11.75 MWh.t-1. 767
Materials Emission value,
t CO2.t-1
References
Coal 3.10 Gustavsson et al. 1995; Alam et al. 2013; IPCC 2006
Plastic (Low density polyethylene) 2.70 Boustead 2005; IPCC 2006 Steel 2.89 Hammond and Jones 2011 Concrete (cement with fine and coarse aggregate, and water)
0.04 Kjellsen et al. 2005
Pulp 0.29 UPM 2010a Sawn wood 0.15 UPM 2010b 768
769
770
771
772
Table 2. Equations used in bio- and fossil-system for net climate impact calculations. 773
For explanations, see the legends below the Table. 774
Bio-system: Net CO2 exchange, IBIO = NEE + NTE-B
Net ecosystem CO2 exchange, NEE = Cseq + Cdecomp Net technosystem CO2 exchange, NTE-B = Cman +Cbio
Equations (2) (3) (4)
Fossil-system (reference system): Net CO2 exchange, IFOS = NEE + NTE-F
Net ecosystem CO2 exchange, NEE = Cseq + Cdecomp Net technosystem CO2 exchange, NTE-F = Cfos +Cseq-con
(5) (6) (7)
Legends: 775 NEE = Net ecosystem CO2 exchange; 776 NTE-B= Net technosystem CO2 exchange in bio-system; 777 NTE-F= Net technosystem CO2 exchange in fossil-system; 778 �seq = Sequestrated carbon in the forest ecosystem; 779 �decomp = Emissions of carbon from decomposing litter and humus; 780 �man = Emissions of carbon from forest management, logistics and manufacturing; 781 �bio = Emissions of carbon from materials based on biomass; 782 �fos = Emissions of carbon from fossil-fuel intensive materials and energy; 783 �seq‐con = Sequestrated carbon in concrete. 784 785 786
Page 32 of 45
https://mc06.manuscriptcentral.com/cjfr-pubs
Canadian Journal of Forest Research

Draft
33
Table 3. Summary of reference situation and factors that were changed for the purpose 787
of the sensitivity analysis in order to manage carbon in the ecosystem and 788
technosystem. Results were presented in all combinations of the ecosystem and 789
technosystem. 790
Ecosystem
Forest management Thinning pattern Reference thinning Baseline thinning following the current
recommendations Thinning with increased stocking
Thinning thresholds increased by 20% (increased stocking) compared to baseline thinning
Thinning with decreased stocking
Thinning thresholds decreased by 20% (decreased stocking) compared to baseline thinning
791 792
Technosystem
Life time of products, years Share of biomass in products, % Reference life
• Pulp or plastic, 6 • Sawn, 35
Reference share • Pulp/sawn, 50 • Waste, 50
Long life • Pulp or plastic, 12 • Sawn, 70
Higher share • Pulp/sawn, 70 • Waste, 30
Short life • Pulp or plastic, 3 • Sawn, 17
Lower share • Pulp/sawn, 30 • Waste, 70
793 794
795 796
797
798
799
800
801
802
803
Page 33 of 45
https://mc06.manuscriptcentral.com/cjfr-pubs
Canadian Journal of Forest Research

Draft
34
804
Table 4. Mean residence time (in years) of carbon over rotations at the ecosystem and 805
technosystem as a function of varying management regimes. Percentage (%) changes 806
are shown in parentheses when various management options are compared to the 807
baseline thinning. Simulation for unmanaged regime (reference forest management in 808
fossil system), is done for a 160-year period and based on that two separate periods are 809
calculated to make it comparable with other management regimes. 810
Management regimes
Rotation 1
(1–80 years)
Rotation 2
(81–160 years)
Both rotations
(1–160 years)
Mean carbon retention, years (% changes)
Ecosystem
• Baseline 37.4 ( - ) 35.4 ( - ) 36.4 ( - )
• Increased stocking 42.2 (+12.7) 38.9 (+9.8) 40.6 (+11.3)
• Decreased stocking 30.6 ( -18.4) 29.3 (-17.4) 29.9 (-17.9)
• Unmanaged 44.6 (+19.2) 53.2 (+50.1) 48.9 (+34.3)
Technosystem
• Baseline 8.5 ( - ) 29.2 ( - ) 18.8 ( - )
• Increased stocking 2.2 (- 73.6) 26.4 (-9.3) 14.3 (-23.8)
• Decreased stocking 10.4 (+22.5) 28.7 ( -1.5) 19.5 (+3.9)
• Unmanaged 0.0 ( - ) 0.0 ( - ) 0.0 ( - )
Eco- and technosystem
• Baseline 45.9 ( - ) 64.6 ( - ) 55.2 ( - )
• Increased stocking 44.4 ( -3.2) 65.4 ( +1.2) 54.9 ( -0.6)
• Decreased stocking 40.9 (-10.8) 58.0 (-10.2) 49.4 (-10.5)
• Unmanaged 44.6 (-2.7) 53.2 (-17.6) 48.9 (-11.4) 811
812
813
814
815
816
817
818
Page 34 of 45
https://mc06.manuscriptcentral.com/cjfr-pubs
Canadian Journal of Forest Research
Draft
35
819
Figure legends: 820
821
Figure 1. Broken lines define the system boundary for the bio-system and the reference 822
fossil-system considering various management options in both systems. The difference 823
between the systems are calculated for (i) net ecosystem CO2 exchange (NEE) refers to 824
Net ecosystem impact, (ii) net technosystem CO2 exchange (NTE) refers to Net 825
technosystem impact, and (iii) net CO2 exchange (IBIO - IFOS) indicates Net climate 826
impact (I). In the analysis, unmanaged regime in reference fossil-system was compared 827
with baseline management in bio-system (see asterisk sign *). Baseline management in 828
reference fossil-system was compared with all management options utilized in bio-829
system (see dagger sign †). In the technosystem, substitution occurred as follows: pulp 830
for plastic; sawn wood for concrete and steel; and waste wood for coal. Forest 831
management regimes were defined in Table 3. 832
833
Figure 2. Net ecosystem CO2 exchange, NEE (i.e., difference between sequestration 834
and decomposition) under different management regimes. Values in parentheses beside 835
the Figure legend indicate mean net ecosystem CO2 exchange, NEE (g CO2.m-2.year-1) 836
over the simulation period. 837
838
Figure 3a. Development of ecosystem carbon stocks (t CO2.ha-1) in trees (panel a) and 839
in soil (panel b) under different management regimes. Each reduction in tree carbon 840
stocks corresponds to the harvesting of timber from ecosystem and mobilized to the 841
technosystem. Values in parentheses beside the Figure legend indicate mean carbon 842
stock (t CO2.ha-1) over the simulation period. Scales are different for panels a and b. 843
Page 35 of 45
https://mc06.manuscriptcentral.com/cjfr-pubs
Canadian Journal of Forest Research

Draft
36
844
Figure 3b. Panel a: Increase of carbon stocks (t CO2.ha-1) in the technosystem due to 845
accumulation of harvested pulpwood and sawlogs excluding the decrease in stock due 846
to the emissions. Panel b: the CO2 emission (t CO2.ha-1.year-1) from the waste wood 847
(i.e., 50% of total harvested timber) for energy. Panel c: the CO2 emission (t CO2.ha-848
1.year-1) from degradation of pulp and sawn wood products. 849
850
Figure 4. Sensitivity of carbon stocks, carbon emissions and carbon residence time in 851
the ecosystem (panel a) and technosystem (panels b1 and b2) under varying 852
management regimes, product’s life span, and share of wood. Management regimes, 853
product’s life span, and share of wood are defined in Table 2. 854
855
Figure 5. Annual cumulative net CO2 exchange for bio-system (IBIO) and fossil-system 856
(IFOS) under various forest management regimes for 160-year. Calculations were made 857
according to the various management options, including emissions from the sawn 858
wood, pulp and combustion of waste wood and net ecosystem CO2 exchange (NEE). 859
For the IFOS, NEE of baseline management was used in the panels a, b and c, and the 860
same energy and services was produced as in baseline, increased stocking and 861
decreased stocking, respectively. In the panel d, IFOS used NEE of unmanaged regime 862
and materials and energy was produced as in baseline management. 863
864
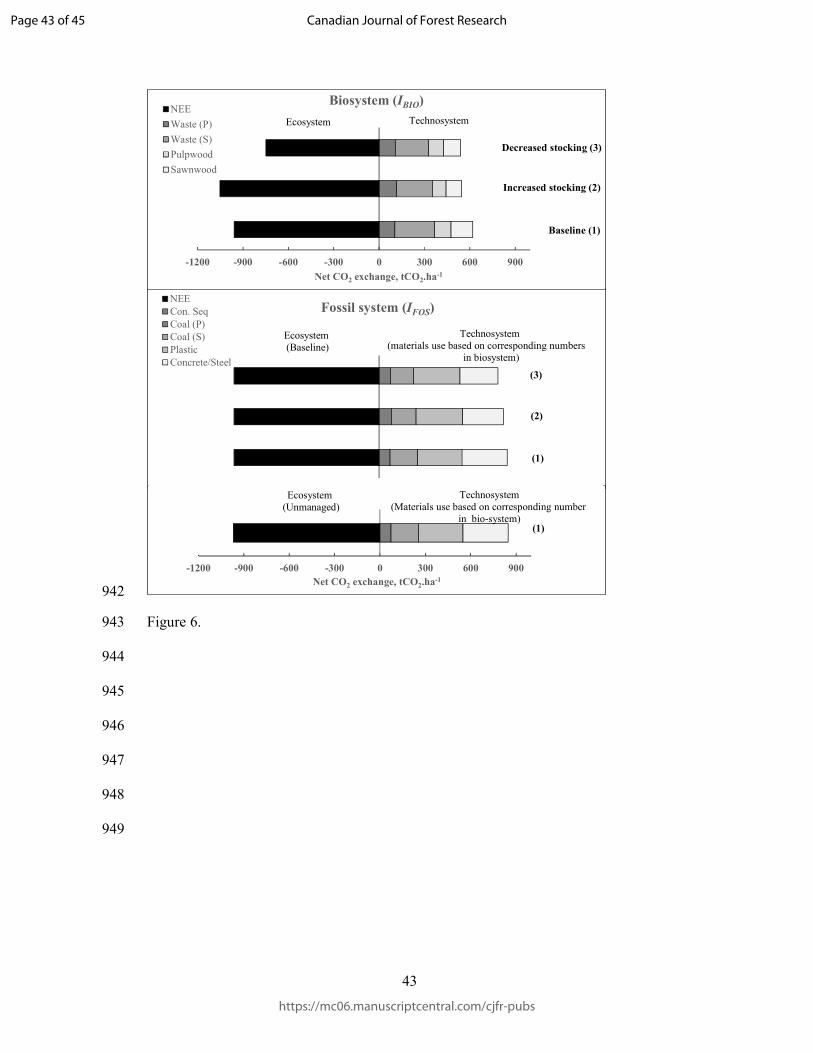
Figure 6. Total net CO2 exchange (tCO2.ha-1) of bio-system (IBIO) and fossil-system 865
(IFOS) divided into different components over a 160-year period. Calculations were 866
made according to the various management options, including emissions from the pulp 867
and sawn wood and combustion of waste wood from pulpwood (Waste P) and sawlogs 868
Page 36 of 45
https://mc06.manuscriptcentral.com/cjfr-pubs
Canadian Journal of Forest Research

Draft
37
(Waste S) and net ecosystem CO2 exchange (NEE). For the IFOS, NEE of baseline and 869
unmanaged regimes were used, and the same energy and materials services was 870
produced as in baseline (see ‘1’), increased stocking (see ‘2’) and decreased stocking 871
(see ‘3’), respectively. 872
873
Figure 7. Net CO2 exchange calculated as a difference between bio-system and fossil-874
system over the 160-year period. Net ecosystem impact = Bio-system (NEE) – Fossil-875
system (NEE); Net technosystem impact = Bio-system (NTE-B) – Fossil-system (NTE-876
F); Net climate impact (I) = Bio-system (IBIO) – Fossil-system (IFOS). In the IFOS, 877
reference management was either baseline or unmanaged regime as indicated in the 878
Figure 1 and 6. Negative values indicate that IBIO produces less emissions compared to 879
the IFOS and vice versa. 880
881
Figure 8. Net climate impacts (t CO2.ha-1) of the timber harvesting and utilization 882
under alternative forest management regimes and varying life span of products during 883
the first (upper panel), and the both rotations (lower panel). Management regimes and 884
products’ life span are defined in Table 2. 885
886
887
888
889
890
891
892
893
Page 37 of 45
https://mc06.manuscriptcentral.com/cjfr-pubs
Canadian Journal of Forest Research

Draft
38
894
895
Figure. 1 896
897
898
899
900
Figure 2. 901
Technosystem (NTE-F)
1 Plastic2 Concrete and steel
3 CoalCarbon sequestration by concrete
Ecosystem (NEE)
Managements: Baseline *† Increased stocking †Decreased stocking †
Technosystem (NTE-B)Harvesting operationsWood processing at millPulp 1
Sawn wood 2
Waste wood 3
Ecosystem (NEE)
Managements: Unmanaged * Baseline †
Bio-system(Net CO2 exchange, IBIO)
Fossil-system (reference)(Net CO2 exchange, IFOS)
Net climate impact (I)
Net technosystem impact
Net ecosystem impact
Year
20 40 60 80 100 120 140 160
Net ecosyste
m C
O2 e
xchange (NEE)
-20
-10
0
10
20
30
40
Net e
cosyste
m C
O2 e
xchange (N
EE)
-2000
-1000
0
1000
2000
3000
4000
Unmanaged (-605) Baseline (-599) Increased stocking (-658)Decreased stocking (-468)
t CO2.ha-1.year-1 g CO2.m
-2.year-1
Page 38 of 45
https://mc06.manuscriptcentral.com/cjfr-pubs
Canadian Journal of Forest Research
Draft
39
902
903
904
Figure 3a. 905
906
t CO2.ha-1
Year
20 40 60 80 100 120 140 160
Soil carb
on s
tock
100
200
300
400Unmanaged (197)
Baseline (111)
Increased stocking (125)
Decreased stocking (96)
(b)
Tre
e c
arb
on s
tock
200
400
600
800Unmanaged (445)
Baseline (191)
Increased stocking (228)
Decreased stocking (142)
(a)
Page 39 of 45
https://mc06.manuscriptcentral.com/cjfr-pubs
Canadian Journal of Forest Research

Draft
40
907
Figure 3b. 908
909
910
911
912
913
20 40 60 80 100 120 140 160
Technosyste
m c
arb
on e
missions
020406080
100120140160
Year
20 40 60 80 100 120 140 160
0123456
t CO2.ha-1
(b)
20 40 60 80 100 120 140 160
Technosyste
m c
arb
on s
tock
0
200
400
600
800
UnmanagedBaseline Increased stockingDecreased stocking
(a)
(c)
t CO2.ha-1.year
-1
Page 40 of 45
https://mc06.manuscriptcentral.com/cjfr-pubs
Canadian Journal of Forest Research

Draft
41
914
915
Figure 4. 916
917
918
919
920
921
922
923
924
925
926
Page 41 of 45
https://mc06.manuscriptcentral.com/cjfr-pubs
Canadian Journal of Forest Research

Draft
42
927
Figure 5. 928
929
930
931
932
933
934
935
936
937
938
939
940
941
-111
-338
-650
-550
-450
-350
-250
-150
-50
50
20 40 60 80 100 120 140 160
Net CO
2exchange, t CO
2 .ha
-1
Year
a)
Fossil-system (Baseline thinning)
Bio-system (Baseline thinning)
IFosIBIO
-137
-469
-650
-550
-450
-350
-250
-150
-50
50
20 40 60 80 100 120 140 160
Net CO
2exchange, t CO
2 .h
a-1
Year
b)
Fossil-system (Baseline thinning)
Bio-system (Increased stocking)
IFosIBIO
-173-174
-650
-550
-450
-350
-250
-150
-50
50
20 40 60 80 100 120 140 160
Net CO
2exchange, t CO
2.h
a-1
Year
c)
Fossil-system (Baseline thinning)
Bio-system (Decreased stocking)
IFosIBIO
-121
-338
-650
-550
-450
-350
-250
-150
-50
50
20 40 60 80 100 120 140 160
Net CO
2exchange, t CO
2.h
a-1
Year
d)
Fossil-system (Unmanaged)
Bio-system (Baseline thinning)
IFosIBIO
Page 42 of 45
https://mc06.manuscriptcentral.com/cjfr-pubs
Canadian Journal of Forest Research
Draft
43
942
Figure 6. 943
944
945
946
947
948
949
1
2
3
Fossil system (IFOS)NEECon. SeqCoal (P)Coal (S)PlasticConcrete/Steel
(2)
(1)
(3)
Ecosystem(Baseline)
Technosystem (materials use based on corresponding numbers
in biosystem)
-1200 -900 -600 -300 0 300 600 900
1
Net CO2 exchange, tCO2.ha-1
(1)
Technosystem (Materials use based on corresponding number
in bio-system)
-1200 -900 -600 -300 0 300 600 900
1
2
3
Net CO2 exchange, tCO2.ha-1
Biosystem (IBIO)NEE
Waste (P)
Waste (S)
Pulpwood
Sawnwood
Increased stocking (2)
Baseline (1)
Decreased stocking (3)
Ecosystem Technosystem
Ecosystem (Unmanaged)
Page 43 of 45
https://mc06.manuscriptcentral.com/cjfr-pubs
Canadian Journal of Forest Research

Draft
44
950
Figure 7. 951
952
-350
-250
-150
-50
50
150
250
350
Axi
s T
itle
Net climate impact (I)
Baseline
Increased stocking
Decreased stocking
Unmanaged
-350
-250
-150
-50
50
150
250
350
Axi
s T
itle
Net technosystem impact
-350
-250
-150
-50
50
150
250
350
Dif
fere
nce
in n
et C
O2
exch
ange
, tC
O2
ha-1
Net ecosystem impact
Page 44 of 45
https://mc06.manuscriptcentral.com/cjfr-pubs
Canadian Journal of Forest Research
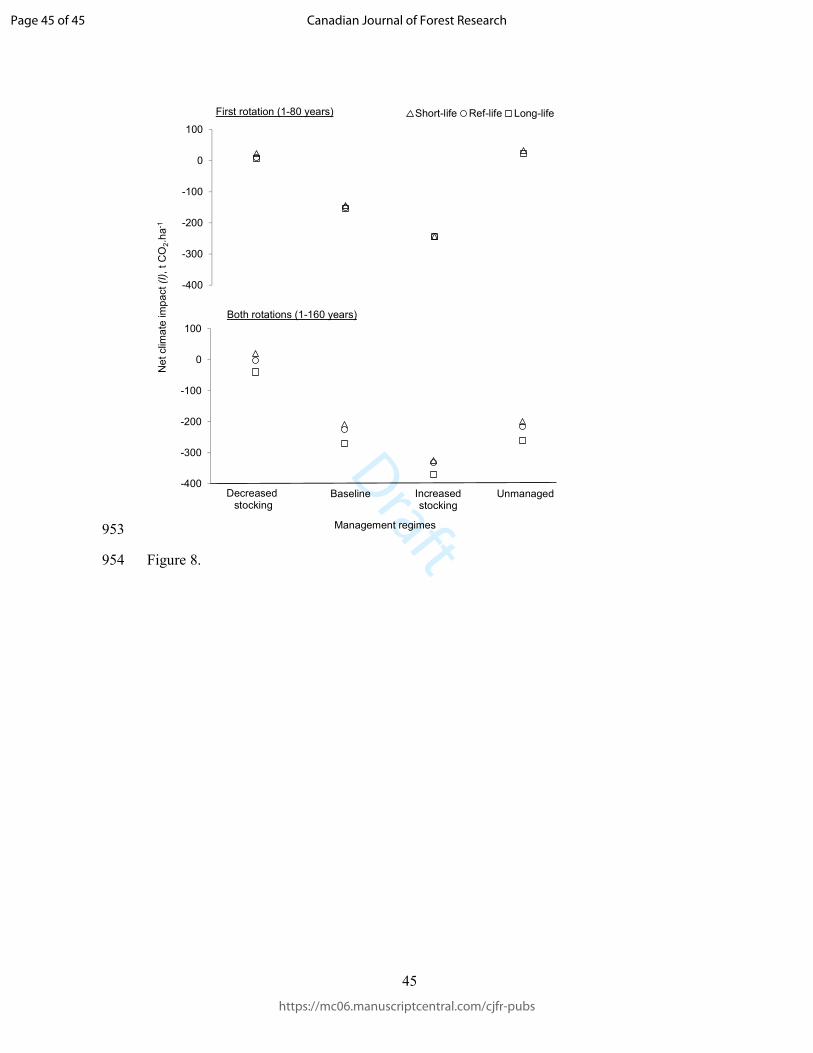
Draft
45
953
Figure 8. 954
-400
-300
-200
-100
0
100
Net clim
ate
im
pact (I), t C
O2.h
a-1
First rotation (1-80 years) Short-life Ref-life Long-life
-400
-300
-200
-100
0
100
Management regimes
Decreasedstocking
Baseline Increasedstocking
Both rotations (1-160 years)
Unmanaged
Page 45 of 45
https://mc06.manuscriptcentral.com/cjfr-pubs
Canadian Journal of Forest Research