synthesis of silver nanoparticles and their applications. 4-2013/2013, 5(4) 455-466.pdf · anal....
TRANSCRIPT
Anal. Bioanal. Electrochem., Vol. 5, No. 4,, 2013, 455 - 466
Full Paper
Synthesis of Silver Nanoparticles and their Applications
Shashanka Rajendrachari1,2, Bahaddureghatta E. Kumara Swamy2,*, Sathish Reddy2
and Debasis Chaira1
1Department of Metallurgical and Materials Engineering, National Institute of Technology
Rourkela-769008, India
2Department of P.G .Studies and Research in Industrial Chemistry, Kuvempu University,
Jnana Sahyadri, Shankaraghatta 577451, Shimoga, Karnataka, India
*Corresponding Author, Tel.:+91 8282 256225; Fax: +91 8282 256255
E-Mail: [email protected]
Received: 5 June 2013 / Accepted: 10 August 2013 / Published online: 30 August 2013
Abstract- Silver nanoparticle was synthesized by using acacia melanoxylon fresh leaves
extract. The obtained silver nanoparticle was characterized by using X-ray diffraction (XRD),
infrared absorption spectroscopy (IR), UV-Vis absorption spectroscopy (UV-Vis) and Zeta-
potential analysis. The prepared silver nanoparticle/carbon paste electrode (AgNps/CPE)
exhibits diffusion-controlled process and enhanced electrochemical sensing property for the
detection of uric acid in presence of dopamine at physiological pH. The antibacterial property
was checked the prepared silver nanoparticle is also shows good antibacterial property.
Keywords- Silver Nanoparticle, Dopamine, Uric Acid, Acacia Melanoxylon, Cyclic
Voltammetry
1. INTRODUCTION
Silver nanoparticles (AgNPs) egressed as a boon product from the field of
nanotechnology due to its good conductivity, chemical stability, catalytic and antibacterial
activity [1-3]. In recent years, biological synthesis of nanoparticles especially from plant
extract is gaining importance due to its simplicity, non-toxic, cost effective and eco-friendly
in nature. There were many gold and silver nanoparticles from different plants has been
Analytical &
Bioanalytical Electrochemistry
© 2013 by CEE
www.abechem.com

Anal. Bioanal. Electrochem., Vol. 5, No. 4,, 2013, 455 - 466 456
reported they are Alfalfa [4,5], Aloe vera [6], Cinnamomum camphora [7], Emblica
officianalis [8], Carica papaya [9], Eucalyptus hybrid [10], Capsicum annuum [11] and
tamarind [12]. Acacia melanoxylon is one among the above plants whose leaves are used to
synthesis silver nanoparticles.
Uric acid (2,6,8–trihydroxypurine, UA), a major nitrogenous compound in urine, is a
product of purine metabolism in human body and its higher levels leads to many clinical
disorders [13]. High levels of UA in the blood (hyper uricemia or Lesch-Nyhan syndrome)
are linked with the body disorders like gout, kidney and cardiac problems. Many
epidemiological studies have suggested that elevated serum UA is also a risk factor for
cardiovascular disease [14-19] and dopamine (DA) is one of the very important
neurotransmitter [20]. In brain fluids UA is present in relatively high concentration (1-50
M), while dopamine level are of the order of 100 nM [21-23]. Hence, to explore a simple,
accurate and reliable method for the determination of uric acid in presence of interference
became an urgent need. Electrochemical methods were commonly accepted as the fastest
analytical assay compared with traditional spectroscopic [24], chemiluminescence [25,26],
chromatographic [27], spectrofluorometric [28], colorimetric [29,30] , electrophoretic [31,32]
methods.
In order to increase the sensitivity and selectivity, various oxides such as CuO, ZnO,
Mg2Fe2O4, CdO, NiO/ZnO hybrid nanoparticles modified carbon paste electrodes are
reported [33-37]. In the work, Silver nanoparticle was synthesized by using acacia
melanoxylon fresh leaves extract and characterized using XRD, IR, UV-Vis and Zeta-
potential analysis. The obtained results shows that silver nanoparticle/carbon paste electrode
act as good electrochemical sensor for detection of UA in presence DA. In addition, there is a
great need of finding new antibacterial agents against various pathogenic bacteria which
causes some infectious diseases. Here prepared silver nanoparticles accomplish the need and
acts as a promising antibacterial activity.
2. EXPERIMENTAL
2.1. Materials and Stock solution
Analytical grade dopamine hydrochloride (DA), uric acid (UA), sodium dihydrogen ortho
phosphate (NaH2PO4), disodium hydrogen phosphate (Na2HPO4), silver nitrate (AgNO3) and
silicon oil were procured from Himedia chemicals and Graphite powder (particle size m)
(Merck chemicals). All chemicals are used without any further purification. Dopamine stock
solution (25 mM) was prepared by taking a known quantity of dopamine in 0.1 M perchloric
acid, 25 mM uric acid solution was freshly prepared using 0.1 M NaOH solution. Phosphate

Anal. Bioanal. Electrochem., Vol. 5, No. 4,, 2013, 455 - 466 457
buffer (pH 7.4) was prepared as per the literature with 0.2 M NaH2PO4 and Na2HPO4 solution
in double distilled water.
2.2. Characterization
The silver nanoparticle was characterized by powder XRD using Cu-Kα radiation
(λ=1.5438 Å) in a Philips XRD ‘X’ PERT PRO diffractometer. IR absorption spectra was
recorded in a FT-IR SPECTRUM 1000 PERKIN ELMER spectrometer on thoroughly dried
samples using KBr as dilutant, UV-Vis spectra was obtained using Perkin Elmer UV-Vis
Spectrophotometer and Zeta potential was performed in Malvrin Zeta sizer. All the
electrochemical experiments were carried out in a three-electrode cell with the bare CPE,
silver nanoparticle/CPE as a working electrode an aqueous saturated calomel electrode (SCE)
as reference electrode and a Pt wire as auxiliary electrode using an electrochemical work
station Model 660c (CH Instruments).
2.3. Synthesis of silver nanoparticles
Ten grams of taxonomically authenticated, freshly collected healthy leaves of acacia
melanoxylon were taken and washed thoroughly in water in the laboratory for 10 minutes in
order to remove the dust particles. Fig. 1 shows the leaves of acacia melanoxylon plant and
leaves are made into small pieces and rinsed in sterile distilled water. Then small leaves in to
a 250 ml beaker containing 100 ml distilled water and boil the solution on a boiling steam
bath for 5 to 10 min until the color of the solvent changes to light yellow. This extract was
filtered through sterile filter paper and this solution was treated as source extract. The extract
was stored at 5°C to inhibit the growth of fungus and utilized in subsequent procedures. The
5 ml of extract solution was treated with 50 ml of 0.01 M AgNO3 solution and warmed again
on the steam bath for 10 min until the color of the solution changes to reddish brown as
shown in the Fig. 1b. Then it was allowed to cool and incubate in the laboratory environment.
Fig. 1. (a) Acacia melanoxylon leaves (b) Colour change of the leaf extract before and after
synthesis of Ag nanoparticles

Anal. Bioanal. Electrochem., Vol. 5, No. 4,, 2013, 455 - 466 458
2.4. Silver nanoparticles/carbon paste electrode
Carbon paste electrode (CPE) was modified by taking concentration of Ag nanoparticle
(10-50 L) in silicon oil (30%) and graphite powder (70%). This mixture was thoroughly
mixed in an agate mortar for about 30 minutes and packed into a homemade Teflon cavity
having a current collector and is polished by rubbing on a soft paper.
3. RESULTS AND DISCUSSION
3.1. X-Ray Diffraction study
Fig. 2 shows the XRD pattern of Ag nanoparticles confirms the crystalline characteristics.
The diffraction peaks at angles 38.1°, 44.5° and 64.6° corresponds to facets (1 1 1), (2 0 0) and
(2 2 0) respectively of the face centered cubic crystal structure. Among all the planes (1 1 1)
plane is more intense and hence its width can be used to calculate the average crystal grain
size using Scherer formula and it is found to be ∼10 nm. With respect to XRD figure, among
all the Bragg’s peaks, two more but yet to be assigned peaks are there and are marked with
stars. These unassigned peaks are due to the crystallization of bioorganic phase present in
plant and it was reported by Shankar et al. [38] in Ag nanoparticles synthesized using
geranium leaf extract. The intensities and positions of peaks are in good agreement with the
reported values of Joint Committee of Powder Diffraction Standard (JCPDS) file.
Fig.2. XRD of as prepared Ag nanoparticles
Anal. Bioanal. Electrochem., Vol. 5, No. 4,, 2013, 455 - 466 459
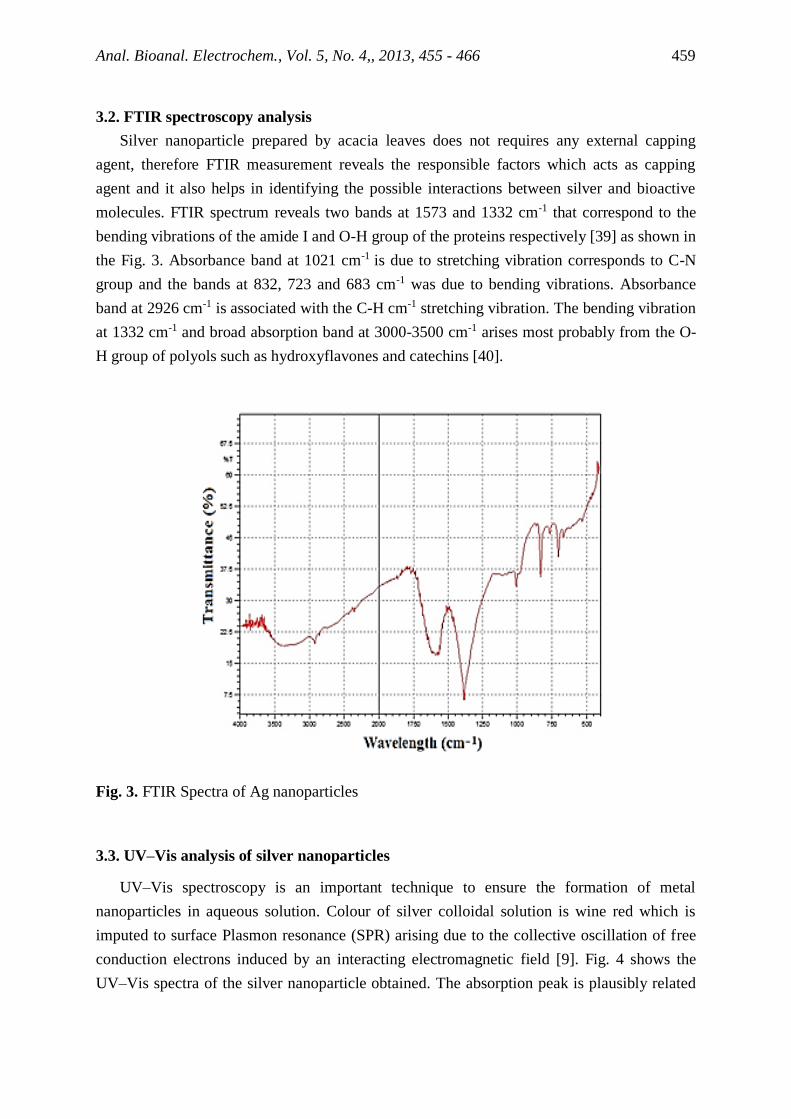
3.2. FTIR spectroscopy analysis
Silver nanoparticle prepared by acacia leaves does not requires any external capping
agent, therefore FTIR measurement reveals the responsible factors which acts as capping
agent and it also helps in identifying the possible interactions between silver and bioactive
molecules. FTIR spectrum reveals two bands at 1573 and 1332 cm-1 that correspond to the
bending vibrations of the amide I and O-H group of the proteins respectively [39] as shown in
the Fig. 3. Absorbance band at 1021 cm-1 is due to stretching vibration corresponds to C-N
group and the bands at 832, 723 and 683 cm-1 was due to bending vibrations. Absorbance
band at 2926 cm-1 is associated with the C-H cm-1 stretching vibration. The bending vibration
at 1332 cm-1 and broad absorption band at 3000-3500 cm-1 arises most probably from the O-
H group of polyols such as hydroxyflavones and catechins [40].
Fig. 3. FTIR Spectra of Ag nanoparticles
3.3. UV–Vis analysis of silver nanoparticles
UV–Vis spectroscopy is an important technique to ensure the formation of metal
nanoparticles in aqueous solution. Colour of silver colloidal solution is wine red which is
imputed to surface Plasmon resonance (SPR) arising due to the collective oscillation of free
conduction electrons induced by an interacting electromagnetic field [9]. Fig. 4 shows the
UV–Vis spectra of the silver nanoparticle obtained. The absorption peak is plausibly related

Anal. Bioanal. Electrochem., Vol. 5, No. 4,, 2013, 455 - 466 460
to the electronic transition taking place from valence band to the conduction band. Peak at
435 nm attribute to the formation of silver nanoparticles.
Fig. 4. Shows the UV–Vis spectra of the silver colloids obtained after 15 min of reaction
3.4. Zeta-potential analysis
Zeta-potential is the electrical potential developed at the solid–liquid interface in response
to the relative movement of the nanoparticle and the solvent. In order to study the zeta-
potential, the prepared silver nanoparticles were dispersed in double distilled water. The
stability of nanoparticles depends upon the electrical potential and the surface charge; hence
it is very important to know them. The surface potential of charged particle increases with
increase in zeta potential. The zeta potential of prepared silver nanoparticle is -25.8 mV as
shown in the Fig. 5.
3.5. Simultaneous determination of UA and DA using different concentrated silver
nanoparticle /CPE
Simultaneous oxidation of both UA and DA was using carried out Ag nanoparticle /CPE
in presence of PBS solution of pH 7.0 at a scan rate 100 mVs-1 using cyclic voltammetric
technique. The Ag nanoparticle as modifiers enhances both the peaks of UA and DA as
shown in the Fig.6a. Out of 10, 20, 30, 40, and 50 µl of silver nanoparticle, maximum
oxidation peak current for 30 µl was obtained as shown in Fig. 6b plot of anodic peak current
of UA and DA against concentration of Ag nanoparticles. Therefore 30 µl of silver
nanoparticle/CPE was used for the determination of UA and DA simultaneously. UA and DA
oxidize at an anodic peak potential of 314.8 mV and 205.1 mV respectively. Silver

Anal. Bioanal. Electrochem., Vol. 5, No. 4,, 2013, 455 - 466 461
nanoparticle/ CPE show an enhancement of current signals for the oxidation of both UA and
DA (solid line) when compare with bare CPE (dashed line) shown in the Fig. 6a.
Fig. 5. Zeta potential of as prepared Ag nanoparticles
Fig. 6. (a) Cyclic voltammogram of BCPE and Ag nanoparticle MCPE for dopamine and uric
acid (b) Plot of the concentration variation of silver nanoparticles from 10 to 50 µl vs. Anodic
peak current at 0.1 V s-1 to determine dopamine

Anal. Bioanal. Electrochem., Vol. 5, No. 4,, 2013, 455 - 466 462
3.6. Effect of scan rate
Cyclic voltammograms of UA and DA were registered simultaneously for different scan
rates. Fig.7a shows scan rate has a great effect on the peak current of UA and DA using 30µl
of Ag nanoparticle/ CPE. The anodic peak currents of both UA and DA were increased with
increase in scan rate from 100 to 700 mVs-1. A plot of anodic peak current (Ipa) of UA and
DA vs. square root of scan rate showed linear relationship as shown in Fig.7b. The correlation
co-efficient of UA and DA were found to be 0.9997 and 0.9998 respectively. These results
showed the electrode reaction process was diffusion controlled.
Fig. 7. (a) The effect of scan rate on cyclic voltammogram of BCPE and Ag nanoparticle
MCPE of dopamine and uric acid (b) Graph of peak current vs. square root of scan rate of
dopamine and uric acid
3.7. Effect of concentration variation of UA in presence of DA
The concentration effect of UA in presence of DA was studied at Ag nanoparticle/ CPE in
phosphate buffer solution of pH 7.0 at a scan rate of 100 mVs-1. Fig. 8a shows cyclic
voltammetry peak current increases with increasing the concentration from 20 to 140 µM of
UA and keeping the DA concentration (50 µM) constant and graph of anodic peak versus
concentration of UA shows straight line with correlation coefficient of 0.9851 is shown in the
Fig. 8b.

Anal. Bioanal. Electrochem., Vol. 5, No. 4,, 2013, 455 - 466 463
Fig. 8. (a) Cyclic voltammograms obtained for different concentration of uric acid (20 µM to
140 µM) and with constant dopamine concentration (50 µM) in PBS of pH 7 at scan rate 100
mVs-1 (b) Graph of concentration of the uric acid and dopamine vs anodic peak current
3.8. Antibacterial activity
Silver nanoparticles were synthesized using biological method and shows good
antibacterial activity. Synthesized Ag nanoparticle antibacterial assay is aimed to just check
the antibacterial activity of nanoparticles rather than to find minimum inhibitory
concentrations as shown in the Fig. 9a, 9b and 9c of E.coli, Bacillus subtilis and
Staphylococcus aureus respectively.
Fig. 9. Antimicrobial activity of silver nanoparticles on (a) E.coli (b) Bacillus subtilis and
(c) Staphylococcus aureus
Anal. Bioanal. Electrochem., Vol. 5, No. 4,, 2013, 455 - 466 464
The method adopted was Escherichia coIi, Bacillus subtilis, Staphylococcus aureus were
considered for checking the antibacterial activity. Glycerol stocks of these cultures were sub
cultured in LB agar (2% agar) and incubated overnight to make the cultures viable.
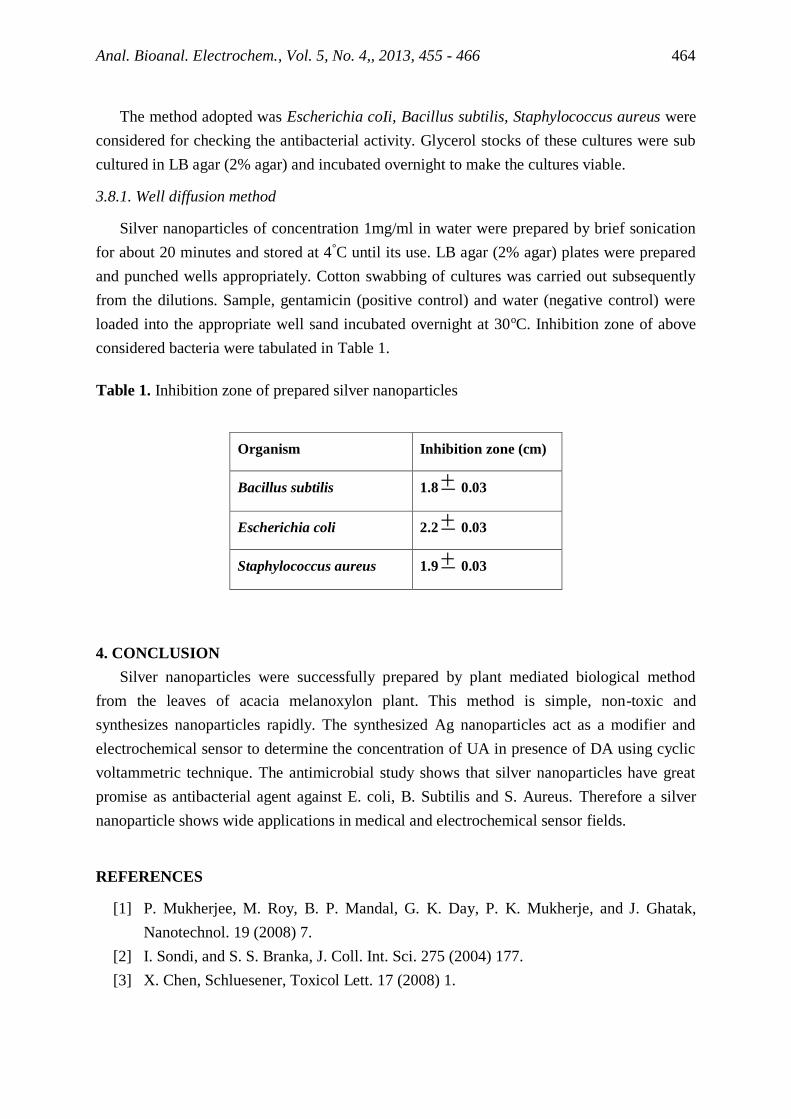
3.8.1. Well diffusion method
Silver nanoparticles of concentration 1mg/ml in water were prepared by brief sonication
for about 20 minutes and stored at 4°C until its use. LB agar (2% agar) plates were prepared
and punched wells appropriately. Cotton swabbing of cultures was carried out subsequently
from the dilutions. Sample, gentamicin (positive control) and water (negative control) were
loaded into the appropriate well sand incubated overnight at 30oC. Inhibition zone of above
considered bacteria were tabulated in Table 1.
Table 1. Inhibition zone of prepared silver nanoparticles
Organism Inhibition zone (cm)
Bacillus subtilis 1.8 0.03
Escherichia coli 2.2 0.03
Staphylococcus aureus 1.9 0.03
4. CONCLUSION
Silver nanoparticles were successfully prepared by plant mediated biological method
from the leaves of acacia melanoxylon plant. This method is simple, non-toxic and
synthesizes nanoparticles rapidly. The synthesized Ag nanoparticles act as a modifier and
electrochemical sensor to determine the concentration of UA in presence of DA using cyclic
voltammetric technique. The antimicrobial study shows that silver nanoparticles have great
promise as antibacterial agent against E. coli, B. Subtilis and S. Aureus. Therefore a silver
nanoparticle shows wide applications in medical and electrochemical sensor fields.
REFERENCES
[1] P. Mukherjee, M. Roy, B. P. Mandal, G. K. Day, P. K. Mukherje, and J. Ghatak,
Nanotechnol. 19 (2008) 7.
[2] I. Sondi, and S. S. Branka, J. Coll. Int. Sci. 275 (2004) 177.
[3] X. Chen, Schluesener, Toxicol Lett. 17 (2008) 1.

Anal. Bioanal. Electrochem., Vol. 5, No. 4,, 2013, 455 - 466 465
[4] J. L. Gardea-Torresdey, J. G. Parsons, E. Gomez, J. Peralta Videa, H. E. Troiani, and
P. Santiago, Nano. Lett. 2 (2002) 397.
[5] J. L. Gardea-Torresdey, E. Gomez, J. Peralta Videa, J. G. Parsons, H. E. Troiani, and
J. Yacaman. Langmuir 13 (2003) 1357.
[6] S. P. Chandran, M. Chaudhary, R. Pasricha, A. Ahmad, and M. Sastry, Biotechnol.
Prog. 22 (2006) 577.
[7] J. Huang, Q. Li, D. Sun, Y. Lu, Y. Su, and X. Yang, Nanobiotechnol. 18 (2007)
105104.
[8] B. Ankamwar, D. Chinmay, A. Absar, and S. Murali, J. Nanosci. Nanotechnol. 10
(2005) 1665.
[9] D. Jain, H. K. Daim, S. Kachhwaha, and S. L. Kotharia, Dig. J. Nanomater. Bios. 4
(2009) 723.
[10] R. Alfredo, V. Nestor, V. S. Mendieta, A. Marco, C. López, M. Rosa, G. Espinosa, A.
Miguel, C. López, A. Jesús, and A. Alatorre, Mater. Lett. 62 (2008) 3103.
[11] H. Bar, D. Kr. Bhui, G. P. Sahoo, P. Sarkar, S. P. De, and A. Misra. Colloids Surf. A
Physicochem. Eng. Asp. 339 (2009) 134.
[12] B. Ankamwar, M. Chaudhary, and S. Murali, Synth. React. Inorg. Metal. Org.
Nanometal. Chem. 35 (2005) 19.
[13] M. Syed, U. Ali, N. H. Alvi, Z. Ibupoto, O. Nur, M. Willander, and B. Danielsson,
Sens. Actuators B Chem. 152 (2011) 241.
[14] J. C. Chen, H. H. Chung, C. T. Hsu, D. M. Tsai, A. S. Kumar, and J. M. Zen, Sens.
Actuators B Chem. 110 (2005) 364.
[15] I. D. P. Wootton and H. Freeman, Microanalysis in Medical Biochemistry,sixth ed.,
Churchill Livingstone, New York (1982)
[16] E. Liberopoulos, D. Christides, and E. Moses, J. Hypertension 20 (2002) 347.
[17] F. A. Mateos, and J. G. Puig, J. Inherit. Metab. Dis. 17 (1994) 138.
[18] R.J. Johnson, D. K. Kang, D. Feig, S. Kivlighn, J. Kanellis, S. Watanabe, K. R.
Tuttle, B. Rodriguez-Iturbe, J. Herrera-Acosta, and M. Mazzali, Hypertension 41
(2003) 1183.
[19] M. Alderman, and K. J. V. Aiyer, Curr. Med. Res. Opin. 20 (2004) 369.
[20] R. M. Wightman, L. J. May, and A. C. Michael, Anal. Chem. 60 (1988) 769.
[21] A. Domenech, H. Garcia, M. T. Domenech-Carbo, and M. S. Galletero, Anal. Chem.
74 (2002) 262.
[22] J. S. N. Dutt, M. F. Cardosi, C. Livingstone, and J. Davis, Electroanalysis 17 (2005)
1233.
[23] S. R. Jayalakshmi, S. S. Kumar, J. Mathiyaraju, K. L. N. Phoni, and V. Yegnaraman,
Indian J. Chem. 46 (2007) 957.
[24] J. M. Zen, A. S. Kumar, and D. M. Tsai, Electroanalysis 15 (2003) 1073.

Anal. Bioanal. Electrochem., Vol. 5, No. 4,, 2013, 455 - 466 466
[25] H.C. Hong, and H. J. Huang, Anal. Chim. Acta 499 (2003) 41.
[26] S. L. Zhao, J. S. Wang, F. G. Ye, and Y. M. Liu, Anal. Biochem. 378 (2008) 127.
[27] I. Koichi, N. Tatsuya, I. Yusuke, Y. Yoshimura, and N. Hiroyuki, J. Chromatogr. B
785 (2003) 57.
[28] T. M. C. C. Filisetti-Cozzi, and N. C. Carpita, Anal. Biochem. 197 (1991) 157.
[29] V. J. Pileggi, D. R. Wybenga, and J. Digiorgi, Clin. Chim. Acta 37 (1972) 141.
[30] B. A. Dilena, M. J. Peake, H. L. Pardue, and J. W. Skoug, Clin. Chem. 32 (1986) 486.
[31] Y. Guan, T. Wu, and J. Ye, J. Chromatogr. B 821 (2005) 229.
[32] H. L. Lee, and S. C. Chen, Talanta 64 (2004) 750.
[33] S. Reddy, B. E. K. Swamy, and H. Jayadevappa, Electrochim. Acta 61 (2012) 78.
[34] S. Reddy, B. E. K. Swamy, H. N. Vasan, and H. Jayadevappa. Anal. Met. 4 (2012)
2778.
[35] S. Reddy, B. E. K. Swamy, B. N. Chandrashekar, S. Chitravathi, and H. Jayadevappa.
Anal. Bioanal. Electrochem. 4 (2012) 186.
[36] S. Reddy, B. E. K. Swamy, U. Chandra, K. R. Mahathesha, T. V. Sathish, and H.
Jayadevappa, Anal. Met. 3 (2011) 2792.
[37] S. Reddy, B. E. K. Swamy, U. Chandra, B. S. Sherigara, and H. Jayadevappa, Int. J.
Electrochem. 5 (2010) 10.
[38] S. Reddy, B. E. K. Swamy, S. Aruna, M. Kumar, R. Shashanka, and H. Jayadevappa,
Chem. Sens. 2 (2012) 1.
[39] S. S. Shankar, A. Ahmad, and M. Sastry, Biotechnol. Prog. 19 (2003) 1627.
[40] N. Jain, A. Bhargava, S. Majumdar, J. C. Tarafdarb, and J. Panwar, Nanoscale 3
(2011) 635.
Copyright © 2013 by CEE (Center of Excellence in Electrochemistry)
ANALYTICAL & BIOANALYTICAL ELECTROCHEMISTRY (http://www.abechem.com)
Reproduction is permitted for noncommercial purposes.