synthesis and characterization of low softening point...
TRANSCRIPT

1
Synthesis and characterization of low softening point high Bi2O3 glasses in the K2O-B2O3-Bi2O3 system
Shiv Prakash Singh, Basudeb Karmakar*
Glass Science and Technology Section, Glass Division, Central Glass and Ceramic Research Institute (Council of Scientific and Industrial Research), 196, Raja S.C. Mullick Road, Kolkata 700032, India
_______________________________________________________________________ Abstract
Synthesis of a new series of lead free low softening point (<470oC) high Bi2O3
(40-90 mol %) glasses in the K2O-B2O3-Bi2O3 system by the melt-quench technique has
been demonstrated here. Their structural, optical, thermal, electrical and other physical
properties have been evaluated by X-ray diffraction (XRD), transmission electron
microscopy (TEM), field emission scanning electron microscopy (FESEM), Fourier
transformation infrared reflection spectroscopy (FTIRR), UV-Visible spectroscopy,
dilatometer, LCR meter, etc. techniques. The glass softening point, glass transition
temperature and glass deformation temperature are found to vary in the ranges 410-
465oC, 354-409oC and 376-427oC respectively which are found to correlate well with the
boron anomaly phenomenon (as revealed by FT-infrared reflection spectroscopy) with
gradual addition of Bi2O3 in the glass matrix. The coefficient of thermal expansion shows
a decreasing trend from 153 down to 109 x 10-7 K-1 whereas the dielectric constant
increases from 21 to 34 with the increase in Bi2O3 content. The theoretical optical
basicity is found to increase from 0.93 to 1.15 while the optical band gap decreases from
2.86 down to 2.30 eV with the addition of Bi2O3. The formation of metallic bismuth in
these glasses during melting in air has been confirmed by the X-ray diffraction,
transmission electron microscopy, selected area electron diffraction (SAED) and high
resolution transmission electron microscopy (HRTEM) analyses. The formation of Bi2O3
rich secondary phase in the glasses and their particle size distribution has been examined
by the field emission scanning electron microscopy photomicrograph analysis.
Keywords: Amorphous materials; Optical properties; Thermal expansion; X-Ray diffraction; Transmission electron microscopy ______________________________________________________________ *Corresponding author. Tel.: +91 - 33 2473 3496: fax: +91 - 33 2473 0957. E-mail: [email protected] (B. Karmakar).

2
1. Introduction
Recently, glasses containing bismuth have attained great attention, since they are
used in the wide area of applications. The obtained glasses are characterized by high
density, high refractive index and high dielectric constant properties. Hence there has
been an increasing interest in the synthesis, microstructure and physical properties of
heavy metal oxide (HMO) glasses containing bismuth as a major component. Bismuth
oxide (Bi2O3) based glasses for their high polarizability has fascinated much attention of
glass researchers because of their nonlinear optical properties which have importance for
the development of optical information processing technology [1-3]. For this purpose,
glasses of higher optical nonlinearity have to be found or designed on the basis of
correlation of the optical nonlinearity with some other electronic properties which are
easily understandable and accessible. Therefore, many studies on their structure and
optical properties have been carried out. It has been found that glasses containing a large
amount of Bi2O3 possess a wide range of infrared transparency [4-6]. Lead oxide is
widely used as a component in the low melting glasses. But due to its hazardous effect on
health and environment, it is being eliminated from various applications [7, 8]. In this
context, bismuth oxide is a suitable substitute of lead oxide for its isoelectronic
properties. Therefore, bismuth glasses are very useful for exploiting as lead-free high
density radiation shielding window (RSW) glasses, as lead-free low-softening point
dielectric glasses for plasma display panel, thick film conductors, sealing glasses for
metals, etc. [7,8].
In addition to these, bismuth oxide glasses are very stable hosts for obtaining
efficient luminescence in rare-earth ions. Recently, bismuth oxide glasses have attracted

3
much attention because of their low phonon energy. The quantum efficiency of emission
from a given level strongly depends on the phonon energy of the host medium, it can be
predicted that the nonradiative loss to the lattice vibration will be small and the
fluorescence quantum efficiency will be high in bismuth oxide glasses. All these
applications indicate the need of a basic understanding of the relationship among the
electronic polarizability, optical basicity and optical properties of the bismuth oxide
glasses.
Bismuth oxide cannot be considered as a glass network former due to small field
strength (0.53) of Bi3+ ion. However, in combination with B2O3 glass former it is possible
to obtain glasses in a relatively large compositional range. A survey of literature shows
that there are many reports available on ternary bismuth borate glasses [9-14]. Saddeek
[15] has reported about Li2O-Bi2O3-B2O3 glass system. In this paper, we demonstrate the
physical, structural, optical, thermal and electrical properties of a new series of glasses of
high Bi2O3 content (40-90 mol %) in the K2O-B2O3-Bi2O3 system.
2. Experimental Procedure
Bismuth trioxide, Bi2O3 (99%, Loba Chemie), boric acid, H3BO3 (99.5%, Loba
Chemie) and potassium carbonate, K2CO3 (99.9%, Loba Chemie) were used as raw
materials to prepare the glasses. The glass batch for 25 g glass of composition (100-x)(
K2O-B2O3)-xBi2O3 (mol %) (where x = 10, 20. 30, 40, 50, 60, 70, 80 and 90) was melted
at 1100oC in air for 30 min with intermittent stirring for 0.5 min in a 25 ml high purity
silica crucible in an electrical furnace. The molten glass was cast into a carbon plate and
annealed at 320oC for 2h to release the internal stresses.
4
The softening point (Ts) of the samples was measured by a glass softening point
system (Harrop/Labino, Model SP-3A) with an accuracy of +1oC. The instrument was
previously calibrated with a NBS (National Bureau of Standards, USA) standard glass of
known softening point. The coefficient of thermal expansion (CTE), glass transition
temperature (Tg) and glass deformation temperature (Td) of the cylindrical shaped glasses
were measured with an accuracy of +0.2% using a horizontal-loading dilatometer
(Netzsch, Model DIL 402 PC) after calibration with a standard alumina supplied with the
instrument by the manufacturer. The coefficient of thermal expansion in the temperature
range 50-300oC is reported here. The dielectric constant was measured with an accuracy
of +0.5% at a frequency of 1MHz using a LCR meter (Hioki, Model 3532-50 LCR
Hitester) at 25oC. The instrument was calibrated previously by a Suprasil-W silica glass
( = 3.8). X-ray diffraction data of powder samples were recorded using an XPERTPRO
diffractometer (PANalytical) with 2 varying from 10o to 80o using Ni filtered CuK (
= 1.5406 Å) at 25oC, generator power of 45 KV and 35 mA. Fourier transformation
infrared reflection (FTIRR) spectra of polished glasses were recorded a by Perkin-Elmer
Fourier transformation infrared reflection spectrometer (Model 1600) at a resolution of +
2 cm-1 after 16 scans. The transmission electron microscopy (TEM) and selected area
electron diffraction (SAED) images were taken using a FEI instrument (Tehnai-30, ST
G2) operating at an accelerating voltage of 200 kV. Field emission scanning electron
microscopy (FESEM) photomicrographs were recorded with a Gemini Zeiss Supra™
35VP Model (Carl Zeiss) instrument using an accelerating voltage of 4.9 kV. The sample
was prepared for field emission scanning electron microscopy experiment by etching in 2
wt% of HF solution for 1 minute. The UV-Vis absorption spectra in the range of 300-

5
1100 nm were recorded using 2mm thickness of sample with a double beam UV-visible
spectrophotometer (Lambda 20, Perkin-Elmer) at an error of +0.1 nm.
3. Results
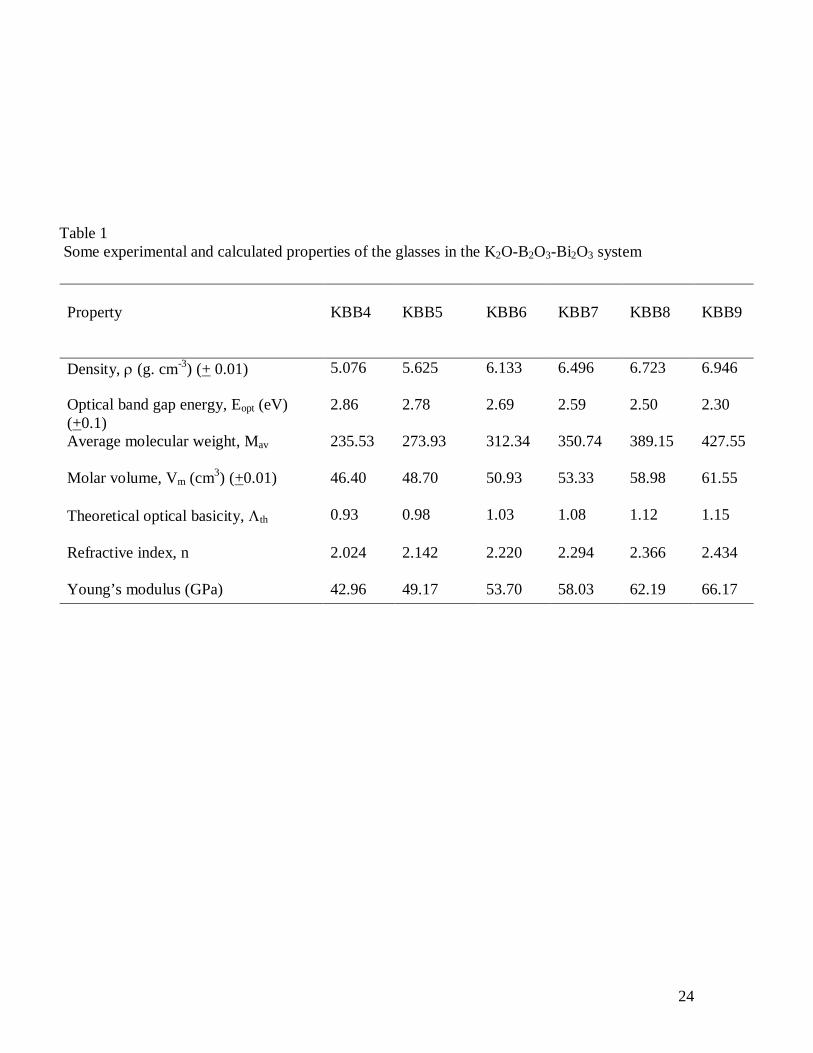
3.1. Physical parameters
The samples containing 10, 20 and 30 mol% of Bi2O3 were not stable enough due
to absorption of moisture from the environment, so characterizations of these samples
were not possible. The other samples were prepared by cutting, grinding and polishing
for various characterization measurements in various shapes. The glasses are labeled as
KBB4, KBB5, KBB6, KBB7, KBB8 and KBB9 for x = 40, 50, 60, 70, 80 and 90 mol %
of Bi2O3 content respectively.
The densities () of the glass samples were determined by the standard
Archimedes principle. The measurements were done using single pan balance and
distilled water as an immersion liquid. The density was obtained from the relation.
= ax / (a-b) (1)
where a is the weight of the glass sample in air, b is the weight of the glass sample when
suspended in distilled water (density of water, x = 1g. cm-3).
The molar volume (Vm) of the glass samples was calculated using the molecular
weight (M) and density () of the glasses with the following relation and these values are
also included in Table 1.
Vm = M/ (2)

6
The variation of density with the composition of Bi2O3 is shown in Table 1. It is
evident from Table 1 that the density and molar volume of the glasses increase with
increase in Bi2O3 content.
The refractive index (n) and Young’s modulus were predicted using SciGlass
(Glass Properties Information System, Version 6.7) software and these values are also
listed in Table 1. Both these properties are found to increase with the increase in Bi2O3
content.
3.2. Optical transmission and absorption
Fig. 1 (a) shows the optical transmission spectrum of some glasses of the KBB
system. The transmission of the glasses decreases with increase of Bi2O3 content. Figure
1 (b) shows the optical absorption bands of the glasses. Their surface plasmon resonance
(SPR) absorption bands are also shown in the inset of Fig. 1 (b). The absorption
coefficient, near the edge of each curve was determined by using the following relation
[16]
= 2.303A/ t (3)
where A is absorbance and t is thickness of each sample. The relation between and
photon energy of the incident radiation, h is given by the following equation [12].
= B (h - Eopt)2/ h (4)
where B is the constant and Eopt is the energy of the optical band gap. The relation (4) can
be written as
(h)1/2 = B(h - Eopt) (5)

7
Using the relation (5) the optical band gap values were determined by the extrapolation of
the linear region of the plots of (h) 1/2 against h. The values of Eopt thus obtained for
all the glasses are given in the Table 1 and also shown in Fig. 2.
3.3. Theoretical optical basicity
The theoretical optical basicity (th) for the glass system under study has been
calculated using the following relation [15-17].
th = X(K2O) (K2O) + X(Bi2O3) (Bi2O3) + X(B2O3) (B2O3) (6)
where X(K2O), X(Bi2O3) and X(B2O3) are the equivalent fraction of the different oxides,
i.e. the proportion of the oxide atom that contributes to the glass system; (K2O),
(Bi2O3) and (B2O3) are the optical basicity values of the constituent oxides. Here the
values of (K2O) = 1.4, (Bi2O3) = 1.19, (B2O3) = 0.425 have been taken from the
literature [18]. The calculated values of th are presented in Table 1.
3.4. X-ray diffraction (XRD) pattern
Figure 3 shows the X-ray diffraction patterns of characteristic crystalline phases
in KBB5 and KBB9 glass samples. The XRD peaks are not well resolved and are depict
at 2θ = 12.49o, 27.53o and 28.50o.
3.5. Transmission electron microscopy (TEM)
The TEM images of the KBB5 and KBB9 glasses are shown in Figs. 4 and 5
respectively. The average particle size of KBB5 glass is about 5 nm whereas that of
KBB9 glass ranges 5 – 17 nm. Their respective selected area electron diffraction (SAED)

8
patterns show incipient crystalline behavior of the glasses. KBB5 shows <024> hkl plane
and KBB9 depicts <024> and <208> diffraction hkl planes of rombohedral metallic
bismuth (JCPDS File Card No.: 85-1329). The high resolution transmission electron
microscopy (HRTEM) of KBB9 glass reveals <015> hkl planes of rombohedral metallic
bismuth which has been identified from the d-spacing as provided in the JCPDS File
Card No.: 85-1329. The TEM images of KBB9 glass show the presence of spherical as
well as elongated particles in the glasses.
3.6. Field emission scanning electron microscopy (FESEM) micrograph
Figures 6 (a) and (c) show the FESEM micrographs of phase separation in glass
samples KBB5 and KBB9 respectively. The FESEM image of KBB9 reveals the
relatively dense and bigger size particles in comparison to KBB5 glass sample. The
distribution of different size of phase separated particles is shown in the form of
histograms with the respective micrographs in Fig. 6 (b) and (d) respectively. The KBB9
shows wide range of particle size ranges from 30 to 210 nm whereas the sample of KBB5
glass shows the particles of sizes ranges from 30 to 170 nm. The median size of particles
is 80 nm for KBB5 where as it is 90 nm for KBB9. So it is seen that the median particle
size and number of particles per unit area increase with the increase in Bi2O3 content. The
number density of particles per unit area has been calculated for the both samples and
found to be 12,985 and 13,149 particles/μm2 for KBB5 and KBB9 glasses respectively.

9
3.7. FTIRR spectra
The infrared reflection spectra recorded for all the glass samples are shown in the
Fig. 7 (a). The glass samples show bands at 451, 882, 1180 and 1265 cm-1. A shoulder at
around 707 cm-1 is also observed in the glasses. The reflection intensity ratio of BO4 to
BO3 structural units is also demonstrated in the Fig. 7 (b). The values of the ratio of the
two structural units of borate is gradually going down to 60 mol % of Bi2O3 content
(KBB6) and then going up to 90 mol % of Bi2O3 content (KBB9) glasses. This
observation reveals the boron anomaly phenomenon in these glasses.
3.8. Coefficient of thermal expansion (CTE)
The thermal expansion is a very important thermal property of glass. Fig. 8 (a)
shows the linear thermal expansion of the KBB4, KBB7 and KBB9 glasses as a function
of temperature. The variation coefficient of thermal expansion (CTE) of the glasses
measured from 50 to 300oC temperature range is shown in the Fig. 8 (b) as a function of
Bi2O3 content. The CTE values vary from 153 to 109 x 10-7 K-1. The CTE gradually
decreases as Bi2O3 content increases form 40 to 90 mol%. However, these values deviate
from the linearity in Bi2O3 content.
3.9. Softening point, glass transition temperature and deformation temperature
The softening point (Ts), glass transition (Tg) and deformation temperature (Td)
are shown in the Fig. 9. The values of these properties gradually going down as the Bi2O3
content increases from 40 to 60 mol% and further going up with Bi2O3 content increases

10
from 70 to 90 mol%. The (Ts), (Tg) and (Td) are shown the lowest values at 60 mol% of
Bi2O3 content i. e. in glass KBB6.
3.10. Dielectric constant
Dielectric constant () of the glasses have been calculated by using the following
formula [19]
= cd/(0.0885 A) (7)
where c, d and A are capacitance in pico Farad (pF), thickness of glass (in cm) and area of
the dielectric (in cm2) respectively.
It is seen that the dielectric constant of the glasses gradually increases with
increase in Bi2O3 content which is shown in the Fig. 10. Dielectric constant () is
associated with polarizability (p) and refractive index (n) by the following Lorentz-
Lorenz (Eq. 8) and Maxwell equations (Eq. 9) [20].
p = 3Mav (n2 – 1)/4(n2 + 2)NA (8)
= n2 (9)
where NA is the Avogadro’s number, and Mav and are average molecular weight and
density of the glass respectively.
4. Discussion
In this study of K2O-B2O3-Bi2O3 ternary glass system, the replacement of Bi2O3
instead of B2O3 and K2O increases the density. This is attributed to the replacement of
low density oxides (B2O3 and K2O) by high density oxide (Bi2O3) as shown in Table 1.
The molar volume (Vm) of the glasses increases due to increase in bond length or inter

11
atomic spacing. It has happened due to higher ionic radius of Bi3+ (0.102 nm) than that of
B3+ (0.020 nm). Therefore, one can understand that Vm as the volume corresponding
structural unit with its surrounding space will increase by insertion of HMO like bismuth
oxide.
The optical band gap (Eopt) of the samples decrease to lower energies with
increase in Bi2O3 content. It is related to the progressive increase in the covalent Bi-O of
bond strength of 81.9 kcal mol-1 [13]. This increased Bi2O3 content gives rise to possible
decrease in the B-O-B bridging oxygen of borate structural unit. Here it is believed that
as the cation concentration increases which developed the bridging oxygen bonds with
Bi3+ ion and lead to the gradual breakdown of the glass network. This incident seems to
account for the decrease in the Eopt value, which results in the shifting of edge to longer
wavelength with increase in Bi2O3 content from 40 to 90 mol %. Such a decrease in the
values of optical band gap energy can thus be attributed to decrease in the phonon-
assistant indirect transitions.
It is observed from the Table 1 that the theoretical optical basicity (th) values
increases with increase in Bi2O3 content. This may be understood according to Eq. (6). It
is well known that Bi3+ ions are highly polarizable ion [21], so the polarizability of the
glasses is increases with the increase in Bi2O3 content. Therefore, it can be concluded that
the basicity increases with the increase in the polarizability as Bi2O3 content gradually
increases.
The XRD patterns show the peaks for the 012, 116 and 122 Miller planes of the
rhombohedral metallic bismuth phase (JCPDS file no. 01-0699) in the Fig. 3. The
bismuth glasses are dark brown or black colored when at high melting temperature and

12
contain high Bi2O3. Sanz et al. [9] and Zhang et al. [10] have found these crystalline
peaks for metallic bismuth in deep brown colored bismuth glasses which are reduced
during melting process. The reduction reaction can be represented by
Bi2O3 2Bio + 3/2 O2 (10)
The above result also confirmed from the TEM images of KBB5 and KBB9
glasses (Figs. 4 and 5 respectively). It clearly reveals that the KBB9 glass has
homogeneously dispersed Bio nanoparticles (NPs) of spherical shape with bigger size
than that of KBB5 glass. This observation also confirm from the SAED pattern of KBB9
glass which shows the more distinct spots than that of KBB5 glass due to its bigger
particle size. The KBB9 glass also depicts the lattice fringes of metallic bismuth in
HRTEM which is not found in KBB5 glass due to its small size. This formation of more
and bigger particle in KBB9 glass is also supported by the optical transmission spectra
(Fig. 1 (a)). The gradual decrease in transmittance from KBB5 to KBB9 glasses along the
visible spectrum is due to the existence of more metallic bismuth particles dispersed in
the KBB9 glass.
The UV-Vis absorption spectra of bismuth glasses in Fig. 1 (b) show the
absorption bands of the surface plasmon resonance (SPR) of Bio nanoparticles (NPs).
Khonthon et al.[4] has reported the SPR band of Bio NPs at 460 nm, which are
comparable to our results. The absorption bands shift towards higher wavelength with the
increase in Bi2O3 content. The SPR of a metal particle gives an absorbance band centered
at a wavelength, λ, which can be expressed by the relation: [22]

13
λ2 = (2πc)2εo mo (ε∞ + 2n2) / Ne2 (11)
where the velocity of light is c, mo is the particle mass, N is the particle concentration, the
charge of the electron is e, ε∞ is the optical dielectric function of the metal, n is the
refractive index of the host material and εo is the free-space permeability. From the Eq.
11, it is clear that the position and shape of the SPR is determined by the metal dielectric
function, as well as on the size and shape of the particles, refractive index of the host
materials and concentration of particles. The SPR band of Bio NPs in the host water
(refractive index, n = 1.33) was observed around 400 nm [23] whereas here the glasses
having higher refractive index (2.02 – 2.43) show a red shift towards higher wavelength
of the band. The two spectrally separated absorption bands of glasses (Fig. 1 (b)) indicate
that the two groups of size (small and large) and shape (elongated) of particles are present
in the glasses. These findings can be correlated well with the TEM images (Figs. 4 and
5) where both small and big size particles are present. Fig. 5 shows the presence of some
spherical as well as elongated shaped particles in the glass. The spherical particles
generate a single SPR band, which is located in the visible range, whereas elongated
particles give rise to two spectrally separated SPR bands corresponding to transverse and
longitudinal electron oscillations with respect to major axis [24].
Fig. 6 shows the FESEM micrograph of KBB5 and KBB9 glasses. These
micrographs indicate the phase separation in the glass. Scholze [20] has explained this
type of phase separation is a very common phenomenon in the glass because during
melting process all components are in liquid phase. During quenching any of the

14
components get supersaturation state and form a separated secondary phase. Porai-
Koshits et al. [25], W. Vogel et al. [26], James et al. [27] and MacDowell et al. [28] have
worked on the phase separation in various glasses. Porai-Koshits et al. [25] have report
about such fine structure of sodium silicate glasses arises due to the secondary phase
separation from a primary separated phase take place as a result of over saturation under
the lowering of temperature during the process of quenching. W. Vogel et al. [26] has
done electron microscopical studies of phase separated glasses. MacDowell et al. [28] has
observed metastable glass in glass separation on rapid quenching of Al2O3-SiO2 glass
melt. Here in this study, Fig. 6 depicts the secondary phase in the K2O-Bi2O3-B2O3 glass
system. During etching process by HF solution at the time of sample preparation for the
FESEM experiment the B2O3 and K2O were rapidly dissolved. Therefore the observed
micro images are due to Bi2O3 rich phase. This can also be concluded from the evidence
of increasing the number of particles in the observed micrograph images with the Bi2O3
content.
Bi2O3 containing glasses have fundamental vibrations in the IR spectral regions at
around 480, 715 and 880 cm-1 [29, 30]. Boron also has three vibrational bands at 1200-
1600, 800-1200 and 700 cm-1 [29-34]. The boron-oxygen network can be in the form of
planar BO3 or tetrahedral BO4. The Fig. 7 (a) shows reflection bands at 451 cm-1, specific
to the vibrations of Bi–O bonds in BiO6 octahedral units [29, 30]. The absorption band at
707 cm-1 has been assigned to symmetric stretching vibrations of Bi–O bonds in BiO3
pyramidal units [29, 30]. The band at 882 cm-1 is due to stretching vibration of the B–O
bonds in tetrahedral BO4 unit and the broad band at 1180 and 1265 cm-1 is attributed to
the B–O bond stretching in the planar BO3 unit in the borate network [29-34]. This

15
bifurcation is due to the bridging of BO3 with K-O and Bi-O units. This bifurcation
gradually weakens with the increase in the content of Bi2O3 which indicates the major
bridging of BO3 unit with the Bi-O. From Fig. 7 (a), it seen that the Bi2O3 act as modifier
at lower concentration and modify the glass structure by breaking the B-O bond and form
the Bi-O of the BiO3 unit which exhibited the band at 707 cm-1. But at higher
concentration of Bi2O3, it acts as a glass former and form Bi-O of BiO6 octahedral units.
Fig. 7 (b) shows the variation of BO4 and BO3 structural units of borate which indicates
the tetrahedral BO4 decreases upto KBB6 and further increases at higher concentration of
Bi2O3. Scholze [20] has explained this anomaly property of boron due to shifting of
coordination number (CN) from BO4 (CN = 4) to BO3 (CN = 3) and again to BO4
structural units. The planar structure of BO3 group weakens the glass network whereas
tetrahedral BO4 unit strengthen the network. Duffy [17] has also reported the major
structural changes in certain properties due to boric oxide anomaly.
The thermal expansion of glasses is controlled by the asymmetry of the amplitude
of thermal vibrations in the glass. It decreases as the rigidity of the glass network
increases [35]. An increase of the number of non-bridging bonds weakens the structure
which is turn increases the coefficient of thermal expansion, whereas the change in
coordination number of network former cation may cause either its increase or decrease
depending on the effect on glass structure. In this study, coefficient of thermal expansion
gradually decreases with the increase in the Bi2O3 content in the glasses which is shown
in the Fig. 8 (a). Here the Bi3+ substituting B3+ form the BiO6 octahedral units with
coordination number six. Therefore, the coordination number of cation has changed from
4 or 3 (BO4 or BO3 structural unit) to 6 (BiO6 structural unit). The anomaly tendency of

16
the thermal expansion shown by dotted line in Fig. 8 (b). This could also be well
correlated with the ratio of BO4 to BO3 structural unit formation (see Fig. 7 (b)).
Fig. 9 shows softening point (Ts), glass transition temperature (Tg) and glass
deformation temperature (Td) decreases from 40 to 60 mol% and subsequently increase
with higher concentration of Bi2O3. The Bi2O3 act as a glass network modifier at low
concentration where as it form network by itself at high concentration [13]. The decrease
in the values of above properties is due to the increase in number of non-bridging
oxygens (NBOs) atoms with the increasing concentration of Bi2O3. Addition of lower
concentration of Bi2O3 as a third component into the binary potassium borate glasses
results in splitting of K-O-K and B-O-B bonds and hence the bridging oxygens (BOs) are
converted into NBOs. Further addition of Bi2O3 into glass opens up the glass network.
This results in weakening of the glass network. Hence the softening point, glass transition
temperature and glass deformation temperature decrease up to 60 mol % of Bi2O3 content
as shown in the Fig. 9. It is obvious that the decreases in the above values are due to
increase in the number of Bi-O which are weaker than B-O linkages. It may be noted that
the bond strength of Bi-O is 81.9 kcal mol-1 which is less than that of B-O (192.7 kcal
mol-1) [13]. But the values of Ts, Tg and Td further increases at higher concentration (70
to 90 mol %). Here it can be noted that at higher concentration, Bi2O3 acts as a glass
network former by reshuffling the glass network. It form Bi-O bond of BiO6 octahedral
unit and again rebuild the structure by Bi-O-Bi, hence the rigidity of the glasses
increases. Therefore, the values of above properties increase at higher concentration of
Bi2O3. These phenomena correlate well with the ratio of IBO4/IBO3 as shown in Fig. 7 (b)
which shows the boron anomaly property in these glasses as well.

17
The dielectric constant is directly correlated with the polarizability of the samples.
The dielectric constant gradually increases with the increase in the Bi2O3 content in the
glasses which is shown in the Fig. 10. It has already been reported that Bi3+ ions are
highly polarizable (above 3 A˚3) due to their large ionic radii and small cation unit field
strength [13, 21]. The observation made from Table 1 is that the refractive index also
increases with the increase of bismuth oxide content. Eqs. 9 and 10 also disclose the
increasing trend of dielectric constant with increase in Bi2O3 content. This is due to the
high ionic refraction of Bi3+ ion (30.5) [36].
5. Conclusions
The effect of the Bi2O3 content on the properties of the glasses in the K2O- B2O3-
Bi2O3 system has been investigated here. The densities and molar volume of the glasses
increase due to the incorporation of Bi2O3. The transmission and optical band gap energy
going down as bismuth oxide content increases. The SPR bands, XRD patterns, TEM
images and SAED confirm the formation of nanometal of bismuth during melting. They
also reveal that the metallic bismuth particle size gradually increases at higher Bi2O3 in
the glass composition. The TEM images revealed that the particles are present in the
glasses are both in small and big sizes having spherical as well as elongated shape. This
is also supported by SPR absorption bands which show two spectrally separated bands.
The FESEM microstructure of the glasses shows the bismuth oxide rich secondary phase
separation in the glass. Addition of Bi2O3 in the glass facilitates the formation of BiO6
octahedral unit by replacing B-O bond. The glasses exhibit the boron anomaly
phenomena. The decrease in the values of glass softening temperature, glass transition

18
temperature and glass deformation temperatures from 40 to 60 mol % of Bi2O3 indicates
that the glass network becomes less tightly packed due to formation of nonbridging
oxygen. But these values are further increased with Bi2O3; this reveals the role of Bi2O3
as a glass network former at its higher concentration. These results correlate well with the
FTIRRS reflection intensity ratio of the BO4 to BO3 structural units. The basicity and
polarization of the samples have increased with the bismuth oxide content which causes
the increase in dielectric constant. This rise in the dielectric constant is also correlated
well with the increase in refractive index of the glasses. We believe that this work will
create new prospect in the area of lead-free low-softening point glasses.
Acknowledgements
SPS express his sincere gratitude to the financial support of the Council of
Scientific and Industrial Research (CSIR), New Delhi in the form of CSIR-SRF under
sanction number 31/15(78)/2010-EMR-I. The authors thank Prof. Indranil Manna,
Director of the institute for his kind permission to publish this paper. The technical
supports obtained from the infrastructural facilities (XRD and Electron Microscope
Divisions) of this institute are also thankfully acknowledged.
References
[1] Zhou S, Jiang N, Zhu B, Yang H, Ye S, Laksminarayana G, Hao J, Qiu J.
Multifunctional bismuth-doped nanoporous silica glass: from blue-green, orange,
red, and white light sources to ultra-broadband infrared amplifiers. Adv Funct
Mater 2008; 18: 1407.

19
[2] Meng X, Qiu J, Peng M, Chen D, Zhao Q, Jiang X, Zhu C. Infrared broadband
emission of bismuth-doped barium-aluminum-borate glasses. Optics Exp 2005; 13:
1635.
[3] Wang Y, Dai S, Chen F, Xu T, Nie Q. Physical properties and optical band gap of
new tellurite glasses within the TeO2–Nb2O5–Bi2O3 system. Mater Chem Phys 2009;
113: 407.
[4] Khonthon S, Morimoto S, Arai Y, Ohishi Y. Redox equilibrium and NIR
luminescence of Bi2O3-containing glasses. Opt Meter 2009; 31: 1262.
[5] Peng M, Chen D, Qui J, Jiang X, Zhu C. Bismuth doped zinc aluminosilicate glasses
and glass-ceramics with ultra-broadband infrared luminescence. Opt Mater 2007;
29: 556.
[6] Ren J, Dong G, Xu S, Bao R, Qiu J. Inhomogeneous broadening, luminescence origin
and optical amplification in bismuth-doped glass. J Phys Chem A 2008; 112: 3036.
[7] An J-S, Park J-S, Kim J-R, Hong KS. Effects of Bi2O3 and Na2O on the thermal and
dielectric properties of zinc borosilicate glass for plasma display panels. J Am
Ceram Soc 2006; 89: 3658.
[8] Hrovat M, Maeder T, Holc J, Belaviˇc D, Cilenˇsek J, Bernard J. Subsolidus phase
equilibria in the RuO2–Bi2O3–SiO2 system. J Euro Ceram Soc 2008; 28: 2221.
[9] Sanz O, Haro-Poniatowski E, Gonzalo J, Navarro JMF. Influence of the melting
conditions of heavy metal oxide glass contaning bismuth oxide on their optical
absorption. J Non-Cryst Solids 2006; 352: 761.
[10] Zhang Y, Yang Y, Zheng J, Hua W, Chen G. Effects of oxidizing additives on
optical properties of Bi2O3-B2O3-SiO2 glasses. J Am Ceram Soc 2008; 91: 3410.

20
[11] Sun H, Wen L, Xu S, Dai S, Hu L, Jiang Z. Novel Litthium-Barium-Lead-Bismuth
Glasses. Mater Lett 2005; 59: 959.
[12] Lee S, Hwang S, Cha M, Shin H, Kim H. Role of copper ion in preventing silver
nanoparticles forming in Bi2O3-B2O3-ZnO glass. J Phys Chem Solids 2008; 69:
1498.
[13] Saritha D, Markandeya Y, Salagram M, Vithal M, Singh AK, Bhikshamaiah G.
Effect of Bi2O3 on physical, optical and structural studies of ZnO-Bi2O3-B2O3
glasses. J Non-Cryst Solids 2008; 354: 5573.
[14] Qiu HH, Ito T, Sakata H. DC conductivity of Fe2O3–Bi2O3–B2O3 glasses. Mater
Chem Phys 1999; 58: 243.
[15] Saddeek YB, Ultrasonic study and physical properties of some glasses. Mater Chem
Phys 2004; 83: 222.
[16] Dimitrov V, Komatsu T. Classification of oxide glasses: a polarizability approach. J
Solid State Chem 2005; 178: 831.
[17] Duffy JA. The refractivity and optical basicity of glass. J Non-Cryst Solids 1986; 86:
149.
[18] Duffy JA. Ingram MD. Optical Properties of Glass. Westerville: The American
Ceramic Society, 1991. p. 159-184.
[19] Dakin TK. Standard Handbook for Electrical Engineers. New York: McGraw Hill
Inc, 1993. p. 4-117-130.
[20] Scholze H. Glass, Nature, Stucture and Properties, 3rd edition. New York: Springer,
1991.

21
[21] Zhao X, Wang X, Lin H, Wang Z. Correlation among electronic polarizability,
optical basicity and interaction parameter of Bi2O3-B2O3 glasses. Physica B 2007;
390: 293.
[22] Persans PD, Stokes KL. Handbook of Nanophase materials. New York: Marcel
Dekker, 1997. p. 271.
[23] Gonella F, Mazzoldi P. Handbook of Nanostructured Materials and Nanotechnology,
Vol. 4. London: Academic Press, 2000. p. 81-101.
[24] Kreibig U, Vollmer M. Optical Properties of Metal Clusters. Berlin: Springer, 1995.
[25] Porai-Koshits EA, Averjanov VI. Primary and secondary phase separation of sodium
silicate glasses. J Non-Cryst Solids, 1968; 1: 29.
[26] Vogel W, Horn L, Reiss H, Volksch G. Electron-microscopical studies of glasses. J
Non-Cryst Solids 1982: 49: 221.
[27] James PF, Quantitative measurements of phase separation in glasses using
transmission electron microscopy. part I. experimental technique and method of
analysis. McMillan PW. Phys Chem Glasses 1970; 11: 59.
[28] MacDowell JF, Beall GH. Immiscibility and crystallization in Al2O3-SiO2 glasses. J
Am Ceram Soc 1969; 52: 17.
[29] Doweidar H, Saddeek YB. FTIR and ultrasonic investigation on modified bismuth
borate glasses. J Non-Cryst Solids 2009; 355: 348.
[30] Ardelean I, Cora S, Rusu D. EPR and FT-IR spectroscopic studies of Bi2O3-B2O3-
CuO glasses. Physica B 2008; 403: 3682.
[31] Fuxi G. Optical and Spectroscopic properties of Glass, Berlin: Springer-Verlag,
1992.

22
[32] Kamitsos EI, Karakassides MA, Chryssikos GD. Vibrational spectra of magnesium-
sodium-borate glasses. 2. raman and mid-infrared investigation of the network
structure. J Phys Chem 1987; 91: 1073.
[33] Kharlamov AA, Almeida RM, Heo J. Vibrational Spectra and Structure of Heavy
Metal Oxide Glasses. J Non-Cryst Solids 1996; 202: 233.
[34] Motke SG, Yowale SP, Yawale SS. Infrared spectra of zinc doped lead borate
glasses. Bull Mater Sci 2002; 25: 75.
[35] Gavriliu G. Thermal expansion and characteristic points of –Na2O–SiO2 glass with
added oxides. J Euro Ceram Soc 2002; 22: 1375.
[36] Volf MB. Chemical Approach to Glass, Amsterdam: Elsevier, 1984.

23
Figure captions
Fig. 1. (a) Transmission and (b) absorbance spectra of (1) KBB4, (2) KBB5, (3) KBB6
and (4) KBB9 glasses. Their surface plasmon resonance (SPR) absorption bands are
shown in inset of (b).
Fig. 2. Plot of (αhν)1/2 as a function of photon energy (hν) for KBB4, KBB5, KBB6,
KBB7, KBB8 and KBB9 glasses.
Fig. 3. XRD patterns of (a) KBB5 and (b) KBB9 glasses.
Fig. 4. TEM image and SAED pattern of KBB5 glass.
Fig. 5. TEM images of KBB9 glass (a) and (b). Its HRTEM and SAED pattern are in (c)
and (d) respectively.
Fig. 6. (Color online) FESEM micrographs of (a) KBB5 and (c) KBB9 glasses show the
effect of Bi2O3 content on the phase separated particle size distribution which is plotted in
(b) and (d) respectively (where R is the correlation coefficient).
Fig. 7. (a) FTIRR spectra of (1) KBB4, (2) KBB5 (3) KBB6, (4) KBB7, (5) KBB8 and
(6) KBB9 glasses and (b) variation of reflection intensity ratio of BO4 to BO3 structural
units of the glasses as a function of Bi2O3 content.
Fig. 8. (a) Linear thermal expansion of (1) KBB4, (2) KBB7 and (3) KBB9 glasses as a
function of temperature. Their Tg and Td values are also shown and (b) variation of
coefficient of thermal expansion (CTE) of the glasses as a function of Bi2O3 content.
Fig. 9. Variation of softening temperature (Ts), glass transition temperature (Tg) and
deformation temperature (Td) of the glasses as a function of Bi2O3 content.
Fig. 10. Variation of dielectric constant of the glasses as a function of Bi2O3 content.
24
Table 1 Some experimental and calculated properties of the glasses in the K2O-B2O3-Bi2O3 system
Property
KBB4
KBB5
KBB6
KBB7
KBB8
KBB9
Density, (g. cm-3) (+ 0.01) 5.076 5.625
6.133
6.496
6.723
6.946
Optical band gap energy, Eopt (eV) (+0.1)
2.86 2.78
2.69
2.59
2.50
2.30
Average molecular weight, Mav 235.53 273.93
312.34 350.74 389.15 427.55
Molar volume, Vm (cm3) (+0.01) 46.40 48.70 50.93 53.33 58.98 61.55
Theoretical optical basicity, th
0.93
0.98
1.03
1.08
1.12
1.15
Refractive index, n 2.024 2.142
2.220
2.294
2.366
2.434
Young’s modulus (GPa) 42.96 49.17 53.70 58.03 62.19 66.17

25
400 600 800 10000
20
40
60
80
100
Tran
smis
sion
(%)
Wavelength (nm)
(1)(2)(3)(4)
(a)
400 600 8000
1
2
3
4
SPR band
Abs
orba
nce
Wavelength (nm)
(1)(2)(3)(4)
Sample No. SPR band (nm)1234
394403410411
--474479480
(b)
Fig. 1. (a) Transmission and (b) absorbance spectra of (1) KBB4, (2) KBB5, (3) KBB6 and (4) KBB9 glasses. Their surface plasmon resonance (SPR) absorption bands are shown in inset of (b).

26
1.6 1.8 2.0 2.2 2.4 2.6 2.8 3.0 3.20
2
4
6
8
10
12
2.862
2.6942.497 2.779
2.587
2.302
(
hc
m-1
eV
)1/2
Energy (eV)
KBB9 KBB8 KBB7 KBB6 KBB5 KBB4
Fig. 2. Plot of (αhν)1/2 as a function of photon energy (hν) for KBB4, KBB5, KBB6, KBB7, KBB8 and KBB9 glasses.

27
20 40 60 801000
2000
3000
4000
5000
122
012
116
Rel
ativ
e in
tens
ity (a
. u.)
2 (degree)
(b)
(a)12
211
6
012
Bi metal (Rhombohedral)JCPDS File No.: 01-0699
Fig. 3. XRD patterns of (a) KBB5 and (b) KBB9 glasses.

28
Fig. 4. TEM image and SAED pattern of KBB5 glass.
d024

29
Fig. 5. TEM images of KBB9 glass (a) and (b). Its HRTEM and SAED pattern are in (c) and (d) respectively.
(a) (b)
(c) (d) d015 = 2.032 Ao d208 d024

30
Fig. 6. (Color online) FESEM micrographs of (a) KBB5 and (c) KBB9 glasses show the effect of Bi2O3 content on the phase separated particle size distribution which is plotted in (b) and (d) respectively (where R is the correlation coefficient).
40 60 80 100 120 140 1600
10
20
30
40
Num
ber o
f par
ticle
Size of particle (nm)
Lorentzian fit(R= 0.93)(b)
40 60 80 100 120 140 160 180 2000
10
20
30
40
50
Num
ber o
f par
ticle
Size of particle (nm)
Lorentzian fit(R = 0.92)(d)
(a)
(c)

31
Fig. 7. (a) FTIRR spectra of (1) KBB4, (2) KBB5 (3) KBB6, (4) KBB7, (5) KBB8 and (6) KBB9 glasses and (b) variation of reflection intensity ratio of BO4 to BO3 structural units of the glasses as a function of Bi2O3 content.
40 50 60 70 80 90
2.1
2.2
2.3
2.4
2.5
2.6
2.7
I BO
4/I BO
3
Bi2O3 content (mol%)
Minimum
(b)

32
Fig. 8. (a) Linear thermal expansion of (1) KBB4, (2) KBB7 and (3) KBB9 glasses as a function of temperature. Their Tg and Td values are also shown and (b) variation of coefficient of thermal expansion (CTE) of the glasses as a function of Bi2O3 content.
200 300 400 500
0.2
0.3
0.4
0.5
0.6
0.7
0.8
(3)(2)
Tg =361oC
Tg = 362oC
Tg = 409oC
Td = 394oC
Td = 380oC
dL/L
o (%)
Temperature (oC)
Td = 427oC(1)
(a)
40 50 60 70 80 90
110
120
130
140
150
160
CTE
(x10
-7K
-1)
Bi2O3 content (mol%)
(b)

33
30 40 50 60 70 80 90 100
360
380
400
420
440
460
Tem
pera
ture
(oC
)
Bi2O3 content (mol%)
Ts Td Tg
Minima
Fig. 9. Variation of softening temperature (Ts), glass transition temperature (Tg) and deformation temperature (Td) of the glasses as a function of Bi2O3 content.

34
40 50 60 70 80 90
20
22
24
26
28
30
32
34
Die
lect
ric c
onst
ant ()
Bi2O3 content (mol%)
Fig. 10. Variation of dielectric constant of the glasses as a function of Bi2O3 content.