synthesis and characterisation of gold … · firstly, i would like to thank ernest mendoza for...
TRANSCRIPT
SYNTHESIS AND CHARACTERISATION
OF GOLD NANOCLUSTERS
FOR CATALYSIS APPLICATIONS
Maria Leonor Rodrigues Alves
UNIVERSITAT AUTÒNOMA DE BARCELONA
DEPARTAMENT DE FÍSICA
SYNTHESIS AND CHARACTERISATION
OF GOLD NANOCLUSTERS
FOR CATALYSIS APPLICATIONS
PhD Thesis
Maria Leonor Rodrigues Alves
Directors:
Dr. Ernest Mendoza Gómez
Dr. Jordi Llorca Piqué
Tutor:
Dr. Jordi Pascual Gainza
Barcelona, 2014


UNIVERSITAT AUTÒNOMA DE BARCELONA
DEPARTAMENT DE FÍSICA
SYNTHESIS AND CHARACTERISATION
OF GOLD NANOCLUSTERS
FOR CATALYSIS APPLICATIONS
Thesis submitted by
Maria Leonor Rodrigues Alves
for the degree of Doctor in Materials Science
Barcelona, 2014
Maria Leonor Rodrigues Alves


Barcelona, Març 2014
El Dr. Ernest Mendoza Gómez, Professor Agregat del Departament de Física i
Enginyeria Nuclear de la Universitat Politècnica de Catalunya, el Dr. Jordi Llorca
Piqué, Professor Agregat de l’Institut de Tècniques Energètiques de la
Universitat Politècnica de Catalunya, i el Dr. Jordi Pascual Gainza, Catedràtic del
Departament de Física de la Universitat Autònoma de Barcelona.
CERTIFIQUEN:
La present tesis titulada: “Synthesis and characterisation of gold
nanoclusters for catalysis applications” presentada per Maria Leonor
Rodrigues Alves per optar al grau de Doctora en Ciència de Materials per la
Universitat Autònoma de Barcelona ha estat realitzada sota la seva direcció en
el Centre de Recerca en Nanoenginyeria de la Universitat Politècnica de
Catalunya, i trobant-se conclosa, autoritzen la seva presentació perquè sigui
avaluada pel tribunal corresponent.
Dr. Ernest Mendoza Gómez
(Director)
Dr. Jordi Llorca Piqué
(Director)
Dr. Jordi Pascual Gainza
(Tutor)


To my mother, father,
brothers and sister.


ACKNOWLEDGEMENTS Firstly, I would like to thank Ernest Mendoza for many reasons. For always
supporting me from the beginning and for always being available and believing
in my work over the past four years. I am grateful for his enthusiasm,
emparting knowledge in different fields, advice on how to improve my work
and for having always closely followed my PhD research. I thank him for his
kindness and humanity.
Then, I thank Jordi Llorca, who contributed a lot since the second year of my
PhD. I also thank him for his kindness and humanity, sharing his knowledge in
different fields, for always being available and following the work closely.
I thank Marta Santiago, for all her help, teaching, sharing of ideas and her
kindness.
I thank Belén Ballesteros for having taught me during the first year how to
operate an HRTEM microscope; for all her patience, kindness, good teaching
and help.
I thank César Fernandéz, for all the help in the first year.
I thank Trifon Trifonov, for all the help and for teaching me how to operate the
SEM microscope.
I thank Zaira Blazquez, Edurne Galindo, Nahikari Zuasti, Meritxell Molmeneu,
Montserrat Domínguez, Alvaro Mayoral and Gemma Guilera, for their
contributions to this thesis.
I thank Lucília Salbany, for the help improving the language of this thesis.
I thank Fundação para a Ciência e a Tecnologia, for the SFRH/BD/75925/2011
fellowship assigned to me.
I thank Carlos, Sérgio, Arnau, Sunny, Neus and Jesús, for making my integration
during my first year in Barcelona so much easier.
I thank Núria, Cristian, Elena, Edu, Albert, Vanessa, Reinhold, David and César,
for the time and moments that we shared every day at work.

I thank Kasia, Magda, Pablito, Joa, Miriam, Sara, Fer, Francisco, Majo, Juan, Rox,
Sebastián, Anita and Marcelo, for the good moments that we had during the
time we were together in Barcelona.
I thank Catarina, Cátia, Joana and João, for the friendship which we have
maintained for nine years and for the mutual support even when we were
living in three different continents and five different cities.
I thank Filipe, Clara, Nuno and Susana, for the good moments that we always
share each time we get together in Portugal. For the contact that we keep, the
care and for being such good listeners.
I thank David for always having the right words.
I thank Maria, for being such a good example of courage and determination.
I thank Raúl, Esteban, Felipe and Robert, for their support, friendship, help and
mutual trust.
I thank Diana and Rosa, for their support, care and for always being there to
listen whenever I needed.
I thank Ana, my sister, for having so much patience with me, for her help in
improving my work and for always taking care of me.
I thank Pedro, my brother, for the care, help and support, never judging me.
I thank Zé, my brother, for the care.
I thank my father, for the education and values that he has instilled in me
during all these years. For the help in everything that I needed wherever I
would be.
I thank my mother, especially, because she is the one who suffered the most
with my absence over the last four years. Thank you for being so kind, a good
educator and for always supporting me. Because in the end, family is the only
thing that is always present to defend and support you during the difficult
moments.
NOMENCLATURE AND ABREVIATIONS
SYNTHESISED CATALYSTS NOMENCLATURE
Au(xwt%)/support Catalyst of Au synthesised in-situ with a x wt%
nominal gold content
ncAu(xwt%)/support Catalyst of Au synthesised ex-situ with a x wt%
nominal gold content
ABREVIATIONS
AFM Atomic Force Microscopy
BE Binding Energy
BET Brunauer-Emmett-Teller
CB Carbon Black
CN Coordination Number
CNTs Carbon Nanotubes
Co-P Co-Precipitation
d Metal particle diameter
DI Distilled water
DOM Dimensionally Ordered Macroporous
DP Deposition-Precipitation
EXAFS Extended X-ray Absorption Fine Structure
fcc face-centered cubic
FT Fourier Transform
HRTEM High Resolution Transmission Electron Microscopy
ICP-OES Inductively Coupled Plasma-Optical Emission Spectroscopy

MWCNTs Multiwalled Carbon Nanotubes
NPs Nanoparticles
SEM Scanning Electron Microscopy
STEM Scanning Transmission Electron Microscopy
SWCNTs Singlewalled Carbon Nanotubes
T Temperature
TEM Transmission Electron Microscopy
TG Thermogravimetric
TGA Thermogravimetric Analysis
TPO Temperature Programmed Oxidation
T50 Temperature at which 50% of the carbon material is converted
Ti Initial temperature of combustion of the carbon material
Tm Temperature of the maximum combustion rate of the carbon material
Ts Temperature of the inflection point of the TG curve of the carbon material
XANES X-ray Absorption Near Edge Structure
XAS X-ray Absorption Spectroscopy

i
INDEX
SUMMARY .....................................................................................................................................1
CHAPTER 1: ..................................................................................................................................5
INTRODUCTION ..........................................................................................................................5
1.1 CATALYSIS BY GOLD.................................................................................................7
1.2 THE IMPORTANCE OF SMALL GOLD NANOPARTICLES (GOLD
CLUSTERS) ...................................................................................................................8
1.2.1 GOLD NANOPARTICLES STRUCTURAL AND ELECTRONIC
PROPERTIES DEPENDENCE ON THEIR SIZE ....................................... 10
1.2.2 METAL-SUPPORT INTERACTIONS .......................................................... 13
1.3 SYNTHESIS OF SUPPORTED Au NANOPARTICLES/NANOCLUSTERS .. 16
1.3.1 IMPREGNATION ............................................................................................. 18
1.3.2 CO-PRECIPITATION ...................................................................................... 20
1.3.3 DEPOSITION-PRECIPITATION .................................................................. 21
1.3.4 ANION ADSORPTION .................................................................................... 23
1.3.5 COLLOIDAL GOLD .......................................................................................... 23
1.3.6 SONOCHEMICAL SYNTHESIS ..................................................................... 25
1.3.7 OTHER METHODS.......................................................................................... 28
1.4 HETEROGENEOUS CATALYSIS WITH GOLD ATOMS (SYNTHESIS OF
ISOLATED GOLD ATOMS) .................................................................................... 29
1.5 CATALYSTS SUPPORTS ......................................................................................... 31
1.6 GOLD CATALYSTS’ PRACTICAL APLICATIONS ............................................. 35
1.6.1 CO OXIDATION................................................................................................ 35
1.6.2 CATALYTIC OXIDATION OF CARBONACEOUS MATERIALS............ 41
1.8 OBJECTIVES .............................................................................................................. 57
1.9 REFERENCES ............................................................................................................ 59
CHAPTER 2: ............................................................................................................................... 71
CHARACTERISATION TECHNIQUES AND METHODS ................................................. 71
2.1 TRANSMISSION ELECTRON MICROSCOPY (TEM) ...................................... 73

ii
2.2 SCANNING ELECTRON MICROSCOPY (SEM) ................................................. 76
2.3 ATOMIC FORCE MICROSCOPY (AFM) .............................................................. 77
2.4 X-RAY PHOTOELECTRON SPECTROSCOPY (XPS) ....................................... 79
2.5 X-RAY ABSORPTION SPECTROSCOPY (XAS) ................................................. 80
2.7 THERMOGRAVIMETRIC MEASUREMENTS (TGA) ....................................... 82
2.8 SURFACE AREA MEASUREMENTS .................................................................... 83
2.9 INDUCTIVELY COUPLED PLASMA-OPTICAL EMISSION SPECTROSCOPY
(ICP-OES) ................................................................................................................... 85
2.10 REACTION SYSTEMS .............................................................................................. 86
2.10.1 SONOCHEMICAL SYNTHESIS OF Au NANOCLUSTERS ...................... 86
2.10.2 CO OXIDATION ................................................................................................ 88
2.10.3 CARBONACEOUS MATERIALS OXIDATION .......................................... 90
2.11 REFERENCES ............................................................................................................ 92
CHAPTER 3: ............................................................................................................................... 93
IN-SITU SYNTHESIS OF GOLD CLUSTERS AND CATALYTIC ACTIVITY STUDY . 93
3.1 SYNTHETIC PROTOCOL ........................................................................................ 95
3.2 ICP-OES CHEMICAL ANALYSES....................................................................... 103
3.3 Au CLUSTERS SIZE DISTRIBUTION DEPENDENCE PARAMETERS ..... 104
3.3.1 NOMINAL GOLD CONTENT ..................................................................... 104
3.3.2 SUPPORT SURFACE AREA........................................................................ 107
3.3.3 STABILITY ..................................................................................................... 123
3.3.4 SYNTHESIS TEMPERATURE.................................................................... 126
3.4 ATOMIC RESOLUTION OF Au/MWCNTs CATALYSTS ............................. 128
3.4.1 ABERRATION-CORRECTED HRTEM..................................................... 128
3.4.2 XAS ................................................................................................................... 139
3.5 X-RAY PHOTOELECTRON SPECTROSCOPY ................................................ 141
3.6 CATALYTIC ACTIVITY ........................................................................................ 146
3.6.1 Au/MWCNTs CATALYSTS ........................................................................ 146
3.6.2 Au/CeO2 CATALYSTS ................................................................................. 147
3.7 CONCLUSIONS ....................................................................................................... 154
3.8 REFERENCES ......................................................................................................... 156

iii
CHAPTER 4: ............................................................................................................................ 159
EX-SITU SYNTHESIS OF GOLD NANOCLUSTERS AND CATALYTIC ACTIVITY
STUDY ...................................................................................................................................... 159
4.1 SYNTHETIC PROTOCOL – Au NANOCLUSTERS ......................................... 161
4.2 2RCO /Au MOLAR RATIO INFLUENCE IN THE Au PARTICLE SIZE .... 163
4.3 SYNTHESIS OF SUPPORTED Au NANOCLUSTERS CATALYSTS ........... 169
4.3.1 HIGH RESOLUTION TRANSMISSION ELECTRON MICROSCOPY. 170
4.3.2 X-RAY PHOTOELECTRON SPECTROSCOPY ....................................... 172
4.4 CATALYTIC ACTIVITY ........................................................................................ 175
4.5 CONCLUSIONS ....................................................................................................... 185
4.6 REFERENCES ......................................................................................................... 187
CHAPTER 5: ............................................................................................................................ 189
OXIDATION OF CARBONACEOUS MATERIALS .......................................................... 189
5.1 CATALYSTS SYNTHESIS .................................................................................... 191
5.2 CATALYTIC ACTIVITY ........................................................................................ 195
5.2.1 COMBUSTION TEMPERATURE OF Au DECORATED MWNCTs (in-
situ) ................................................................................................................. 197
5.2.2 COMBUSTION TEMPERATURE OF Au DECORATED CARBON
BLACK (ex-situ) .......................................................................................... 208
5.2.3 SOOT OXIDATION ....................................................................................... 212
5.3 CONCLUSIONS ....................................................................................................... 222
5.4 REFERENCES ......................................................................................................... 225
CHAPTER 6: ............................................................................................................................ 227
GENERAL CONCLUSIONS................................................................................................... 227
ANNEXES ................................................................................................................................. 233
A.1 DETERMINATION OF THE NOMINAL NUMBER OF Au CLUSTERS PER
MWNCT ................................................................................................................... 235
A.2 IN-SITU CATALYSTS ACTIVITY: CO OXIDATION – EXPERIMENTAL
PROTOCOL ............................................................................................................. 237

iv
A.3 EX-SITU CATALYSTS ACTIVITY: CO OXIDATION – EXPERIMENTAL
PROTOCOL ............................................................................................................. 242
A.4 REFERENCES ......................................................................................................... 246

SUMMARY
1
SUMMARY
This doctoral thesis is about the synthesis and the catalytic activity study of
gold particles with a diameter lower than 2 nm, gold nanoclusters. The interest
is due to the catalytic activity that gold has at room temperature when its size is
less than approximately 5 nm.
In this thesis, two distinct synthesis’ methods that allow stable gold clusters
with a well defined particle size to be obtained have been developed. In one
method, gold clusters with a narrow size distribution and a particle diameter
less than 2 nm are firstly synthesised and then deposited on a support. In the
other method, gold clusters are directly synthesised on the selected support. In
the latter method, the size of gold can be easily varied by simply altering the
gold precursor quantity during the synthesis process. Thus, uniformly
dispersed isolated gold atoms, 2 nm Au clusters or nanoparticles larger than 10
nm can be obtained on the material support surface.
The synthesised catalysts were characterised using distinct physico-chemical
techniques: HRTEM, SEM, AFM, XPS and XAS. Additionally, their catalytic
activity was investigated for the oxidation of CO and carbonaceous materials.
Finally, the particle size was related with the catalytic activity of the material.
This thesis is organised in 6 chapters. It starts, in Chapter 1, with an
introduction to gold catalysis, including the description of various developed
gold catalysts synthetic protocols. This chapter also emphasises the importance
of the gold clusters and its structural and electronic properties that confer them
an exceptional activity, thus the importance of the metal-support interaction on
the catalysts activity. It refers also to the interest and the actual state in the
study of the activity and synthesis of Au atoms. Finally, the catalysts supports
used and the catalytic reactions studied in this work are also described in

SUMMARY
2
detail. The last section of this chapter summarises the objectives of this PhD
thesis.
In Chapter 2, a brief description of the mode of operation of the
characterisation techniques used in this work can be found. The equipments
used to perform the analyses, the operating conditions and the properties
determined with each technique are also presented. In addition, the reaction
systems used for the catalytic activity tests are also described in this chapter.
In Chapter 3 a synthetic protocol (in-situ) that allows obtaining gold clusters (d
< 2 nm) or even isolated gold atoms supported on different surfaces (MWCNTs,
TiO2 and CeO2) covered with amine groups is presented. In this method gold is
directly reduced on the different support surfaces. An intensive
characterisation of the factors that might influence the gold nanoparticle size
such as gold content, support surface area and synthesis temperature is
presented. Finally, the results obtained for the catalytic activity of Au/CeO2
catalysts in the CO oxidation reaction are presented. Its activity is compared
with the one obtained by other authors using Au/CeO2 catalysts synthesised by
deposition-precipitation and co-precipitation protocols. Calcination
observations of a Au/MWCNTs catalyst are discussed leading to the
experiments carried out in Chapter 5.
Chapter 4 focuses on the presentation of an alternative synthetic protocol of
gold clusters. In this ex-situ synthetic protocol gold nanoclusters (d < 2 nm)
were firstly synthesised and then supported on the referred support surfaces
covered by amine groups. A discussion about how the 2RCO /Au ratio
influences the Au nanocluster size is presented. Finally, the catalytic activity of
these catalysts for the CO oxidation reaction is presented. A discussion about
the differences observed in the catalytic activity of the catalysts obtained by
both synthetic protocols is carried out. The activity of these catalysts is also

SUMMARY
3
compared with the activity of the commonly synthesised by
deposition-precipitation and co-precipitation Au/CeO2 catalysts.
The activity and selectivity of the synthesised gold catalysts (in-situ and ex-situ
synthetic protocols) for the oxidation of carbonaceous materials such as
MWCNTs and carbon black is presented in Chapter 5. The effect of the Au
content/Au particle size on the catalytic activity is discussed. The ability of in-
situ Au/CeO2 catalysts to decrease the oxidation temperature of soot is also
investigated.
Finally, the general conclusions of this PhD thesis are presented in Chapter 6.


CHAPTER 1:
INTRODUCTION

CHAPTER 1: INTRODUCTION
7
1.1 CATALYSIS BY GOLD
Gold has been considered for many years as chemically inert and it was often
regarded to be poorly active as a catalyst. Nevertheless, in the late 1980s,
Haruta et al. discovered that specifically supported gold particles (those with a
mean diameter smaller than 5 nm) show unique catalytic properties at the low
temperature CO oxidation[1-3]. Further studies also showed a high activity of
these catalysts in several other reactions, such as the selective oxidation of
propene to propene oxide, the water gas-shift reaction, the NO reduction and
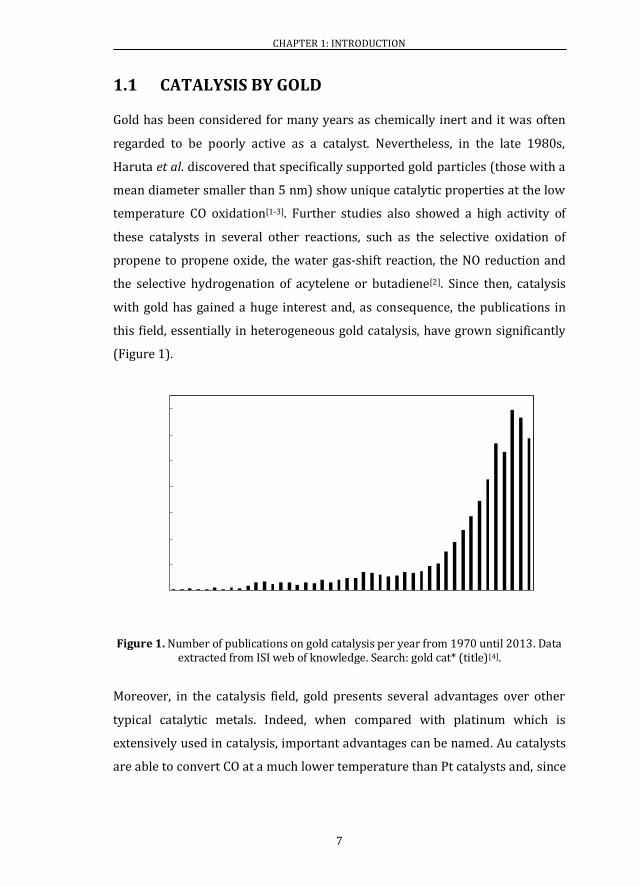
the selective hydrogenation of acytelene or butadiene[2]. Since then, catalysis
with gold has gained a huge interest and, as consequence, the publications in
this field, essentially in heterogeneous gold catalysis, have grown significantly
(Figure 1).
Figure 1. Number of publications on gold catalysis per year from 1970 until 2013. Data extracted from ISI web of knowledge. Search: gold cat* (title)[4].
Moreover, in the catalysis field, gold presents several advantages over other
typical catalytic metals. Indeed, when compared with platinum which is
extensively used in catalysis, important advantages can be named. Au catalysts
are able to convert CO at a much lower temperature than Pt catalysts and, since
2
322
422
522
622
722
822
922
3;92
3;94
3;96
3;98
3;9:
3;:2
3;:4
3;:6
3;:8
3;::
3;;2
3;;4
3;;6
3;;8
3;;:
4222
4224
4226
4228
422:
4232
4234

CHAPTER 1: INTRODUCTION
8
it is more resistant to poisoning in the presence of CO it is not deactivated as
easily[5].
The low temperature CO oxidation reaction has a particular importance on
finding applications in indoor air quality control and as a guard bed catalyst to
prevent CO poisoning of proton exchange membrane fuel cells[2]. Further study
revealed that, indeed, the catalytic performance of gold in the CO oxidation
reaction strongly depends on the gold nanoparticle size. In addition, finding
how the support might also affect the catalytic activity is also a target of study
and interest, as well as the interaction between gold and the support or the gold
nanoparticle’s structure. Thus, the need for understanding and explaining this
exceptional catalytic activity is responsible for a significant increase noticed in
the research on this subject. Nevertheless, much more investigation is still
required in order to clarify several key questions about gold catalysis,
particularly heterogeneous gold catalysis.
Finally, it is important to state that gold nanoparticles (Au/Fe2O3 on a zeolite
wash-coated honeycomb) first commercial application took place in 1992. Gold
containing systems were used to reduce the odours in toilets in Japan[6].
1.2 THE IMPORTANCE OF SMALL GOLD
NANOPARTICLES (GOLD CLUSTERS)
The properties of a metal vary significantly with its size. These are separated in
three groups: nanoparticles (NPs, from around 2 nm up to 100 nm, i.e. more
than around 200 atoms), nanoclusters (less than 2 nm, i.e., less than
approximately 200 atoms) and finally isolated atoms[7].
Massivematerial Nanoparticles AtomsNanoclusters

CHAPTER 1: INTRODUCTION
9
A nanoparticle is defined as any metal particle whose diameter is in the
nanoscale. These particles are usually structurally composed by a metal
nucleous surrounded with a shell of disordered atoms.
The interest in nanoclusters resides in the fact that these species fill the “gap”
between atomic and nanoparticle behaviour in metals. A subnanometric or
atomic cluster is characterised by its size which is comparable to the Fermi
wavelength of an electron (~ 0.52 nm for Au). It consists in a group of atoms
with a well defined composition and one or very few stable geometric
structures. Due to their reduced size they present quantum effects which are
responsible for the appearance of new chemical, optical or electronic
properties such as the magnetism, photoluminescence or catalytic activity
(Section 1.2.1)[2].
In this thesis, Au particles with a diameter larger than 2 nm are named as
nanoparticles (NPs). When the diameter of Au is lower than 2 nm the term
cluster or nanocluster is used.
When the gold nanoparticle size is decreased to around 1 nm – 1.5 nm an
unexpected activity is observed[8]. This activity, among other factors, results
from the number of atoms at the surface of gold available. The degree of
dispersion can be calculated considering the particles, as spheres, all of the
same size[9, 10]. Notice, however, that this approximation is not valid for very
small gold clusters once that the approximation to a sphere is no longer valid.
In this case, it is interesting to investigate the relation between the coordination
number of surface atoms and the size of particles with a specific shape[9, 11].
Both models mentioned have been intensively used in order to try to
understand the dependence of the catalytic activity on the particle size[9-11].
Nevertheless, these models are applied to particles that have exactly the
required number of electrons to complete the outer layer and, therefore, are a
rough approximation.

CHAPTER 1: INTRODUCTION
10
In this context, in order to understand the origin of the previously described
unexpected activity of the gold clusters, it is essential to investigate how their
physical properties vary with their size. Moreover, it is also important to
distinguish between unsupported and supported gold clusters, since the metal-
support interactions will also affect the catalyst activity[5].
1.2.1 GOLD NANOPARTICLES STRUCTURAL AND ELECTRONIC
PROPERTIES DEPENDENCE ON THEIR SIZE
Bulk gold (d > 100 nm) is known as a shiny yellow inert noble metal.
Decreasing its size metallic reddish inert nanoparticles (d > 2 nm) are obtained.
Decreasing even more the size, fluorescent and active in catalysis gold clusters
(d < 2 nm) are obtained. One of the factors responsible for the development of
these new properties is the appearance of a band gap between the conduction
and valence bands inexistent for bulk gold (Figure 2).
The atomic orbitals of an atom, depending on the extent of overlap in a solid,
might remain practically unchanged as in noble gases or they might combine to
form continuous bands, as in metals or semiconductors[12]. Each atom
contributes with its atomic orbitals to a band whose density increases, slightly,
when more atoms are added to the structure. These bands are characterised by
the density of states (DOS). Thus, for the massive material, the DOS is
continuous. Nevertheless, when reducing significantly the number of atoms of a
particle, this continuous band is gradually replaced by discrete energy levels.
Furthermore, the casi-molecular behaviour of the clusters is also evidenced by
the fact that, unlike nanoparticles, very small clusters are characterised by
delocalised molecular orbitals instead of bands and that the bandgap is large
enough to remember the highest occupied molecular orbital-lowest unoccupied
molecular orbital (HOMO-LUMO) molecular gap[12, 13]. Figure 2 shows how the
band gap and the DOS vary with the number of atoms of a particle.

CHAPTER 1: INTRODUCTION
11
Figure 2. Evolution of the band gap and the DOS with the number of atoms of a particle from the massive material to clusters[12, 14]. EF: Fermi level.
The exceptional catalytic activity of small Au nanoparticles (d < 5 nm) is also
related to its structure. Bulk gold is known to have a face centered cubic (fcc)
structure. Several studies about how the synthesis method and the support
nature influence the structure of the gold nanoparticles have been made,
mainly using TiO2 as support, but also with some weak interacting surfaces. For
example, by X-ray diffraction, both fcc cubo-octahedra and icosahedra
structures were observed for the Au/Mg(OH)2 catalyst [15, 16]. Nevertheless, due
to the weak interaction between Au and the support, the icosahedra sinters
quickly and originates a truncated dodecahedra structure.
Many theoretical calculations to predict the structure of these nanoparticles
have been made[17-20]. However, a clear agreement between calculations and the
experimental data has not been fully accomplished. Depending on the number
of atoms, different structures are attributed to each cluster (Figure 3). For
example, perfect icosahedral structure is attributed to clusters with a certain
special numbers of atoms (“magic numbers”) such as 13, 55, 147, 309, 561 and
923[17]. Other stable configurations, as Marks decahedra, are assigned to
clusters with 75, 77, 101 and 146 atoms[21]. Also, clusters with a number of
atoms between 35 and 500 are more stable in a truncated octahedral than in
icosahedra or cuboctahedra configurations[17].
Massive Material Nanoparticles Subnanometric clusters
EF
d > 100 nm d > 2 nm d > 0.5 nm d < 0.5 nm
Decrease of the size
Band gap
CHAPTER 1: INTRODUCTION
12
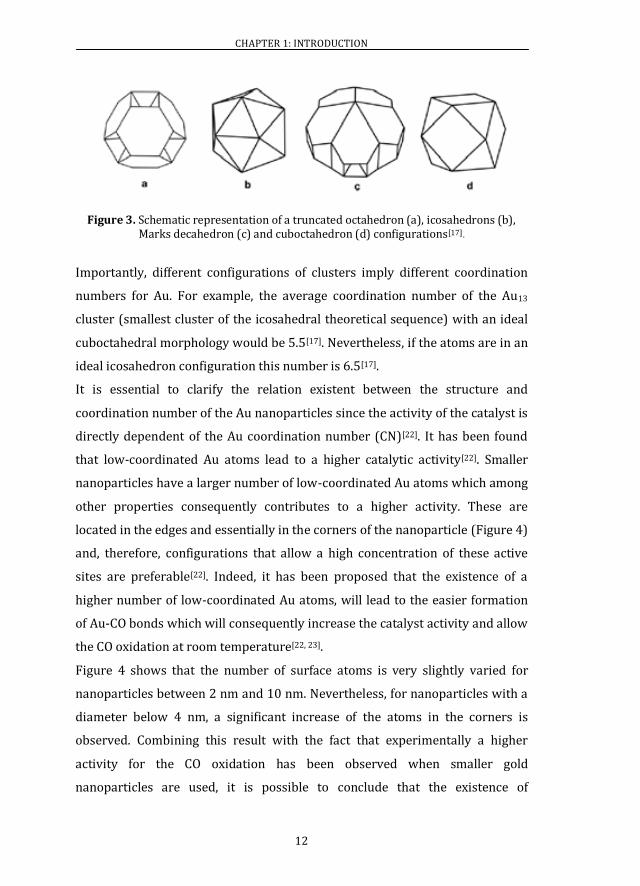
Figure 3. Schematic representation of a truncated octahedron (a), icosahedrons (b), Marks decahedron (c) and cuboctahedron (d) configurations[17].
Importantly, different configurations of clusters imply different coordination
numbers for Au. For example, the average coordination number of the Au13
cluster (smallest cluster of the icosahedral theoretical sequence) with an ideal
cuboctahedral morphology would be 5.5[17]. Nevertheless, if the atoms are in an
ideal icosahedron configuration this number is 6.5[17].
It is essential to clarify the relation existent between the structure and
coordination number of the Au nanoparticles since the activity of the catalyst is
directly dependent of the Au coordination number (CN)[22]. It has been found
that low-coordinated Au atoms lead to a higher catalytic activity[22]. Smaller
nanoparticles have a larger number of low-coordinated Au atoms which among
other properties consequently contributes to a higher activity. These are
located in the edges and essentially in the corners of the nanoparticle (Figure 4)
and, therefore, configurations that allow a high concentration of these active
sites are preferable[22]. Indeed, it has been proposed that the existence of a
higher number of low-coordinated Au atoms, will lead to the easier formation
of Au-CO bonds which will consequently increase the catalyst activity and allow
the CO oxidation at room temperature[22, 23].
Figure 4 shows that the number of surface atoms is very slightly varied for
nanoparticles between 2 nm and 10 nm. Nevertheless, for nanoparticles with a
diameter below 4 nm, a significant increase of the atoms in the corners is
observed. Combining this result with the fact that experimentally a higher
activity for the CO oxidation has been observed when smaller gold
nanoparticles are used, it is possible to conclude that the existence of

CHAPTER 1: INTRODUCTION
13
low-coordinated Au atoms located in the corners of the nanoparticles is of
major importance.
Figure 4. Representation of the calculated fractions of Au atoms in the corners, edges and crystal faces in uniform nanoparticles with a top half truncated octahedron
structure[22].
Additionally, the demonstration that the chemisorption strength increases with
the decrease of the coordination number was experimentally presented[22].
Hvolbæk et al. showed, that the CO desorption temperature increases with the
decrease of the coordination number indicating therefore a stronger
chemisorption of the CO molecules, by Temperature Programme Desorption
(TPD)[22].
1.2.2 METAL-SUPPORT INTERACTIONS
The activity of Au nanoparticles does not result from a single parameter but it is
a result of a combination of different effects. It is very difficult to distinguish
between the physical effects that are strictly dependent on particle size from
metal-support interaction. Indeed, the smaller the particle, the higher the
CHAPTER 1: INTRODUCTION
14
number of atoms in direct contact with the support will be and, simultaneously,
the fraction of low-coordinated surface atoms also increases.
The interaction between the metal and the support can also be responsible for a
higher catalytic activity in the way that the stability and structure of the metal
nanoparticles are totally dependent on the support surface and determined by
the number of metal atoms that are in direct contact with the support. The
contribution of this interaction will be greater as the particle size decreases for
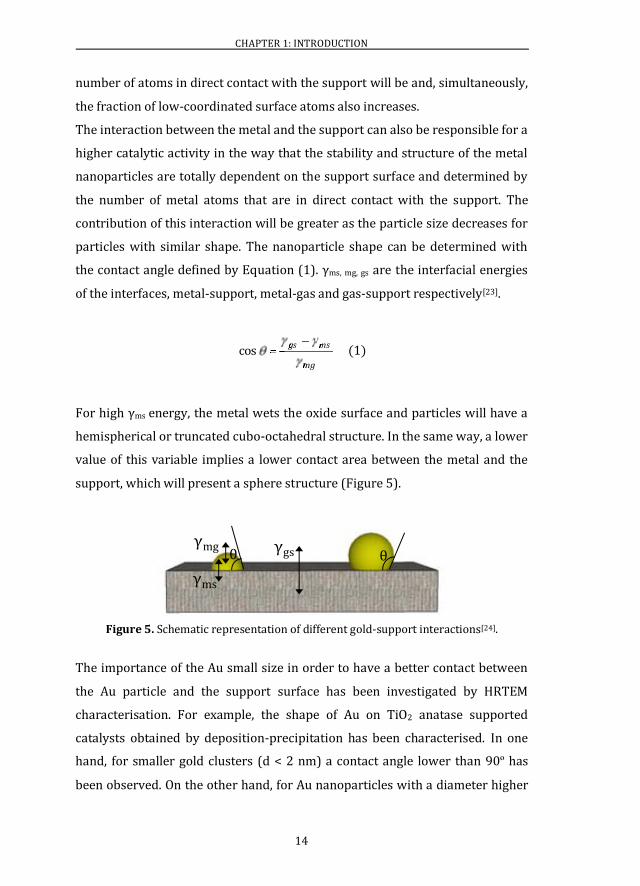
particles with similar shape. The nanoparticle shape can be determined with
the contact angle defined by Equation (1). γms, mg, gs are the interfacial energies
of the interfaces, metal-support, metal-gas and gas-support respectively[23].
mg
msgs
mg
msgscos (1)
For high γms energy, the metal wets the oxide surface and particles will have a
hemispherical or truncated cubo-octahedral structure. In the same way, a lower
value of this variable implies a lower contact area between the metal and the
support, which will present a sphere structure (Figure 5).
Figure 5. Schematic representation of different gold-support interactions[24].
The importance of the Au small size in order to have a better contact between
the Au particle and the support surface has been investigated by HRTEM
characterisation. For example, the shape of Au on TiO2 anatase supported
catalysts obtained by deposition-precipitation has been characterised. In one
hand, for smaller gold clusters (d < 2 nm) a contact angle lower than 90º has
been observed. On the other hand, for Au nanoparticles with a diameter higher
γgsγmg
γms
θ θ

CHAPTER 1: INTRODUCTION
15
than 5 nm a contact angle higher than 90º has been noticed. Thus an undesired
decrease of the fraction of the gold atoms in direct contact with the support
surface is obtained for Au nanoparticles larger than 5 nm[29].
Furthermore, the importance of the metal-support interaction has been
experimentally investigated using Au-Cu/TiO2 catalysts[25]. Different
interactions between the metal nanoparticle and the support have been clearly
observed. The authors showed how the calcination temperature affects the
structure of the Au-Cu alloy nanoparticles. They noticed a strong metal-support
interaction when the catalyst was calcined at 400 ºC (Figure 6). Since the Au
particle size was approximately maintained, this larger contact (higher number
of active sites at the perimeter of the contact area between the alloy
nanoparticles and TiO2) led to an increase of the catalytic activity. Further
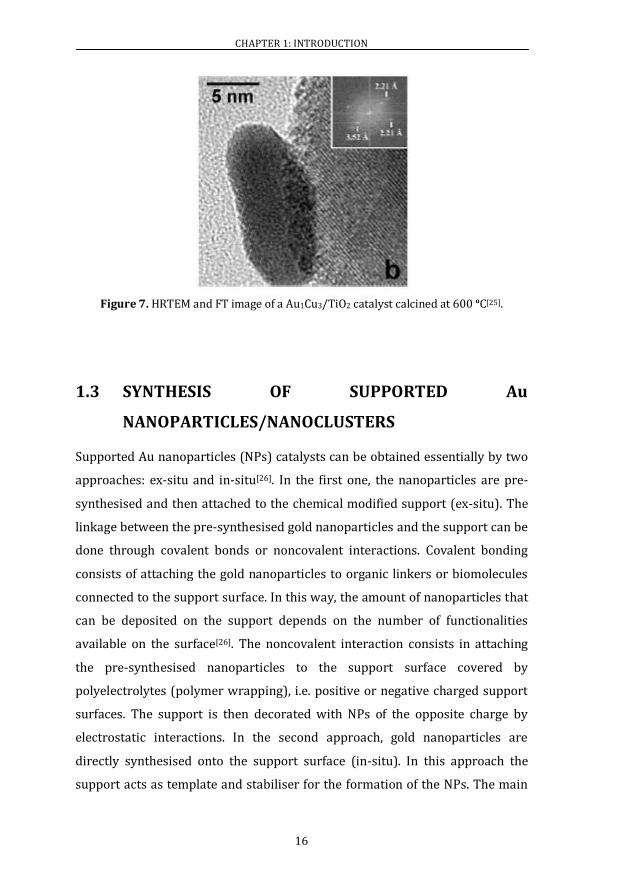
increase of the calcination temperature led to an undesirable increase of the
metal alloy particle size and to the decoration of the alloy nanoparticles with
oxidised Cu species resulting in a decrease of the catalytic activity despite the
strong particle-support interaction (Figure 7).
Figure 6. HRTEM and Fourier Transform (FT) image of a Au1Cu3/TiO2 calcined at 400 ºC[25].
CHAPTER 1: INTRODUCTION
16
Figure 7. HRTEM and FT image of a Au1Cu3/TiO2 catalyst calcined at 600 ºC[25].
1.3 SYNTHESIS OF SUPPORTED Au
NANOPARTICLES/NANOCLUSTERS
Supported Au nanoparticles (NPs) catalysts can be obtained essentially by two
approaches: ex-situ and in-situ[26]. In the first one, the nanoparticles are pre-
synthesised and then attached to the chemical modified support (ex-situ). The
linkage between the pre-synthesised gold nanoparticles and the support can be
done through covalent bonds or noncovalent interactions. Covalent bonding
consists of attaching the gold nanoparticles to organic linkers or biomolecules
connected to the support surface. In this way, the amount of nanoparticles that
can be deposited on the support depends on the number of functionalities
available on the surface[26]. The noncovalent interaction consists in attaching
the pre-synthesised nanoparticles to the support surface covered by
polyelectrolytes (polymer wrapping), i.e. positive or negative charged support
surfaces. The support is then decorated with NPs of the opposite charge by
electrostatic interactions. In the second approach, gold nanoparticles are
directly synthesised onto the support surface (in-situ). In this approach the
support acts as template and stabiliser for the formation of the NPs. The main

CHAPTER 1: INTRODUCTION
17
advantage of this approach is avoiding the use of protective shells on the NPs
that are very often used in the ex-situ approach for the stabilisation of the
nanoparticles and their linkage to the support. Indeed, this shell might be
responsible for an undesirable decrease of the catalyst activity by covering the
metal active sites[26].
The deposition of Au nanoparticles on different supports has been widely
reported[27-29]. Studies showed that, when the selected surface is functionalised
with polymers with amine groups, the deposition of Au nanoparticles is
observed[8, 30-32]. Indeed, in 2010 our group patented a synthetic protocol to
obtain subnanometric Au nanoparticles (d < 3 nm) on surfaces covered by
amine groups[33]. Later, in 2011, Lollmahomed et al. also observed the
successful deposition of Au nanoparticles on the surface of polymer-
functionalised SWCNTs[31]. In this work the effective deposition of Au
nanoparticles on the SWCNTs surface covered with different quantities of
amine groups was discussed. Amine groups act as nucleation sites for well
dispersed deposition of Au nanoparticles. Amine groups are able to stabilise Au
nanoparticles by the formation of N-Au bonds (6 kcal/mol)[34]. Therefore, a
minimal amount of amine groups was required to obtain a uniform dispersion
of Au nanoparticles. When amine groups quantity was lower than the critical a
lower uniformity of the Au nanoparticles deposition was observed. The authors
then concluded that amine groups allow a uniform deposition of Au
nanoparticles and to stabilise them on the support.
Throughout the years gold catalysts have been prepared by several methods,
which can be distinguished by the type of gold precursor used (chloride or
chloride free gold precursors). Since, in this work, chloroauric acid (HAuCl4) is
used as gold precursor, in the description, presented in Section 1.3.1 to 1.3.6,
chloride free gold precursors’ synthesis’ methodologies are excluded.

CHAPTER 1: INTRODUCTION
18
1.3.1 IMPREGNATION
This method was the first used to prepare supported gold catalysts. It is the
simplest and it can be used with any type of support. The solution of the metal
precursor is put in contact with the support and then it is aged, dried and
calcined (Figure 8). This method can be named as “incipient wetness”
impregnation or “wet” impregnation when the precursor solution volume does
not exceed the pore volume of the support or is in excess, respectively.
Figure 8. Schematic representation of the impregnation synthetic protocol. Au clusters/NPs: •.
The precursors that have been used were essentially chloroauric acid (HAuCl4)
and gold chloride (AuCl3). The first catalysts prepared were supported on silica
(SiO2), alumina (Al2O3) and magnesia (MgO), but, later, other oxides supports,
as titania (TiO2) and iron oxide (Fe2O3), were also applied[35-37]. It has been
observed that impregnation with HAuCl4 led to low activity catalysts due to the
formation of large gold nanoparticles (10-35 nm), even for low gold contents as
1 wt% or 2 wt%[38]. The formation of large gold nanoparticles resulted from the
presence of the chloride ion promoting agglomeration during the thermal
treatment[38]. This problem can be overcome by removing the chloride ion, by
Support (s)
Age + Dry + Calcination
Au/Support(d ~ 10 nm – 35 nm)
HAuCl4 (aq.)

CHAPTER 1: INTRODUCTION
19
reduction with H2, in the form of HCl[39]. Moreover, it has been observed that
the pH also affects the activity of these catalysts. Au/γ-Al2O3 catalysts were
prepared by aging the HAuCl4 solution in the pH range of 5 to 11[40]. It has been
observed that, during this step, several species resulted from the 4AuCl
hydrolysis which influenced the Au particle size. This method has been then
improved by using a new procedure using Au/Al2O3 catalysts[41].
Figure 9. Schematic representation of the improved impregnation synthetic protocol. Au clusters: •; Cl-: •.
In a first step, the gold precursor is put in contact with the support which is in
distilled water (Figure 9). Then, after removing the excess of gold precursor by
washing with water, the solid is treated with a strong base (e.g. NH3.H2O). This
treatment leads to the 4AuCl hydrolysis, being thus the remaining chloride
anions released and the Au is converted into the hydroxide form (Figure 9). The
Au/Support(d = 2.4 nm)
Wash with DI water+
Dry+
Calcination
HAuCl4 (aq.)
Decantation+
Solid wash with DI water
HAuCl4 excess+
Support
HAuCl4
+ Support (s)Support
+ DI water
Strong base
Au-OH Au-OH
Solid wash with DI water
CHAPTER 1: INTRODUCTION
20
released Cl- is removed then by washing yielding an adsorbed Au complex that
is easily decomposed at low temperature. With this improvement, it has been
observed that after drying and calcination at 400 ºC a catalyst with gold
nanoparticles with a mean diameter of 2.4 nm was obtained[41].
1.3.2 CO-PRECIPITATION
The first small Au nanoparticles supported on several oxides, as α-Fe2O3, NiO
and Co3O4, were obtained, in 1987, using this method[1, 42].
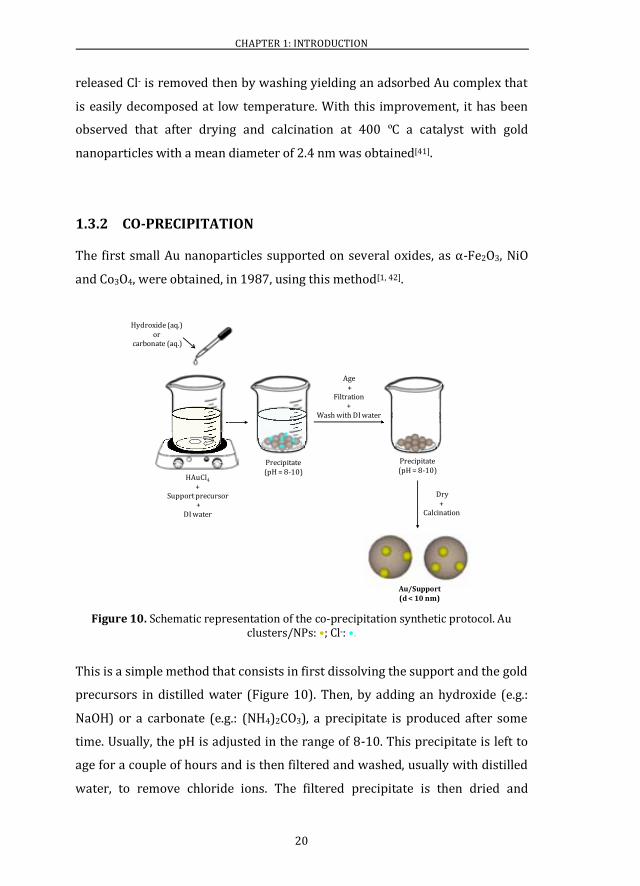
Figure 10. Schematic representation of the co-precipitation synthetic protocol. Au clusters/NPs: •; Cl-: •.
This is a simple method that consists in first dissolving the support and the gold
precursors in distilled water (Figure 10). Then, by adding an hydroxide (e.g.:
NaOH) or a carbonate (e.g.: (NH4)2CO3), a precipitate is produced after some
time. Usually, the pH is adjusted in the range of 8-10. This precipitate is left to
age for a couple of hours and is then filtered and washed, usually with distilled
water, to remove chloride ions. The filtered precipitate is then dried and
Dry+
Calcination
HAuCl4
+Support precursor
+ DI water
Hydroxide (aq.) or
carbonate (aq.)
Precipitate(pH = 8-10)
Age+
Filtration+
Wash with DI water
Precipitate(pH = 8-10)
Au/Support(d < 10 nm)

CHAPTER 1: INTRODUCTION
21
calcined, if desired[43]. This method leads to a high gold dispersion with Au
particles usually smaller than 10 nm (Table 1).
The main drawback of this method lies in the fact that it can only be applied for
certain metal oxides, due to the rates of precipitation of the two hydroxides (Au
and the metal of the support) and to the fact that the gold particle size is
determined by their affinity. Table 1 shows the diameter of Au particles
obtained by this method on different oxide supports.
Table 1. Au/oxide catalysts synthesised by co-precipitation[44].
Oxide Support [Au] (wt%) Tcalcination (ºC) d (nm)
MgO 2 200 < 2
TiO2 5 600 5
Fe2O3 5 400 4
CO3O4 5 400 6
NiO 10 400 8
ZnO 5 400 5
Al2O3 5 400 5
In2O3 5 400 5
SnO2 5 400 3
SiO2 5 300 20
Cr2O3 5 400 >30
CdO 5 22 21
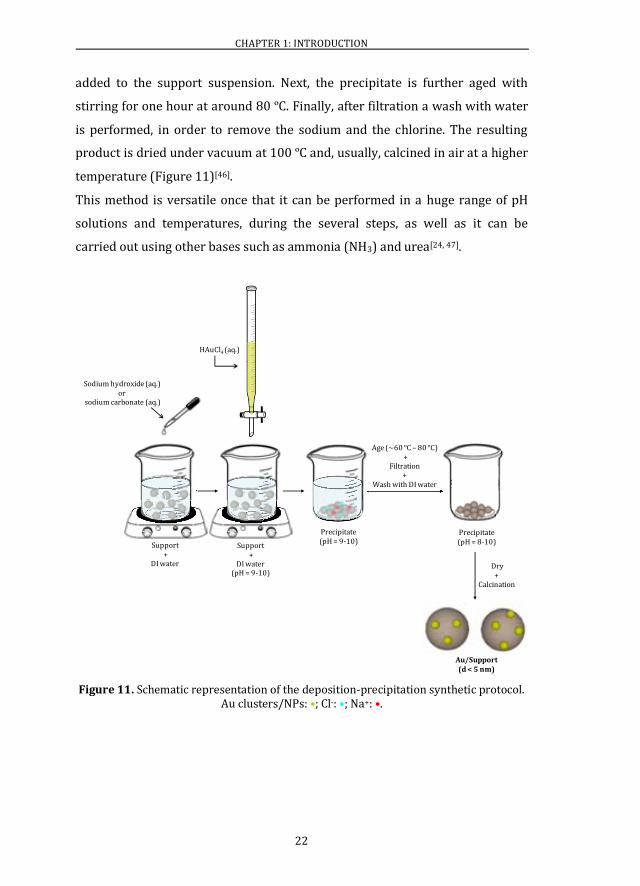
1.3.3 DEPOSITION-PRECIPITATION
This method has been used to synthesise oxide supported gold catalysts with a
small particle size (< 5 nm). By this method, the metal hydroxide precipitates
on the oxide support[45]. Briefly, the support is dissolved in distilled water (DI)
and the pH is adjusted to 9-10 by adding sodium hydroxide (e.g.: NaOH) or
carbonate (e.g.: Na2CO3) (Figure 11). Then, an aqueous solution of HAuCl4 is
CHAPTER 1: INTRODUCTION
22
added to the support suspension. Next, the precipitate is further aged with
stirring for one hour at around 80 ºC. Finally, after filtration a wash with water
is performed, in order to remove the sodium and the chlorine. The resulting
product is dried under vacuum at 100 ºC and, usually, calcined in air at a higher
temperature (Figure 11)[46].
This method is versatile once that it can be performed in a huge range of pH
solutions and temperatures, during the several steps, as well as it can be
carried out using other bases such as ammonia (NH3) and urea[24, 47].
Figure 11. Schematic representation of the deposition-precipitation synthetic protocol.
Au clusters/NPs: •; Cl-: •; Na+: •.
HAuCl4 (aq.)
Au/Support(d < 5 nm)
Support+
DI water
Sodium hydroxide (aq.) or
sodium carbonate (aq.)
Support+
DI water(pH = 9-10)
Precipitate(pH = 9-10)
Precipitate(pH = 8-10)
Age (~60 ºC – 80 ºC)+
Filtration+
Wash with DI water
Dry+
Calcination

CHAPTER 1: INTRODUCTION
23
1.3.4 ANION ADSORPTION
Anion adsorption is possible, once the gold precursor, HAuCl4, in aqueous
solution, dissociates into anionic complexes providing that the pH of the
solution is lower than the point of zero charge (PZC) of the support. This
method was studied for the synthesis of Au/TiO2 at a fixed pH (pH = 2) using
several conditions of temperature and time[48]. At 20 ºC and 80 ºC, the main
species in solution are )(OHAuCl3 and 4AuCl which can interact
electrostatically with the TiO2 surface (PZC ~ 6) (Figure 12). Gold nanoparticles
with a diameter between 4 nm and 6 nm have been obtained. Nevertheless, by
this method, a complete gold deposition has not been observed. A maximum of
1.5 wt% of reduced Au has been obtained on the TiO2 surface, which
corresponds to about 20% of the gold in solution[24].
Figure 12. Schematic representation of the anion adsorption synthetic protocol. Au NPs: •.
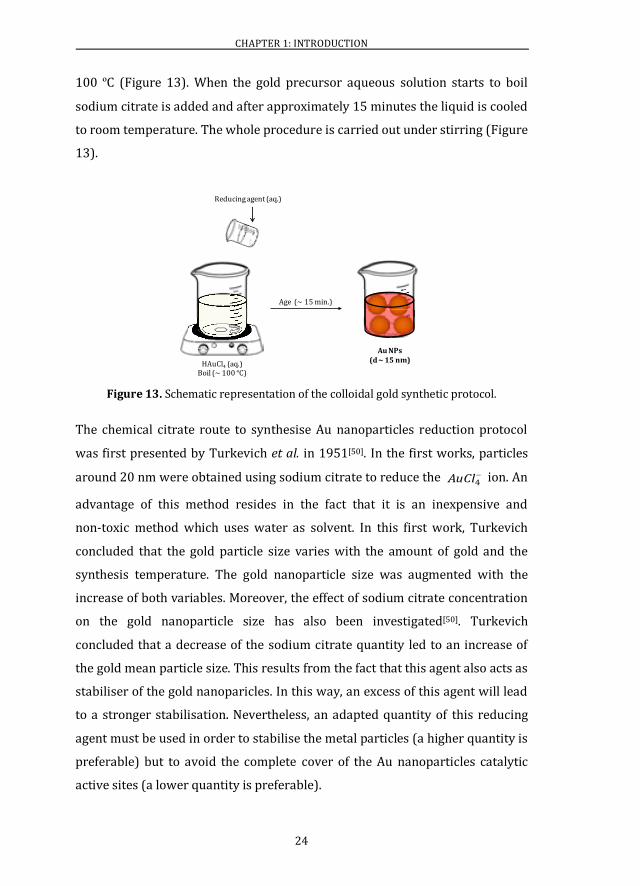
1.3.5 COLLOIDAL GOLD
Since the first works in the 1950s the colloidal route for preparing gold catalyst
has been intensively investigated[49-51]. The biggest advantage of this synthetic
method is that tuning the size distribution can be achieved by simply varying
the conditions of preparation. Generally, this method consists in the reduction
of the gold precursor by a reducing agent (usually sodium citrate) at around
HAuCl4 (aq.) (20 ºC / 80 ºC)
(pH = 2)
Support (s)
Electrostatic interaction
Au/Support(d ~ 4 nm – 6 nm)
CHAPTER 1: INTRODUCTION
24
100 ºC (Figure 13). When the gold precursor aqueous solution starts to boil
sodium citrate is added and after approximately 15 minutes the liquid is cooled
to room temperature. The whole procedure is carried out under stirring (Figure
13).
Figure 13. Schematic representation of the colloidal gold synthetic protocol.
The chemical citrate route to synthesise Au nanoparticles reduction protocol
was first presented by Turkevich et al. in 1951[50]. In the first works, particles
around 20 nm were obtained using sodium citrate to reduce the 4AuCl ion. An
advantage of this method resides in the fact that it is an inexpensive and
non-toxic method which uses water as solvent. In this first work, Turkevich
concluded that the gold particle size varies with the amount of gold and the
synthesis temperature. The gold nanoparticle size was augmented with the
increase of both variables. Moreover, the effect of sodium citrate concentration
on the gold nanoparticle size has also been investigated[50]. Turkevich
concluded that a decrease of the sodium citrate quantity led to an increase of
the gold mean particle size. This results from the fact that this agent also acts as
stabiliser of the gold nanoparicles. In this way, an excess of this agent will lead
to a stronger stabilisation. Nevertheless, an adapted quantity of this reducing
agent must be used in order to stabilise the metal particles (a higher quantity is
preferable) but to avoid the complete cover of the Au nanoparticles catalytic
active sites (a lower quantity is preferable).
Age (~ 15 min.)
Au NPs(d ~ 15 nm)
Reducing agent (aq.)
HAuCl4 (aq.)Boil (~ 100 ºC)
CHAPTER 1: INTRODUCTION
25
The citrates reduction method generally leads to the formation of large gold
nanoparticles with a diameter between 10 nm and 20 nm. In this way, this is
not the most adequate method to produce active gold catalysts, for example, for
CO oxidation, that requires sizes lower than approximately 5 nm[52].
Nevertheless, recently, according to Li et al., the colloidal gold particle size can
be lowered to around 2 nm - 8 nm after the addition of the appropriate amount
of NaOH, i.e. with the increase of the pH solution[53]. Additionally, several other
reducing agents, as sodium thiocyanate, poly(ethylene-imine),
tetrakis[hydroxymethyl] phosphonium chloride ([HOCH2)4P]+Cl-) and sodium
borohydride (NaBH4) were also used decreasing the particle size to around 1
nm – 3 nm[24]. In some cases, stabilising agents were often used although they
are not indispensable. The most commonly used are polyvinylalcohol (PVA),
polyvinylpyrrolidone (PVP), polydiallyldimethylammonium chloride (PDDA)
and cetyltrimethylammonium bromide (CTAB).
1.3.6 SONOCHEMICAL SYNTHESIS
Another approach developed to synthesise metal nanoparticles or nanoclusters
is the environmental friendly sonochemical procedure. The sonochemical
synthesis of noble metal nanoparticles have been intensively studied in recent
years[54-56]. This method consists in an unusual route of which main advantages
are that it does not require high temperatures, high pressures or long reaction
times. The chemical and physical effects of ultrasound do not result from a
direct interaction between the chemical species and the sound waves. It is a
product of acoustic cavitation which is a physical phenomenon that consists in
the formation, growth, and implosive collapse of bubbles[57-59]. From this
phenomenon results the production of high temperature and high pressure in
the collapsing cavities which leads to the decomposition of water molecules
into hydrogen (H●) and hydroxyl (OH●) radicals. This clean ultrasound
methodology has been therefore seen as an interesting possibility to prepare
nanoparticles or nanoclusters of noble metals, usually silver and gold.

CHAPTER 1: INTRODUCTION
26
The sonochemical preparation of gold nanoparticles (d > 2 nm) has been widely
studied[60-64]. In 2003, gold nanocrystals with a mean diameter of
approximately 3 nm were obtained by ultrasonication using ascorbic acid as
reducer of the gold precursor (KAu(CN)2)[65]." In addition, gold nanoparticles
with a mean diameter of 5.2 nm were ultrasonically synthesised using
mesoporous silica as support to increase the nanoparticles stability[61].
The synthesis of metal nanoclusters, usually silver and gold nanoclusters, has
been carried out by different template-based methods[66-68]. The majority of
these methods used polymers as stabilisers of the nanoclusters.
For example, gold nanoclusters have been successfully synthesised using a
hydroxylterminated ethylenediamine core – poly(amidoamine) (PAMAM)
dendrimer (G4OH) – as template. By this procedure stable dendrimer-
encapsulated gold nanoclusters are formed. The gold ions are sequestered into
the dendrimer and then reduced. Gold sequestration results from the
coordination between the gold ions and the tertiary amines of the dendrimer
molecules[69].
Moreover, gold nanoclusters with a diameter below 2 nm were prepared using
a high molecular weight polymer – pentaerythritol tetrakis
(3-mercaptopropionate)-terminated polymethacrylic acid (PTMP-pMAA) – as
capping agent to control the growth of the gold nanoparticles. The method
consisted firstly in mixing the gold precursor (HAuCl4) with the polymer and,
then the reduction of gold was achieved by adding to this mixture a NaBH4
aqueous solution. Finally, the unreacted polymer was removed by preparative-
scale size exclusion chromatography[70].
Very little has been studied in relation to what concerns the sonochemical
synthesis of gold nanoclusters (d < 2 nm). The first one-step sonochemical
synthesis of Au nanoclusters was claimed by Liu et al. in 2011[71]. In this
method bovine serum albumin (BSA) was used to reduce the gold precursor
(HAuCl4) and Au nanoclusters with a diameter around 1.8 nm were obtained.
Moreover, in 2012, the synthesis of gold nanoclusters prepared under
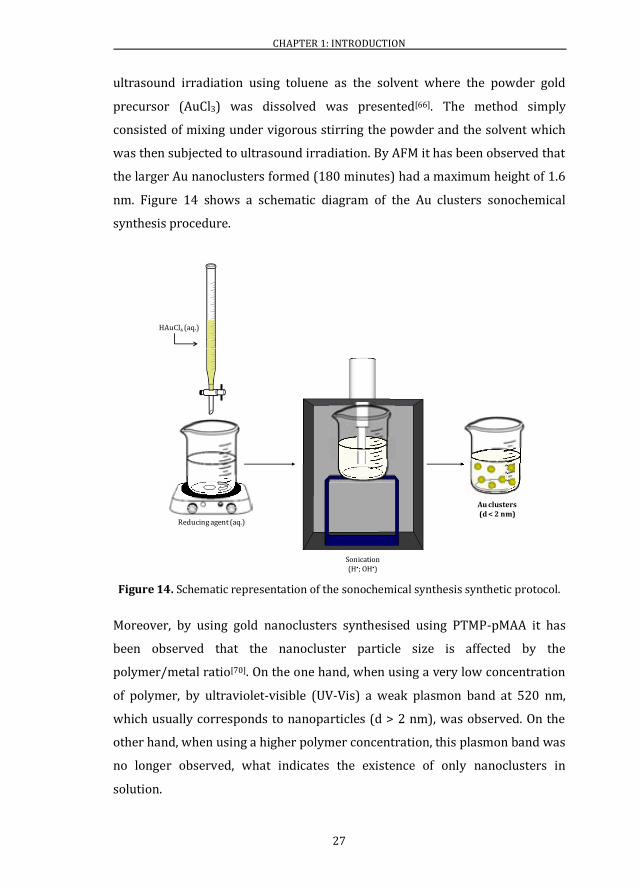
CHAPTER 1: INTRODUCTION
27
ultrasound irradiation using toluene as the solvent where the powder gold
precursor (AuCl3) was dissolved was presented[66]. The method simply
consisted of mixing under vigorous stirring the powder and the solvent which
was then subjected to ultrasound irradiation. By AFM it has been observed that
the larger Au nanoclusters formed (180 minutes) had a maximum height of 1.6
nm. Figure 14 shows a schematic diagram of the Au clusters sonochemical
synthesis procedure.
Figure 14. Schematic representation of the sonochemical synthesis synthetic protocol.
Moreover, by using gold nanoclusters synthesised using PTMP-pMAA it has
been observed that the nanocluster particle size is affected by the
polymer/metal ratio[70]. On the one hand, when using a very low concentration
of polymer, by ultraviolet-visible (UV-Vis) a weak plasmon band at 520 nm,
which usually corresponds to nanoparticles (d > 2 nm), was observed. On the
other hand, when using a higher polymer concentration, this plasmon band was
no longer observed, what indicates the existence of only nanoclusters in
solution.
HAuCl4 (aq.)
Sonication(H•; OH•)
Au clusters(d < 2 nm)
Reducing agent (aq.)

CHAPTER 1: INTRODUCTION
28
Another factor that affects the metal particle size is the type of atmosphere in
which the sonication is carried out. It is preferable to perform sonication under
an argon (Ar) atmosphere instead of air due to the formation rate of gold
nanoparticles. In air the formation rate of the metal nanoparticles will be
significantly lower when compared with that under argon atmosphere[61]. A
decrease of this rate is undesirable once that would lead to the formation of
larger nanoparticles. This difference can be explained by the smaller cavitation
effect in air due to the fact that ratio (Cp/Cv) of air (1.40) is smaller than the one
of argon (1.67). Cp and Cv are the constant pressure-specific heat and constant
volume-specific heat of a medium respectively. It has been proposed that the
oxygen from air inhibits the reduction of gold ions by scavenging reducing
radicals (R●) (Equation 2) and hydrogen (H●) atoms (Equations 3)[61].
ROOOR 2 (2)
22 HOOH HOHOOH (3)
1.3.7 OTHER METHODS
In addition to these synthetic protocols, physical routes have been also
proposed to achieve the synthesis of metal clusters. These include, for example,
the implantation of ions of Au on substracts or the evaporation of Au atoms on
surfaces[72, 73]. Nevertheless, these methods are expensive and complicated and
therefore very difficult to scale-up. Thus the development of an alternative
simpler economical process that allows obtaining a uniform dispersion of Au
clusters represents an advantage over both physical methods and those that
lead to the formation of inactive large Au NPs.
CHAPTER 1: INTRODUCTION
29
1.4 HETEROGENEOUS CATALYSIS WITH GOLD ATOMS
(SYNTHESIS OF ISOLATED GOLD ATOMS)
Gold catalytic activity is extremely dependent on the gold particle size. Smaller
particle catalysts are active but their efficiency in a per metal atom basis is very
low once that only the surface low coordinated active site atoms are used. Thus,
downsizing the clusters to single atoms is highly desirable to increase the atom
efficiency in catalytic reactions. However, obtaining stable isolated metal atoms
on a surface is a challenge essentially because of their high mobility which
might cause sinter under reaction conditions.
In 2011 the first Pt single-atom catalyst was synthesised by Qiao et al. and
consists of only isolated single Pt atoms on FeOx[74]. This catalyst was
synthesised by a co-precipitation method. The authors also observed that this
single Pt atoms catalyst had a very high activity for CO oxidation[74]. The activity
of this new catalyst was found to be almost the triple that of a catalyst
containing isolated Pt atoms, two-dimensional Pt rafts with less than 10 atoms
and three-dimensional Pt clusters (d < 1nm) for CO oxidation reaction. The
activity obtained has been related by density functional theory calculations to
the partially unoccupied 5d orbitals of the positively charged, high-valent Pt
atoms. These will reduce the CO adsorption energy and the activation barriers
for the CO oxidation[74].
Since these first observations, the interest in the atomic catalysis field has
grown significantly. The synthesis of catalysts with only single metal atoms has
been achieved by other methods. Sun et al. using the Atomic Layer Deposition
technique obtained a single atoms Pt/graphene catalyst[75]. A 10 times higher
catalytic activity for the methanol oxidation reaction has been observed for the
single atom Pt/graphene catalyst when compared to the commercial Pt/C
catalyst. Experimental X-ray Absorption Fine Structure (XAFS) data revealed
that the partially unoccupied 5d orbitals of the Pt atoms are responsible for the
increased activity observed as it was previously stated by Qiao et al.[74]. The

CHAPTER 1: INTRODUCTION
30
synthesis of other metal isolated atoms catalysts was also achieved for example
using Pd[76, 77].
Regarding gold, using subanometric Au clusters several studies were carried
out and revealed its exceptional activity when compared to gold
nanoparticles[78-81]. Nevertheless, since it is difficult to synthesise a uniform
catalyst with a unique population of single gold atoms, the study of the activity
of these species has not been well investigated yet and the activity of single Au
atoms is still unclear. It is claimed that the chemical reactivity of positively
charged single Pt atoms is different from that of isolated Au atoms or cations[74].
Generally, the results obtained until now indicate that single Au atoms are not
active for CO oxidation. Lee et al. observed that isolate gold atoms (Aun, n=1)
were inactive for the CO oxidation and that gold clusters with a very low
number of atoms (Aun, n<3) are less active than clusters with a higher number
of Au atoms (Aun, n=6-7)[82]. In addition, the same group observed that the
catalysts prepared by Au1δ+ or Au2
δ+ on TiO2 are much less active than TiO2.
They claim that these gold species poison vacancy sites[83]. In the same way,
Herzing et al. observed that it was the 0.5 nm bilayer Au cluster rather than the
0.2-0.3 nm monolayer Au clusters or isolated Au atoms that was active for CO
oxidation using FeOx as support[84].
The synthesis of single Au atoms is therefore a challenge and a field of interest.
Thus, the activity of these species in reactions with different mechanisms can
be investigated. Recently, for the first time, the synthesis of isolated gold atoms
on a support in the absence of clusters or nanoparticles was reported[85, 86]. In
2009, Uzun et al. achieved for the first time the synthesis of a unique population
of single gold atoms on a high area support (MgO)[85]. Later in 2012, Lu et al.
presented a catalyst composed only by isolated gold atoms supported on a
crystalline zeolite support (NaY)[86].
The discovery of single-atoms metal catalysts is very promising; not only due to
the higher reactivities observed but also because it allows the reduction of the
high cost of commercial noble-metal catalysts in industry.

CHAPTER 1: INTRODUCTION
31
1.5 CATALYSTS SUPPORTS
The interest of using supported catalysts resides in the fact that; in this way a
higher dispersion of the active phase will be achieved. Importantly, the catalyst
support can increase the catalytic activity due to their specific properties and
the metal-support interaction (Section 1.2.2).
Different materials have been used as support where the metal clusters can be
anchored. Usually, inorganic oxides such as for example CeO2, TiO2, ZrO2, Fe2O3
and SiO2 are preferable for high temperature reactions due to their high
thermal stability. This characteristic is essential, for example, for catalysts used
in high temperature environments such in vehicle exhausts. These inorganic
oxides materials are also preferable for oxidation reactions such as CO
oxidation due to their intrinsic characteristics. Indeed, CeO2 is a commonly used
support of Au clusters catalysts for CO oxidation. The enhanced catalytic
properties of this material are related to its high oxygen store capacity. This
results from the high mobility of the oxygen vacancies in the solid, thereby
giving it the ability to release stored oxygen under reaction conditions’ tests
(the shift between the Ce(III) and Ce(IV) oxidation states leads to a high oxygen
mobility in the ceria lattice) [87, 88]. The high oxygen mobility in the ceria lattice
results from the size, dispersion and quantity of oxygen vacancy defects in the
lattice[89]. For this reason, the structure of the synthesised ceria is very
important.
The most common method to prepare active Au/CeO2 catalysts is
deposition-precipitation (DP).
Furthermore, TiO2, besides being active for CO oxidation reaction, due to its
oxygen storage capacity it is also widely used in photocatalysis. Indeed, TiO2 is
known as the most adequate semiconductor for the photocatalytic production
of H2[90]. Generally, the photocatalytic reaction consists in producing
electron-hole pairs (e-—h+) that can either recombine or react with adsorbed
species. Thus, by exciting TiO2 with photons of equal or higher energy than the
band gap energy, these pairs are obtained.
CHAPTER 1: INTRODUCTION
32
The methods used to synthesise Au/TiO2 catalysts involve deposition-
precipitation, wet impregnation and anion and cation adsorption[91]. The most
widely used method to prepare Au/TiO2 catalysts is deposition-precipitation[92,
93]. Using this method, active catalysts with a mean particle diameter of 3.2±0.7
nm have been synthesised[92]. These were found to be active for CO oxidation at
low temperature (80 ºC). Also, Haruta developed a method that allows very
small Au nanoparticles (2 < d (nm) < 5) on TiO2 to be obtained[94, 95]. This was
the deposition-precipitation method with NaOH. Nevertheless, low gold
contents such as 3 wt% must be used in order to decrease the Au particle size.
Other possible synthesis methods, such as anion adsorption or cation
adsorption, were also investigated. On the one hand anion adsorption led to a
larger mean particle size (~ 4 nm) with a gold content of 1.5 wt%[27]. On the
other hand cation adsorption led to a lower particle size (~ 2 nm) for a
determined solution/support contact time (1 hour) and for gold loadings not
higher than 2 wt%.
Overall, the deposition-precipitation with urea has been considered the most
efficient method to prepare high loadings Au clusters supported on TiO2
catalysts. The advantage of this protocol over the DP with NaOH is that all gold
in solution is deposited on TiO2 leading to the same lower mean particle
diameter (~2 nm) but using a higher gold content. For example, when using a
TiO2 with a surface area of 45 m2/g the amount of gold deposited corresponded
to the maximum gold loading (8 wt%) on TiO2. In this case 2.7 nm Au
nanoparticles were formed. Decreasing the gold content to 3 wt% 2.3 nm Au
NPs were formed and with 2 wt% 2 nm particles were obtained[27].
Finally, carbon supports such as multiwalled carbon nanotubes (MWCNTs) are
also suitable to obtain stable Au clusters active catalysts. Since their discovery,
in 1991, by Iijima, carbon nanotubes (CNTs) interest in several fields has been
growing significantly[96]. They can be found as multiwalled (MWCNTs) or
singlewalled (SWCNTs). It is the carbon nanotubes exceptional chemical,
thermal, optical, magnetic, mechanical and electronic properties that give them
a wide range of applications. Indeed, these can be found, for example, in
CHAPTER 1: INTRODUCTION
33
electronic devices, including field-effect transistors, single electron transistors
and rectifying diodes, as well as in energy storage such as hydrogen storage[97].
Furthermore, nowadays, catalysis is also known as a potential field for carbon
nanotubes’ applications. Indeed, since the last decade, a significant increase in
the number of publications and patents was noticed. CNTs are considered as an
attractive alternative to the common supports, due to their unique properties,
namely: high purity (self-poisoning elimination); exceptional mechanical
properties; high electrical conductivity and thermal stability; easy accessibility
of the active phase; inexistence of any microporosity (elimination of diffusion
and interparticle mass transfer); specific metal-support interaction. Besides,
CNTs, when compared to common supports, show a high ability of dispersion of
the active phase due to their high surface area.
Until now, CNTs catalysts’ activity has been tested essentially in important
liquid hydrogenation, hydroformylation or gas phase (Fischer-Tropsch process,
ammonia decomposition) reactions and for electrocatalysis (fuel-cell
electrodes)[98].
Over the years several approaches have been developed in order to obtain
active Au/CNTs catalysts with diameters lower than 5 nm. Some of the
protocols used to synthesise Au/CNTs catalysts are presented in Table 2.

CHAPTER 1: INTRODUCTION
34
Table 2. Au/CNTs catalysts synthetic protocols.
Author Year Catalyst Method Particle diameter (nm)
Choi et al.[99] 2002 Au/SWCNTs Redox reaction between Au3+ ions (from HAuCl4) and
SWCNTs in ethanol/water mixture (1:1).
< 7 nm (~ 30 s)
~ 7 nm (3 minutes)
~ 16 nm (> 3 minutes)
Tzitzios et al.[100] 2006 Au/SWCNTs
Au nanoparticles coated with olylamine obtained by
reduction of HAuCl4 using polyethylene glycol-200 as
reducing agent in singlewalled carbon nanotubes-
dimethylformamide (SWCNTs-DMF) solution.
~ 5 nm
Zanella et al.[101] 2005 Au/MWCNTs
Gold nanoparticles synthesised using citric acid deposited
on the surface of functionalised with aliphatic bifunctional
thiols MWCNTS.
Au nanoparticles were attached to the terminal thiol groups
through Au-S bond.
~1.7 nm (1,6-hexanedithiol)
~ 5.5 nm (aminothiol)
Hu et al.[102] 2006 Au/MWCNTs
Deposition of Au NPs on MWCNTs functionalised with
polyethyleneimine (PEI). The polymer was also used as
reducer of the Au nanoparticles.
~ 15 nm
(400:1 molar ratio PEI:HauCl4)
28 ~ 158 nm
(2:1 molar ratio PEI:HauCl4)
Ismaili et al.[103] 2011 Au/MWCNTs Deposition of functionalised Au nanoparticles on MWCNTs
by a photoinitiated carbine addition reaction
3.9±0.9 nm
1.8±0.3 nm

CHAPTER 1: INTRODUCTION
35
1.6 GOLD CATALYSTS’ PRACTICAL APLICATIONS
In recent years, gold has been regarded with much more interest due to its
catalytic properties. As it was mentioned in the beginning of this chapter,
Haruta and other authors discovered that supported gold nanoparticles with a
determined particle size (d < 5 nm) showed an exceptional catalytic activity in
several oxidation reactions, such as the CO oxidation, selective oxidation of
propene to propene oxide, water gas shift, NO reduction, selective
hydrogenation of acetylene or butadiene among others[1, 2].
In this section, the interest of the reactions used in this work to evaluate the
catalysts activity is described.
1.6.1 CO OXIDATION
Catalysts able to promote the oxidation of carbon monoxide to carbon dioxide
are required and are of great importance. Direct applications related to air
purification give it an extreme importance not only at the academic level but
also for human safety. In these applications the catalytic activity at room
temperature is required.
In environmental applications, such as automotive catalytic converters, the CO
oxidation is carried out by impregnating the catalyst in a monolith. These are
honeycomb structures with many small, parallel square channels (Figure 15).
The flow gas introduced into the monolith channels contacts with the catalyst
that is deposited on the channel walls. The major advantages of monoliths are
their high surface area per unit of volume (compactness), the large open frontal
area (low pressure drop) and the very good attrition resistance[104]. Indeed,
when compared to other catalyst structures such as pellets or foams a
significantly lower pressure drop is observed for the same geometric surface
area. This fact in environmental applications is very important once that large
volumetric flow rates are usually used[105].
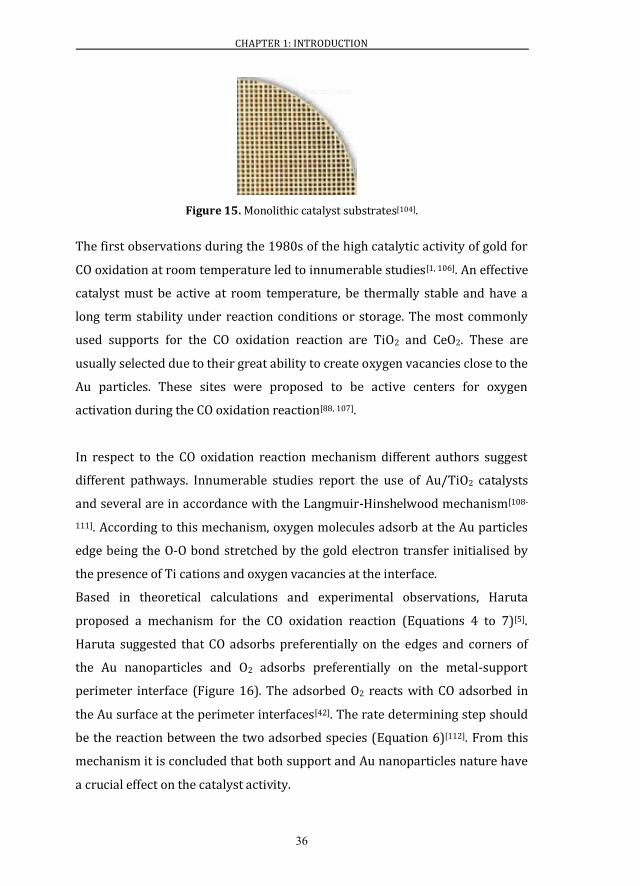
CHAPTER 1: INTRODUCTION
36
Figure 15. Monolithic catalyst substrates[104].
The first observations during the 1980s of the high catalytic activity of gold for
CO oxidation at room temperature led to innumerable studies[1, 106]. An effective
catalyst must be active at room temperature, be thermally stable and have a
long term stability under reaction conditions or storage. The most commonly
used supports for the CO oxidation reaction are TiO2 and CeO2. These are
usually selected due to their great ability to create oxygen vacancies close to the
Au particles. These sites were proposed to be active centers for oxygen
activation during the CO oxidation reaction[88, 107].
In respect to the CO oxidation reaction mechanism different authors suggest
different pathways. Innumerable studies report the use of Au/TiO2 catalysts
and several are in accordance with the Langmuir-Hinshelwood mechanism[108-
111]. According to this mechanism, oxygen molecules adsorb at the Au particles
edge being the O-O bond stretched by the gold electron transfer initialised by
the presence of Ti cations and oxygen vacancies at the interface.
Based in theoretical calculations and experimental observations, Haruta
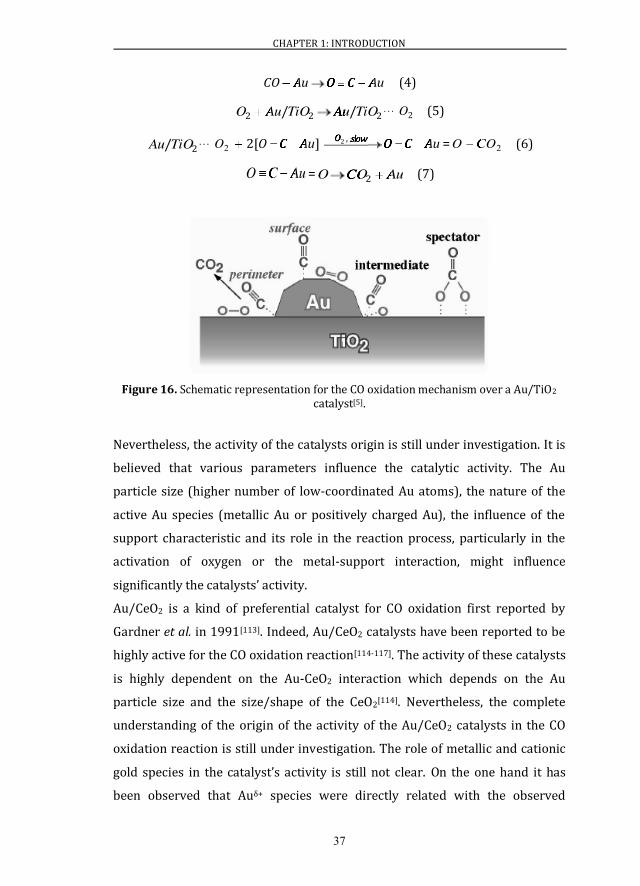
proposed a mechanism for the CO oxidation reaction (Equations 4 to 7)[5].
Haruta suggested that CO adsorbs preferentially on the edges and corners of
the Au nanoparticles and O2 adsorbs preferentially on the metal-support
perimeter interface (Figure 16). The adsorbed O2 reacts with CO adsorbed in
the Au surface at the perimeter interfaces[42]. The rate determining step should
be the reaction between the two adsorbed species (Equation 6)[112]. From this
mechanism it is concluded that both support and Au nanoparticles nature have
a crucial effect on the catalyst activity.
CHAPTER 1: INTRODUCTION
37
AuCOAuCO AuCOAu (4)
222 TiOAuTiOAuO // AuAu . . . 2O (5)
2TiOAu/ . . . 2O AuCOAuCO slowO AuCslowslowslowslow OOOAuC ,][ 22 = 2COO CO (6)
AuCO AuC = AuCOO AuCO2 (7)
Figure 16. Schematic representation for the CO oxidation mechanism over a Au/TiO2
catalyst[5].
Nevertheless, the activity of the catalysts origin is still under investigation. It is
believed that various parameters influence the catalytic activity. The Au
particle size (higher number of low-coordinated Au atoms), the nature of the
active Au species (metallic Au or positively charged Au), the influence of the
support characteristic and its role in the reaction process, particularly in the
activation of oxygen or the metal-support interaction, might influence
significantly the catalysts’ activity.
Au/CeO2 is a kind of preferential catalyst for CO oxidation first reported by
Gardner et al. in 1991[113]. Indeed, Au/CeO2 catalysts have been reported to be
highly active for the CO oxidation reaction[114-117]. The activity of these catalysts
is highly dependent on the Au-CeO2 interaction which depends on the Au
particle size and the size/shape of the CeO2[114]. Nevertheless, the complete
understanding of the origin of the activity of the Au/CeO2 catalysts in the CO
oxidation reaction is still under investigation. The role of metallic and cationic
gold species in the catalyst’s activity is still not clear. On the one hand it has
been observed that Auδ+ species were directly related with the observed

CHAPTER 1: INTRODUCTION
38
activity in Au/CeO2 catalysts[118]. It has been shown that the interaction
between cationic Au and CeO2 is responsible for the high catalytic activity
observed due to the consequent enhance of the ceria surface oxygen
reducibility[119]. On the other hand, the activity of these catalysts has been
attributed to the interaction between the metallic Au with the defects on the
ceria surface which leads to the formation of Au+-OH- active species[120].
According to Qian et al. Auδ+ species alone are not active for the CO
oxidation[121]. The authors claim that the metallic Au nanoparticles are more
important for the efficient CO oxidation’s reaction.
Some more important observations concerning the Au/CeO2 catalysts activity
in the CO oxidation reaction have been made. Carrettin et al. concluded that the
structure of the CeO2 highly influences the Au/CeO2 catalytic activity[115]. The
authors showed that when Au was deposited on nanocrystalline particles of
CeO2 double the catalytic activity was observed when compared to Au/CeO2
catalysts prepared by co-precipitation or to Au deposited on a regular CeO2
support. In the same context the synthesis of Au/CeO2 catalysts by different
methods for the CO oxidation at room temperature has been carried out[116].
CeO2 with a large surface area (120 m2/g) was synthesised (crystallite size: 9-
20 nm) by a hydrothermal method. Then, the Au was supported on this
material in very low loads (0.44 wt% - 0.52 wt%) by different methods such as
hydrothermal deposition-precipitation, hydrothermal precipitation,
hydrothermal co-precipitation and by co-precipitation and deposition-
precipitation. It has been observed that the Au/CeO2 catalyst prepared by
hydrothermal deposition-precipitation is the one that shows the higher
catalytic activity (a complete conversion of CO was achieved around 20 ºC). By
ultraviolet-visible (UV-Vis) spectroscopy the authors observed that both Au
clusters and nanoparticles coexist in this catalyst[116]. The observed high
catalytic activity was attributed to the catalyst larger surface area and the
presence of both cationic (Au+ and Au3+) and metallic gold species, being the
Au+ the dominant active species.

CHAPTER 1: INTRODUCTION
39
Furthermore, the influence of the Au particle size was also investigated by Tana
et al.[114]. The activity of Au/CeO2 catalyts synthesised with a CeO2 particle size
of 12 nm and a Au particle size varied from 3.9 nm to 7.5 nm has been
investigated. It has been observed that at 0 ºC CO conversions of 63%, 30% and
12% were obtained when using Au/CeO2 catalysts with a nanoparticle mean
diameter of 3.9 nm, 5.4 nm and 7.5 nm respectively. These observations are in
accordance with the fact that more low-coordinated Au sites exist in smaller
particles (Section 1.2.1). The existence of more active sites on the Au-CeO2
interface where the reaction occurs will lead to an efficient adsorption of CO
and a faster surface reaction of CO with the oxygen species from CeO2. In the
same work the effect of metallic Au in the CO oxidation has also been
investigated using the extremes in Au sizes (3.9 nm and 7.5 nm)[114]. Metallic Au
particles were removed by sodium cyanide leaching. A significant decrease of
the catalytic activity was observed (CO conversion was only observed around
205 ºC for both catalysts) which indicates that metallic Au is essential for the
observed high catalytic activity in the Au/CeO2 catalysts.
Finally, the effect of the pre-treatment atmosphere on the Au/CeO2 catalytic
activity has also been reported[117]. It has been observed that none of the pre-
treatments used (H2, air, O2, N2, O2 followed by 14 v/v% H2 (balanced with N2)
and 14 v/v% H2 (balanced with N2) followed by O2) affect the morphology and
structure of the catalysts. The higher catalytic activity was obtained when the
Au/CeO2 catalyst was pre-treated with a oxidative atmosphere followed by a
reductive atmosphere – O2 followed by 14 v/v% H2 (balanced with N2). The
different pre-treatments will lead to different ratios of cationic and metallic Au
species on the CeO2 surface (different Auδ+/Au0 relations responsible for the
activities observed are achieved). It has been claimed that an appropriate
relation between cationic and metallic gold should exist in order to enhance the
catalytic activity[117]. The authors claimed that both species have a specific role
in the reaction. While Au0 activates the O2 molecule, the hydroxyl containing
Auδ+ will facilitate the conversion of CO to CO2. The unpretreated sample of this
work only presents cationic gold. In this way, a Auδ+/Au0 ratio approximately

CHAPTER 1: INTRODUCTION
40
closed to the ideal will be achieved by pre-treating the catalyst with O2 followed
by H2 atmospheres leading thus to the higher catalytic activity observed.
Deposition-precipitation and co-precipitation synthesis methods are the most
commonly used synthetic protocols to prepare highly active Au/CeO2 catalysts
for CO oxidation. When comparing some of these Au/CeO2 deposition-
precipitation and co-precipitation synthesised catalysts activities (Figure 17), it
was firstly noticed that the catalysts prepared by the deposition-precipitation
method (DP1[122], DP2[46], DP3[46], DP4[114]) are more active than the one
prepared by co-precipitation (Co-P[29]). The activity is represented in terms of
reaction rate, i.e. mol of CO converted per second and square meter of Au.
Figure 17. Comparsion of the catalytic activity of the DP1 ( ), DP2 ( ), DP3
( ), DP4 ( ) and Co-P ( ) catalysts for the CO oxidation. The in-set indicates the Au nanoparticle diameter of each catalyst.
Furthermore, comparing the catalysts DP1, DP3 and DP4 which are composed
by Au with a mean diameter of 4.5 nm, 2.5 nm and 3.9 nm respectively the
effect of the Au particle size in the catalytic activity was noticed. Table 3 shows
the reaction rate values obtained at the temperature of 40 ºC using these
catalysts. Larger particles led to a decrease of activity as it has been widely
reported[45, 114, 123].
2 72 322 372
202
402z32 /8
602z32 /8
802z32 /8
:02z32 /8
302z32 /7
304z32 /7
306z32 /7
308z32 /7
"
"
Tgcevkqp"tcvg"*oqn0u/30o
Cw/4+
V"*¼E+
DP1: d = 4.5 nmDP2: d = 2.5 nmDP3: d = 2.5 nmDP4: d = 3.9 nmCo-P: d = 12.3 nm

CHAPTER 1: INTRODUCTION
41
Table 3. Activity of different sized DP synthesised Au/CeO2 catalysts[46, 114, 122].
Catalyst nomenclature d (nm) Reaction rate (mol.s-1.mAu
-2) T=40 ºC
DP3 2.5 4.7x10⁻⁶
DP4 3.9 2.9x10⁻⁶ (a)
DP1 4.5 1.8x10⁻⁶
(a) T ~ 41.86 ºC
So far, it could be concluded that small particle size Au clusters catalysts which
have a high quantity of low coordinated Au atoms and a strong interaction with
the support are those who lead to higher catalytic activities. Some synthetic
protocols such as co-precipitation and deposition-precipitation are commonly
used to prepare active CO oxidation Au/CeO2 catalysts. Nevertheless, the
methods that allow to obtain an uniform population of Au clusters (d < 2 nm)
are still very few. For this reason, there is an ongoing search for new and
alternative methods easily scaled-up that allow to obtain an uniform
distribution of supported Au clusters active catalysts. Moreover, the
development of a synthesis method that allows a unique population of single Au
atoms to be obtained is also of great interest. The activity of these species is still
unclear since very few authors have been able to synthesise single Au atoms.
1.6.2 CATALYTIC OXIDATION OF CARBONACEOUS MATERIALS
SOOT OXIDATION
Diesel engines, among other pollutants, emit particulate matter such as soot
that is harmful for the environment. In order to decrease these emissions
catalytic filters are used in the exhaust pipe. Nonetheless, soot combustion
occurs at a very high temperature (around 550 ºC – 600 ºC). This temperature is
much higher than the typical operating temperature of an exhaust
(approximately 200 ºC – 400 ºC)[124]. For this reason, the development of
catalysts able to decrease the soot combustion temperature down to the

CHAPTER 1: INTRODUCTION
42
temperature of gases in the exhaust pipe is required. A soot particle consists of
a carbon core contaminated with metal compounds with different
hydrocarbons and sulfates adsorbed on their surface. These particles usually
have pore sizes higher than 20 nm, (Figure 18).
Figure 18. HRTEM image of soot particles from an engine collected using a Cummins
ISB diesel engine[125].
Numerous studies referring the catalytic oxidation of soot have been
reported[126, 127]. In order to determine the reaction rates these materials were
oxidised under controlled conditions. The reaction rate of this oxidation
reaction depends on several parameters, as the soot material used, the catalyst,
the catalyst/soot ratio, the oxygen partial pressure and the contact between the
soot and the catalyst. A sample pre-treatment also influences the reaction rate
once that the desorption of adsorbed hydrocarbons on soot will take place. A
first treatment in inert gases could also change the contact between the soot
5 nm
CHAPTER 1: INTRODUCTION
43
and the catalyst or lead to the catalyst reduction by reaction between the soot
and the metal oxide[128].
Usually, for this reaction the activity is measured in terms of the temperature at
which 50% of the carbon material is converted (T50). Nevertheless, in some
cases, this is also presented as the temperature of the maximum combustion
rate (Tm).
The contact between the soot and the catalyst is extremely important in order
to observe a good catalytic activity. There are two types of contact named
“loose” and “tight”. Loose contact consists simply in mixing the catalyst and
soot with a spatula for about 10 minutes in a reproducible way. The tight
contact is achieved by grinding the catalyst with soot with a magnetically
driven mortar for around 5 minutes[129].
Evidences about the differences between both contact modes have been
reported[130]. For example, it was observed that Co3O4 or PbO catalysts are able
to decrease the soot combustion temperature to around 430 ºC when in the
tight mode. The same Co3O4 catalyst using the loose contact was almost inactive
(Tm ∽ 580 ºC), reaffirming the importance of the contact mode[128].
Several catalysts have been presented as catalytic active for the soot oxidation
reaction. Catalysts with a high oxygen store capacity, and with redox functions,
are preferable due to the reaction mechanism. For this reason CeO2 based
catalysts are widely used for this reaction[129, 131]0""
In what concerns to the mechanism reaction, several hypothesis were
proposed[131]. Many authors agree in a redox route pathway, over these
catalysts (Equations 8 to 10). According to this mechanism the oxygen from the
CeO2 will react with soot. As a result of this reaction, carbonates will be formed
and adsorbed on the support surface. Nevertheless, gas phase oxygen is able to
decompose this carbonate species as well as provide the re-oxidation of the
support:

CHAPTER 1: INTRODUCTION
44
OMOgasM oxred OMoxMoxMOgas (Oxidation of CeO2) (8)
SOCMCOM redfox SOCMredCO (Transfer of the oxygen to the carbon active site on
the surface and consequently reduction of CeO2) (9)
COorCOSOC 2CO (Decomposition of the surface carbon-oxygen complex) (10)
where,
redM - reduced state of CeO2.
OMox O - oxidised state of CeO2.
Ogas O - oxidant gas (for example, O2, NO, NO2).
fC - carbon active site on the carbon surface.
SOC - surface carbon-oxygen complex.
Finding a catalyst able to work efficiently for this purpose it is not easy. An
effective catalyst must be able to operate efficiently at low temperatures and at
the same time it must be thermally stable, i.e. it must not deactivate after being
at the maximum temperatures of exhaust gases (from 200 ºC to 850 ºC
approximately, depending on the engine).
The two main factors limiting soot oxidation are: the contact between soot and
the catalyst and the intrinsic activity of the catalyst. Indeed, the commonly used
catalysts have smaller pore sizes (< 10 nm) than soot particles (> 20 nm) which
makes it difficult for soot particles to enter the inner pores of these
catalysts[132]. Due to the poor soot/catalyst contact the reaction rate is usually
very low[133].
Over the years, several catalysts have been proposed to decrease the soot
oxidation temperature. For example, fuel borne catalysts (FBCs) (metal-based
fuel soluble catalysts that are included in the fuel to catalyse the oxidation of
soot) or molten salt catalysts have been developed and are able to increase the
contact between the soot and the catalyst by wetting the soot surface, which is
one of the main drawbacks of the soot catalytic conversion and thus decrease
CHAPTER 1: INTRODUCTION
45
the oxidation temperature[134-137]. Using FBCs catalysts the reaction
temperature can be decreased from approximately 600 ºC to 350 ºC[138]. A good
activity was also obtained for perovskites (La1-xCsxCoO3, LaMnO3 and
La0.9K0.1Cr0.9O3-γ) because of their good stability and intrinsic catalytic
activity[139, 140]. The activity of these catalysts is attributed to their capability to
deliver α-type weakly chemisorbed oxygen species to the combustion
reaction[140, 141]. α-type oxygen desorption results from the oxygen
accommodated in oxygen vacancies[142]. Thus, an increase of oxygen vacancies
leads to an increase of α-type oxygen species. This dissociatively adsorbed
oxygen is believed to be responsible for the complete oxidation of
hydrocarbons[142]. In this way, a higher quantity of these species is favourable
to achieve a complete oxidation[142]. It has also been found that the addition of
NO2 helps to decrease the soot oxidation temperature since it is a strong
oxidant[143-145]. Furthermore, it has been observed that the most promising
catalysts for soot oxidation are composed by potassium on oxides of transition
metals such as Cu, V, Mo, Co or Fe[135, 136, 146, 147] or in combined systems of Co,
K/MgO or Ba, K/CeO2 due to their strong oxidative properties[143, 148, 149].
Several supports such as ZrO2, TiO2, Al2O3 and CeO2 have been reported for the
use in soot oxidation[133, 150]. Van Doorn et al. concluded that for soot oxidation
under an O2 atmosphere Al2O3 and SiO2 are not active. These authors observed
a moderate activity for TiO2 and ZrO2 and a very high activity for CeO2,
La2O2CO3 and V2O5 (Figure 19)[150].

CHAPTER 1: INTRODUCTION
46
Figure 19. Effect of the type of support in the combustion temperature of soot under tight contact conditions in air[150]. ΔTm: Difference of temperatures of the maximum
combustion rate between the bare soot and the catalyst-soot.
Several authors observed the activity of CeO2 alone for soot oxidation[133, 150-153].
The reactivity of CeO2 is related with its high oxygen store capacity and redox
properties. CeO2 ability to change oxidation state during the reaction (CeO2 to
CeO2-x) without structure modification will make easy oxygen uptake and
release giving this catalyst a high oxygen storage capacity. This is an important
property since the oxygen released from the lattice intervenes directly in the
reaction[153]. In this way, several authors justify the good activity of CeO2
catalysts with the high availability of surface oxygen and high surface
reducibility[151-154]. The main drawback of using CeO2 is its deactivation due the
particle sinter after being at high temperatures in reaction conditions. In this
way CeO2-based binary and ternary mixed oxides have been studied as possible
catalysts to overcome this handicap[155]. It has been observed that the
modification of CeO2 with transition or rare earth metals (Zr4+, La3+, Y3+ or
Sm3+) stabilises the surface area, improves the redox properties of CeO2 and
decreases the thermal deactivation[155, 156]. Thus, these catalysts are known for
their optimal redox properties, oxygen storage and releasing and thermal
stability[157].
0
50
100
150
200
250
CeO2
V2O5
La2O2CO3
TiO2ZrO2
Al2O3SiO2
T m (ºC
)
soot
CHAPTER 1: INTRODUCTION
47
The increase of the CeO2 activity can also be achieved by simply doping CeO2
with metals. This enhancement of activity results from the metal-support
interaction that is responsible for the increase of the redox properties of the
pure CeO2[143, 152, 158-160]. Different metals such as Ag, K, Co, Ba deposited on the
CeO2 surface were used as efficient catalysts to reduce the soot combustion
temperature[133, 144, 161].
Table 4 shows a compilation of the different types of catalysts described for this
reaction in literature (the soot oxidation temperature was measured either
with temperature programmed combustion or with thermogravimetric
methods).

CHAPTER 1: INTRODUCTION
48
Table 4. Activity of different catalysts for soot oxidation under tight contact conditions in air.
Catalyst %O2 Soot/catalyst ratio T50(b)(ºC) ΔT50
(c)(ºC)
Supported
metal
nanoparticles
Co/MgO[148] 6 1:20 >500(a) n.a.
Ba/CeO2[143] 6 1:20 480(a) n.a.
KOH/MgO[149] 21 1:4 440(a) ∽210
Co, K/MgO[148] 6 1:20 ~ 400(a) n.a.
Co, K/CeO2[145] 6 1:20 350(a) ∽ 250
Ag/ZrO2[133] 20 1:20 341 n.a.
Co/CeO2[159] 6 1:20 300-340(a) 300-260
Inorganic
oxides
ZrO2[133] 20 1:20 527 n.a.
TiO2[150] 15 4:1 502-517(a) ~ 90
La2O2CO3[150] 15 4:1 442-457(a) ~ 150
CeO2[133] 20 1:20 411 n.a.
V2O5[150] 15 4:1 372-382(a) ~ 220
Perovskites LaMnBO, LaFeO3, LaMnO3, La1-xKxMnO3[139] 20 1:9 500-550(a) ~ 160-110
LaCrO3, LaCr0.9O3, LaCr0.8O3, LaVCr0.9O3[139] 20 1:9 450-500(a) ~ 210-160
(a) Temperature of the maximum combustion rate. (b) Temperature at which 50% of the soot is converted. (c) Difference of temperatures at which 50% of soot is converted between the bare soot and the catalyst-soot. n.a. – not available data.
CHAPTER 1: INTRODUCTION
49
The catalytic activity of Au for soot oxidation has not been widely studied yet.
In 2011, Ruiz et al. concluded that Au/support (SiO2, ZrO2 or ZrO2.nH2O)
catalysts present a very poor activity for soot oxidation in a O2/He atmosphere
(ΔTm = 3 ºC)[162]. Nonetheless, when performing soot oxidation in an
atmosphere with NO, higher activities were obtained (ΔTm = 54 ºC). The slight
increase of activity observed for Au catalysts in the presence of NO is a result of
the gold capacity to adsorb the NO and generate superficial NO2 which is more
oxidant than oxygen or nitrate ions[162]. In the same way, these Au catalysts
promoted with CsNO3 showed a significant increase of activity in O2 (ΔTm = 230
ºC), since the high nitrate ion concentration favours the soot oxidation. For this
reason, with these catalysts, the atmosphere effect was not so noticed (ΔTm =
230 ºC in O2/He; ΔTm = 220 ºC in NO/O2/He). Finally, despite the high activity of
bare CsNO3 catalysts, the authors found that they were not selective to CO2.
They concluded that the addition of Au was required to achieve a CO2
selectivity of 100% indicating that all the CO formed in the combustion was
transformed in CO2[162].
Later, in 2012, the same group, using lithium nitrate (LiNO3) and Au catalysts,
in accordance to what was previously observed, concluded that catalysts with
lithium nitrate and gold were more active than catalysts containing only gold
which was attributed to the presence of nitrate ions that will be part of the
reaction in the redox cycle[163]. As before, it was confirmed that the NO addition
in the feed accelerates the combustion rate in all catalysts and that gold
presence led to a total selectivity of CO2.
Furthermore, with the goal of achieving high activities, Craenenbroeck et al.
combined the oxidation properties of Au NPs with the redox properties of
vanadia (V) – Au-V/TiO2 or Au-V/ZrO2 – catalysts. These authors observed a
much higher activity for the Au-V/TiO2 (ΔTm = 113 ºC) or Au-V/ZrO2 catalytic
systems (ΔTm = 54 ºC) than to Au/ZrO2 (ΔTm = 21 ºC) or Au/TiO2 (ΔTm = 42 ºC)
vanadia-free samples in air[164]. Au-V catalysts were able to decrease the initial
temperature at which oxidation of the carbon nucleus starts down to
approximately the desired temperature range of 300 ºC – 400 ºC[164]. In these

CHAPTER 1: INTRODUCTION
50
catalysts the addition of gold produces two effects: Au particles promote the
oxygen transfer which increases the activity in the combustion of soot particles;
Au particles will provide active sites and therefore the soot combustion
temperature will decrease[164].
The activity of Au NPs supported on three-dimensionally ordered macroporous
(3DOM) Ce1-xZrxO2 for soot combustion was studied by Wei et al. under loose
contact conditions (atmosphere: 5 v/v% O2 and 0.2 v/v% NO balanced with
Ar)[132]. The 3DOM Ce1-xZrxO2 catalysts showed a better catalytic activity for
soot oxidation than the disordered macroporous and nanoparticles samples
due to the bigger pore size (> 100 nm) (Table 5)[165, 166]. In this way, soot
particles (> 20 nm) can easily enter the catalysts inner pores and be easily
transported and diffused leading to a higher number of contact points between
soot and the catalyst[132].
Table 5. Activity of Au nanoparticles supported on 3DOM Ce1-xZrxO2 catalysts for soot combustion under loose contact condition[132]. Atmosphere: 5 v/v% O2 and 0.2 v/v% NO
balanced with Ar.
Catalysts d
(nm) T50
(a) (ºC)
ΔT50(b)
(ºC) Soot/catalyst
mass ratio SCO2 (%)
soot - 585 0 - 55
3DOM ZrO2 - 485 100
1:10
76.9
CeO2 - 445 140 98.0
Au/(3DOM ZrO2) 3.2 430 155 97.8
3DOM Ce0.3Zr0.7O2 - 422 163 78.7
3DOM Ce0.6Zr0.4O2 - 415 170 82.6
Au/(3DOM Ce0.3Zr0.7O2) 3.2 407 178 98.5
3DOM CeO2 - 390 195 97.3
3DOM Ce0.9Zr0.1O2 - 378 207 85.7
Au/(3DOM Ce0.6Zr0.4O2) 3.2 377 208 99.7
Au/(3DOM Ce0.9Zr0.1O2) 3.3 361 224 99.7
Au/(3DOM CeO2) 3.4 349 236 99.8
(a)Temperature at which 50% of the soot is converted. (b)Difference of temperatures at which 50% of soot is converted between the bare soot
and the catalyst-soot.
CHAPTER 1: INTRODUCTION
51
These authors also concluded about the positive effect of gold nanoparticles, in
the soot combustion temperature and CO2 selectivity (Table 5). The higher
catalytic activity observed was attributed to metal-support interaction. This
synergetic effect leads to the transference of lattice oxygen in the support and
increases the quantity of oxygen vacancies and active oxygen species. Also, the
direct activation of molecular oxygen on the gold nanoparticles surface was
responsible for the higher activity observed[167]. Small Au clusters are able to
dissociate molecular O2, adsorb it on their surface and release it to reaction
increasing, thus the combustion rate of carbon. Moreover, the positive effect of
doping Au/(3DOM CeO2) with Zr was not noticed. An increase of T50 was
obtained with the increase of the content of Zr (Table 5). This decrease of
activity was explained by the lower thermal stability of the supported Au
nanoparticles in Au/(3DOM CexZr1-xO2) catalysts[132].
In the same way, Wei et al. obtained a very good result using Au NPs supported
on 3DOM LaFeO3 for soot oxidation under loose contact conditions
(atmosphere: 5 v/v% O2 and 0.2 v/v% NO balanced with Ar)[167]. Using Au NPs
with a mean diameter of approximately 3 nm, these authors observed a similar
activity for the different gold content catalysts once that the contact area
between soot and the catalyst is not affected by this variable. Nonetheless, it
has been noticed that the Au particle size affects the catalytic activity since
smaller gold nanoparticles will adsorb and activate the molecular O2 on Au
surface more effectively (Table 6). Additionally, the effect on the catalytic
activity of the reaction atmosphere (existence or absence of NO) was also
investigated by these authors. They concluded that for 3 nm Au catalysts due to
the formation of active oxygen species on the Au surface, the catalytic activity is
maintained even in the absence of NO. Then, using the same catalyst calcined at
550 ºC, the Au mean particle size increased to 8.2 nm and its catalytic activity
decreased significantly in air (initial temperature of combustion of the carbon
material, Ti = 287 ºC vs 231 ºC), due to the existence of less small Au able to
dissociate O2 from the gas phase. Indeed, it has been shown that the intensity of
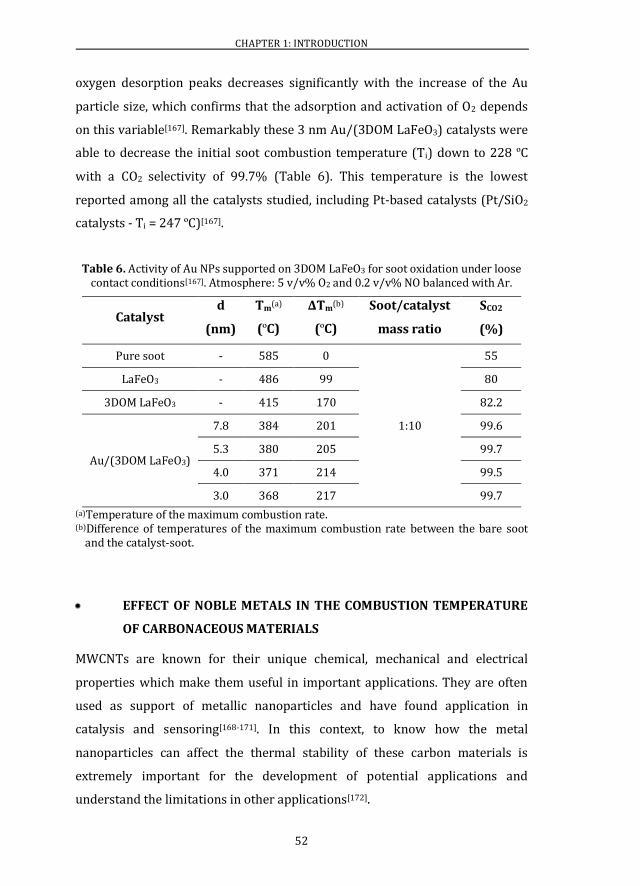
CHAPTER 1: INTRODUCTION
52
oxygen desorption peaks decreases significantly with the increase of the Au
particle size, which confirms that the adsorption and activation of O2 depends
on this variable[167]. Remarkably these 3 nm Au/(3DOM LaFeO3) catalysts were
able to decrease the initial soot combustion temperature (Ti) down to 228 ºC
with a CO2 selectivity of 99.7% (Table 6). This temperature is the lowest
reported among all the catalysts studied, including Pt-based catalysts (Pt/SiO2
catalysts - Ti = 247 ºC)[167].
Table 6. Activity of Au NPs supported on 3DOM LaFeO3 for soot oxidation under loose contact conditions[167]. Atmosphere: 5 v/v% O2 and 0.2 v/v% NO balanced with Ar.
Catalyst d
(nm)
Tm(a)
(ºC)
ΔTm(b)
(ºC)
Soot/catalyst
mass ratio
SCO2
(%)
Pure soot - 585 0
1:10
55
LaFeO3 - 486 99 80
3DOM LaFeO3 - 415 170 82.2
Au/(3DOM LaFeO3)
7.8 384 201 99.6
5.3 380 205 99.7
4.0 371 214 99.5
3.0 368 217 99.7
(a)Temperature of the maximum combustion rate. (b)Difference of temperatures of the maximum combustion rate between the bare soot
and the catalyst-soot.
EFFECT OF NOBLE METALS IN THE COMBUSTION TEMPERATURE
OF CARBONACEOUS MATERIALS
MWCNTs are known for their unique chemical, mechanical and electrical
properties which make them useful in important applications. They are often
used as support of metallic nanoparticles and have found application in
catalysis and sensoring[168-171]. In this context, to know how the metal
nanoparticles can affect the thermal stability of these carbon materials is
extremely important for the development of potential applications and
understand the limitations in other applications[172].

CHAPTER 1: INTRODUCTION
53
Studies about how the decoration of carbon materials with metal nanoparticles
affect their thermal stability have not been much reported. Nevertheless, some
studies have shown that indeed the presence of metal nanoparticles in the
carbon composition affects significantly the thermal stability of CNTs or other
forms of carbon[173-175]. Mckee et al. synthesised MWCNTs using different
catalyst precursors and observed a significant reduced thermal stability for
those contaminated with iron oxide and cobalt oxide[173]. Other authors
observed the same result, i.e. metallic particles used in the CNTs synthesis led
to a decrease of the CNTs combustion temperature[176, 177]. Moreover, the
oxidation temperature of SWCNTs decreases with the enhancement of metal
impurities of the sample[178, 179]. Finally, it has been observed that SWCNTs can
be purified (elimination of carbonaceous impurities and amorphous carbon)
using gold nanoparticles deposited on soot followed by a controlled oxidation
with O2[180]. The purification of SWCNTs has also been noticed using alkali metal
salts (NaCl, KCl, CsCl)[181]. Basically, it has been concluded that the thermal
stability of CNTs depends on the metal nanoparticles properties, namely the
nature of the metal, the size, the crystallinity and the interaction with the CNTs
surface[172].
In what concerns the combustion temperature of carbon materials by the
impregnation of metal nanoclusters Qadeer et al. when impregnating nickel and
cobalt on charcoal observed a decrease of the initial decomposition
temperature (ΔTi ∽ 130 ºC) indicating a modification of the chemical properties
of the activated charcoal[174]. This decrease of combustion temperature has
been attributed to the migration of mobile oxygen atoms formed on the metal
surface to the metal-carbon interface leading then to gasification of the carbon
in the vicinity of the metal particles[174]. Furthermore, in 2013, Leino et al.
decorated MWCNTs with Pt, Pd, Ni and CO clusters (d < 2 nm)[182]. They used
metal, metal oxide and metal acetylacetonate clusters on the surface of
MWCNTs and observed that these metals led to a faster combustion of the
MWCNTs at temperatures below 527 ºC (temperature usually associated to the
oxidation of pure nanotubes). This study was carried out under oxidative and

CHAPTER 1: INTRODUCTION
54
reductive atmospheres (here only oxidative is discussed once that the
measurements in this thesis were carried out in O2). The authors performed
measurements by TGA in air (Table 7). In this case, the activity is presented in
terms of Ts which corresponds to the temperature of the inflection point of the
corresponding TG curves. These authors observed that oxides showed in
general a lower temperature than the metal acetylacetonate (Table 7). The
decrease of combustion temperatures could be explained by the fact that the
oxygen in contact with carbon atoms from the oxide can react directly with the
support. Oxidation might also take place at the catalysts support boundary due
to the oxygen atoms that are adsorbed and diffuse on the surface. Since the
oxidation of carbon is exothermic, the heating close to the catalyst
nanoparticles will enhance the oxidation process. These results indicated that
by simply applying low cost Co and Ni metal oxide nanoparticles on surfaces
such as exhaust pipes, catalytic converters and sensors the low temperature
oxidation of carbon can be achieved, which is useful, for example, in the
decoking process[182].
Table 7. Thermal decomposition temperatures of Pt, Ni, Co and Pd decorated MWCNTs in air[182].
Catalyst Nomenclature d (nm) Ts
(a) (ºC)
ΔTs(b)
(ºC) Ti
(ºC) ΔTi (ºC)
Pre-treated MWCNTs MWC - 554 0 407 0
Pt(acac)2/MWCNT Pt(a)-MWC 1.3±0.3 559 0 n.a. -
NiOx/MWCNT NiO-MWC 1.9±0.8 541 13 n.a. -
Pd(acac)2/MWCNT Pd(a)-MWC 1.4±0.3 533 21 377 30
PtOx/MWCNT PtO-MWC 1.9±1.3 522 32 377 30
PdOx/MWCNT PdO-MWC 1.6±0.5 508 46 n.a. -
Ni(acac)2/MWCNT Ni(a)-MWC 1.3±0.3 465 89 327 80
CoOx/MWCNT CoO-MWC 1.4±0.4 381 173 n.a. -
Co(acac)3/MWCNT Co(a)-MWC 1.5±0.4 261 293 227 180
(a) Temperature of the inflection point of the TG curve. (b) Difference of temperatures of the inflection point of the TG curves between the bare
MWCNTs and the metal/MWCNTs catalyst.

CHAPTER 1: INTRODUCTION
55
Lorençon et al. also studied the effect of gold nanoparticles in the thermal
stability of three different carbon materials, namely MWCNTs, SWCNTs and
soot (Table 8)[172]. These forms of carbon were decorated with gold
nanoparticles with different sizes (2 nm – 25 nm) in order to understand how
carbon combustion temperature is affected by the Au particle size.
Measurements were made by TGA using synthetic air (25 ºC – 800 ºC). These
authors observed a decrease of the carbon oxidation temperature by O2 when
decorated with Au nanoparticles on their surface. They concluded that the
effect of Au in the carbon combustion temperature is directly dependent on the
particle size in the range of 3 nm – 25 nm. Indeed, the effect of the larger Au
nanoparticles (d ~ 25 nm) in the carbon oxidation was negligible, unlike the
smaller particles (Table 8). This is because this effect is attributed to the
spillover of oxygen existent on the Au cluster surface. Small Au particles
activate the molecular oxygen from the gas phase by dissociation and then this
oxygen is transferred to the carbon support which will oxidise it and produce
CO (Figure 20b).
Figure 20. Schematic representation gold clusters ( ) on a carbon surface (a) and of the O2 dissociation and oxygen spillover from a Au cluster surface to oxidise the carbon
support. Au atom: .
Nevertheless, in order to be able to dissociate molecular oxygen, the Au
particles must be small as it was experimentally demonstrated by our group[8].
Theoretical studies also indicate that the energy required for O2 dissociation on
gold surfaces is highly influenced by the particle diameter. There is a critical
size for Au nanoparticles to dissociate O2[8, 183-185]. Indeed, in our published
work, the ability of Au nanoparticles with 1.1 nm to dissociate 16O2 and 18O2
O2 (g)
O2 (ads) O (dissociated oxygen)
O
CO (carbon oxidation)
At. At. At. At.
At. At. At.
At. At.
(a) (b)
Au clusterAu atom: .At.
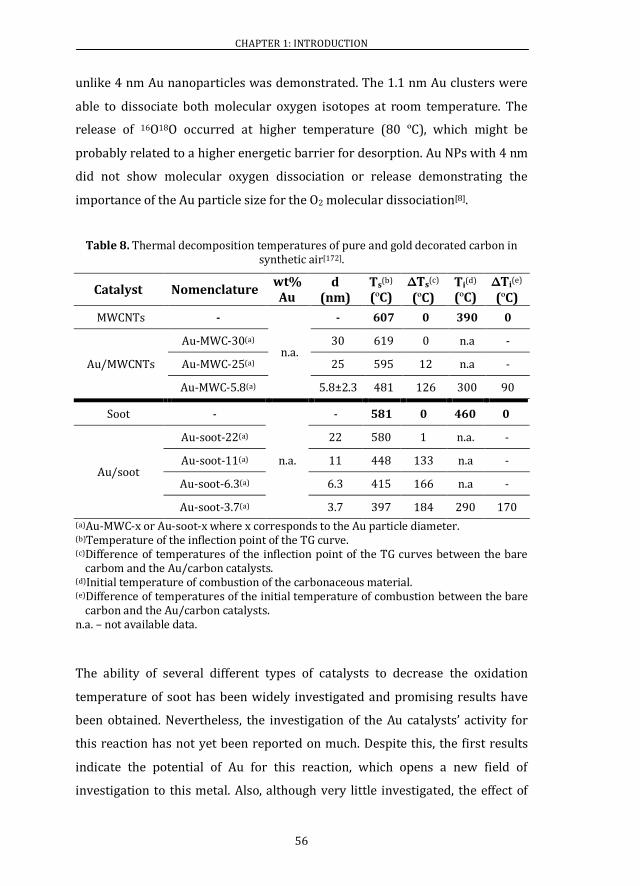
CHAPTER 1: INTRODUCTION
56
unlike 4 nm Au nanoparticles was demonstrated. The 1.1 nm Au clusters were
able to dissociate both molecular oxygen isotopes at room temperature. The
release of 16O18O occurred at higher temperature (80 ºC), which might be
probably related to a higher energetic barrier for desorption. Au NPs with 4 nm
did not show molecular oxygen dissociation or release demonstrating the
importance of the Au particle size for the O2 molecular dissociation[8].
Table 8. Thermal decomposition temperatures of pure and gold decorated carbon in synthetic air[172].
Catalyst Nomenclature wt% Au
d (nm)
Ts(b)
(ºC) ΔTs
(c) (ºC)
Ti(d)
(ºC) ΔTi
(e) (ºC)
MWCNTs -
n.a.
- 607 0 390 0
Au/MWCNTs
Au-MWC-30(a) 30 619 0 n.a -
Au-MWC-25(a) 25 595 12 n.a -
Au-MWC-5.8(a) 5.8±2.3 481 126 300 90
Soot -
n.a.
- 581 0 460 0
Au/soot
Au-soot-22(a) 22 580 1 n.a. -
Au-soot-11(a) 11 448 133 n.a -
Au-soot-6.3(a) 6.3 415 166 n.a -
Au-soot-3.7(a) 3.7 397 184 290 170
(a)Au-MWC-x or Au-soot-x where x corresponds to the Au particle diameter. (b)Temperature of the inflection point of the TG curve. (c)Difference of temperatures of the inflection point of the TG curves between the bare
carbom and the Au/carbon catalysts. (d)Initial temperature of combustion of the carbonaceous material. (e)Difference of temperatures of the initial temperature of combustion between the bare
carbon and the Au/carbon catalysts. n.a. – not available data.
The ability of several different types of catalysts to decrease the oxidation
temperature of soot has been widely investigated and promising results have
been obtained. Nevertheless, the investigation of the Au catalysts’ activity for
this reaction has not yet been reported on much. Despite this, the first results
indicate the potential of Au for this reaction, which opens a new field of
investigation to this metal. Also, although very little investigated, the effect of
CHAPTER 1: INTRODUCTION
57
metals, including Au, in the thermal stability of carbonaceous materials
(MWCNTs and soot), using metal decorated carbon catalysts, has been
observed leading to the opening of a field which requires a deeper
investigation.
1.8 OBJECTIVES
The goal of this Doctoral Thesis is the synthesis of stable gold clusters by wet
chemical routes, its characterisation and the study of their catalytic
performance. A synthetic route that prevents the agglomeration and
aggregation of the subnanometric gold particles is essential to allow the
industrial scale-up of active Au catalysts.
The aim is to prepare uniform Au catalysts with a mean particle diameter lower
than 2 nm supported on amine surfaces. Synthesis methods that are versatile
enough to be reproduced using several supports with different characteristics
such as MWCNTs, CeO2 and TiO2 are desired. Simple, clean, not expensive and
easily scaled-up synthetic protocols are intended to be developed to achieve
this goal.
In order to understand how the Au particle size can be affected by different
variables, different techniques such as HRTEM, aberration-corrected HRTEM,
Scanning Electron Microscopy (SEM) and Atomic Force Microscopy (AFM) will
be used to characterise the synthesised Au particles and surface area
measurements will be carried out to obtain the supports’ surface area. It is also
intended to investigate the chemical nature of gold by X-Ray Photoelectron
Spectroscopy (XPS) and X-ray Absorption spectroscopy (XAS).
Once the synthesis of new reproducible synthetic protocols is achieved, the goal
is to test these new catalysts’ activity in reactions such as the CO oxidation and
compare their activity with the co-precipitation and deposition-precipitation
methods commonly used to synthesise active Au/CeO2 catalysts for this
reaction. It is also a goal to investigate the catalysts activity for the oxidation of
CHAPTER 1: INTRODUCTION
58
carbonaceous materials and compare their activity with gold and other metal
catalysts commonly used for this reaction.

CHAPTER 1: INTRODUCTION
59
1.9 REFERENCES
[1] M. Haruta, T. Koybayasi, H. Sano, M. Yamada, Chemistry Letters 1987,
16, 405-408.
[2] R. Meyer, C. Lemire, Sh. K. Shaikhutdinov, H.-J. Freund, Gold Bulletin
2004, 37/1-2, 72-124.
[3] D. T. Thompson, Nanotoday 2007, 2/4, 40-43.
[4] http://apps.webofknowledge.com, consulted 21/02/2014.
[5] M. Haruta, The Chemical Record 2003, Vol. 3, 75-87.
[6] C. W. Corti, R. J. Holliday, D. T. Thompson, Applied Catalysis A 2005,
General 291, 253-261.
[7] T. G. Schaaff, M. N. Shafigullin, J. T. Khoury, I. Vezmar, R. L. Whetten, W.
G. Cullen, P. N. First, Journal of Physical Chemistry B 1997, 101, 7885-
7891.
[8] L. Alves, B. Ballesteros, M. Boronat, J. R. Cabrero-Antonino, P.
Concepción, A. Corma, M. A. Correa-Duarte, E. Mendoza Journal of the
American Chemical Sociesty 2011, 133 (26), 10251-10261.
[9] G. C. Bond, D. T. Thompson, Catalysis Reviews-Science and Engineering
1999, 41, 319-388.
[10] G. C. Bond, Surface Science 1985, 156, 966-981.
[11] R. Van Hardeveld, F. Hartog, Surface Science 1969, 15, 189-230.
[12] E. Roduner, Chemical Society Reviews 2006, 35, 583-592.
[13] J. Li, X. Li, H.-J. Zhai, L.-S. Wang, Science 2003, 299, 864-867.
[14] D. B. Fernández, PhD Thesis, Caracterización y propiedades catalíticas
de clústeres cuánticos subnanométricos, Universidad de Santiago de
Compostela, Departamento de Quimica Fisica 2011.
[15] W. Vogel, J. Bradley, O. Vollmer, I. Abraham, Journal of Physical
Chemistry B 1998, 102, 10853-10859.
[16] W. Vogel, D.A.H. Cunningham, K. Tanaka, M. Haruta, Catalysis Letters
1996, 40, 175-181.
[17] M. B. Cortie, E. van der Lingen, Materials Forum 2002, 26, 1-14.
CHAPTER 1: INTRODUCTION
60
[18] T. X. Li, S. Y. Yin, Y. L. Ji, B. L. Wang, G. H. Wang, J. J. Zhao, Physics Letters
A 2000, 267, 403-407.
[19] J. M. Soler, I. L. Garzón, J. D. Joannopoulis, Solid State Communications
2001, 117, 621-625.
[20] I. L. Garzón, K. Michaelian, M. R. Beltrán, A. Posada-Amarillas, P.
Ordejón, E. Artacho, D. Sanchéz-Portal, J. M. Soler, Physical Review
Letters 1998, 81 (8), 1600-1603.
[21] H. B. Liu, J. A. Ascencio, M. Perez-Alvarez, M. J. Yacaman, Surface Science
2001, 491, 88-98.
[22] B. Hvolbæk, T. V. W. Janssens, B. S. Clausen, H. Falsig, C. H. Christensen,
J. K. Nørskov, Nanotoday 2007, 2 (4), 14-18.
[23] T. V. W. Janssens, A. Carlsson, A, Puig-Molina, B. S. Clausen, Journal of
Catalysis 2006, 240, 108-113.
[24] G. C. Bond, C. Louis, D. T. Thompson, Catalysis by Gold – Catalytic
Science Series – Vol. 6, Imperial College Press.
[25] J. Llorca, M. Domínguez, C. Ledesma, R. J. Chimentão, F. Medina, J.
Sueira, I. Angurell, M. Seco, O. Rossell, Journal of Catalysis 2008, 258,
187-198.
[26] G. Tobias, E. Mendoza, B. Ballesteros, Encyclopedia of Nanotechnology,
SpringerLink 2012, 911-919.
[27] R. Zanella, S. Giorgio, C. R. Henry, C. Louis, Journal of Physical Chemistry
B 2002, 106, 7634-7642.
[28] R. Zhang, M. hummelgard, H. Olin, Materials Science and Engineering B
2009, 158, 48-52.
[29] X.-Y. Wang, S.-P. Wang, S.-R. Wang, Y.-Q. Zhao, J. Huang, S.-M. Zhang, W.-
P. Huang, S.-H. Wu, Catalysis Letters 2006, 112, 115-119.
[30] J. D. S Newman, G. J. Blanchard, Langmuir 2006, 22, 5882-5887.
[31] F. B. Lollmahomed, R. Narain, Langmuir 2011, 27, 12642-12649.
[32] M. Ahmed, Z. Deng, S. liu, R. Lafrenie, A. Kumar, R. Narain, Bioconjugate
Chemistry 2009, 20, 2169-2176.
CHAPTER 1: INTRODUCTION
61
[33] L. Lechuga Gómez, E. Mendoza Gómez, M. A. Correa Duarte, M. Sanles
Sobrido, Patent WO2010031890 A1, available on-line
http://patentscope.wipo.int/search/en/WO2010031890.
[34] R. Di Felice, A. Selloni, Journal of Chemical Physics 2004, 120, 4906-
4914.
[35] S. D. Lin, M. Bollinger and M. A. Vannice, Catalysis Letters 1993, 17,
245-262.
[36] P. A. Sermon, G. C. Bond and P. B. Wells, Journal of the Chemical Society,
Faraday Transactions I 1979, 75, 385-394.
[37] N. W. Cant and W. K. Hall, Journal of Physical Chemistry 1971, 75, 2914-
2921.
[38] C. Corti, R. Holliday, Gold Science and Applications, CRC Press 2010.
[39] L. Prati, A. Villa, Catalysts 2012, 2, 24-37.
[40] S. J. Lee, A. Gavriilidis, Journal of Catalysis 2002, 206, 305-313.
[41] Q. Xu, K. C. C.Kharas, A. K. Datye, Catalysis Letters 2003, 229-235.
[42] M. Haruta, Journal of New Materials for Electrochemical Systems 2004,
7, 163-172.
[43] X.-Y. Wang, S.-P. Wang, S.-R. Wang, Y.-Q. Zhao, J. Huang, S.-M. Zhang, W.-
P. Huang, S.-H. Wu, Catalysis Letters 2006, 112, 115-119.
[44] M. Haruta, H. Kageyama, N. Kamijo, T. Kobayashi and F. Delannay,
Studies in Surface Science and Catalysis 1989, 44, 33-42.
[45] M. Haruta, Catalysis Today 1997, 36, 153-156.
[46] R.-R. Zhang, L.-H. Ren, A.-H. Lu, W.-C. Li, Catalysis Communications
2011, 13, 18-21.
[47] A. Sandoval, C. Louis, R. Zanella, Applied Catalysis B: Environmental
2013, 140-141, 363-377.
[48] R. Zanella, S. Giorgio, C.R. Henry, C. Louis, Journal of Physical Chemistry
B 2002, 106, 7634-7642.
[49] J. Turkevich, Gold Bulletin 1985, 18, 86-91.
[50] J. Turkevich, J. Hillier and P.C. Stevenson, Discussions of the Faraday
Society 1951, 11, 55-75.
CHAPTER 1: INTRODUCTION
62
[51] J. Turkevich, G. Garton and P.C. Stevenson, Journal of Colloid Science,
Supplement 1 1954, 26-35.
[52] D. T. Thompson, Nanotoday 2007, 2/4, 40-43.
[53] C. Li, D. Li, G. Wan, J. Xu, W. Hou, Nanoscale Research Letters 2011, 6,
440.
[54] Y. Nagata, Y. Watanabe, S. Fujita, T. Dohmaru, S. Taniguchi, Chemical
Communications 1992, 1620-1622.
[55] S. A. Yeung, R. Hobson, S. Biggs, F. Grieser, Chemical Communications
1993, 378-379.
[56] K. Okitsu, H. Bandow, Y. Maeda, Y. Nagata, Chemistry of Materials 1996,
8, 315-317.
[57] K. S. Suslick, Scientific American, 1989, 260, 80-86.
[58] C. E. Brenner, Cavitation and Bubble Dynamics, Oxford university Press,
Oxford, 1995, available on-line:
http://authors.library.caltech.edu/25017/1/cavbubdynam.pdf.
[59] H. Xu, B. W. Zeiger, K. S. Suslick, Chemical Society Reviews 2013, 42,
2555-2567.
[60] K. Okitsu, M. Ashokkumar, F. Grieser, Journal of Physical Chemistry B
2005, 109, 20673-20675.
[61] W. Chen, W. Cai, L. Zhang, G. Wang, L. Zhang, Journal of Colloid and
Interface Science 2001, 238, 291-295.
[62] K. Leonard, M. Kawashima, H. Okamura, J. Kurawaki, Materials Letters
2010, 64, 2240-2243.
[63] K. Okitsu, Y. Mizukoshi, T. A. Yamamoto, Y. Maeda, Y. Nagata, Materials
Letters 2007, 61, 3429-3431.
[64] M.-Y. Wei, L. Famouri, L. Carroll, Y. Lee, P. Famouri, Ultrasonics
Sonochemistry 2013, 20, 610-617.
[65] X.-F. Qiu, J.-J. Zhu, H.-Y. Chen, Journal of Crystal Growth 2003, 257, 378-
383.
[66] J. K.-J. Li, C.-J. Ke, C.-A. J. Lin, Z.-H. Cai, C.-Y. Chen, W. H. Chang, Journal of
Medical and Biological Engineering 2012, 33, 23-28.

CHAPTER 1: INTRODUCTION
63
[67] H. Xu, K. S. Suslick, American Chemical Society Nano 2010, 4, 3209-
3214.
[68] J. Zheng, C. Zhang, R. M. Dickson, Physical Review Letters 2004, 93,
077402-077408.
[69] Y. Bao, C. Zhong. D. M. Vu, J. P. Temirov, R. B. Dyer, J. S. Martinez, Journal
of Physical Chemistry C 2007, 111, 12194-12198.
[70] N. Schaeffer, B. Tan, C. Dickinson, M. J. Rosseinsky, A. Laromaine, D. W.
McComb, M. M. Steven, Y. Wang, l. Petit, C. Barentin, D. G. Spiller, A. I.
Cooper, R. Levy, Chemical Communications 2008, 3986-3988.
[71] H. Liu, X. Zhang, X. Wu, L. Jiang, C. Burda, J.-J. Zhu, Chemical
Communications 2011, 47, 4237-4239.
[72] K. Takahiro, S. Oizumi, A. Terai, K. Kawatsura, B. Tsuchiya, S. Nagata, S.
Yamamoto, H. Naramoto, K. Narumi, M. Sasase, Journal of Applied
Physics 2006, 100, 84325-84325-6.
[73] E. Gross, M. Asscher, Journal of Physical Chemistry C 2007, 111, 16197-
16201.
[74] B. Qiao, A. Wang, X. Yang, L. F. Allard, Z. Jiang, Y. Cui, J. Liu, J. Li, T.
Zhang, Nature Chemistry 2011, 3, 634-641.
[75] S. Sun, G. Zhang, N. Gauquelin, N. Chen, J. Zhou, S. Yang, W. Chen, X.
Meng, D. Geng, M. N. Banis, R. Li, S. Ye, S. Knights, G. A. Botton, T.-K.
Sham, X. Sun, Scientific Reports 2013, 3, article number: 1775.
[76] C. I. Contescu, K. van Benthem, S. Li, C. S. Bonifacio, S. J. Pennycook, P.
Jena, N. C. Gallego, Carbon 49 2011, 4050-4058.
[77] G. Kyriakou, M. B. Boucher, A. D. Jewell, E. D. Lewis, T. J. Lawton, A. E.
Baber, H. L. Tierney, M. Flytzani-Stephanopoulos, E. C. H. Sykes, Science
2012, 335, 1209-1212.
[78] J. Oivier-Meseguer, J. R. Cabrero-Antonino, I. Domíngues, A.
Leyva-Pérez, A. Corma, Science 2012, 338, 1452-1455.
[79] S. Lee, C. Fan, T. Wu, S. L. Anderson, Journal of Chemical Physics 2005,
123, 124710-124722.
[80] S. Lee, C. Fan, T. Wu, S. L. Anderson, Surface Science 2005, 578, 5-19.
CHAPTER 1: INTRODUCTION
64
[81] C. Harding, V. Habibpour, S. Kunz, A. N. Fambacher, U. Heiz, B. Yoon, U.
Landman, Journal of the American Chemical Society 2009, 131, 538-
548.
[82] S. Lee, C. Fan, T. Wu, S. L. Anderson, Journal of Chemical Physics 2005,
123, 124710.
[83] S. Lee, C. Fan, T. Wu, S. L. Anderson, Surface Science 2005, 578, 5-19.
[84] A. A. Herzing, C. J. Kiely, A. F. Carley, P. Landon, G. J. Hutchings, Science
321 2008, 1331-1334.
[85] A. Uzun, V. Ortalan, Y. Hao, N. D. Browning, B. C. Gates, Journal of
Physical Chemistry C 2009, 113, 16847-16849.
[86] J. Lu, C. Aydin, N. D. Browning, B. C. Gates, Angewandte Chemie
International Edition 2012, 51, 5842-5846.
[87] N. J .Lawrence, PhD thesis, Synthesis and Catalytic Activity of
Nanostructured Cerium Oxide, University of Nebraska – Lincoln,
Department of Chemistry 2010.
[88] N. Kruse, A. Frennet, J.-M. Bastin, Catalysis and Automotive Pollution IV,
Elsevier 1998.
[89] K. Jiang, Fabrication and Catalytic Property of Cerium Oxide
Nanomaterials, PhD thesis, University of Nebraska-Lincoln – Chemistry
Department 2001.
[90] M. Murdoch, G. I. N. Waterhouse, M. A. Nadeem, J. B. Metson, M. A.
Keane, R. F. Howe, J. Llorca, H. Idriss, Nature Chemistry 2011, 3, 489-
492.
[91] D. Widmann, Y. Liu, F. Schuth, R. J. Behm, Journal of Catalysis 2010, 276,
292-305.
[92] Y. Denkwitz, B. Schumacher, G. Kucerová, R. J. Behm. Journal of Catalysis
2009, 267, 78-88.
[93] W.-Y. Yu, C.-P. Yang, J.-N. Lin, C.-N. Kuo, B.-Z. Wan, Chemical
Communications 2005, 354-356.
[94] S. Tsubota, M. Haruta, T. Kobayashi, A. Ueda, Y. Nakahara, Studies in
Surface Science and Catalysis 1991, 72, 695-704.
CHAPTER 1: INTRODUCTION
65
[95] S. Tsubota, D. A. H. Cunningham, Y. Bando, M. Haruta, Studies in Surface
Science and Catalysis 1995, 91, 227-235.
[96] S. Iijima, Nature 1991, 354, 56-58.
[97] M. Meyyappan, Carbon Nanotubes – Science and Applications, CRC
Press.
[98] P. Serp, E. Castillejos, ChemCatChem 2010, 2, 41-47.
[99] H. C, Choi, M. Shim, S. Bangsaruntip, H. Dai, Journal of the American
Chemical Society 2002, 124, 9058-9059.
[100] V. Tzitios, V. Georgakilas, E. Oikonomou, M. Karakassides, D. Petridis,
Carbon 2006, 44, 848-853.
[101] R. Zanella, E. V. Basiuk, P. Santiago, V. A. Basiuk, E. Mireles, L. Puente-
Lee, J. M. Saniger, Journal of Physical Chemistry B 2005, 109, 16290-
16295.
[102] X. Hu, T. Wang, X. Qu, S. Dong, Journal of Physical Chemistry B 2006,
110, 853-857.
[103] H. Ismaili, F. Lagugné-Labarthet, M. S. Workentin, Chemistry of
Materials 2011, 23, 1519-1525.
[104] http://www.dieselnet.com/tech/cat_substrate.php, consulted
24/02/2014.
[105] T. Boger, A. K. Heibel, C. M. Sorensen, Industrial & Engineering
Chemistry Research 2004, 43, 4602-4611.
[106] M. Haruta, N. Yamada, T. Kobayashi, S. Iijima, Journal of Catalysis 1989,
115, 301-309.
[107] H.-F. Li, N. Zhang, P. Chen, M.-F. Luo, J.-Q. Lu, Applied Catalysis B:
Environmental 2011, 110, 279-285.
[108] Z.-P. Liu, P. Hu, A. Alavi, Journal of the American Chemical Society 2002,
124, 14770-14779.
[109] Z.-P. Liu, X.-Q. Gong, J. Kohanoff, C. Sanchez and P. Hu, Physical Review
Letters 2003, 91, 266102-266105.
[110] L.M. Molina, B. Hammer, Applied Catalysis A: Gen. 2005, 291, 21-31.

CHAPTER 1: INTRODUCTION
66
[111] L.M. Molina, M.D. Rasmussen, B. Hammer, Journal of Chemical Physics
2004, 120, 7673-7680.
[112] D. Astruc, Nanoparticles and Catalysis – Vol. 1, Wiley-VCH 2007.
[113] S. D. Gardner, G. B. Hoflund, D. R. Schrywer, J. Shryer, B. Upchurch, E. J.
Kielin, Langmuir 1991, 7, 2135.
[114] Tana, F. Wang, H. Li, W. Shen, Catalysis Today 2011, 175, 541-545.
[115] S. Carrettin, P. Concepción, A. Corma, J. M. López Nieto, V. F. Puntes,
Angewandte Chemie International Edition 2004, 43, 2538-2540.
[116] M. Han, X. Wang, Y. Shen, C. Tang, G. Li, R. L. Smith, Jr., Journal of
Physical Chemistry C 2010, 114, 793-798.
[117] R.-R. Zhang, L.-H. Ren, A.-H. Lu, W.-C. Li, Catalysis Communications
2011, 13, 18-21.
[118] J. Guzman, S. Carretin, A. Corma, Journal of the American Chemical
Society 2005, 127, 3286.
[119] A. M. Venezia, G. Pantaleo, A. Longo, G. D. Carlo, M. P. Casaletto, F. L.
Liotta, G. Deganello, Journal of Physical Chemistry B 2005, 109, 2821-
2827.
[120] U. R. Pillai, S. Deevi, Applied Catalysis A 2006, 299, 266-273.
[121] K. Qian, S. Lv, X. Xiao, H. Sun, J. Lu, M. Luo, W. Huang, Journal of
Molecular Catalysis A 2009, 306, 40-47.
[122] S. Y. Lai, Y. F. Qiu, S. J. Wang, Journal of Catalysis 2006, 237, 303-313.
[123] M. Comotti, W.-C. Li, B. Spliethoff, F. Schuth, Journal of the American
Chemical Society 2006, 128, 917-924.
[124] J. Liu, Z. Zhao, C. Xu, A. Duan, L. Zhu, X. Wang, Catalysis Today 2006,
118, 315-322.
[125] R. L. V. Wal, A. Yezerets, N. W. Currier, D. H. Kim, C. M. Wang, Carbon
2007, 45, 70-77.
[126] M. L. Ruiz, I. D. Lick, M. I. Ponzi, E. Rodriguez-Castellon, A. Jimenez-
Lopez, E. N. Ponzi, Applied Catalysis A 2011, General 392, 45-46.
[127] J. V. Craenenbroeck, D. Andreeva, T. Tabakova, K. VanWerde. J. Mullens,
F. Verpoort, Journal of Catalysis 2002, 209, 515-527.
CHAPTER 1: INTRODUCTION
67
[128] A. Frennet, J.-M. Bastin, Catalysis and Automotive Pollution Control III,
Elsevier 1995.
[129] K. Yamazaki, T. Kayama, F. Dong, H. Shinjoh, Journal of Catalysis 2011,
282, 289-298.
[130] S. Lorentzou, E. Papaioannou, M. Kostoglou, A. G. Konstandopoulos, K.
Ohno, K. Ogyu, T. Oya, Third European Combustion Meeting ECM 2007.
[131] E. Aneggi, C. de Leitenburg, J. Llorca, A. Trovarelli, Catalysis Today
2012, 197, 119-126.
[132] Y. Wei, J. liu, Z. Zhao, A. Duan, G. Jiang, Journal of Catalysis 2012, 287,
13-29.
[133] E. Aneggi, J. Llorca, C. de Leitenburg, G. Dolcetti, A. Trovarelli, Applied
Catalysis B 2009, 489-498.
[134] P. Richards, Fuel Borne Catalysts for DPF Regeneration, available on-
line:
ftp://ftp.aqmd.gov/pub/kdurkee/UltraFineCourse/November%2012
%202008/Session%204%20Regeneration%20of%20Filters/3%20P%
20Richards_Fuel%20Borne%20Catalysts.pdf.
[135] P. Ciambelli, V. Palma, P. Russo, S. Vaccaro, Journal of Molecular
Catalysis A: Chemical 2003, 204, 673-681.
[136] G. Saracco, C. Badini, N. Russo, V. Specchia, Applied Catalysis B:
Environmental 1999, 21, 233-242.
[137] Y. Ma, M. Zhu, D. Zhang, Applied Energy 2014, 113, 751-757.
[138] http://www.infineum.com/Pages/FuelBorneCatalysts.aspx, consulted
18/02/2014.
[139] D. Fino, P. Fino, G. Saracco, V. Specchia, Korean Journal of Chemical
Engineering 2003, 20, 445-450.
[140] D. Fino, N. Russo, G. Saracco, V. Specchia, Journal of Catalysis 2003, 217,
367-375.
[141] F. E. López-Suárez, A. Bueno-López, M. J. Illán-Gómez, A. Adamski, B.
Ura, J. Trawczynski, Environmental Science & Technology 2008, 42,
7670-7675.

CHAPTER 1: INTRODUCTION
68
[142] H. X. Dai, C. F. Ng, C. T. Au, Journal of Catalysis 2000, 189, 52-62.
[143] M. L. Pisarello, V. Milt, M. A. Peralta, C. A. Querini, E. E. Miró, Catalysis
Today 2002, 75, 465-470.
[144] V. G. Milt, C. A. Querini, E. E. Miró, M. A. Ulla, Journal of Catalysis 2003,
220, 424-432.
[145] E. E. Miró, F. Ravelli, M. A. Ulla, L. M. Cornaglia, C. A. Querini, Catalysis
Today 1999, 53, 631-638.
[146] H. An, C. Kilroy, P. J. McGinn, Catalysis Today 2004, 98, 423-429.
[147] G. Neri, G. Rizzo, S. Galvagno, M. G. Musolino, A. Donato, R. Pietropaolo,
Thermochimica Acta 2002, 381, 165-172.
[148] C. A. Querini, M. A. Ulla, F. Requejob, J. Soria, U. A. Sedrán, E. E. Miró,
Applied Catalysis B: Environmental 1998, 15, 5-19.
[149] R. Jiménez, X. García, C. Cellier, P. Ruiz, A. L. Gordón, Applied Catalysis A:
General 2006, 297, 125-134.
[150] J. Van Doorn, J. Varloud, P. Meriaudeau, V. Perrichon, M. Chevrier, C.
Gauthier, Applied Catalysis B 1992, 1, 117-127.
[151] E. Aneggi, C. De Leitenburg, G. Dolcetii, A. Trovarelli, Catalysis Today
2006, 114, 40-47.
[152] E. Aneggi, C. De Leitenburg, G. Dolcetii, A. Trovarelli, Catalysis Today
2008, 136, 3-10.
[153] X. Wu, D. Liu, K. Li, J. Li, D. Weng, Catalysis Communications 2007, 8,
1274-1278.
[154] H. Muroyama, S. Hano, T. Matsui, K. Eguchi, Catalysis Today 2010, 153,
133-135.
[155] I. Atribak, A. Bueno-López, A. García-García, Journal of Molecular
Catalysis A: Chemical 2009, 300, 103-110.
[156] K. Krishna, A. Bueno-López, M. Makkee, J. A. Moulijn, Applied Catalysis
B: Environmental, 2007, 75, 189-200.
[157] Y. Zhang, L. Zhang, J. Deng, H. Dai, H. He, Inorganic Chemistry 2009, 48,
2181-2192.
CHAPTER 1: INTRODUCTION
69
[158] E. E. Miró, F. Ravelli, M. A. Ulla, L. M. Cornaglia, C. A. Querini, Catalysis
Today 1999, 53, 631-638.
[159] P. G. Harrison, I. K. Ball, W. Daniell, P. Lukinskas, M. Céspedes, E. E.
Miró, M. A. Ulla, Chemical Engineering Journal 2003, 95, 47-55.
[160] H. Laversin, D. Courcot, E. A. Zhilinskaya, R. Cousin, A. Aboukais, Journal
of Catalysis 2006, 241, 456-464.
[161] K. Yamazaki, T. Kayama, F. Dong, H. Shinjoh, Journal of Catalysis 2011,
282, 289-298.
[162] M. L. Ruiz, I. D. Lick, M. I. Ponzi, E. Rodriguez-Castellón, A. Jiménez-
Lopez, E. N. Ponzi, Applied Catalysis A: General 2011, 392, 45-56.
[163] M. L. Ruiz I. D. Lick, M. S. L. Aparicio, M. I. Ponzi, E. Rodriguez-Castellón,
E. N. Ponzi, Industrial & Engineering Chemistry Research 2012, 51,
1150-1157.
[164] J. V. Craenenbroeck, D. Andreeva, T. Tabakova, K. V. Werde, J. Mullens,
F. Verpoort, Journal of Catalysis 2002, 209, 515-527.
[165] M. Sadakane, T. Horiuchi, N. Kato, C. Takahashi, W. Ueda, Chemistry of
Materials 2007, 19, 5779-5785.
[166] G. Zhang, Z. Zhao, J. Liu, G. Jiang, A. Duan, J. Zheng, S. Chen, R. Zhou,
Chemical Communications 2010, 46, 457-459.
[167] Y. Wei, J. Liu, Z. Zhao, Y. Chen, C. Xu, A. Duan, G. Jiang, H. He,
Angewandte Chemie International Edition 2011, 50, 2326-2329.
[168] V. Georgakilas, D. Gournis, V. Tzitzios, L. Pasquato, D. M. Guldi, M. Prato,
Journal of Materials Chemistry 2007, 17, 2679-2694.
[169] P. Serp, M. Corrias, P. Kalck, Applied Catalysis A: General 2003, 253,
337-358.
[170] S. X. Yang, W. P. Zhu, X. Li, H. B. Wang, Y. R. Zhou, Catalysis
Communications 2007, 8, 2059-2063.
[171] G. G. Wildgoose, C. E. Banks, R. G. Compton, Small 2006, 2, 182-193.
[172] E. Lorençon, R. G. Lacerda, L. O. Ladeira, R. R. Resende, A. S. Ferlauto, U.
Schuchardt, R. M. Lago, Journal of Thermal Analysis and Calorimetry
2011, 105, 953-959.

CHAPTER 1: INTRODUCTION
70
[173] G. S. B. Mckee, K. S. Vecchio, Journal of Physical Chemistry B 2006, 110,
1179-1186.
[174] R. Qadeer, R. Hussain, Journal of Chemical Society of Pakistan 1998, 20,
8-11.
[175] A. W. Musumeci, G. G. Silva, W. N. Martens, E. R. Waclawik, R. L. Frost,
Journal of Thermal Analysis and Calorimetry 2007, 88, 885-891.
[176] B. J. Landi, C. D. Cress, C. M. Evan, R. P. Raffaelle, Chemistry of Materials
2005, 17, 6819-6834.
[177] S. Arepalli, P. nikolaev, O. Gorelik, V. G. Hadjiev, W. Holmes, B. Files, L.
Yowell, Carbon 2004, 42, 1783-1791.
[178] R. Brukh, O. Sae-Khow, S. Mitra, Chemical Physics Letters 2008, 459,
149-152.
[179] C. X. Wu, J. X. Xu, J. X. Li, G. F. Dong, L. H. Guan, Physica E 2009, 41,
1591-1595.
[180] E. Mizoguti, F. Nihey, M. Yudasaka, S. Iijima, T. Ichihashi, K. Nakamura,
Chemical Physics Letters 2000, 321, 297-301.
[181] Y. Kobayashi, M. Sano, ChemCatChem. 2010, 2, 397-401.
[182] A.-R. Leino, M. Mohl, J. Kikkola, P. Maki-Arvela, T. Kokkonen, A.
Schukarev, K. Kordas, Carbon 2013, 57, 99-107.
[183] A. Roldan, S. Gonzalez, J. M. Ricart, F. Illas, ChemPhysChem 2009, 10,
348-351.
[184] M. Boronat, A. Corma, Dalton Transactions 2010, 39, 8538-8546.
[185] A. Roldan, J. M. Ricart, F. Illas, Theoretical Chemistry Accounts 2009,
123, 119-126.

CHAPTER 2:
CHARACTERISATION
TECHNIQUES AND METHODS

CHAPTER 2: CHARACTERISATION TECHNIQUES AND METHODS
73
2.1 TRANSMISSION ELECTRON MICROSCOPY (TEM)
TEM is a technique that allows obtaining images of the sample at very small
scales (Å) using accelerated electrons. The basic principle of Transmission
Electron Microscopy consists in an electron source which emits electrons that
cross through a vacuum in the microscope column. For a typical operating
voltage of 200 kV the electrons wavelength is 2.51x10⁻³ nm. This much lower
wavelength than the wavelength of visible light (~ 400 nm) pushes the
resolution down to the order of angstrom (10-10 m).
The electron microscope can use three different electron sources, namely a
plain tungsten filament, a tungsten filament with a LaB6 crystal tip or a field
emission gun. Depending on the source used, different levels of brightness will
be obtained. While the tungsten filament gives the lowest brightness, the field
emission leads to the higher brightness. The filament is held in an uncharged
wehnelt cap (0 kV) and is heated in vaccum to excite electrons. The excited free
electrons will then be directed through the anode, that is located below the
wehnelt cap, due to the positive voltage (usually 200 kV).
Figure 21 shows a schematic representation of the column of a transmission
electron microscope. The electron beam passes through a series of lenses and
apertures as it moves down the column. The beam is focused onto the sample
by the first lens that it encounters (condenser lens). The sample contrast can be
varied by modifying the sizes of the condenser apertures which are located
under the lens. Then, after passing through the sample (specimen), the beam is
refocused by the objective lens which allows the diffraction plane to be viewed.
By changing the objective aperture, the sample contrast can be increased and
dark field imaging can be viewed. Finally, the beam passes through the
projector lens, which leads to the resulting image on the viewing screen[1]. The
image depends mainly on the density of the materials of the sample.

CHAPTER 2: CHARACTERISATION TECHNIQUES AND METHODS
74
Figure 21. Schematic outline of a Transmission Electron Microscope[1].
In order to have a high quality image resolution, it is essential that the electron
beam is well aligned. Nevertheless, since it is almost impossible to make a
100% perfectly curved lens, there are always defects (aberrations). In TEM
lens, aberrations play both a beneficial and detrimental role in the high
resolution imaging. On the one hand, they give place to undesired blurring in
any image plane, thus obscuring the finest object details. On the other hand,
they are required once that they produce the desired phase contrast of the very
thin objects. Among all aberrations of the electron microscope, the stronger is
the spherical aberration of the objective lens[2].
Scherzer in 1949 claimed that the resolution of an image is only dependent on
the electron wavelength and the constant of spherical aberration[3]. In this way,
resolution can only be improved by using a smaller wavelength at higher
acceleration voltages or by reducing the spherical aberration. Because the
spherical aberration coefficient of a round lens is always positive and on the
order of its focal length the reduction of this parameter can only be achieved
within certain limits. To overcome this limitation, over decades, instrumental

CHAPTER 2: CHARACTERISATION TECHNIQUES AND METHODS
75
improvements have been made. In 1990, Rose, invented the spherical
aberration correctors[4]. Then, since its implementation into commercial TEMs
in 1998 the coefficient of spherical aberration started to be used as an
additional parameter[5]. This can now be varied over a wide range and can even
be tuned to negative values giving place to new imaging modes, namely high
resolution amplitude contrast and extension of the point resolution to the
information limit and enhanced image intensity modulation for negative phase
contrast[2]. The electron microscopes equipped with these correctors then have
a resolution imaging on the atomic scale. These microscopes can operate
between 80 kV and 300 kV.
TEM analysis were performed using an High Resolution Transmission Electron
Microscope (HRTEM) at the Universitat Autònoma de Barcelona. A JEOL JEM-
2011 microscope equipped with LaB6 tungsten filament as the electron source
operating at an accelerating voltage of 200 kV was used. With this technique
the size distributions of Au clusters were obtained by measuring the diameter
of at least 40 metal clusters. To this end the programme Gatan Digital
Micrograph was used. The mean particle diameter was determined by
calculating the arithmetic mean of the particles diameter measured.
The aberration-corrected HRTEM analyses were carried out by Dr. Alvaro
Mayoral at the Advanced Microscopy Laboratory at the Instituto de Nanociencia
de Aragón. A TITAN3 microscope with an accelerating voltage of 80 kV was
used. This microscope was used to observe the existence of isolate Au atoms,
atomic clusters (Aun, n ~ 2-3), clusters or the three populations on the
supports’ surface.
Samples were prepared by depositing a drop of the catalyst suspension on a
Lacey Carbon 400 Mesh Cu grade which was left to dry.

CHAPTER 2: CHARACTERISATION TECHNIQUES AND METHODS
76
2.2 SCANNING ELECTRON MICROSCOPY (SEM)
The principle employed by the SEM is similar to that of the TEM. Figure 22
shows a schematic representation of the column of a scanning electron
microscope. An electron gun emits electrons through the column and the
electron beam is focused by a series of lenses. After passing through the final
lens, the electrons come in contact with the sample and secondary electrons,
backscaterred electrons and characteristic X-rays will be generated from the
sample surface and received by the different detectors[6]. Depending on the
type of emitted electrons that are desired to be detected, different types of
detectors are used.
Figure 22. Schematic outline of a Scanning Electron Microscope[7].

CHAPTER 2: CHARACTERISATION TECHNIQUES AND METHODS
77
Moreover, if the sample is non-conducting, there can be a charge effect. If the
amount of electrons that reaches the sample is higher than the amount of
electrons that leave the sample by diffusion to ground the sample becomes
negatively charged. This charge creates an electric field which can affect the
incidence beam consequently leading to distortions in the image. When the
sample is conducting, this charge effect will not be noticed at high voltage. In
order to avoid this effect at high voltage usually non-conducting samples are
coated with carbon or gold and thus a good conducting surface is obtained. This
effect can also be overcome by using low voltage, which has the advantage of
maintaining the original specimen surface.
SEM measures were carried out at the Centre de Recerca en Nanoenginyeria of
the Universitat Politècnica de Catalunya using a Zeiss Neon 40 microscope
equipped with a field emission gun.
SEM was used to analyse the catalysts with bigger Au nanoparticles (d > 10 nm)
and to observe the increase of the Au particle size of catalysts used in reactions.
Samples were prepared by dropping 10 μL of the catalyst suspension in a 3 mm
x 3 mm silicon wafer. This was then washed with mili-Q water and dried with
compressed air.
SEM images were obtained using an accelerating voltage of 2.0 kV (MWCNTs)
or 5.0 kV (CeO2) and the InLens secondary electron detector with a working
distance (WD) of about 4.0 mm and an aperture size of 10 μm.
2.3 ATOMIC FORCE MICROSCOPY (AFM)
Atomic force microscopy is a technique that allows the analysis and
characterisation of samples from the microscopic level (100 µm - 1 µm) to the
nanometer scale. It is also a very versatile technique since it allows the analysis
of insulators, semiconductors or electrical conductors. This technique is
complementary to the SEM and HRTEM characterisation. Indeed, despite not

CHAPTER 2: CHARACTERISATION TECHNIQUES AND METHODS
78
providing a real image of the sample, it is very useful to characterise its surface
since the electron beam, which could modify the surface, is not used.
The AFM works using a fine sharp tip that is placed at the end of a cantilever
(Figure 23). This technique is based in the measure of interaction forces
between the tip and the sample. Different forces between the tip and the
sample surface will deflect or bend the cantilever. The position of the cantilever
is usually measured using a laser beam that impacts the back of the cantilever
and is reflected to a position-sensitive photodetector (PSPD) (Figure 23). As the
cantilever deflects the position of the laser beam on the detector shifts. The
measured deflections are processed by imaging software and a map of the
sample surface topography is obtained. Topography images can be obtained
using different scanning modes, namely non-contact, contact mode or tapping
can be applied. The tapping mode, employed in this work, basically consists of
vibrating the cantilever tip. In this mode, the tip oscillates in a way it barely hits
the sample and the surface topography image is obtained by measuring the
differences of amplitude resulting from the tip to sample spacing[8].
Figure 23. Schematic representation of an AFM[8].
Laser diode
CHAPTER 2: CHARACTERISATION TECHNIQUES AND METHODS
79
AFM measures were carried out at the Centre de Recerca en Nanoenginyeria of
the Universitat Politècnica de Catalunya. This technique was used to investigate
the size of the ex-situ synthesised Au nanoclusters. Size distributions were
obtained by measuring at least 100 clusters using the WSxM 5.0 Develop 6.0
program. The mean particle diameter obtained corresponds to the arithmetic
mean of all the measured values.
A VEECO Dimension 3100 atomic force microscope and a Nanosensors PPP-
NCHR-50 silicon tip were used. Topography images were collected using the
tapping mode and a scan rate between 1.0 Hz and 2.0 Hz. Parameters, such as
amplitude and proportional and integral gains were adjusted during the image
formation.
The samples were simply prepared by depositing a drop of the ex-situ
synthesised Au clusters suspension in a square of approximately 1 cm x 1 cm of
freshly cleaved mica surface.
2.4 X-RAY PHOTOELECTRON SPECTROSCOPY (XPS)
XPS is a surface analysis technique that allows us to know the oxidation state of
surface species and their concentrations[9]. The XPS spectrum is obtained by
irradiating the sample surface with a beam of X-rays (Figure 24). The X-rays
penetrate the sample to a depth of about 2 nm - 5 nm. Consequently, some
photoelectrons are more easily released presenting kinetic energies
characteristic of their elements. The number of electrons that escape from the
surface and their kinetic energy are measured. Other electrons will have a
lower energy and contribute to the spectrum noise signal, because they come
from the inner layers and collide with electrons of the upper layers.
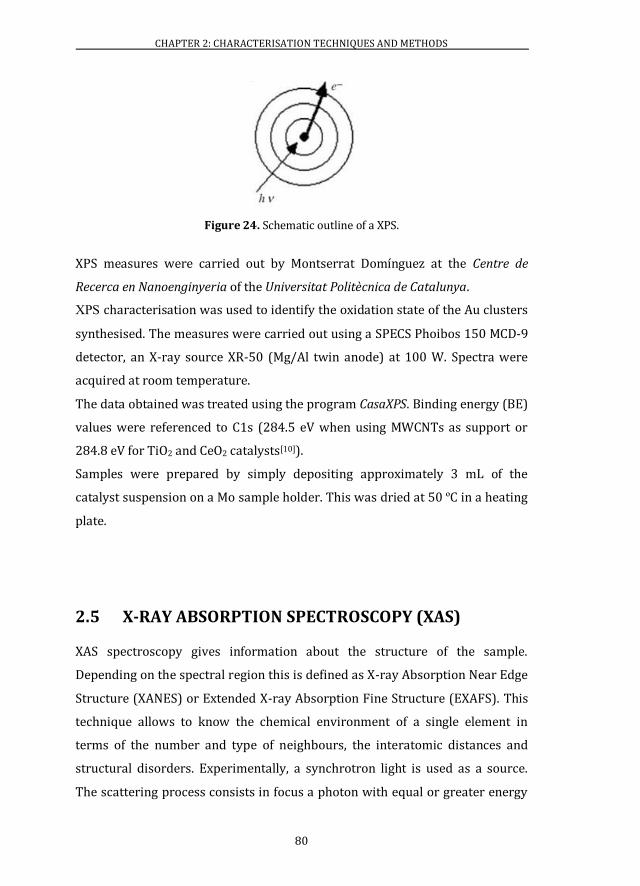
CHAPTER 2: CHARACTERISATION TECHNIQUES AND METHODS
80
Figure 24. Schematic outline of a XPS.
XPS measures were carried out by Montserrat Domínguez at the Centre de
Recerca en Nanoenginyeria of the Universitat Politècnica de Catalunya.
XPS characterisation was used to identify the oxidation state of the Au clusters
synthesised. The measures were carried out using a SPECS Phoibos 150 MCD-9
detector, an X-ray source XR-50 (Mg/Al twin anode) at 100 W. Spectra were
acquired at room temperature.
The data obtained was treated using the program CasaXPS. Binding energy (BE)
values were referenced to C1s (284.5 eV when using MWCNTs as support or
284.8 eV for TiO2 and CeO2 catalysts[10]).
Samples were prepared by simply depositing approximately 3 mL of the
catalyst suspension on a Mo sample holder. This was dried at 50 ºC in a heating
plate.
2.5 X-RAY ABSORPTION SPECTROSCOPY (XAS)
XAS spectroscopy gives information about the structure of the sample.
Depending on the spectral region this is defined as X-ray Absorption Near Edge
Structure (XANES) or Extended X-ray Absorption Fine Structure (EXAFS). This
technique allows to know the chemical environment of a single element in
terms of the number and type of neighbours, the interatomic distances and
structural disorders. Experimentally, a synchrotron light is used as a source.
The scattering process consists in focus a photon with equal or greater energy

CHAPTER 2: CHARACTERISATION TECHNIQUES AND METHODS
81
than the edge energy. In these conditions a core electron will be extracted.
When the absorbing atom is isolated, the ejected electron (photoelectron)
propagates as an unperturbed isotropic wave (Figure 25A). If other atoms
surround the absorber, as usually happens, these will be scattering centers of
the photoelectron wave (Figure 25B). The final state of the photoelectron is the
sum of the original and scattered waves. Due to the created interference, the
interaction probability between core electrons and incident photons will be
modified. The absorption coefficient atom ( xx ) is decreased or increased by
destructive or constructive interferences respectively. This interference
phenomenon for a given energy of the photoelectron depends on the distance
between emitting and scattering atoms and their atomic numbers[11].
Figure 25. Schematic representation of scattering processes[11].
The EXAFS signal )(kχ is defined as a function of the wave vector k and given
by the Equation 11. The signal is normalised by dividing it by x1μ . The peaks
obtained in an EXAFS spectrum are assigned to different bonds that the atom
can exhibit in the sample.
111
1 1x
x
x
xxk
μ
μ
μ
μμχ )( (11)

CHAPTER 2: CHARACTERISATION TECHNIQUES AND METHODS
82
where,
xx - experimental absorption coefficient (directly proportional to the
probability of absorption of one photon and decreases with the increase of
energy).
x1μ - intrinsic atomic absorption coefficient.
Measures of Au/MWCNTs catalysts were carried out by Dr. Gemma Guilera at
the Trieste Elletra-Synchrotron Light Facility at Italy.
XAS measures were performed in order to characterise the type of neighbours
of the Au atoms of the in-situ Au/MWCNTs catalysts. These measures give the
information about the existence of only metallic Au or the existence of isolated
Au atoms simply bonded to low molecular weight atoms.
XAS data at the Au L3-edge (11919 eV) was collected on the XAFS beamline. The
storage ring operated at 2 GeV electron energy with a current of 300 mA. A Si
(111) crystal was used in the double crystal monochromator. To eliminate
higher harmonics this crystal was detuned to 30% of the intensity. The X-ray
absorption measures were carried out at room temperature using the
fluorescence mode. The fluorescence signal was obtained using a Ketek silicon
drift’s detector. The incident x-rays were recorded using an ion chamber with
the optimal gas. Solid samples were used as pressed pellets. Spectra of these
samples were also recorded in transmission mode. Fluorescence measurements
of the Au/MWCNTs catalyst were very long (9 hours). Nevertheless, the data
quality was not enough for the EXAFS’ data quantification. As such a qualitative
approach was carried out and the EXAFS’ signal was inspected within a wave
number range of 3.6-9.6 Å-1. The VIPER program was used to data treatment.
2.7 THERMOGRAVIMETRIC MEASUREMENTS (TGA)
Thermogravimetric Analyses (TGA) consists in determining the samples’
weight variations in a certain range of temperatures and atmosphere. This

CHAPTER 2: CHARACTERISATION TECHNIQUES AND METHODS
83
technique consists in a continuously following of the sample weight on a
sensitive balance as the temperature is increased in air or in an inert
atmosphere. Results are represented in a weight (%) vs temperature graphic.
At lower temperatures the weight loss might result from the evaporation of
residual moisture or solvent.
TGA measures were carried out at the Departament de Física i Enginyeria
Nuclear of the Universitat Politècnica de Catalunya.
TGA was used to identify the temperature of decomposition of bare MWCNTs.
Measures were carried out using a thermobalance TA Instruments Q50 TGA.
Approximately 9 mg of the solid sample was deposited in the crucible of Pt. The
parameters used in the measures are presented in the Table 9.
Table 9. Parameters used for the TGA measures
Flow rate (mL/min) 50
Ramp 5 ºC/min
Temperature range (ºC) 25-900
Atmosphere Air
2.8 SURFACE AREA MEASUREMENTS
The specific surface area of a powder can be calculated by the Brunauer-
Emmett-Teller (BET) equation (Equation 12). This technique is based on the
physical adsorption of a gas on the solid surface. Surface area is determined by
calculating the amount of the physical adsorbed gas on a monolayer on the
surface of the solid by a continuous flow procedure. This analysis is usually
carried out at liquid nitrogen temperature. In order to obtain the surface
specific area of the solid, the experimental data is treated according to the BET
adsorption isotherm equation (Equation 12)[12].

CHAPTER 2: CHARACTERISATION TECHNIQUES AND METHODS
84
CVP
P
CV
C
P
PVa
..
11
1
1
00VP
1
V
C
VVPPP
PP1
(12)
where,
P - partial vapour pressure of the adsorbate gas in equilibrium with the
surface at -195.75 ºC, in Pa.
0P - saturated pressure of the adsorbate gas, in Pa.
aV - volume of gas adsorbed (T = 0 ºC P = 1 atm), in mL.
V - volume of gas adsorbed (T = 0 ºC; P = 1 atm), in mL.
C - dimensionless constant related with the enthalpy of adsorption of the
adsorbate gas on the powder sample.
Representing
1
1
0
P
PVa
in function of 0P
Pa linear straight line is obtained
(at least 3 points are required and the correlation coefficient, r2, must be higher
than 0.995). From this linear correlation the values of Vm and C are determined.
The specific surface area S can then be calculated according to the Equation
13[12].
mV
aNVS
m .
..
V
V (13)
where,
S - specific surface area of the solid, in m2/g.
N - Avogadro number (6.022 1023 mol-1).
a - effective cross-sectional area of one adsorbate molecule (0.162x10⁻¹⁸ m2 for
N2).
m - mass of the analysed powder, in g.

CHAPTER 2: CHARACTERISATION TECHNIQUES AND METHODS
85
mV - molar volume of an ideal gas at 1 atmosphere of pressure and 0 ºC
)/( molmLVm 2240022400 .
The measures were carried out by Meritxell Molmeneu at the Laboratori de
Nanotecnologia de Biomaterials of the Universitat Politècnica de Catalunya.
Using this technique the surface area of the different supports, namely
MWCNTs, TiO2 and CeO2, was obtained. Around 150 mg of powder was used.
The measures of the solid supports were carried out under N2 at -196.3 ºC
(equilibration interval: 10 s). A surface area and porosity Micromeritics ASAP
2020 analyser was used.
2.9 INDUCTIVELY COUPLED PLASMA-OPTICAL
EMISSION SPECTROSCOPY (ICP-OES)
ICP-OES is the measurement of light emitted by elements in a sample
introduced into an ICP source. It is a very precise chemical elemental analysis
allowing the detection of metals and non-metals at very low concentrations
(ppm). Another advantage of this technique is its ability to measure several
elements simultaneously unlike atomic absorption spectroscopy. This complex
technique combines a high temperature ICP source with an optical emission
spectrometer.
Briefly, firstly if the sample is solid a particular preparation is required. In this
phase, the solid sample is dissolved by wet digestion. The wet digestion is used
to oxidise the organic matter of the samples or to extract the present metals
from inorganic matrices[13]. This is carried out by mixing the solid sample with
a specific concentrated acid mixture. Depending on the solid composition
different acid mixtures are used[13]. Generally, HNO3, HCl, H2SO4, H3PO4 are used
as acids. Notice that the wet digestion is simply one of the methods of preparing
the sample. Other procedures of sample preparation, depending on the sample

CHAPTER 2: CHARACTERISATION TECHNIQUES AND METHODS
86
nature, are also carried out[13]. Once the metals are separated from the sample
matrices, using the ICP source (argon plasma, 8000 ºC – 10 000 ºC), the
complete atomization of the sample is achieved producing characteristic optical
emissions at different wavelengths. The real elemental concentration of the
sample is obtained by comparing the measured emission intensities to
intensities of standards of known concentration[14].
Measures were carried out by Susanna Mas at the Centres Científics I
Tecnològics of the Universitat de Barcelona.
This analysis was performed in order to know the real content of gold in
Au/MWCNTs in-situ synthesised catalysts. In this way, a relation between the
nominal gold content and the real one was obtained.
Experimentally, 25 mg of the Au/MWCNTs solid catalysts were dissolved in 8
mL of aqua regia in a millestone reactor. This mixture was heated up to 200 ºC
(ramp: 20 ºC/min) and left at this temperature for 15 minutes. After cold, the
mixture was filtered. The resultant solid filtered was washed and re-dispersed
in a 100 mL of thiourea – SC(NH2)2 (200 ppm in 1 v/v% HCl). After this pre-
treatment to extract the metal of interest of the solid catalysts, the real quantity
of Au was obtained using a simultaneous ICP-OES optical emission
spectrometer Perkin Elmer Optima 3200 RL.
2.10 REACTION SYSTEMS
2.10.1 SONOCHEMICAL SYNTHESIS OF Au NANOCLUSTERS
The last step of ex-situ synthesised Au nanoclusters synthetic protocol
presented in Chapter 4 consists in the Au-PMAA solution sonication in order to
form the Au nanoclusters. The solution was sonicated during 20 minutes under
a N2 atmosphere in a refrigerated cell using 100 W of power. This process was
carried out at the Centre de Recerca en Nanoenginyeria of the Universitat
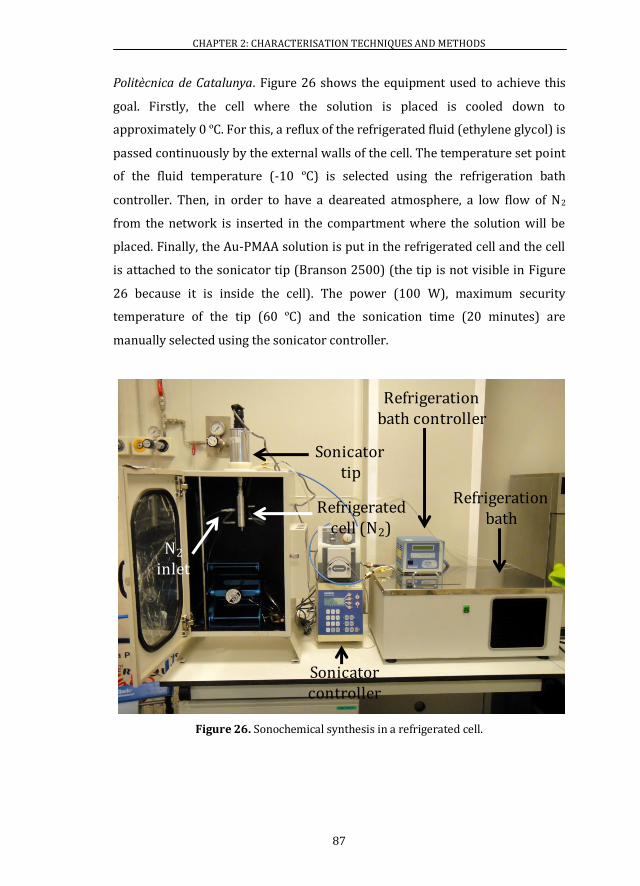
CHAPTER 2: CHARACTERISATION TECHNIQUES AND METHODS
87
Politècnica de Catalunya. Figure 26 shows the equipment used to achieve this
goal. Firstly, the cell where the solution is placed is cooled down to
approximately 0 ºC. For this, a reflux of the refrigerated fluid (ethylene glycol) is
passed continuously by the external walls of the cell. The temperature set point
of the fluid temperature (-10" ºC) is selected using the refrigeration bath
controller. Then, in order to have a deareated atmosphere, a low flow of N2
from the network is inserted in the compartment where the solution will be
placed. Finally, the Au-PMAA solution is put in the refrigerated cell and the cell
is attached to the sonicator tip (Branson 2500) (the tip is not visible in Figure
26 because it is inside the cell). The power (100 W), maximum security
temperature of the tip (60 ºC) and the sonication time (20 minutes) are
manually selected using the sonicator controller.
Figure 26. Sonochemical synthesis in a refrigerated cell.
Sonicatorcontroller
Refrigerated cell (N2)
Sonicatortip
Refrigeration bath controller
Refrigeration bath
N2
inlet

CHAPTER 2: CHARACTERISATION TECHNIQUES AND METHODS
88
2.10.2 CO OXIDATION
Figure 27 shows a simplified chemical engineering draw of the reaction system
used to test the catalytic activity for CO oxidation (Chapter 3 and Chapter 4).
These catalytic activity tests were carried out at the Goldemar Solutions
company located at the Parc Científic de Barcelona.
The reaction is carried out in a commercial Microactivity-Reference reactor
from PID Eng&Tech[15]. Firstly, the solid catalyst is placed in a quartz reactor
with a diameter of 0.92 cm and 32 cm of length. The catalyst is placed between
two layers of quartz wool (Figure 27) in order not to contaminate the reactor
porous plate and to avoid the formation of preferential pathways when the
gases arrive to the catalyst. Then, the height of the catalytic bed is measured
and the thermopar is introduced into the reactor to better control the
temperature at the catalyst position. After these steps, the reactor is introduced
in the oven, which is placed in a hot box like the rest of the system. Then, the
sequences of temperatures and gases’ flows desired are programmed by
computer using the program Process@. Once it is ensured that all the system
valves are opened and that there is pressure in the line, the gases controlled by
mass flow controllers (Bronkhorst, ±1% of full scale accuracy) are introduced
in the system and pass through a series of valves. Once the gases’ flow is
stabilised, the gases pass through the catalyst entering from the top of the
reactor. The exit of the reactor is connected to a 7820A Agilent gas
cromatograph (GC-MS), where the reactor outlet gases’ flows are analysed,
using the software Enhanced Data Analysis. In order to better control the
quantity of the contaminant that is pretended to eliminate (CO), the reaction is
alternated with by-pass, i.e. analysis of the gases quantity before entering the
reactor. By-pass analyses can be carried out due to the 6 way valve existent in
the system. The pressure of the system is usually in the range of 0.1 bar – 0.2
bar.
The reactions were performed using high purity N2 5.0 (≥ 99.999 %) and O2 5.0
(≥ 99.999 %) from Linde and CO (99.99%) from Praxair.
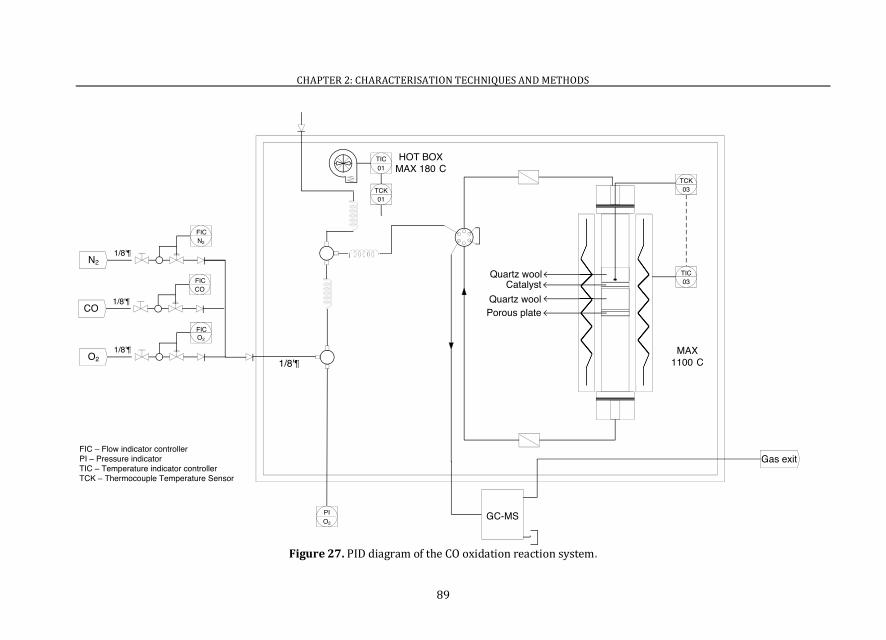
CHAPTER 2: CHARACTERISATION TECHNIQUES AND METHODS
89
Figure 27. PID diagram of the CO oxidation reaction system.
1/8'ÍN2
N2
FIC
1/8'ÍCO
COFIC
1/8'ÍO2
O2
FIC
1/8'Í
O2
PI
01TIC HOT BOX
MAX 180ºC
01TCK
Gas exit
03TCK
03TIC
MAX1100ºC
Quartz wool
Quartz woolCatalyst
Porous plate
FIC Ç Flow indicator controllerPI Ç Pressure indicatorTIC Ç Temperature indicator controllerTCK Ç Thermocouple Temperature Sensor
GC-MS

CHAPTER 2: CHARACTERISATION TECHNIQUES AND METHODS
90
2.10.3 CARBONACEOUS MATERIALS OXIDATION
Figure 28 shows a simplified chemical engineering drawing of the reaction
system used to investigate both the effect of Au clusters in decreasing the
combustion temperature of carbonaceous materials and the catalysts’ activity
for soot oxidation (Chapter 5). Measurements were carried out at the Institut de
Tècniques Energètiques of the Universitat Politècnica de Catalunya.
The combustion was followed by temperature programmed oxidation (TPO)
coupled with a mass spectrometer (mks cirrus). Temperature programmed
oxidation was carried out in a commercial Catalyst Analyser BELCAT-M (BEL
Japan, Inc.) equipped with a water trap and a thermal conductivity detector
(TCD). The software used to collect data measurement was Belcat and Process
Eye Professional for the TCD and mass signals respectively.
Firstly, the catalyst is placed in a U-tube quartz reactor with a diameter of 1.0
cm and 19.5 cm in length. Then the reactor is inserted into the furnace and a
thermopar is put into the reactor in order to better control the temperature at
the catalyst position. After, the flow gases (35 mL/min, 14 v/v% O2 balanced
with Ar) controlled by mass flow controllers (mks, 1% of full scale accuracy)
are inserted in the top of the reactor. The flow is left to stabilise at room
temperature and the desired ramping temperature sequence is programmed by
computer using the program Belcat. Once the flow of gases is stable, the reactor
is heated from 30 ºC to 900 ºC (ramp temperature: 5 ºC/min). When reaching
the maximum temperature of the ramp, i.e. at the end of the reaction the
reactor starts to cool down to room temperature.
Reactions were performed using high purity Ar 5.0 (≥ 99.999 %) and O2 5.0 (≥
99.999 %) from Linde.

CHAPTER 2: CHARACTERISATION TECHNIQUES AND METHODS
91
Figure 28. PID diagram of the TPO measures reaction system.
Gas 1
FM Ç Flow meterPS Ç Pressure switchTCD Ç Thermal conductivity detectorTCK Ç Thermocouple Temperature Sensor3WMVn Ç Manual 3 way valve6WMVn Ç Manual 6 way valve
Gas 2
Gas 3
Gas 4
He
TCD(REF)
Purge
I-10
Gas 5
Catalyst
Silica
TC2
TCD Air bathMAX 200ºC
FurnaceMAX 1200ºC
TCK
TCD(SEN)
FMVent
Trap
PS3WMV1
6WMV1
6WMV2
3WMV3
3WMV2
Massspetrometer

CHAPTER 2: CHARACTERISATION TECHNIQUES AND METHODS
92
2.11 REFERENCES
[1] C. Dickinson, PhD Thesis, Metal Oxide Porous Single Crystals and other
nanomaterials: An HRTEM study, University of St. Andrews 2007,
available on-line: http://hdl.handle.net/10023/217.
[2] M. Lentzen, Microscopy and Microanalysis 2006, 12, 191-205.
[3] O. Scherzer, Journal of Applied Physiscs 1949, 20, 20-29.
[4] H. Rose, Optik 1990, 85, 19-24.
[5] M. Haider, H. Rose, S. Uhlemann, E. Schwan, B. Kabius, K. Urban,
Ultramicroscopy 1998, 75, 53-60.
[6] http://wings.buffalo.edu/faculty/research/scic/sem-eds.html, consulted
24/02/2014.
[7] http://www.purdue.edu/rem/rs/sem.htm, consulted 24/02/2014.
[8] R. Howland, L. Benatar, A practical guide to scanning probe microscopy,
ThermoMicroscopes 2000.
[9] J. L. Figueiredo, F. R. Ribeiro, Catálise Heterogénea, 2nd edition,
Fundação Calouste Gulbenkian 2007.
[10] T. I. T. Okpalugo, P. Papakonstantinou, H. Murphy, J. McLaughlin, N. M.
D. Brown, Carbon 43 2005, 153-161.
[11] G. Vlaic, L. Olivi, Croatica Chemica Acta 2004, 77 (3), 427-433.
[12] http://particle.dk/methods-analytical-laboratory/surface-area-
bet/surface-area-bet-theory/, consulted 24/02/2014.
[13] M. Welna, A. Szymczycha-Madeja, P. Pohl, Quality of the Trace Element
Analysis: Sample Preparation Steps.
[14] http://www.elementalanalysis.com/services/inductively-coupled-
plasma-icp/, consulted 13/02/2014.
[15] http://www.pidengtech.com/thereference.html, consulted 12/02/2014.
"
CHAPTER 3:
IN-SITU SYNTHESIS OF GOLD
CLUSTERS AND CATALYTIC
ACTIVITY STUDY

"

CHAPTER 3: IN-SITU SYNTHESIS OF GOLD CLUSTERS AND CATALYTIC ACTIVITY STUDY
95
3.1 SYNTHETIC PROTOCOL
A synthetic protocol where gold clusters (d < 2 nm) are directly synthesised
and stabilised onto different surfaces is presented (in-situ). The materials used
as support were: commercial multiwalled carbon nanotubes (MWCNTs) (3100
– Thin Multiwalled Carbon nanotubes from Nanocyl), titanium oxide (TiO2) and
cerium oxide (CeO2).
The titanium oxide powder was prepared using as precursor titanium (IV)
isopropylate (MW = 284.2 g/mol; C12H28O4Ti; Alfa Aesar) which was firstly
dried at 80 ºC and then at 120 ºC and finally was calcined at 400 ºC during 2
hours (ramp temperature: 2 ºC/min).
The CeO2 was synthesised using 0.1 M cerium (III) nitrate hexahydrate (MW=
434.2 g/mol; Ce(NO3)3.6H2O; Sigma-Aldrich) and 1 M ammonia (MW= 17.0
g/mol; NH3; Chem-Lab NV) aqueous solutions. The procedure consisted of
adding the 0.1 M Ce(NO3)3.6H2O dropwise to the 1 M NH3 stirring solution until
it reached pH=9 at room temperature. Then, this solution was left stirring aging
for 1 hour at room temperature. After wash and filtration with mili-Q water, the
resultant filtered was dried at 80 ºC overnight. Finally, a calcination at 600 ºC
during 2 hours (ramp temperature: 2 ºC/min) was carried out.
The synthesis method presented here was patented in 2009[1]. It claims the
synthesis of subnanometric Au particles (d < 3 nm) on a surface covered by
amine groups. This method is very simple, allows a high level of control of the
Au particle size and is easily scaled-up.
Experimentally, the method consists of firstly, the coating of the support by a
polymer with amine groups. In this work, polyallylamine hydrochloride (PAH)
(MW ~ 15000 g/mol; (C3H8ClN)n; Aldrich) (Figure 29) was used as the
wrapping agent driving the gold clusters’ stabilisation on the support surface.

CHAPTER 3: IN-SITU SYNTHESIS OF GOLD CLUSTERS AND CATALYTIC ACTIVITY STUDY
96
Figure 29. Polyallylamine hydrochloride basic structure.
Figure 30. In-situ synthesis procedure (left) and respective schematic representation
using MWCNTs as support (right).
Support (s)
0.1 wt% PAH (aq.)(pH = 9)
+2 h sonication
Support-PAH suspension(excess PAH)
Filtration and wash+
Volume restitution (mili-Q water, pH = 9)+
1 h sonication
Support-PAH suspension
HAuCl4 (aq.)
Au/Support suspension(excess sodium citrate)
Centrifugation(optional step)
Au/Support suspension
Lyophilisation
Au/Support (s)
HAuCl4 (aq.)+
Support-PAH suspension
C6H5Na3O7.2H2O (aq.)
NH2 NH2
O
O-OH
O
O-
O- O
NH2 NH2
CHAPTER 3: IN-SITU SYNTHESIS OF GOLD CLUSTERS AND CATALYTIC ACTIVITY STUDY
97
Then, by reducing the gold precursor (chloroauric acid, MW = 339.79 g/mol;
HAuCl4; Sigma Aldrich) with sodium citrate (trisodium citrate dihydrate, MW =
394.1 g/mol; C6H5Na3O7.2H2O; Sigma-Aldrich), uniformly sized gold clusters
were formed on the support-PAH hybrid surface as schematically represented
in Figure 30 using MWCNTs as support. The different steps of the synthesis
procedure are presented in Figure 30.
Firstly, the preparation of the support-PAH solution consisted of dispersing the
support in a 0.1 wt% aqueous solution of PAH with pH=9 – 1 mg of support / 1
mL of 0.1 wt% PAH (aq.) (Figure 30). The polyelectrolyte solution pH was
obtained by adding to it an aqueous solution of 1.25 M sodium hydroxide (MW
= 40 g/mol; NaOH, Sigma-Aldrich). In order to obtain a homogeneous
dispersion and to ensure the individual suspension of the support material, the
support-PAH solution was then ultrasonicated during two hours in an ice bath
at 100 W (the sonication was carried out using a Branson 2500 sonicator tip).
The amine groups of the polymer that cover the support surface act as
nucleation centers where the gold clusters’ will reduce, stabilise and anchor
(Figure 30).
Because an excess of polymer would inhibit the catalytic activity either by
decreasing the metal-support interaction or by covering the Au active sites, this
was removed by filtration after the two hour sonication of the support with the
PAH aqueous solution (Figure 30). Using MWCNTs, when this polymer was in
excess a large layer of PAH (~ 9 nm) was observed on their surface (Figure
31a). This would surely impede the contact between the Au cluster and the
support’s surface and/or cover the catalyst active sites and consequently
decrease the catalytic activity. Indeed, the inhibition of the catalytic activity due
to the lack of the Au-support interaction was demonstrated in propene
epoxidation[2]. According to these authors the activity of a Au-Cu/TiO2 catalysts
was significantly enhanced after a 400 ºC calcination (up to 1.4 higher
conversion of propene was obtained). This enhancement of activity resulted
from the large alloy (Au-Cu)-support interaction that was formed at this
temperature. Using this calcination temperature a small particle size (5-6 nm)
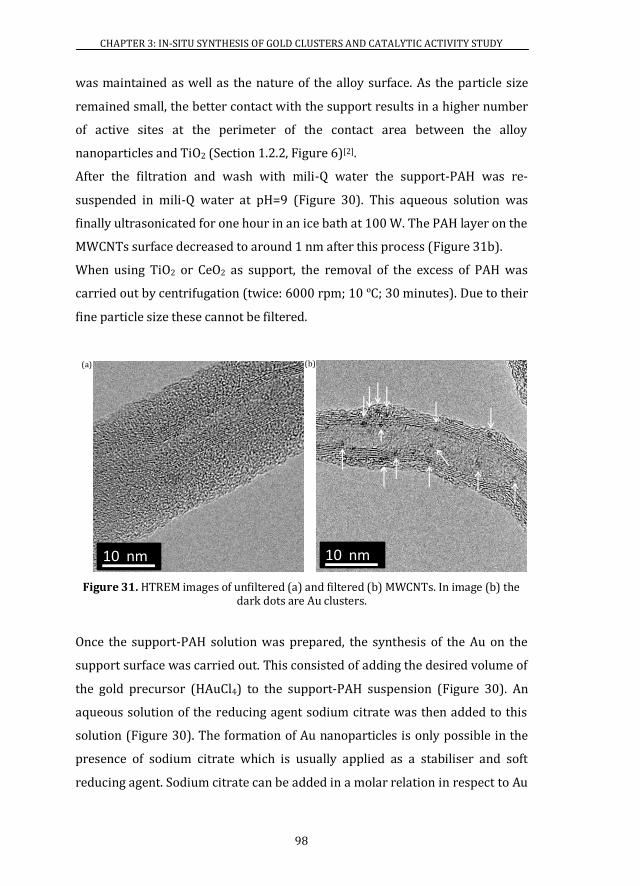
CHAPTER 3: IN-SITU SYNTHESIS OF GOLD CLUSTERS AND CATALYTIC ACTIVITY STUDY
98
was maintained as well as the nature of the alloy surface. As the particle size
remained small, the better contact with the support results in a higher number
of active sites at the perimeter of the contact area between the alloy
nanoparticles and TiO2 (Section 1.2.2, Figure 6)[2].
After the filtration and wash with mili-Q water the support-PAH was re-
suspended in mili-Q water at pH=9 (Figure 30). This aqueous solution was
finally ultrasonicated for one hour in an ice bath at 100 W. The PAH layer on the
MWCNTs surface decreased to around 1 nm after this process (Figure 31b).
When using TiO2 or CeO2 as support, the removal of the excess of PAH was
carried out by centrifugation (twice: 6000 rpm; 10 ºC; 30 minutes). Due to their
fine particle size these cannot be filtered.
Figure 31. HTREM images of unfiltered (a) and filtered (b) MWCNTs. In image (b) the dark dots are Au clusters.
Once the support-PAH solution was prepared, the synthesis of the Au on the
support surface was carried out. This consisted of adding the desired volume of
the gold precursor (HAuCl4) to the support-PAH suspension (Figure 30). An
aqueous solution of the reducing agent sodium citrate was then added to this
solution (Figure 30). The formation of Au nanoparticles is only possible in the
presence of sodium citrate which is usually applied as a stabiliser and soft
reducing agent. Sodium citrate can be added in a molar relation in respect to Au
(a) (b)
10 nm 10 nm

CHAPTER 3: IN-SITU SYNTHESIS OF GOLD CLUSTERS AND CATALYTIC ACTIVITY STUDY
99
or in excess. If this is in excess, catalytic activity will be affected, since more
active centers will be covered by this agent. However, once Au clusters are
anchored and stabilised on the support-PAH surface, the reducing agent can be
easily removed by centrifugation without Au loss (Figure 30). Finally, the
powder catalyst can be obtained by lyophilisation (P ∽ 2 10-2 mbar; T ∽ - 74
ºC) of the suspension. The catalysts synthesised in this work are presented in
Table 10.
Table 10. List of the in-situ synthesised catalysts.
Catalyst Nomenclature Au loading (wt%)
Au/MWCNTs
Au(0.1wt%)/MWCNTs 0.1
Au(0.3wt%)/MWCNTs 0.3
Au(0.5wt%)/MWCNTs 0.5
Au(1wt%)/MWCNTs 1
Au(3wt%)/MWCNTs 3
Au(6wt%)/MWCNTs 6
Au(13wt%)/MWCNTs 13
Au(50wt%)/MWCNTs 50
Au/CeO2 (CeO2 - 74.0 m2/g)
Au(0.1wt%)/CeO2 0.1
Au(0.5wt%)/CeO2 0.5
Au(1wt%)/CeO2 1
Au(3wt%)/CeO2 3
Au/CeO2 (CeO2 - 12.0 m2/g)
Au(0.05wt%)/CeO2_12.0 0.05
Au(1wt%)/CeO2_12.0 1
Au/TiO2
Au(0.3wt%)/TiO2 0.3
Au(1wt%)/TiO2 1
Au(3wt%)/TiO2 3
The successful achievement of synthesise Au catalysts using different supports,
namely MWCNTs, CeO2 and TiO2, was observed by HRTEM characterisation.
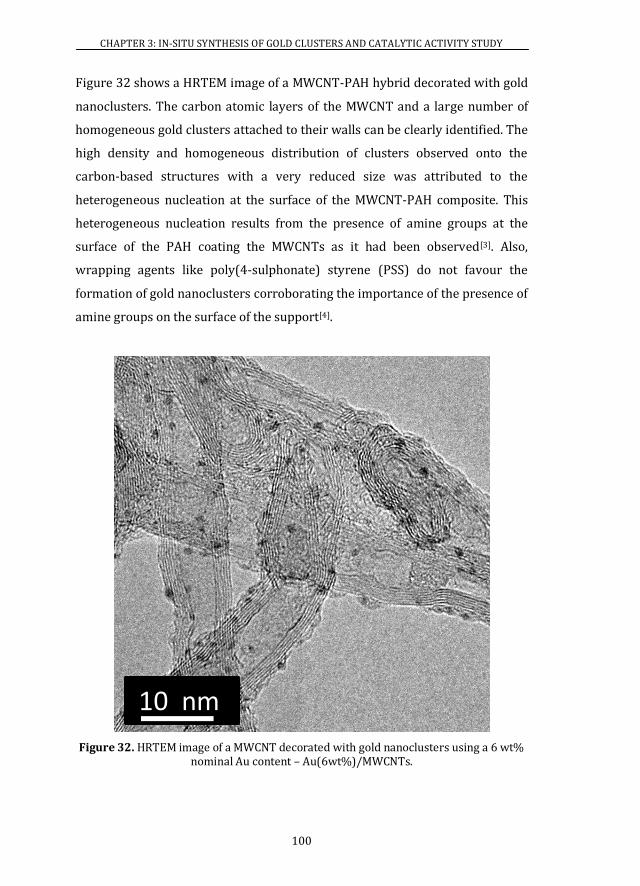
CHAPTER 3: IN-SITU SYNTHESIS OF GOLD CLUSTERS AND CATALYTIC ACTIVITY STUDY
100
Figure 32 shows a HRTEM image of a MWCNT-PAH hybrid decorated with gold
nanoclusters. The carbon atomic layers of the MWCNT and a large number of
homogeneous gold clusters attached to their walls can be clearly identified. The
high density and homogeneous distribution of clusters observed onto the
carbon-based structures with a very reduced size was attributed to the
heterogeneous nucleation at the surface of the MWCNT-PAH composite. This
heterogeneous nucleation results from the presence of amine groups at the
surface of the PAH coating the MWCNTs as it had been observed[3]. Also,
wrapping agents like poly(4-sulphonate) styrene (PSS) do not favour the
formation of gold nanoclusters corroborating the importance of the presence of
amine groups on the surface of the support[4].
Figure 32. HRTEM image of a MWCNT decorated with gold nanoclusters using a 6 wt% nominal Au content – Au(6wt%)/MWCNTs.
10 nm
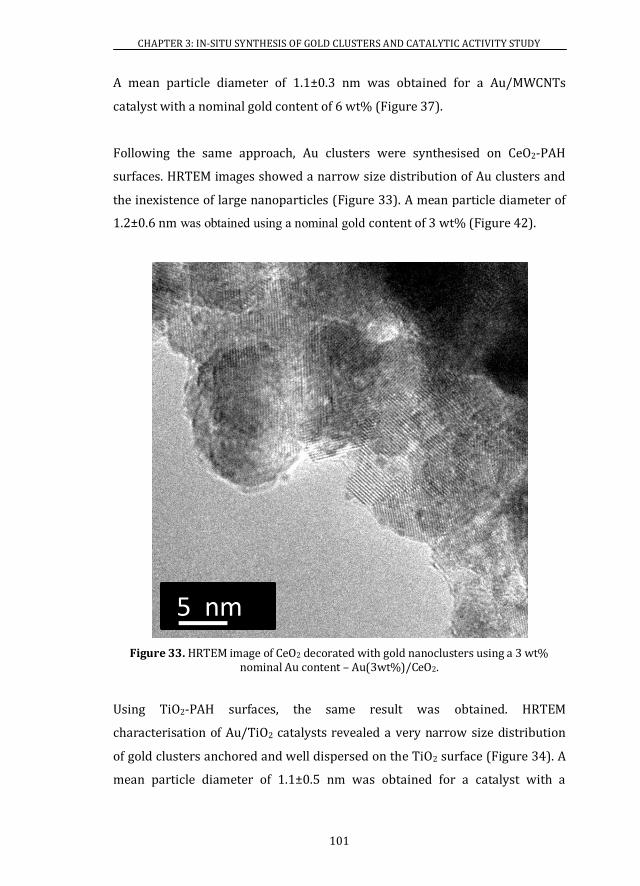
CHAPTER 3: IN-SITU SYNTHESIS OF GOLD CLUSTERS AND CATALYTIC ACTIVITY STUDY
101
A mean particle diameter of 1.1±0.3 nm was obtained for a Au/MWCNTs
catalyst with a nominal gold content of 6 wt% (Figure 37).
Following the same approach, Au clusters were synthesised on CeO2-PAH
surfaces. HRTEM images showed a narrow size distribution of Au clusters and
the inexistence of large nanoparticles (Figure 33). A mean particle diameter of
1.2±0.6 nm was obtained using a nominal gold content of 3 wt% (Figure 42).
Figure 33. HRTEM image of CeO2 decorated with gold nanoclusters using a 3 wt% nominal Au content – Au(3wt%)/CeO2.
Using TiO2-PAH surfaces, the same result was obtained. HRTEM
characterisation of Au/TiO2 catalysts revealed a very narrow size distribution
of gold clusters anchored and well dispersed on the TiO2 surface (Figure 34). A
mean particle diameter of 1.1±0.5 nm was obtained for a catalyst with a
5 nm

CHAPTER 3: IN-SITU SYNTHESIS OF GOLD CLUSTERS AND CATALYTIC ACTIVITY STUDY
102
nominal gold content of 1 wt% (Figure 44). Besides, HRTEM images did not
show large gold nanoparticles.
Figure 34. HRTEM image of TiO2 decorated with gold nanoclusters using a 1 wt% nominal Au content – Au(1wt%)/TiO2.
The successful synthesis of gold clusters on these three different surfaces
demonstrated the ability of this in-situ synthesis method to be easily expanded
to several other PAH coated surfaces. This result is extremely useful. In this
way, the catalytic activity of these gold clusters catalysts can be properly
investigated by using the most adequate support for the chemical reaction of
interest.
Additionally, these results are extremely innovative since Au clusters are
obtained by a clean environmental friendly and extremely simple synthetic
protocol. Comparing this method with the ones developed over time to
5 nm
CHAPTER 3: IN-SITU SYNTHESIS OF GOLD CLUSTERS AND CATALYTIC ACTIVITY STUDY
103
synthesise Au/CNTs catalysts (Chapter 1, Section 1.5, Table 2) it is concluded
that, definitely, this via citrate reduction method is much more clean and easy.
Also, this method allows gold clusters with less than 2 nm to be obtained on
different surfaces using the citrate reduction protocol. Then, innovating the
first developed Turkevich method where ~ 15 nm Au nanoparticles were
obtained. Furthermore, this in-situ method represents an alternative to the
common used deposition-precipitation (DP) method to synthesise small metal
particle size Au/CeO2 and Au/TiO2 catalysts. Thus, the activity of catalysts
prepared by distinct synthetic protocols can be easily compared.
3.2 ICP-OES CHEMICAL ANALYSES
All the gold contents referred in this work are nominal gold contents.
Considering the nominal desired Au content, the respective volume of gold
precursor (HAuCl4) aqueous solution necessary to add to the liquid support-
PAH solution was calculated. In this way, and in order to access the real gold
content existent in the catalysts, ICP-OES chemical analyses were carried out
using MWCNTs catalysts. The catalysts were prepared using a sodium
citrate/Au 1:1 molar relation.
ICP-OES measures of the Au/MWCNTs catalysts revealed that the nominal Au
content is very similar to the real reduced Au loading existent in the catalysts,
which indicates that all the gold precursor was reduced. The
Au(0.1wt%)/MWCNTs and Au(3wt%)/MWCNTs catalysts showed a real gold
content of 0.13 wt% and 3.18 wt% respectively.
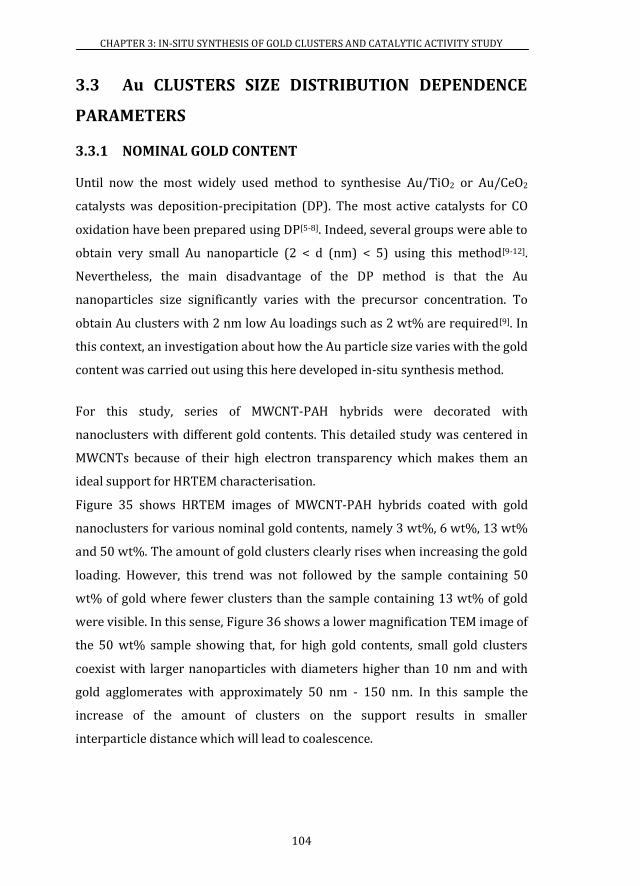
CHAPTER 3: IN-SITU SYNTHESIS OF GOLD CLUSTERS AND CATALYTIC ACTIVITY STUDY
104
3.3 Au CLUSTERS SIZE DISTRIBUTION DEPENDENCE
PARAMETERS
3.3.1 NOMINAL GOLD CONTENT
Until now the most widely used method to synthesise Au/TiO2 or Au/CeO2
catalysts was deposition-precipitation (DP). The most active catalysts for CO
oxidation have been prepared using DP[5-8]. Indeed, several groups were able to
obtain very small Au nanoparticle (2 < d (nm) < 5) using this method[9-12].
Nevertheless, the main disadvantage of the DP method is that the Au
nanoparticles size significantly varies with the precursor concentration. To
obtain Au clusters with 2 nm low Au loadings such as 2 wt% are required[9]. In
this context, an investigation about how the Au particle size varies with the gold
content was carried out using this here developed in-situ synthesis method.
For this study, series of MWCNT-PAH hybrids were decorated with
nanoclusters with different gold contents. This detailed study was centered in
MWCNTs because of their high electron transparency which makes them an
ideal support for HRTEM characterisation.
Figure 35 shows HRTEM images of MWCNT-PAH hybrids coated with gold
nanoclusters for various nominal gold contents, namely 3 wt%, 6 wt%, 13 wt%
and 50 wt%. The amount of gold clusters clearly rises when increasing the gold
loading. However, this trend was not followed by the sample containing 50
wt% of gold where fewer clusters than the sample containing 13 wt% of gold
were visible. In this sense, Figure 36 shows a lower magnification TEM image of
the 50 wt% sample showing that, for high gold contents, small gold clusters
coexist with larger nanoparticles with diameters higher than 10 nm and with
gold agglomerates with approximately 50 nm - 150 nm. In this sample the
increase of the amount of clusters on the support results in smaller
interparticle distance which will lead to coalescence.
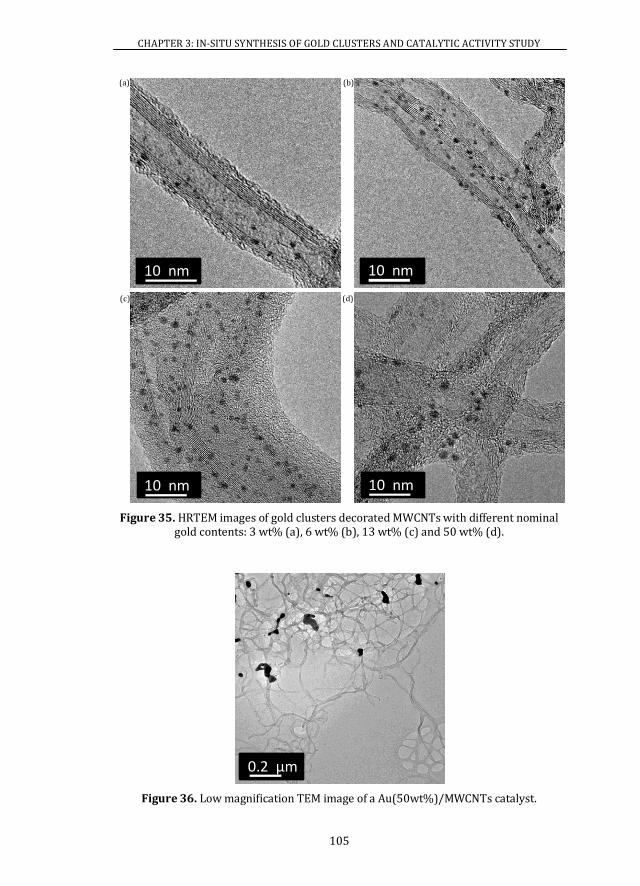
CHAPTER 3: IN-SITU SYNTHESIS OF GOLD CLUSTERS AND CATALYTIC ACTIVITY STUDY
105
Figure 35. HRTEM images of gold clusters decorated MWCNTs with different nominal gold contents: 3 wt% (a), 6 wt% (b), 13 wt% (c) and 50 wt% (d).
Figure 36. Low magnification TEM image of a Au(50wt%)/MWCNTs catalyst.
(a)
(c) (d)
(b)
10 nm
10 nm
10 nm
10 nm
0.2 μm

CHAPTER 3: IN-SITU SYNTHESIS OF GOLD CLUSTERS AND CATALYTIC ACTIVITY STUDY
106
The particle size distribution derived from HRTEM observations is presented in
Figure 37. The size distribution and mean Au particle diameter of the
Au(50wt%)/MWCNTs catalyst is not shown. Due the very different sized Au
nanoparticles that coexist in this catalyst, a very high error was obtained for the
mean Au particle diameter which does not represent the real value.
Firstly, notice that, as observed in the HRTEM images, the population of gold
clusters has a very narrow size distribution with extremely low dispersions of
the order of 0.3 nm to 0.4 nm. Secondly, a clear trend to obtain larger particles
can be observed by increasing the gold content. Increasing the gold content
does not only raise the amount of particles at the surface of the MWCNT but
also the average size of the particles, which varies from 1.1 nm to 1.6 nm
(Figure 38, Table 11).
Figure 37. Particle size distribution histograms for gold clusters obtained at different nominal gold loadings on MWCNTs.
Remarkably, this method allows by simply varying the final reduced gold
content from 3 wt% to 13 wt%, tailoring the gold nanoparticles size between
1.1 nm and 1.6 nm when MWCNTs are used as the support. It can then be
concluded that the main advantage of this method over DP is that, even when
synthesised with high gold loadings such as 13 wt%, an almost uniform
202 207 302 307 402 407 502 507 602 607 702202
203
204
205
"
Htcevkqp
R ctvkeng"fkcogvgt"*po +
203
204
205
"
""
203
204
205
"
13 wt%
6 wt%
3 wt%
"
"
"

CHAPTER 3: IN-SITU SYNTHESIS OF GOLD CLUSTERS AND CATALYTIC ACTIVITY STUDY
107
distribution of Au clusters (d < 2 nm) is still obtained. Nevertheless, a lower
quantity of Au nanoparticles with diameters between 2 nm and 3.5 nm also
coexist with the clusters population (Figure 37) which makes it preferable to
use gold contents up to 6 wt%.
Figure 38. Dependence of the mean Au particle diameter with the Au loading for Au/MWCNTs catalysts.
Table 11. Mean particle diameter of the different gold content Au/MWCNTs catalysts.
Catalyst Particle diameter (nm)
Au(3wt%)/MWCNTs 1.1±0.3
Au(6wt%)/MWCNTs 1.1±0.3
Au(13wt%)/MWCNTs 1.6±0.4
3.3.2 SUPPORT SURFACE AREA
Based on the previous observations and discussion, different sized gold clusters
are obtained by this in-situ synthetic protocol, depending on the gold content.
Nevertheless, the metal nanoparticle size is also highly dependent of the
surface area of the material used as the catalyst support[13]. A lower surface
2 4 6 8 : 32 34 36 38202
207
302
307
402
407
502
"
"
Ogcp"rctvkeng"fkcogvgt"*po
+
Cw"nqcfkpi" *y v’ +

CHAPTER 3: IN-SITU SYNTHESIS OF GOLD CLUSTERS AND CATALYTIC ACTIVITY STUDY
108
area will lead to an easy aggregation of the Au clusters. Indeed, when using
Au/TiO2 catalysts for the CO oxidation, Moreau et al. concluded that the more
active catalysts were those which were supported in higher TiO2 surfaces
areas[14]. The authors explained the lower activity when using a lower support
surface area by the easier agglomeration of the Au particles due to their
stronger proximity favoured by the heat of the reaction. Besides if the support
selected has a low surface area all the gold might not be deposited on its
surface. The observed lower deactivation of the catalyst prepared with a higher
support surface area was explained by the fact that the inhibiting carbonate
ions formed during reaction would readily migrate from the Au neighbour to
more distant places where they do not affect the activity[14].
Li et al. using Au/CeO2 catalysts for the formaldehyde oxidation also observed a
significantly enhancement of the catalytic activity for higher surface area
values[13]. As it is widely known, the oxygen vacancies play a very significant
role in oxidation reactions such as the CO oxidation. In this way, a higher
surface area is preferable once that the relative concentration of oxygen
vacancies increase with this parameter. Indeed, the higher quantity of defect
sites in the high surface area CeO2 will provide more oxygen vacancies that are
able to adsorb and activate O2. Therefore, these authors, attributed the higher
catalytic activity observed when using a high CeO2 surface area to two facts: the
increase of oxygen vacancies that will lead to the formation of AuxCe1-xO2-γ solid
solution, on which oxygen molecules could be transformed into active species
for the reaction, and the fact that the Au nanoparticles may have a strong
interaction with the support and a consequently higher adsorption of the
reagent on the Au particles will take place[13].
In this context, the influence of the support surface area on the Au nanoparticle
size was investigated. HRTEM characterisation allowed to conclude about the
size of the Au clusters or nanoparticles formed on the different support
surfaces. Firstly, the gold clusters size using gold contents of 0.3 wt% or 0.5

CHAPTER 3: IN-SITU SYNTHESIS OF GOLD CLUSTERS AND CATALYTIC ACTIVITY STUDY
109
wt%, 1 wt% and 3 wt% was compared for each support. The surface area
calculated by BET of the different supports is shown in Table 12.
Table 12. Surface area calculated by BET of MWCNTs, TiO2 and CeO2 supports.
Support Surface area (m2/g)
MWCNTs 375.3
CeO2 74.0
TiO2 26.8
Using catalysts up to a 3 wt% gold content, gold clusters (d = 1.1±0.3 nm) were
formed with a Au content of 3 wt%, when using MWCNTs as support (Figure
39). When the gold loading was decreased to 1 wt%, clusters were still present
but in a smaller quantity. For this catalyst, the Au mean particle size
distribution is not presented, due to the very low number of clusters observed
by HRTEM. For gold contents lower than 0.5 wt%, gold clusters were not
observed (Figure 39).

CHAPTER 3: IN-SITU SYNTHESIS OF GOLD CLUSTERS AND CATALYTIC ACTIVITY STUDY
110
Figure 39. HRTEM images of MWCNTs decorated with gold clusters using different nominal gold loadings.
10 nm
10 nm
1 wt%
10 nm
3 wt%
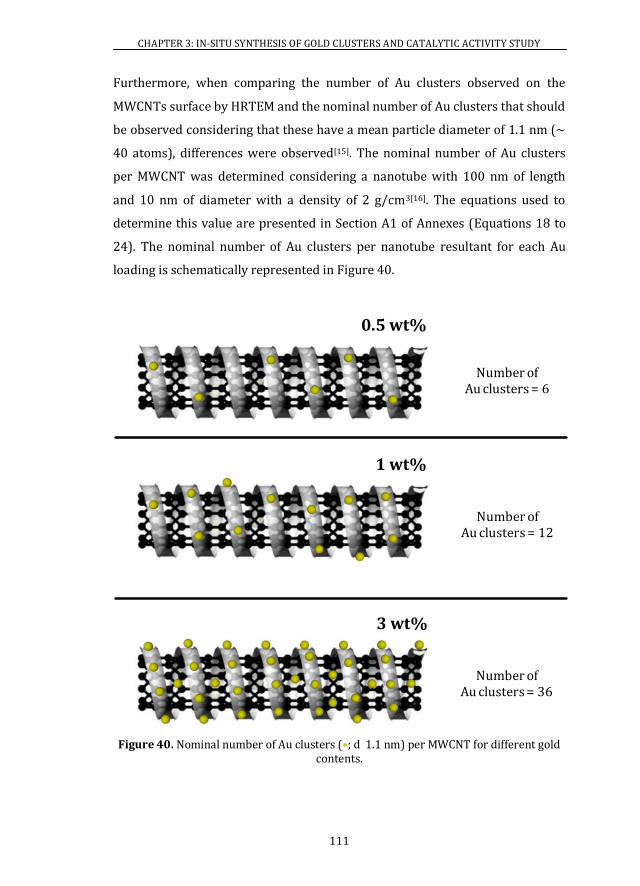
CHAPTER 3: IN-SITU SYNTHESIS OF GOLD CLUSTERS AND CATALYTIC ACTIVITY STUDY
111
Furthermore, when comparing the number of Au clusters observed on the
MWCNTs surface by HRTEM and the nominal number of Au clusters that should
be observed considering that these have a mean particle diameter of 1.1 nm (~
40 atoms), differences were observed[15]. The nominal number of Au clusters
per MWCNT was determined considering a nanotube with 100 nm of length
and 10 nm of diameter with a density of 2 g/cm3[16]. The equations used to
determine this value are presented in Section A1 of Annexes (Equations 18 to
24). The nominal number of Au clusters per nanotube resultant for each Au
loading is schematically represented in Figure 40.
Figure 40. Nominal number of Au clusters (•; d 1.1 nm) per MWCNT for different gold contents.
3 wt%
1 wt%
0.5 wt%
Number ofAu clusters = 12
Number ofAu clusters = 36
Number ofAu clusters = 6

CHAPTER 3: IN-SITU SYNTHESIS OF GOLD CLUSTERS AND CATALYTIC ACTIVITY STUDY
112
It was then concluded that in the Au(3wt%)/MWCNTs catalyst, the number of
Au clusters observed approximately coincides with the respective nominal
number (Figure 39 vs Figure 40). Nevertheless, the same does not occur for the
0.5 wt% and 1 wt% catalysts. In these catalysts a much lower number of Au
clusters exist on the MWCNTs surface when comparing to the nominal number
(Figure 39 vs Figure 40). This result has left then the question about what
happened to the gold in these catalysts. Thus, firstly, it was verified that, in the
synthesis suspension recipient, residues were not left. Moreover, large Au
agglomerates were not observed in the suspensions. Finally, ICP-OES analysis
revealed that Au was not lost during the synthesis and that all the gold
precursor is reduced. Thus, the inexistence of gold in the lowest Au content
catalysts was discarded. In this way further characterisation of these catalysts
by aberration-corrected HRTEM was carried out (Section 3.4.1). This
microscope, due to its properties (Chapter 2, Section 2.1), allows the
constituent elements of the catalysts to be seen in more detail.
The successful synthesis of Au clusters on MWCNTs has only been
demonstrated by a few authors. Zanella et al, by reduction of HAuCl4 with citric
acid in propanol and consequent deposition of Au on 1,6 hexanedithiol
fuctionalised MWCNTs achieved the formation of Au clusters with a mean
diameter of approximately 1.7 nm[17]. In the same way, Au/MWCNTs with a
mean Au diameter of 1.8±0.3 nm and 3.9±0.9 nm were also obtained by a
photoinitiated carbine addition reaction[18]. Other reported synthesis methods
lead to the formation of larger nanoparticles as it was outlined in Chapter 1
(Section 1.5, Table 2). Hence, the two major advantages of the in-situ synthesis
method developed here are: the uniform and narrow size distribution of Au
nanoclusters; the fact that only uses water as solvent makes it much cleaner
than the others as it uses less organic reagents which might inhibit the catalytic
activity.

CHAPTER 3: IN-SITU SYNTHESIS OF GOLD CLUSTERS AND CATALYTIC ACTIVITY STUDY
113
In respect to the Au/CeO2 catalysts, these showed a similar result to the
MWCNTs (Figure 33, Figure 41). For gold loadings of 1 wt% or 3 wt%, gold
clusters with a mean particle size of 1.3±0.6 nm and 1.2±0.6 nm were formed
on the CeO2 surface respectively (Figure 42, Table 13).
Again, gold clusters were not observed for a gold content of 0.5 wt% (Figure
41).
Figure 41. HRTEM images of CeO2 decorated with gold clusters using different nominal gold loadings.
0.5 wt%
5 nm
1 wt%
5 nm

CHAPTER 3: IN-SITU SYNTHESIS OF GOLD CLUSTERS AND CATALYTIC ACTIVITY STUDY
114
Figure 42. Particle size distribution histograms for gold clusters obtained at different gold loadings on CeO2.
Notice that the mean particle diameter of the Au(1wt%)/CeO2 catalyst was
determined exceptionally excluding the unique Au nanoparticle of
approximately 8.4 nm of diameter once that it would introduce a high error and
lead to a false mean Au particle diameter value (Table 13).
Table 13. Mean particle diameter of the different gold content Au/CeO2 catalysts.
Catalyst Particle diameter (nm)
Au(1wt%)/CeO2 1.3±0.6
Au(3wt%)/CeO2 1.2±0.6
Based on these results, it was concluded that this in-situ synthetic protocol
allows smaller Au nanoparticles on Au/CeO2 catalysts to be obtained than
either the deposition-precipitation (DP) or co-precipitation (co-P) methods
commonly reported, and this represents an advantage over these common
methods. Generally, by DP, Au particles around 2.5 nm were obtained using a
Au loading of 0.34 wt% by Zhang et al.[5]. In addition, Tana et al. revealed that
gold loadings of approximately 3 wt% led to the formation of Au nanoparticles
2 3 4 5 6 7 8 9 : ;2
7
32
37
Pwod
gt"qh"rctvkengu
R ctvkeng"fkcogvgt"*po+
3 4 5 6 7 8 9 :2
5
8
;
34
3 wt%
1 wt%
"
"
"
"

CHAPTER 3: IN-SITU SYNTHESIS OF GOLD CLUSTERS AND CATALYTIC ACTIVITY STUDY
115
with a diameter around 3.9 nm[8]. With this in-situ method gold clusters (d < 2
nm) were obtained using a gold content of 3 wt%.
Finally, Au/TiO2 catalysts (Figure 43) showed, for a nominal gold loading of 3
wt%, the coexistence of large Au nanoparticles and Au clusters. When
decreasing the loading to 0.3 wt% or 1 wt%, only gold nanoclusters were
observed. The particle size distributions and the respective mean particle
diameter obtained for each catalyst are presented in Figure 44 and Table 14
respectively.

CHAPTER 3: IN-SITU SYNTHESIS OF GOLD CLUSTERS AND CATALYTIC ACTIVITY STUDY
116
Figure 43. HRTEM images of TiO2 decorated with gold clusters/nanoparticles using different nominal gold loadings.
0.3 wt%
5 nm
1 wt%
5 nm
3 wt%
5 nm
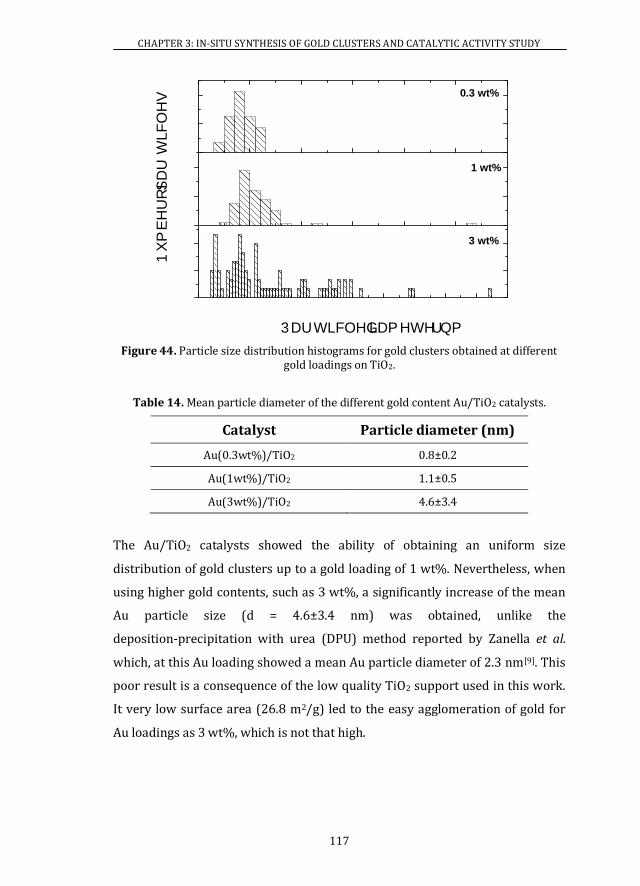
CHAPTER 3: IN-SITU SYNTHESIS OF GOLD CLUSTERS AND CATALYTIC ACTIVITY STUDY
117
Figure 44. Particle size distribution histograms for gold clusters obtained at different gold loadings on TiO2.
Table 14. Mean particle diameter of the different gold content Au/TiO2 catalysts.
Catalyst Particle diameter (nm)
Au(0.3wt%)/TiO2 0.8±0.2
Au(1wt%)/TiO2 1.1±0.5
Au(3wt%)/TiO2 4.6±3.4
The Au/TiO2 catalysts showed the ability of obtaining an uniform size
distribution of gold clusters up to a gold loading of 1 wt%. Nevertheless, when
using higher gold contents, such as 3 wt%, a significantly increase of the mean
Au particle size (d = 4.6±3.4 nm) was obtained, unlike the
deposition-precipitation with urea (DPU) method reported by Zanella et al.
which, at this Au loading showed a mean Au particle diameter of 2.3 nm[9]. This
poor result is a consequence of the low quality TiO2 support used in this work.
It very low surface area (26.8 m2/g) led to the easy agglomeration of gold for
Au loadings as 3 wt%, which is not that high.
2 4 6 8 : 32 34 36 38 3: 422
5
8
""
Rctvkeng"fkcogvgt"*po +
3 4 5 6 72
42
62
"
"
Pwod
gt"qh"rctvkengu
3 4 5 6 72
:
38
"
3 wt%
1 wt%
0.3 wt%
"
"
"

CHAPTER 3: IN-SITU SYNTHESIS OF GOLD CLUSTERS AND CATALYTIC ACTIVITY STUDY
118
The different sizes of Au observed using the same gold contents on the three
supports allowed conclusions about its intrinsic dependence on this variable
with the support surface area. Using the same nominal gold contents, different
sized gold nanoparticles were observed, depending on the support used. For
example, comparing the Au/MWCNTs and the Au/TiO2 catalysts prepared using
the same Au loading (3 wt%), different sized clusters were found (Figure 39 vs
Figure 43). The Au(3wt%)/MWCNTs catalysts showed a uniform size
distribution with a mean particle diameter of Au of 1.1±0.3 nm and the
Au(3wt%)/TiO2 catalyst showed a larger mean particle diameter (4.6±3.4 nm)
due to the existence of some large Au nanoparticles with diameters between 5
nm and 10 nm. This result is in accordance with the significantly different
surface areas of both supports (MWCNTs surface area is 14 times higher than
TiO2 surface area, Table 12).
Furthermore, the evidence of this dependence (surface area/Au agglomeration)
was also noticed using CeO2. Besides the synthesised CeO2 previously referred,
which presents a surface area of 74.0 m2/g, an offered CeO2 was also used. This
last has a much lower surface area (12.0 m2/g). The size of the Au nanoparticles
formed on both supports, using the same nominal gold content (1 wt%), was
compared (Table 15). HRTEM characterisation revealed that, on the lower CeO2
surface area (Figure 45), large Au nanoparticles of approximately 15 nm coexist
with gold clusters with a mean particle diameter of 1.4±0.2 nm (Figure 46).
Nevertheless, when the higher CeO2 surface area was used only gold clusters
were present on the support surface (d = 1.3±0.6 nm) (Figure 41).
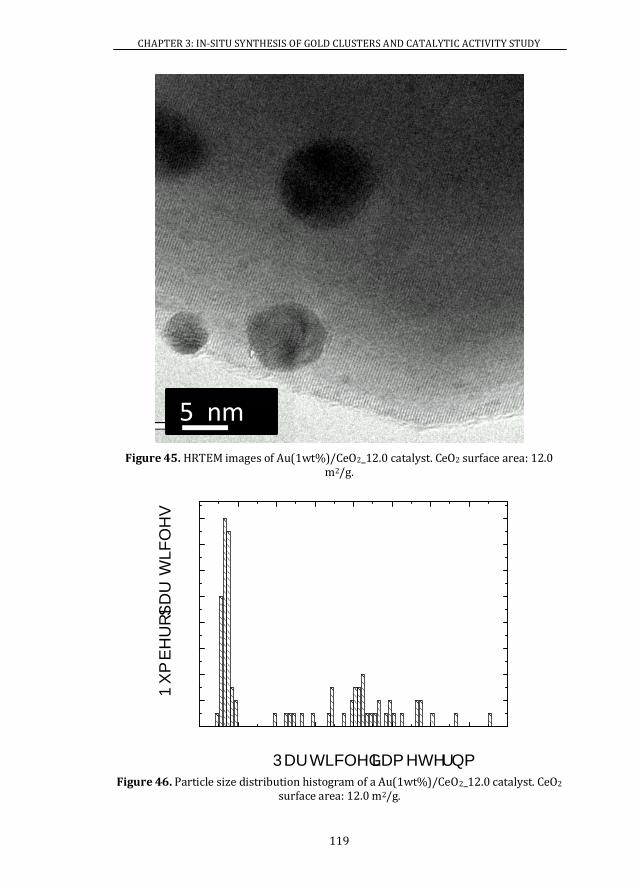
CHAPTER 3: IN-SITU SYNTHESIS OF GOLD CLUSTERS AND CATALYTIC ACTIVITY STUDY
119
Figure 45. HRTEM images of Au(1wt%)/CeO2_12.0 catalyst. CeO2 surface area: 12.0 m2/g.
Figure 46. Particle size distribution histogram of a Au(1wt%)/CeO2_12.0 catalyst. CeO2
surface area: 12.0 m2/g.
5 nm
2 4 6 8 : 32 34 36 382
4
6
8
:
32
34
36
38"
"
Pwod
gt"qh"rctvkengu
R ctvkeng"fkcogvgt"*po +

CHAPTER 3: IN-SITU SYNTHESIS OF GOLD CLUSTERS AND CATALYTIC ACTIVITY STUDY
120
Table 15. Mean particle diameter of the different Au/CeO2 catalysts synthesised using different support surface areas.
Catalyst Particle diameter (nm)
Au(1wt%)/CeO2_12.0 (12.0 m2/g) 4.7±4.0
Au(1wt%)/CeO2 (74.0 m2/g) 1.3±0.6
The sinter of the Au clusters in the supports with a low surface area results
from the lower Au interparticle distance (Figure 47). In the lower surface area
CeO2 Au clusters will be much closer than in the 74.0 m2/g CeO2 leading to the
Au aggregation into large nanoparticles. In the highest surface area CeO2 Au
clusters are further apart and will therefore maintain their size.
Figure 47. Schematic representation of the Au clusters (•) interparticle distance in different surface area CeO2 supports.
Indeed, using the CeO2 with a lower surface area, in order to observe almost
only Au clusters on the surface of the support, a very low nominal reduced Au
content (0.05 wt%) was required (Figure 48). When using such low nominal
reduced Au content large Au agglomerates were not observed at low
magnification.
12.0 m2/g
74.0 m2/g
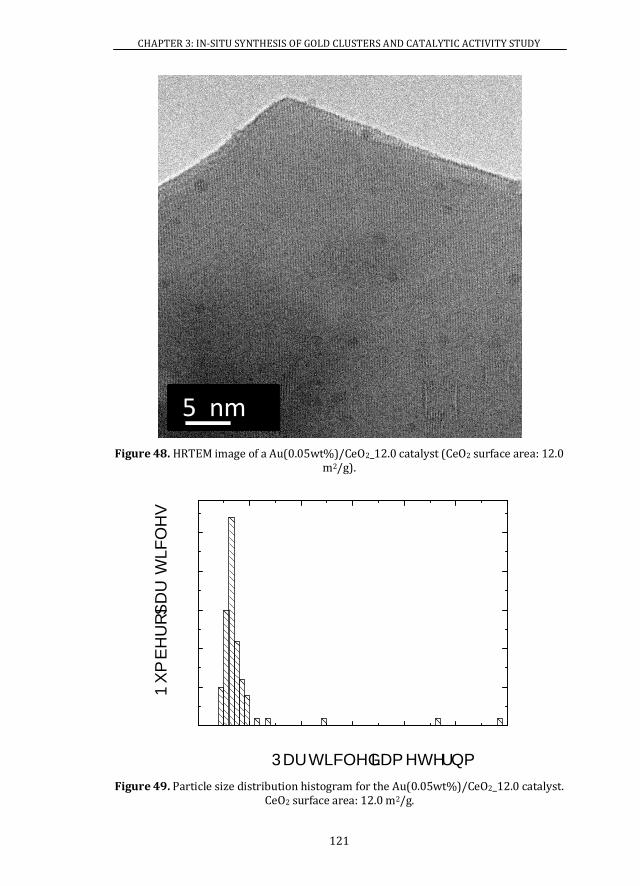
CHAPTER 3: IN-SITU SYNTHESIS OF GOLD CLUSTERS AND CATALYTIC ACTIVITY STUDY
121
Figure 48. HRTEM image of a Au(0.05wt%)/CeO2_12.0 catalyst (CeO2 surface area: 12.0 m2/g).
Figure 49. Particle size distribution histogram for the Au(0.05wt%)/CeO2_12.0 catalyst. CeO2 surface area: 12.0 m2/g.
5 nm
2 4 6 8 : 32 342
7
32
37
42
47"
"
Pwod
gt"qh"rctvkengu
R ctvkeng"fkcogvgt"*po +

CHAPTER 3: IN-SITU SYNTHESIS OF GOLD CLUSTERS AND CATALYTIC ACTIVITY STUDY
122
A size distribution of 1.4±0.3 nm was obtained for the Au(0.05wt%)/CeO2_12.0
catalyst (Figure 49). Notice that, exceptionally, the three particles with
diameter higher than 2 nm were not used to obtain this mean value.
In conclusion, it was experimentally verified that the Au particle size increases
with the decrease of the support surface area which is in accordance with
literature[13, 14].
Figure 50. Dependence of the mean Au particle diameter with the support surface area using a nominal Au loading of 3 wt%.
Figure 50 shows how the particle size varies with the selected support using a
nominal Au loading of 3 wt%. The Au(3wt%)/CeO2 and Au(3wt%)/MWCNTs
catalysts present a very similar Au mean particle size. This indicates that, even
though the surface area of CeO2 is approximately five times lower than the one
of MWCNTs, up to 3 wt% of nominal loading although with a lower interparticle
distance only Au clusters can still be obtained.
2 72 322 372 422 472 522 572 6222
3
4
5
6
7
8
9
:
;
"
"
Ogcp"rctvkeng"fkcogvgt"*po
+
Uwthceg"ctgc"*o 41i+

CHAPTER 3: IN-SITU SYNTHESIS OF GOLD CLUSTERS AND CATALYTIC ACTIVITY STUDY
123
This study leads us to conclude that; lower gold loading in a high support
surface area catalysts are preferable to avoid sinter of the Au and a faster
deactivation.
These observations demonstrate that besides the importance of the use of
stabiliser agents like sodium citrate or the presence of amine groups on the
support surface it is also essential to select a high quality support. Depending
on the synthesis methodology, the same material can have different surface
areas. When a homogenous distribution of gold clusters is pretended, this
factor is very important, requiring high surface areas to achieve this goal.
Additionally, the absence of gold clusters concluded by HRTEM characterisation
on both MWCNTs and CeO2 surfaces when using very low gold contents (< 0.5
wt%) led to a deep characterisation of these catalysts. Au/MWCNTs catalysts
with a low gold content (0.1 wt%, 0.3 wt% and 0.5 wt%) were characterised by
aberration-corrected HRTEM and XAS (Section 3.4).
3.3.3 STABILITY
The variation of the particle size with time was also investigated, in order to
assess its stability. Gold clusters with 6 wt% nominal reduced gold content
were characterised after being 30 minutes, 2 days and 13 days in the
Au/MWCNTs suspension (Figure 51). Figure 52 shows the mean Au size
diameter based on HRTEM observations. The mean size after 30 minutes, was
around 1.2 nm and remained constant with time (Table 16). This result
suggests that, after 30 minutes of reaction, the gold precursor is already
depleted and the clusters cannot continue growing. Importantly, the resulting
gold clusters are stable and do not coalesce and sinter. The stability of the
clusters attached to the MWCNTs-PAH hybrids is a fundamental condition for
the use of these materials for applications such as catalysis.
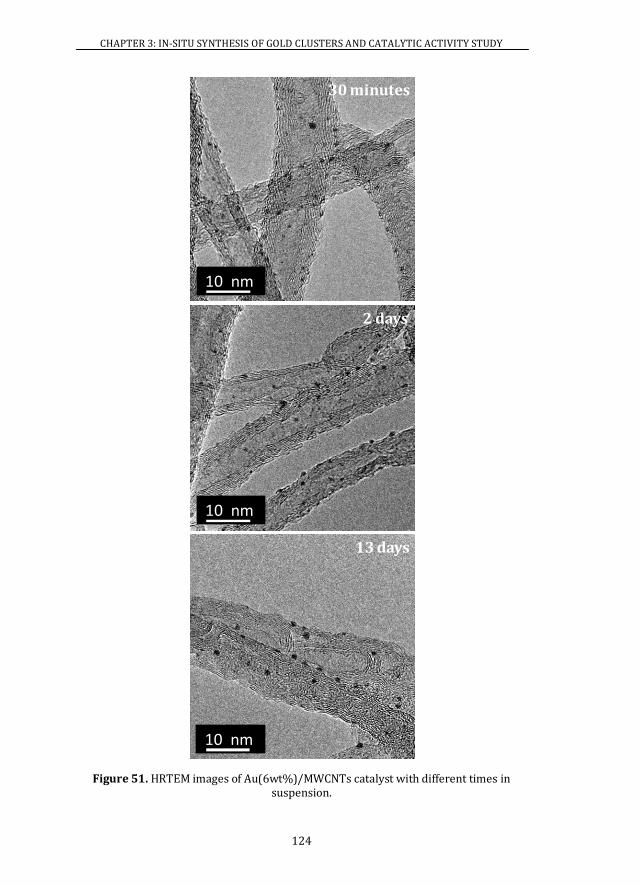
CHAPTER 3: IN-SITU SYNTHESIS OF GOLD CLUSTERS AND CATALYTIC ACTIVITY STUDY
124
Figure 51. HRTEM images of Au(6wt%)/MWCNTs catalyst with different times in suspension.
10 nm
30 minutes
2 days
10 nm
13 days
10 nm

CHAPTER 3: IN-SITU SYNTHESIS OF GOLD CLUSTERS AND CATALYTIC ACTIVITY STUDY
125
Figure 52. Dependence of the mean Au particle diameter of a Au(6wt%)/MWCNTs catalyst with time.
Table 16. Mean Au particle diameter of a Au(6wt%)/CeO2 catalyst for different times in suspension.
Time Particle diameter (nm)
30 minutes 1.2±0.3
2 days 1.1±0.3
13 days 1.3±0.3
Even though it is not shown here, months after the date of preparation several
catalysts were sent to several different places to be tested in reactions. It was
observed that the activity of these catalysts was similar to fresh prepared
catalysts. This corroborates that the catalysts synthesised by this in-situ
protocol are stable. Indeed, if they grow this would happen during the next 13
days. After this time, they would not sinter, indicating then its stability.
52""o kpwvgu 5"fc{ u 35"fc { u207
302
307
402
"
"
Ogcp"rctvkeng"fkcogvgt"*po
+
Vkog
CHAPTER 3: IN-SITU SYNTHESIS OF GOLD CLUSTERS AND CATALYTIC ACTIVITY STUDY
126
3.3.4 SYNTHESIS TEMPERATURE
Finally, the synthetic temperature was changed to investigate the effect of this
variable on the mean gold nanocluster size distribution. The synthesis of a
Au(6wt%)/MWCNTs catalyst was carried out at room temperature, 50 ºC, 70 ºC
and 90 ºC. There were no significant differences between the reactions
performed at room temperature, 50 ºC or 70 ºC. Nevertheless, the synthesis
performed at 90 ºC showed few gold nanoclusters at the surface of the
MWCNTs and a significant amount of nanoparticles larger than 10 nm appeared
(Figure 53 and Figure 54) leading to a mean particle diameter of 10±9 nm
(Table 17). This indicates that, at this temperature, the nucleation does not
occur preferentially at the amine groups of the MWCNT-PAH hybrids. This
result is in accordance to literature. By the Turkevich method, Au nanoparticles
around 15 nm are obtained at high temperatures (~ 90 ºC – ~ 100 ºC)[19-21].
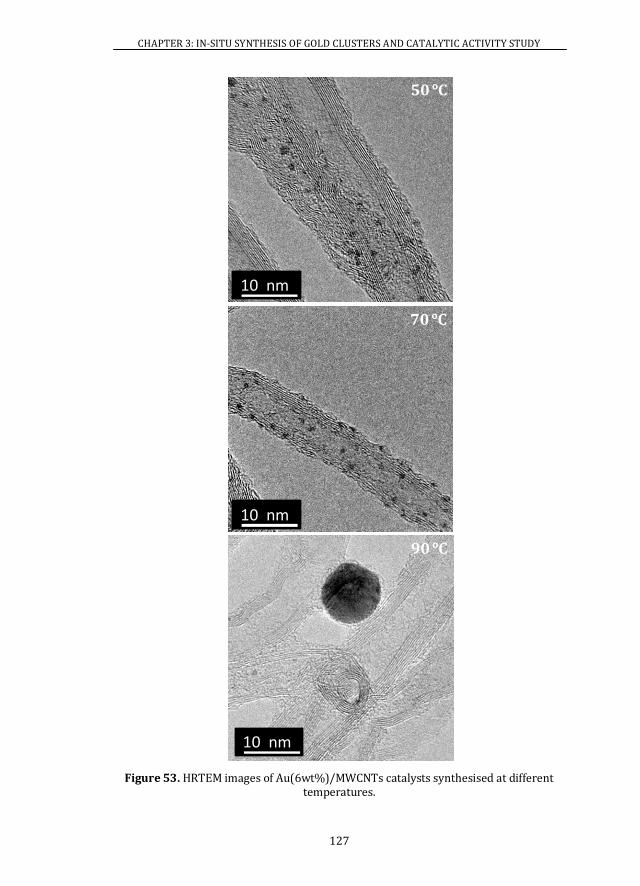
CHAPTER 3: IN-SITU SYNTHESIS OF GOLD CLUSTERS AND CATALYTIC ACTIVITY STUDY
127
Figure 53. HRTEM images of Au(6wt%)/MWCNTs catalysts synthesised at different temperatures.
10 nm
50 ºC
70 ºC
10 nm
90 ºC
10 nm
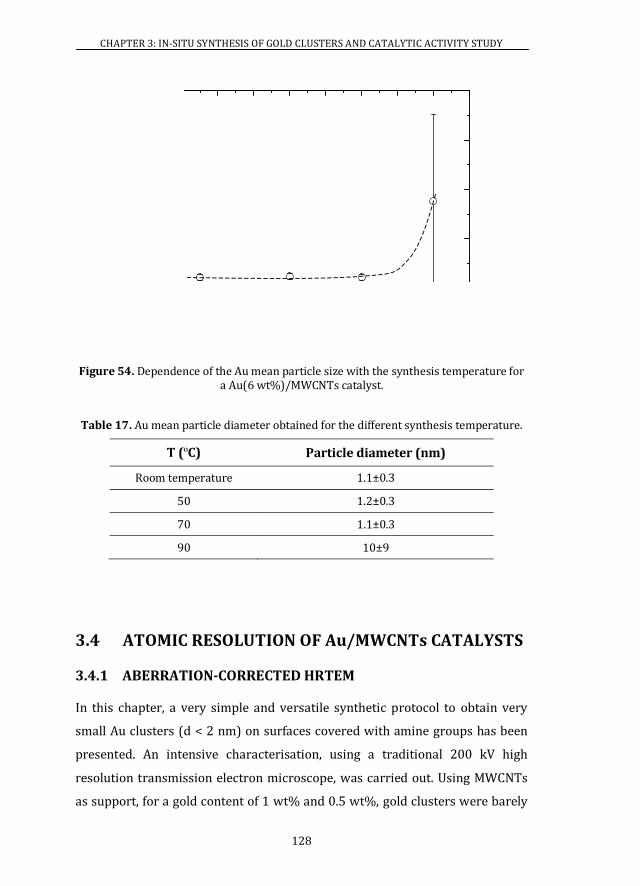
CHAPTER 3: IN-SITU SYNTHESIS OF GOLD CLUSTERS AND CATALYTIC ACTIVITY STUDY
128
Figure 54. Dependence of the Au mean particle size with the synthesis temperature for a Au(6 wt%)/MWCNTs catalyst.
Table 17. Au mean particle diameter obtained for the different synthesis temperature.
T (ºC) Particle diameter (nm)
Room temperature 1.1±0.3
50 1.2±0.3
70 1.1±0.3
90 10±9
3.4 ATOMIC RESOLUTION OF Au/MWCNTs CATALYSTS
3.4.1 ABERRATION-CORRECTED HRTEM
In this chapter, a very simple and versatile synthetic protocol to obtain very
small Au clusters (d < 2 nm) on surfaces covered with amine groups has been
presented. An intensive characterisation, using a traditional 200 kV high
resolution transmission electron microscope, was carried out. Using MWCNTs
as support, for a gold content of 1 wt% and 0.5 wt%, gold clusters were barely
42 52 62 72 82 92 :2 ;2 322
2
7
32
37
42
"
"
Ogcp"rctvkeng"fkcogvgt"*p
o+
V"*¼E+
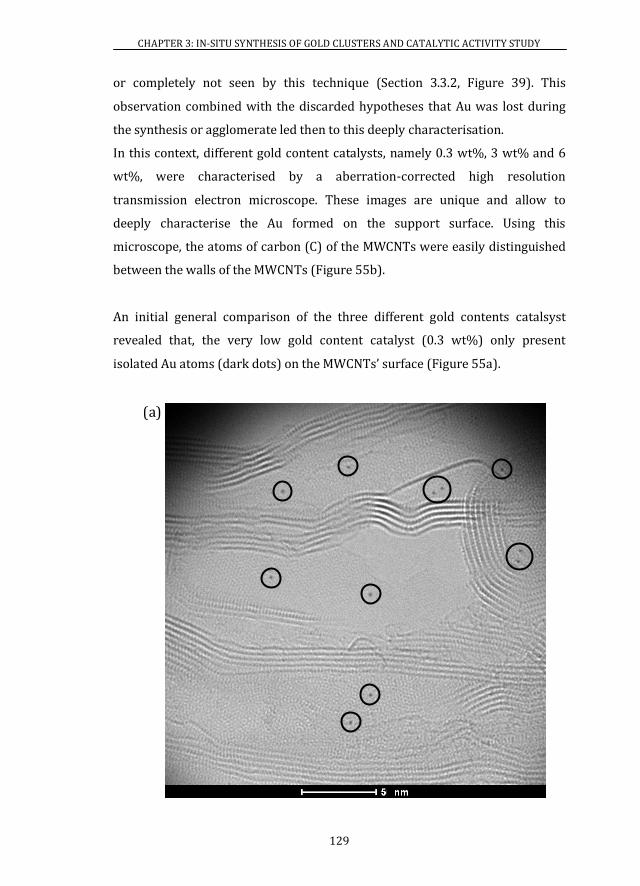
CHAPTER 3: IN-SITU SYNTHESIS OF GOLD CLUSTERS AND CATALYTIC ACTIVITY STUDY
129
or completely not seen by this technique (Section 3.3.2, Figure 39). This
observation combined with the discarded hypotheses that Au was lost during
the synthesis or agglomerate led then to this deeply characterisation.
In this context, different gold content catalysts, namely 0.3 wt%, 3 wt% and 6
wt%, were characterised by a aberration-corrected high resolution
transmission electron microscope. These images are unique and allow to
deeply characterise the Au formed on the support surface. Using this
microscope, the atoms of carbon (C) of the MWCNTs were easily distinguished
between the walls of the MWCNTs (Figure 55b).
An initial general comparison of the three different gold contents catalsyst
revealed that, the very low gold content catalyst (0.3 wt%) only present
isolated Au atoms (dark dots) on the MWCNTs’ surface (Figure 55a).
(a)
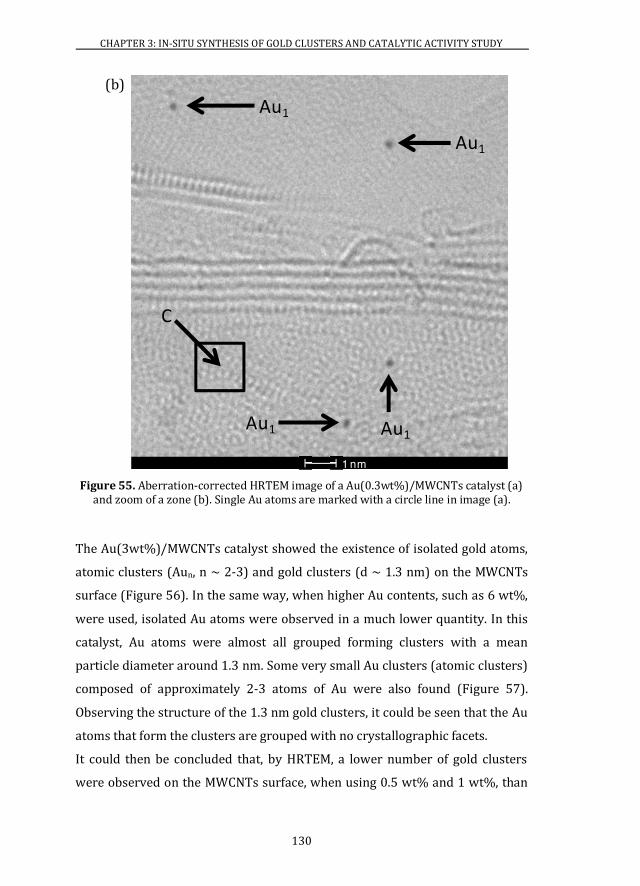
CHAPTER 3: IN-SITU SYNTHESIS OF GOLD CLUSTERS AND CATALYTIC ACTIVITY STUDY
130
Figure 55. Aberration-corrected HRTEM image of a Au(0.3wt%)/MWCNTs catalyst (a) and zoom of a zone (b). Single Au atoms are marked with a circle line in image (a).
The Au(3wt%)/MWCNTs catalyst showed the existence of isolated gold atoms,
atomic clusters (Aun, n ~ 2-3) and gold clusters (d ~ 1.3 nm) on the MWCNTs
surface (Figure 56). In the same way, when higher Au contents, such as 6 wt%,
were used, isolated Au atoms were observed in a much lower quantity. In this
catalyst, Au atoms were almost all grouped forming clusters with a mean
particle diameter around 1.3 nm. Some very small Au clusters (atomic clusters)
composed of approximately 2-3 atoms of Au were also found (Figure 57).
Observing the structure of the 1.3 nm gold clusters, it could be seen that the Au
atoms that form the clusters are grouped with no crystallographic facets.
It could then be concluded that, by HRTEM, a lower number of gold clusters
were observed on the MWCNTs surface, when using 0.5 wt% and 1 wt%, than
1 nm
Au1
Au1
Au1
Au1
C
(b)
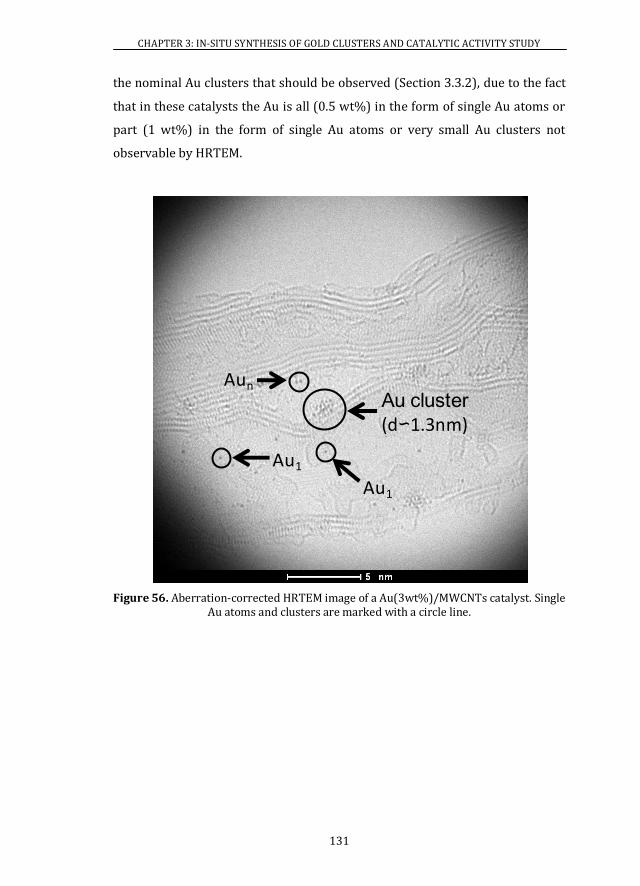
CHAPTER 3: IN-SITU SYNTHESIS OF GOLD CLUSTERS AND CATALYTIC ACTIVITY STUDY
131
the nominal Au clusters that should be observed (Section 3.3.2), due to the fact
that in these catalysts the Au is all (0.5 wt%) in the form of single Au atoms or
part (1 wt%) in the form of single Au atoms or very small Au clusters not
observable by HRTEM.
Figure 56. Aberration-corrected HRTEM image of a Au(3wt%)/MWCNTs catalyst. Single Au atoms and clusters are marked with a circle line.
Au1
Au cluster
(d∽1.3nm)
Aun
Au1
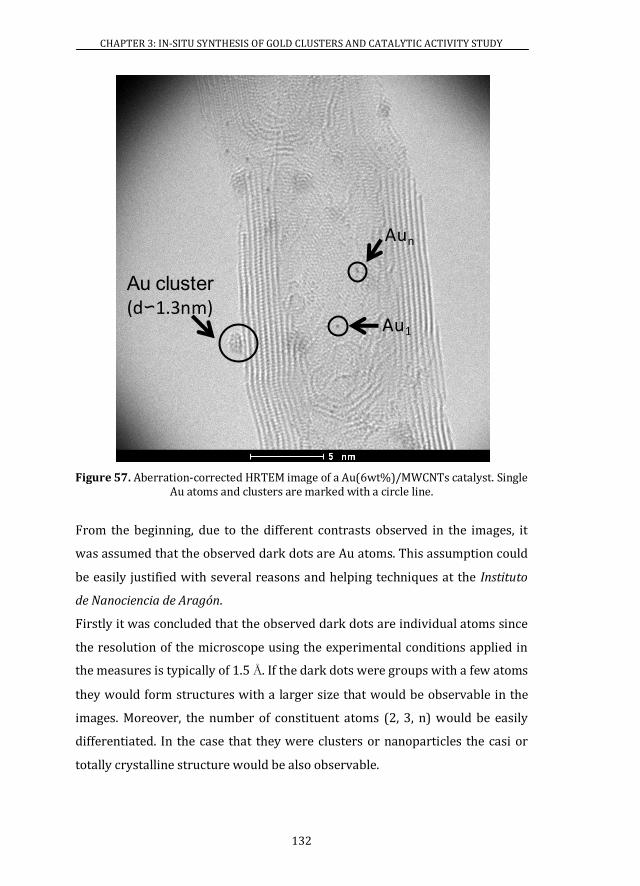
CHAPTER 3: IN-SITU SYNTHESIS OF GOLD CLUSTERS AND CATALYTIC ACTIVITY STUDY
132
Figure 57. Aberration-corrected HRTEM image of a Au(6wt%)/MWCNTs catalyst. Single Au atoms and clusters are marked with a circle line.
From the beginning, due to the different contrasts observed in the images, it
was assumed that the observed dark dots are Au atoms. This assumption could
be easily justified with several reasons and helping techniques at the Instituto
de Nanociencia de Aragón.
Firstly it was concluded that the observed dark dots are individual atoms since
the resolution of the microscope using the experimental conditions applied in
the measures is typically of 1.5 Å. If the dark dots were groups with a few atoms
they would form structures with a larger size that would be observable in the
images. Moreover, the number of constituent atoms (2, 3, n) would be easily
differentiated. In the case that they were clusters or nanoparticles the casi or
totally crystalline structure would be also observable.
Au cluster
(d∽1.3nm)Au1
Aun

CHAPTER 3: IN-SITU SYNTHESIS OF GOLD CLUSTERS AND CATALYTIC ACTIVITY STUDY
133
Besides, the integrated high angle annular dark field (HADDF) intensity of a
same element is directly related to the thickness[22]. The integrated HADDF
intensity increases with the number of atoms of the cluster[22]. In the institute
they can compare profiles of intensity of individual atoms and clusters with a
maximum high of about 3 atoms and observe how the signal is related (Figure
58).
Figure 58. HADDF-STEM images of a Au(3wt%)/MWCNTs catalyst where Au clusters (1) and single Au atoms (2) coexist.
Figure 59. Comparison of the intensities profiles of a Au cluster (—) and a Au atom (—).
2 n m 2 n m
1
2
0.0 0.5 1.0 1.520000
25000
30000
35000
40000
45000
HAD
DF
inte
nsity
(a.u
.)
Cluster size (nm)

CHAPTER 3: IN-SITU SYNTHESIS OF GOLD CLUSTERS AND CATALYTIC ACTIVITY STUDY
134
Taking into account the effect that the “background”, i.e. the effect that the
support (MWCNTs) can have in the total intensity, they observed similar
intensity profiles of an Au cluster and an individual atom (Figure 59). The
individual Au atom profile showed a lower HADDF intensity area. Thus, they
concluded that the bright spots were an individual atom of the same material as
the cluster.
Additionally, it was concluded that these individual atoms are heavier than
carbon. This conclusion was clearly observed by HRTEM but it was much more
obvious in Scanning Transmission Electron Microscopy (STEM) which gives the
Z contrast. The intensity is proportional to the atomic number raised to a
exponent than can vary typically between 1.4 and 1.6. This implies that the
atomic number of the individual atoms is much higher than the one from
carbon since the intensity in the image that the nanotube produces (a system of
carbon with a finite thickness, i.e. with a thickness of several atoms dispersing
and contributing to the intensity in the image in each point of the sample) is
much lower than the intensity produced for each one of the individual atoms
that are observed[23].
Besides, it is not reasonable to think that these individual atoms are not gold
since during the synthesis process the unique heavy material used was gold and
the rest of components were organic composed by light atoms that would give a
negligible contrast if they adopted the form of individual atoms or small
molecules.
Finally, it could be affirmed that no sputtering phenomenon was produced that
could lead to the presence of these gold atoms in the MWCNTs surface (for
example, for sputtering of the clusters and nanoparticles). The working voltage
(60 kV - 80 kV) was much lower than the one of knock on damage or of
sputtering for gold[24]. If those atoms were on the MWCNTs’ surface from a
sputtering phenomena inside the microscope between electrons of the beam
and the material (the carbon of the nanotube or the gold), a dynamic process in
each would be seen the atoms appearing when depositing in the place observed
after being “sputtered” in other part would be observed. This did not happened
CHAPTER 3: IN-SITU SYNTHESIS OF GOLD CLUSTERS AND CATALYTIC ACTIVITY STUDY
135
once the atoms were on the MWCNTs surface since the first moment of the
observation completely discarding the hypothesis of sputtering.
Lastly, the mobility of the Au atoms was observed. Figure 60 shows a sequence
of a video obtained by this microscope where the mobility of both single gold
atoms and the atoms that form the clusters was clearly seen. It could be
concluded that the mobility observed in the conditions of temperature and
pressure of the aberration-corrected microscope and under a voltage electron
beam of 80 kV was not significant. The sinter of single Au atoms into clusters
did not occur. The mobility was more at the level of a same gold cluster that
regrouped in a different way. Thus, this result reaffirmed that these in-situ
catalysts are stable at room temperature.

CHAPTER 3: IN-SITU SYNTHESIS OF GOLD CLUSTERS AND CATALYTIC ACTIVITY STUDY
136
t = 0 s t = 0.3 s
Au cluster
Au1
Au cluster
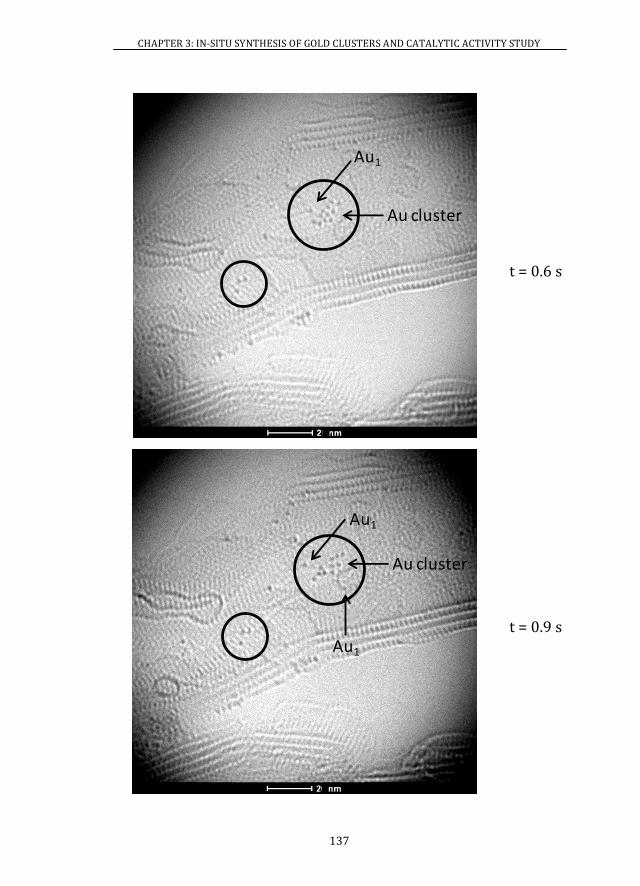
CHAPTER 3: IN-SITU SYNTHESIS OF GOLD CLUSTERS AND CATALYTIC ACTIVITY STUDY
137
t = 0.6 s t = 0.9 s
Au1
Au cluster
Au cluster
Au1
Au1
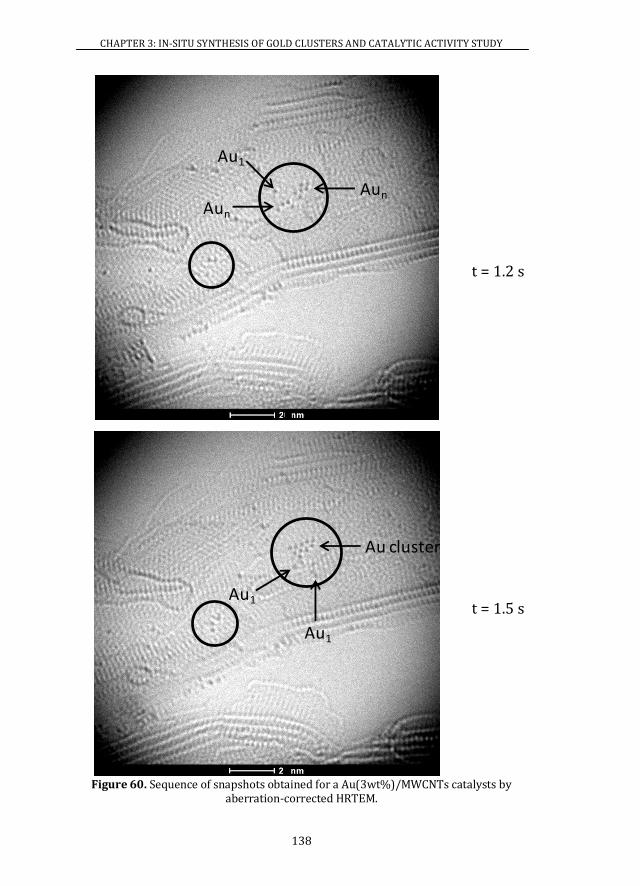
CHAPTER 3: IN-SITU SYNTHESIS OF GOLD CLUSTERS AND CATALYTIC ACTIVITY STUDY
138
t = 1.2 s t = 1.5 s
Figure 60. Sequence of snapshots obtained for a Au(3wt%)/MWCNTs catalysts by aberration-corrected HRTEM.
Aun
Aun
Au1
Au cluster
Au1
Au1

CHAPTER 3: IN-SITU SYNTHESIS OF GOLD CLUSTERS AND CATALYTIC ACTIVITY STUDY
139
Combining HRTEM and aberration-corrected HRTEM observations, it seems
that, when using nominal reduced gold contents, lower or equal to 0.5 wt%, a
unique population of isolated gold atoms is obtained on the MWCNTs’ surface.
This result is extremely important and innovative because the synthesis of only
single Au atoms is to date very little reported (Chapter 1, Section 1.4).
Moreover, aberration-corrected HRTEM images revealed the coexistence of
both populations of single gold atoms and gold clusters in the
Au(3wt%)/MWCNTs and Au(6wt%)/MWCNTs catalysts.
3.4.2 XAS
The chemical nature of the Au of the very low gold content Au/MWCNTs
catalysts was investigated by X-ray Absorption spectroscopy (XAS).
Au/MWCNTs’ catalysts with a gold content of 0.1 wt% and 0.5 wt% were
analysed by this technique. The FT of the Extended X-ray Absorption Fine
Structure (EXAFS) spectrum or the basic X-ray Absorption Near Edge Structure
(XANES) spectrum from these catalysts and the Au foil are shown in Figure 61a
and Figure 61b respectively. It was observed that both Au(0.1wt%)/MWCNTs
and Au(0.5wt%)/MWCNTs catalysts present a peak at 1.7 Å (Figure 61a) that is
attributed to Au atoms directly attached to citrate ligands or oxygen atoms
(neighbour atoms with a low molecular weight). Moreover, the characteristic
peaks of the Au-Au bonds of the Au foil located between 2 Å and 3 Å were not
observed in these catalysts, which indicates the existence of only single Au
atoms on the MWCNTs’ surface (Figure 61a). This result is in accordance with
the aberration-corrected HRTEM observations.
Although the data quality of EXAFS analysis is not enough for a quantitative
analysis and, in this way, it is not possible to distinguish between the
coexistence of Au atoms and very small clusters, it is believed, for the all the
evidences presented, that, at least up to a nominal Au content of 0.5 wt%,
Au/MWCNTs catalysts only present single Au atoms on the MWCNTs’ surface.

CHAPTER 3: IN-SITU SYNTHESIS OF GOLD CLUSTERS AND CATALYTIC ACTIVITY STUDY
140
Figure 61. EXAFS FT (a) and XANES absorption spectrum (b) of Au foil (—), Au(0.1wt%)/MWCNTs (—) and Au(0.5wt%)/MWCNTs (—) catalysts. L: ligand.
Furthermore, the XANES absorption spectrum of the both low gold content
catalysts is different from the one of Au foil (Figure 61b) and similar to the one
of AuI reference, [(PPh3)AuCH3], (Figure 62). This result corroborates once
again the existence of only single Au atoms (Auδ+) on the MWCNTs’ surface
when gold contents lower than 0.5 wt% are used.
Figure 62. XANES absorption spectrum of (PPh3)AuCH3 (—), Au(0.1wt%)/MWCNTs (—) and Au(0.5wt%)/MWCNTs (—) catalysts.
0 2 4 6 80.0
0.2
0.4
0.6
0.8
1.0
FT(k
2 ·(k
))
R (A)11850 11900 11950 12000 12050 12100
0.0
0.3
0.6
0.9
1.2
1.5
Nor
mal
ized
abs
orpt
ion
(a.u
.)
Energy (eV)o
(a) (b)
Norm
alis
ed
Au-Au
Au-Au
Au-L
11850 11900 11950 12000 12050 12100
0.0
0.3
0.6
0.9
1.2
1.5
Energy (eV)
Nor
mal
ized
abs
orpt
ion
(a.u
.)No
rmal
ised

CHAPTER 3: IN-SITU SYNTHESIS OF GOLD CLUSTERS AND CATALYTIC ACTIVITY STUDY
141
In this Chapter, the possibility of obtaining single Au atoms on the MWCNTs’
surface by the in-situ synthesis method was demonstrated. Even though this
result was not investigated using other materials as support, such as TiO2 and
CeO2, it is believed that isolated Au atoms can also be obtained on these
supports. For a successful achievement of this result it is necessary to take into
account the quality of the support, i.e. the support surface area, as it was
discussed in this chapter (Section 3.3.2). In this context, since the surface area
of both CeO2 and TiO2 is much lower than the MWCNTs, a gold content
mandatorily lower than 0.5 wt% must be used in order to obtain only isolated
Au atoms on their surfaces.
3.5 X-RAY PHOTOELECTRON SPECTROSCOPY
The chemical nature of the synthesised Au clusters was investigated by XPS.
This revealed that the state of oxidation of Au when supported on MWCNTs
varies with the particle size. Indeed, for the Au 4f7/2 a binding energy (BE)
increase of ~ 2 eV relative to the bulk value of 84.0 eV was observed by our
group when the gold particle size decreases to 1.1 nm[4]. This result indicates
that the Au clusters are positively charged. This positive charge is related to the
fact that oxygen species are bonded to the Au surface. In the work published by
our group in 2011, it was also demonstrated that these oxygen species are able
to oxidise CO and be regenerated by molecular oxygen on the Au clusters
surface[4].
Additionally, a correlation between the BE and the oxidation state of gold was
defined. BEs values of 84.0, 84.6-85.1 and 85.9-86.3 eV have been associated to
Au0, Au+ and Au3+ species respectively[4].
Nevertheless, in literature there is a strong discussion about whether the
observed BE shifts result from the size effect by small Au clusters or from the
oxidation state of the Au clusters. It is affirmed that the shift to higher binding
energies observed with adsorbed small metal particles on a metal oxide

CHAPTER 3: IN-SITU SYNTHESIS OF GOLD CLUSTERS AND CATALYTIC ACTIVITY STUDY
142
support can result from final state effects, i.e. reduced screening of the core hole
leading to the decrease of the kinetic energy of the ejected electrons[25]. In this
context, and in order to eliminate these possible contributions, the Au auger
parameter (α ) was determined according to the Equation 14[25].
)()( / 67675274 NNMAuKEfAuBE KEBEα (14)
where,
)( /274 fAuBE – binding energy of the Au 4f7/2 electrons.
)( 67675 NNMAuKE – kinetic energy of the Au M5N67N67 auger electrons.
The Auger parameter value is independent of substrate charging and is a
sensitive probe of the physical and chemical environment of the analysed
atoms. How this value varies with the particle size is complex and takes into
account both initial and final state influences[26].
By the Au auger parameters values obtained, it was demonstrated that the Au
in the MWCNTs catalysts with a particle size between 0.9 nm and 1.5 nm is
positively charged (Auδ+)[4]. When the particle diameter was larger than 4 nm
“bulklike” gold species were observed[4].
Further XPS’ analysis of the Au/MWCNTs, Au/TiO2 and Au/CeO2 catalysts were
carried out (Table 18). For these, the Au auger parameter was not determined,
since it had already been demonstrated that the BE shifts observed are due to
the oxidation state of the Au clusters[4]. The particle diameter presented in
Table 18 was determined by HRTEM (Section 3.3). For all the evidences
discussed it is believed that the Au(0.5wt%)/MWCNTs catalyst is composed by
only single Au atoms (At.).

CHAPTER 3: IN-SITU SYNTHESIS OF GOLD CLUSTERS AND CATALYTIC ACTIVITY STUDY
143
Table 18. XPS data for different Au content Au/MWCNTs, Au/CeO2 and Au/TiO2 catalysts.
Au content (wt%) 0.5 1 3
Au/MWCNTs d (nm) At. n.a. 1.1±0.3
Au 4f7/2 BE (eV) 85.8 85.5 85.5
Au/CeO2 d (nm) - 1.3±0.6 1.2±0.6
Au 4f7/2 BE (eV) - 84.2/85.7
(Au0/Auδ+ =2) 84.1/85.6
(Au0/Auδ+=2)
Au/TiO2 d (nm) - 1.1±0.5 4.6±3.4
Au 4f7/2 BE (eV) - 84.2/85.7
(Au0/Auδ+ =2) 84.2/85.8
(Au0/Auδ+ =4) n.a. – not available data.
Figure 63. XPS spectra of the Au4f peak and respective fit components for gold clusters
obtained at different nominal gold loadings on MWCNTs.
In what concerns Au/MWCNTs catalysts, for both Au(3wt%)/MWCNTs and
Au(1wt%)/MWCNTs catalysts, a BE value of 85.5 eV was obtained which
reveals that Au is positively charged (Figure 63). Lowering the nominal Au
content to 0.5 wt%, the presence of only cationic Au species was also observed
(BE = 85.8 eV, Figure 63). These results revealed that, in the range of 0.5 wt%
;6 ;4 ;2 :: :8 :6 :4 :2
3:22
4922
5822
Au4f5/2
Au4f7/2
1 wt%
3 wt%
0.5 wt%
"
ERU
Dkpfkpi"gpgti{ "*gX+
3622
4322
4:22
"""
3722
3:22
4322
"
""
"

CHAPTER 3: IN-SITU SYNTHESIS OF GOLD CLUSTERS AND CATALYTIC ACTIVITY STUDY
144
to 3 wt%, gold is either in the form of clusters, where the Au of the surface is
bonded to oxygen species, or simply in the form of single Au atoms (Auδ+).
Moreover, comparing these results with the XAS obtained data (Section 3.4.2),
coherence was found. Both characterisation techniques showed that in the
Au(0.5wt%)/MWCNTs catalyst Au is positively charged (Auδ+).
Furthermore, when using CeO2 as support, it was observed that the
Au(1wt%)/CeO2 catalyst presents two types of gold. Both metallic (Au0, 84.2
eV) and positively charged gold (Auδ+, 85.7 eV) coexist in this catalyst (Figure
64). The same result was obtained for the Au(1wt%)/TiO2 catalyst; two
components (metallic and positively charged) were also observed. For this
catalyst, the Au 4f7/2 BEs were also located at 84.2 eV and 85.7 eV (Figure 65).
The Au0/Auδ+ concentration ratio of both catalysts is approximately 2.
In the same way, the higher gold content catalysts – Au(3wt%)/CeO2 and
Au(3wt%)/TiO2 – are also composed by both metallic and cationic gold. In the
Au(3wt%)/CeO2 catalyst, Au 4f7/2 BEs are located at 84.1 eV and 85.6 eV
(Figure 64). Similar to the Au(1wt%)/CeO2 catalyst, the Au(3wt%)/CeO2
catalyst presents a Au0/Auδ+ concentration ratio of approximately 2. The
Au(3wt%)/TiO2 catalyst presents the Au 4f7/2 BEs at 84.2 eV and 85.8 eV
(Figure 65). An increase of the Au0/Auδ+ concentration ratio from around 2 to 4
was observed when comparing Au(1wt%)/TiO2 and Au(3wt%)/TiO2 catalysts.
These results are in accordance with HRTEM observations (Section 3.1 and
3.3.2). In the case of the CeO2 catalysts, for both gold contents (1 wt% and 3
wt%), only clusters were observed on the support surface (Figure 33 and
Figure 41). Thus, the quantity of metallic and cationic gold was not altered.
Nevertheless, in the case of TiO2 catalysts, a significant increase of the mean Au
particle size was verified for the Au(3wt%)/TiO2 catalyst due to the coexistence
of Au nanoparticles with Au clusters in this catalyst (Figure 43). The existence
of large Au nanoparticles in this catalyst, unlike in the Au(1wt%)/TiO2 where
only gold clusters were formed (Figure 43), led then to an increase of double of
the Au0/Auδ+ concentration ratio.

CHAPTER 3: IN-SITU SYNTHESIS OF GOLD CLUSTERS AND CATALYTIC ACTIVITY STUDY
145
By these measures, it was also concluded that, even though the clusters formed
on the CeO2 surface using gold contents of 1 wt% and 3 wt% have diameters
similar to those formed on the MWCNTs surface, not all were oxidised.
Figure 64. XPS spectra of the Au4f peak and respective fit components for gold clusters obtained at different nominal gold loadings on CeO2.
Figure 65. XPS spectra of the Au4f peak and respective fit components for gold clusters obtained at different nominal gold loadings on TiO2.
;6 ;4 ;2 :: :8 :6 :4 :2
8222
9222
:222
;2223 wt%
1 wt%
"
ERU
Dkpfkpi"Gpgti{ "*gX+
8222
9222
:222
;222
"
Au4f5/2
Au4f7/2
"
""
;6 ;4 ;2 :: :8 :6 :4 :2
9722
;222
32722
34222
" "
Dkpfkpi"Gpgti { "*gX+
9722
;222
32722
34222
"
Au4f5/2
Au4f7/2
"
"
3 wt%ERU
1 wt%
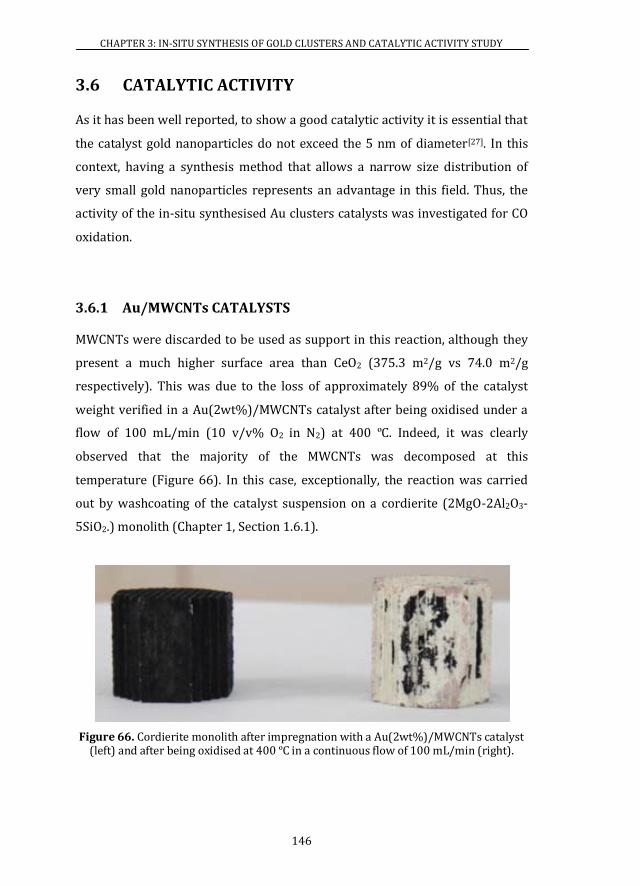
CHAPTER 3: IN-SITU SYNTHESIS OF GOLD CLUSTERS AND CATALYTIC ACTIVITY STUDY
146
3.6 CATALYTIC ACTIVITY
As it has been well reported, to show a good catalytic activity it is essential that
the catalyst gold nanoparticles do not exceed the 5 nm of diameter[27]. In this
context, having a synthesis method that allows a narrow size distribution of
very small gold nanoparticles represents an advantage in this field. Thus, the
activity of the in-situ synthesised Au clusters catalysts was investigated for CO
oxidation.
3.6.1 Au/MWCNTs CATALYSTS
MWCNTs were discarded to be used as support in this reaction, although they
present a much higher surface area than CeO2 (375.3 m2/g vs 74.0 m2/g
respectively). This was due to the loss of approximately 89% of the catalyst
weight verified in a Au(2wt%)/MWCNTs catalyst after being oxidised under a
flow of 100 mL/min (10 v/v% O2 in N2) at 400 ºC. Indeed, it was clearly
observed that the majority of the MWCNTs was decomposed at this
temperature (Figure 66). In this case, exceptionally, the reaction was carried
out by washcoating of the catalyst suspension on a cordierite (2MgO-2Al2O3-
5SiO2.) monolith (Chapter 1, Section 1.6.1).
Figure 66. Cordierite monolith after impregnation with a Au(2wt%)/MWCNTs catalyst (left) and after being oxidised at 400 ºC in a continuous flow of 100 mL/min (right).

CHAPTER 3: IN-SITU SYNTHESIS OF GOLD CLUSTERS AND CATALYTIC ACTIVITY STUDY
147
Unlike it was observed, carbon nanotubes are known for its high thermal
stability. A TGA analysis of pure MWCNTs revealed that these are not
decomposed up to a temperature of 490 ºC (Figure 67). By TGA a unique weight
loss of approximately 90% between 490 ºC and 600 ºC was observed. In this
way, the fact of having observed a weight loss of 89% at 400 ºC on the
Au(2wt%)/MWCNTs catalyst led us to think that the presence of Au might be
responsible for accelerating the decomposition of the MWCNTs. In this context,
a study about the effect of Au in the MWCNTs and other carbonaceous materials
oxidation temperature was carried out. These results are presented in Chapter
5.
Figure 67. TGA curve of bare MWCNTs. Atmosphere: air.
3.6.2 Au/CeO2 CATALYSTS
The catalytic activity of the in-situ synthesised Au catalysts was investigated
using CeO2 as support. CeO2 is preferable for this reaction due to its capacity for
releasing oxygen under reaction conditions’ which result from the high mobility
of the oxygen vacancies in the solid (Chapter 1, Section 1.5).
2 422 622 822 :22 3222
232425262728292:2;2322
"
"
Ygkijv"*’+
V"*¼E+

CHAPTER 3: IN-SITU SYNTHESIS OF GOLD CLUSTERS AND CATALYTIC ACTIVITY STUDY
148
In order to compare the catalytic activity of the different sized Au/CeO2
clusters, catalysts with a gold content of 0.1 wt%, 0.5 wt% and 3 wt% were
prepared in the powder form. The conditions used to carry out this reaction,
the experimental protocol followed and the equations used to determine the
catalytic activity in terms of reaction rate are detailed described in Annexes
(Section A.2).
When comparing the conversion of the Au(0.1wt%)/CeO2 catalyst and the
support used to synthesise it, CeO2, it was observed that these are similar and
both are able to convert the same quantity of CO at 400 ºC (Figure 68). This Au
inactivity can be explained by the fact that its active sites might be covered by
PAH and by intermediate products formed during the citrate ions and 4AuCl
reaction. A mechanism of reaction to obtain Au nanoparticles by citrate
reduction was proposed by Romero et al.[21]. According to this mechanism,
dicarboxyacetone – (COO-)(CH2)CO(CH2)(COO-) – will be formed from the
oxidation of the citrate ion[20, 28]. Thus these species may probably cover both
Au and CeO2 active sites inhibiting the catalytic activity. In this way, when
increasing the Au loading, since a higher quantity of sodium citrate is used, the
surface of the higher Au loading catalysts will be more covered and therefore a
lower conversion than bare CeO2 was observed (Figure 68).
It was then concluded that the activity of these Au catalysts could not be
measured because even after calcination, the catalysts surface was covered by
species formed during the synthesis reaction.

CHAPTER 3: IN-SITU SYNTHESIS OF GOLD CLUSTERS AND CATALYTIC ACTIVITY STUDY
149
Figure 68. Comparison of the CO conversion of the CeO2 ( ), Au(0.1wt%)/CeO2 ( ) and Au(3wt%)/CeO2 ( ) catalysts. Flow rate: 50 mL/min (96 v/v% N2; 2
v/v% O2; 2 v/v% CO).
Figure 69. Catalytic activity of the Au(0.1wt%)/CeO2 ( ), Au(0.5wt%)/CeO2 ( ) and Au(3wt%)/CeO2 ( ) catalysts for CO oxidation (1st cycle). Flow rate: 50 mL/min
(96 v/v% N2; 2 v/v% O2; 2 v/v% CO).
Figure 69 shows the catalytic activity obtained for the three catalysts. The same
result was observed, i.e. a significant decrease of the catalytic activity was
observed when increasing the Au loading. This results from the fact that the
2 322 422 522 622 722 822
2
42
62
82
:2
322
"
"
EQ"eqpxgtukqp"*’+
V"*¼E+
2 322 422 522 622 722 822
202
402z32 /8
602z32 /8
802z32 /8
:02z 32 /8
302z32 /7
304z32 /7
306z32 /7
"
"
Tgcevkqp"tcvg"*o
qn0u/30o
Cw/4+
V"*¼E+

CHAPTER 3: IN-SITU SYNTHESIS OF GOLD CLUSTERS AND CATALYTIC ACTIVITY STUDY
150
quantity of sodium citrate used increases with the Au loading. Thus, in the
higher Au loading catalysts more intermediate species resultant from the
4AuCl and citrate ion reaction will be formed covering a higher quantity of
catalytic active sites.
Furthermore, there was a decrease of activity for both catalysts in the second
cycle (Figure 70).
Figure 70. Catalytic activity of the Au(0.1wt%)/CeO2 ( ), Au(0.5wt%)/CeO2 ( ) and Au(3wt%)/CeO2 ( ) catalysts for CO oxidation (2nd cycle). Flow rate: 50 mL/min
(96 v/v% N2; 2 v/v% O2; 2 v/v% CO).
SEM characterisation, after both reaction cycles, revealed that the lowest gold
content catalyst (0.1 wt%) did not show Au agglomeration (Figure 71).
Nevertheless, the lower activity in the second cycle can be explained by the fact
that the CeO2 surface area after being at such high temperatures will decrease
due to the CeO2 nanoparticles sinter. Indeed, Lai et al. observed that the
increase of the calcination temperature leads to a significantly decrease of the
CeO2 surface area[6]. Using the same CeO2 they obtained a surface area of 65.5
m2/g, 60.7 m2/g and 29.1 m2/g after calcinations at 300 ºC, 500 ºC and 700 ºC
respectively[6]. The decrease of the CeO2 surface area leads then to a decrease of
0 50 100 150 200 250 300 350 400 450
0.0
2.0x10⁻⁶
4.0x10⁻⁶
6.0x10⁻⁶
8.0x10⁻⁶
1.0x10⁻⁵
Rea
ctio
n ra
te (m
ol.s
-1.m
Au-2)
T (ºC)

CHAPTER 3: IN-SITU SYNTHESIS OF GOLD CLUSTERS AND CATALYTIC ACTIVITY STUDY
151
the activity due to the lower number of oxygen vacancies available for
reaction[7, 13].
Figure 71. SEM images of the Au(0.1wt%)/CeO2 and the Au(3wt%)/CeO2 catalysts after CO oxidation.
0.1 wt%
100 nm
CeO2
3 wt%CeO2
Au
2
200 nm

CHAPTER 3: IN-SITU SYNTHESIS OF GOLD CLUSTERS AND CATALYTIC ACTIVITY STUDY
152
In addition, for the highest gold content catalyst (3 wt%), the sintering of the
Au clusters was observed after both cycles of CO oxidation, contributing also to
the decrease of activity obtained in the second cycle (Figure 71). SEM
characterisation also showed that, although some CeO2 was covered by large Au
nanoparticles in the Au(3wt%)/MWCNTs catalyst, the major part of the
support was still free to react. The observation then corroborates the
hypothesis that the lower conversion of this catalyst observed in the first cycle
when compared to bare CeO2 results from the cover of both CeO2 and Au active
catalytic sites.
Even though, in the Au(0.1wt%)/CeO2 catalyst, large Au agglomeration was not
observed the fact that the catalysts were strongly covered by agents impeding
the CO access to the active centers the study of these in-situ catalysts real
activity for CO oxidation was not possible. Thus, lamentably, the role of Auδ+ in
CO oxidation could not be concluded. Nevertheless, it could be concluded that
low gold content catalysts are preferable in order to avoid the gold sinter. In the
same way, unfortunately, the activity of the single Au atoms that can be easily
obtained by this synthesis method using very low gold contents (< 0.5 wt%)
could not be investigated for this reaction. The activity of these single Au atoms
has to date been subject to very little investigation due to the difficulty in
obtaining these species, stable without sinter. This is so, even though the
activity of single Au atoms in-situ synthesised catalysts can be investigated for
other reactions of interest using different mechanisms. Indeed, the ability to
produce H2 at room temperature by a photocatalytic process using in-situ
Au/TiO2 catalysts has been recently reported by our group[29]. In this work, the
high activity of the single Au atoms catalysts in comparison to Au clusters
catalysts is discussed.
Finally, the comparison of the experimentally obtained results and the ones
reported in literature revealed that the in-situ synthesised catalysts are
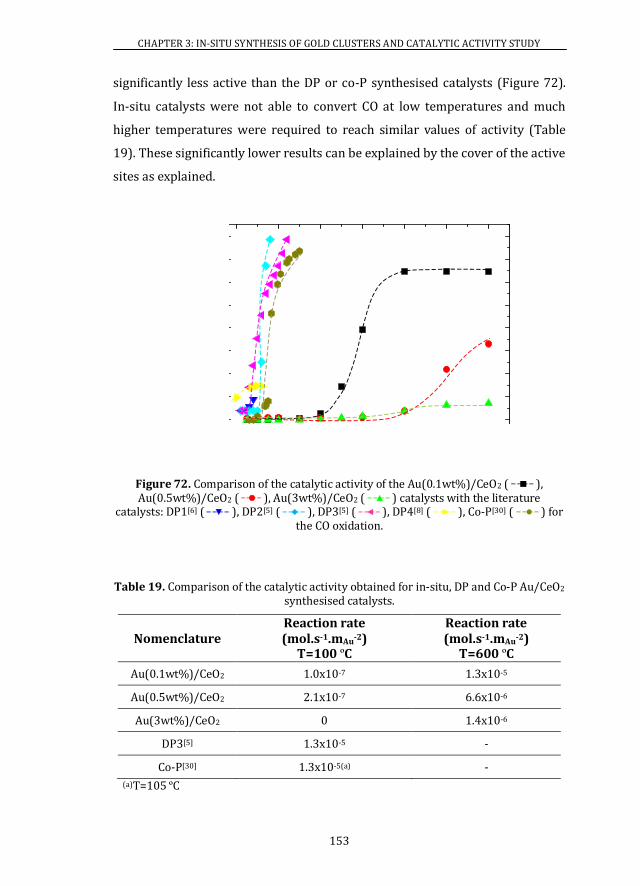
CHAPTER 3: IN-SITU SYNTHESIS OF GOLD CLUSTERS AND CATALYTIC ACTIVITY STUDY
153
significantly less active than the DP or co-P synthesised catalysts (Figure 72).
In-situ catalysts were not able to convert CO at low temperatures and much
higher temperatures were required to reach similar values of activity (Table
19). These significantly lower results can be explained by the cover of the active
sites as explained.
Figure 72. Comparison of the catalytic activity of the Au(0.1wt%)/CeO2 ( ), Au(0.5wt%)/CeO2 ( ), Au(3wt%)/CeO2 ( ) catalysts with the literature
catalysts: DP1[6] ( ), DP2[5] ( ), DP3[5] ( ), DP4[8] ( ), Co-P[30] ( ) for the CO oxidation.
Table 19. Comparison of the catalytic activity obtained for in-situ, DP and Co-P Au/CeO2 synthesised catalysts.
Nomenclature Reaction rate (mol.s-1.mAu
-2) T=100 ºC
Reaction rate (mol.s-1.mAu
-2) T=600 ºC
Au(0.1wt%)/CeO2 1.0x10⁻⁷ 1.3x10⁻⁵
Au(0.5wt%)/CeO2 2.1x10⁻⁷ 6.6x10⁻⁶
Au(3wt%)/CeO2 0 1.4x10⁻⁶
DP3[5] 1.3x10⁻⁵ -
Co-P[30] 1.3x10⁻⁵(a) -
(a)T=105 ºC
2 322 422 522 622 722 822
202
402z32 /8
602z32 /8
802z32 /8
:02z 32 /8
302z32 /7
304z32 /7
306z32 /7
308z32 /7
"
"
Tgcevkqp"tcvg"*o
qn0u/30o
Cw/4+
V"*¼E+

CHAPTER 3: IN-SITU SYNTHESIS OF GOLD CLUSTERS AND CATALYTIC ACTIVITY STUDY
154
The catalytic activity results revealed that the in-situ synthesis method was not
adequate to prepare active catalysts for the CO oxidation. Nevertheless, it could
be concluded that Au clusters deposited in very low gold contents (< 0.5 wt%)
are preferable in order to prevent sintering of Au (increase of the Au
interparticle distance). In this context a new cleaner synthesis method that
allows a uniform distribution of stable gold nanoclusters (d < 2 nm) to be
obtained was developed (Chapter 4).
3.7 CONCLUSIONS
In this chapter the development of a very simple, versatile and reproducible in-
situ synthesis method that allow to obtain from stable single Au atoms to Au
clusters (d < 2 nm) supported on MWCNTs, TiO2 and CeO2 covered by amine
groups at room temperature was presented.
Importantly, ICP-OES’ measures revealed that, when using MWCNTs, the
nominal and the real Au content present on the catalyst is very similar. A deep
characterisation of the parameters that might influence the Au particle size was
carried out by HRTEM. From this study it was concluded that different sized Au
clusters can be obtained by simply altering the quantity of the gold precursor
(HAuCl4) on surfaces covered by amine groups. Additionally, another
parameter that strongly influences the Au particle size is the support surface
area. A lower support surface area leads to an easier sintering of Au demanding
then lower Au loadings in order to prevent agglomeration of gold. Finally,
concerning the synthesis temperature no significant differences on the Au
cluster size were observed up to 70"ºC.
Moreover, by XPS characterisation it was concluded that up to 3 wt% of Au
content catalysts, when supported on MWCNTs, show only cationic Au species
(isolated Au atoms or oxidised Au clusters). When supported on TiO2 and CeO2,
metallic Au coexists with positively charged gold for Au contents between 1
wt% and 3 wt%.

CHAPTER 3: IN-SITU SYNTHESIS OF GOLD CLUSTERS AND CATALYTIC ACTIVITY STUDY
155
Importantly, the synthesis of stable single Au atoms on MWCNTs-PAH surfaces
was successfully demonstrated using Au loadings of 0.5 wt% or lower. Hence,
further study about the activity of these single Au atoms for different reactions
can be carried out, as to date it has been little investigated.
Despite the simplicity of this method and its advantages the activity of different
sized in-situ Au/CeO2 catalysts for the CO oxidation could not be investigated
due to the cover of the catalysts active sites. In-situ Au/CeO2 catalysts showed a
much lower activity than the ones prepared by DP or co-P methods. Despite, it
was concluded that catalysts with Au contents lower than 3 wt% are preferable
in order to avoid the Au sinter at high reaction temperatures. It was then
concluded that this in-situ synthesis method is not the most adequate to
produce active catalysts for CO oxidation. Thus, this study led then to the
development of a new cleaner synthesis method that allows Au catalysts with a
uniform population of gold nanoclusters (d < 2 nm) to be prepared, which is
presented in Chapter 4.
Additionally, it has been observed that Au clusters strongly affect the thermal
stability of MWCNTs. This observation led to the study about the Au effect on
the decomposition temperature of carbonaceous materials presented in
Chapter 5.

CHAPTER 3: IN-SITU SYNTHESIS OF GOLD CLUSTERS AND CATALYTIC ACTIVITY STUDY
156
3.8 REFERENCES
[1] L. Lechuga Gómez, E. Mendoza Gómez, M. A. Correa Duarte, M. Sanles
Sobrido, Patent WO2010031890 A1: Síntesis de Partículas
Subnanometricas de Au catalíticas soportadas en superficies con grupos
amino 2010, available on-line
http://patentscope.wipo.int/search/en/WO2010031890.
[2] J. Llorca, M. Dominguez, C. Ledesma, R. J. Chimentão, F. Medina, J.
Sueiras, I. Angurell, M. Seco, O. Rossell, Journal of Catalysis 2008, 258,
187–198.
[3] F. B. Lollmahomed, R. Narain, Langmuir 2011, 27, 12642-12649.
[4] L. Alves, B. Ballesteros, M. Boronat, J. R. Cabrero-Antonino, P.
Concepción, A. Corma, M. A. Correa-Duarte, E. Mendoza Journal of the
American Chemical Society 2011, 133 (26), 10251-10261.
[5] R.-R. Zhang, L.-H. Ren, A.-H. Lu, W.-C. Li, Catalysis Communications
2011, 13, 18-21.
[6] S. Y. Lai, Y. F. Qiu, S. J. Wang, Journal of Catalysis 2006, 237, 303-313.
[7] S. Carretin. P. Concepción, A. Corma, J. M. López Nieto, V. F. Puentes,
Angewandte Chemie International Edition 2004, 43, 2538-2540.
[8] Tana, F. Wang, H. Li, W. Shen, Catalysis Today 2011, 175, 541-545.
[9] R. Zanella, S. Giorgio, C. R. Henry, C. Louis, Journal of Physical Chemistry
B 2002, 106, 7634-7642.
[10] S. Tsubota, M. Haruta, T. Kobayashi, A. Ueda, Y. Nakahara, Studies in
Surface Science and Catalysis 1991, 72, 695-704.
[11] S. Tsubota, D. A. H. Cunningham, Y. Bando, M. Haruta, Studies in Surface
Science and Catalysis 1995, 91, 227-235.
[12] R.-R. Zhang, L.-H. Ren, A.-H. Lu, W.-C. Li, Catalysis Communications
2011, 13, 18-21.
[13] H.-F. Li, N. Zhang, P. Chen, M.-F. Luo, J.-Q. Lu, Applied Catalysis B:
Environmental 2011, 110, 279-285.
[14] F. Moreau, G. C. Bond, Catalysis Today 2007, 122, 215-221.
CHAPTER 3: IN-SITU SYNTHESIS OF GOLD CLUSTERS AND CATALYTIC ACTIVITY STUDY
157
[15] T. G. Schaaff, M. N. Shafigullin, J. T. Khoury, I. Vezmar, R. L. Whetten, W.
G. Cullen, P. N. First, Journal of Physical Chemistry B 1997, 101, 7885-
7891.
[16] http://www.nanocyl.com/en/CNT-Expertise-Centre/Carbon-Nanotubes,
consulted 07/01/2014.
[17] R. Zanella, E. V. Basiuk, P. Santiago, V. A. Basiuk, E. Mireles, L.
Puente-Lee, J. M. Saniger, Journal of Physical Chemistry B 2005, 109,
16290-16295.
[18] H. Ismaili, F. Lagugné-Labarthet, M. S. Workentin, Chemistry of
Materials 2011, 23, 1519-1525.
[19] J. Kimling, M. Maier, B. Okenve, V. Kotaidis, H. Ballot, A. Plech, Journal of
Physical Chemistry B 2006, 110 (32), 15700-15707.
[20] J. Turkevich, P. C. Stevenson, J. Hillier, Discussions of the Faraday Society
1951, 11, 55-75.
[21] I. O.-J. F. M. Romero, N. G. Bastús, V. Puntes, Journal of Physical
Chemistry C 2010, 114, 1800-1804.
[22] Z. Y. Li, N. P. Young, M. Di Vece, S. Palomba, R. E. Palmer, A. L. Bleloch, B.
C. Curlwy, R. L. Johnston, J. Jiang, J. Yuan, Nature 2008, 451, 46-48.
[23] A. Mayoral, D. A. Blom, M. M. Mariscal, C. Guiterrez-Wing, J. Aspiazu, M.
Jose-Yacaman, Chemical Communications 2010, 46, 8758-8760.
[24] R. F. Egerton, P. Li, M. Malac, Micron 2004, 35, 399-409.
[25] J. D. S Newman, G. J. Blanchard, Langmuir 2006, 22, 5882-5887.
[26] S. Zafeiratos, S. Kennou, Surface Science 1999, 443, 238–244.
[27] D. T. Thompson, Nanotoday 2007, 2/4, 40-43.
[28] B. Rodríguez-González, P. Mulvaney, L. M. Liz-Marzán, Zeitschrift für
Physikalische Chemie 2007, 221, 415-426.
[29] J. Llorca, L. Alves, M. Torrens, A. Mayoral, E. Mendoza, article in
preparation.
[30] X.-Y. Wang, S.-P. Wang, S.-R. Wang, Y.-Q. Zhao, J. Huang, S.-M. Zhang, W.-
P. Huang, S.-H. Wu, Catalysis Letters 2006, 112, 115-119.


CHAPTER 4:
EX-SITU SYNTHESIS OF
GOLD NANOCLUSTERS AND
CATALYTIC ACTIVITY STUDY


CHAPTER 4: EX-SITU SYNTHESIS OF GOLD NANOCLUSTERS AND CATALYTIC ACTIVITY STUDY
161
4.1 SYNTHETIC PROTOCOL – Au NANOCLUSTERS
Gold nanoclusters were synthesised following the experimental method
described by Xu et al. to obtain Ag nanoclusters[1]. This refers to a simple
sonochemical synthesis of Ag clusters using a polymer – poly(methacrylic acid)
sodium salt (PMAA) (Figure 73) – (MW ~ 9500 g/mol; density = 1.251 g/mL;
[C4H5O2Na]n, 30 wt% in H2O, Aldrich) as reducing and capping agent to stabilise
and protect the Ag nanoclusters in the solution.
Figure 73. PMAA chemical structure.
Studies showed that PMAA whose carboxylic acid groups have a strong affinity
for silver ions and silver surfaces is suitable to prepare Ag nanoclusters under
UV irradiation[1, 2]. The charged carboxylate groups ( 2RCO ) will stabilise the Ag
nanoclusters and avoid its sinter or ripening. Moreover, PMAA will be oxidised
by OH● leading to radicals that are unable to oxidise the metal ions[3]. Thus, this
polymer a lso ac ts as OH● radical scavengers preventing, in this way, the
formation of metal oxide[1, 4]. At the same time, the secondary radicals that
result from the reaction of PMAA with OH● have a strong reducing power
associated, therefore producing Ag atoms connected with the polymer chains[1].
In this context, the possibility of using this method to synthesise Au
nanoclusters was investigated. Experimentally, Au nanoclusters’ were prepared
using HAuCl4 as gold precursor. The synthesis was carried out at room
temperature and consisted in adding the desired volume of HAuCl4 to the PMAA
aqueous solution (Figure 74). Then, the pH of the resulting solution was

CHAPTER 4: EX-SITU SYNTHESIS OF GOLD NANOCLUSTERS AND CATALYTIC ACTIVITY STUDY
162
adjusted to 4.5 using a 2.5 M HNO3 aqueous solution (Figure 74). The resultant
solution was then deareated with N2 for one hour (Figure 74) to avoid the
aggregation of the nanoclusters (Chapter 1, Section 1.3.6), and finally
ultrasonicated for 20 minutes using 100 W of power under a N2 atmosphere in
a refrigerated cell (Chapter 2, Section 2.10.1, Figure 26). This time period of
sonication was chosen since, for Ag, it was observed that clusters were formed
after 10 minutes of sonication[1]. Moreover, the increase of the sonication time
leads to an undesirable increase of the nanoclusters’ mean diameter[1].
Figure 74. Schematic representation of the ex-situ Au nanoclusters sonochemical synthesis procedure.
The solution pH was maintained at 4.5 since it has been reported that both
levels of ionisation of the carboxylic acid groups and PMAA structure are
HAuCl4 (aq.)(aq.)
PMAA (aq.) HAuCl4
+PMAA (aq.)
2.5 M HNO3 (aq.)
N2 (g)
HAuCl4
+PMAA (aq.)(pH = 4.5)
N2 – 1 h
20 min. sonication (N2)
Au nanoclusters
Inlet refrigerant
fluid
Outletrefrigerant
fluid
N2 inlet

CHAPTER 4: EX-SITU SYNTHESIS OF GOLD NANOCLUSTERS AND CATALYTIC ACTIVITY STUDY
163
affected significantly by the pH[2]. The sonochemical reaction consists in the
dissociation of the PMAA into ionised carboxylic acid groups ( 2RCO ) that will
sequester the metallic Au. Thus, on the one hand, the degree of ionisation of the
carboxylic acid groups will be different, depending on the pH solution, and
therefore, the ability of these groups to bind to gold is varied. For example, if
the pH is too low (pH ~ 2.3), all the carboxylic acid groups will be protonated
and there will not exist available 2RCO groups to bind to Au, and consequently
nanoclusters will not be formed[2]. On the other hand, the conformation of this
polymer is also highly dependent on the pH solution and it influences the size of
the nanoclusters formed[2]. It is known that, at pH=5, the PMAA in aqueous
solution suffers a conformational change. At lower pH, the Au is captured by the
ionised carboxylic acid groups and protected by a compact structure formed by
the polymer molecule and it is, in this way, stabilised. At these pHs, the polymer
isolates the formed nanoclusters by a hydrophobic core[2]. If the pH is increased
(pH > 5), this protection will be weaker due to the lower compactness of the
structure.
Au nanoclusters were successfully obtained following this procedure. These
nanoclusters were easily characterised by atomic force microscopy (AFM). Au
nanoclusters appeared as bright dots easily distinguished in the topography
images (Figure 75). Additionally, Au agglomerates were not found.
4.2 2RCO /Au MOLAR RATIO INFLUENCE IN THE Au
PARTICLE SIZE
It has been observed that the size of the metal nanoclusters is directly
dependent on the quantity of polymer added (Chapter 1, Section 1.3.6)[1, 5]. A
higher stabilisation, i.e. an increase of the polymer quantity, leads to smaller
metal nanoclusters[1, 5]. With the goal of synthesising the smallest gold

CHAPTER 4: EX-SITU SYNTHESIS OF GOLD NANOCLUSTERS AND CATALYTIC ACTIVITY STUDY
164
nanoclusters, a study about how the 2RCO /Au ratio influences the mean Au
cluster size was carried out. Thus, different values of this variable, namely 0.1,
0.5 and 2, were used in order to conclude about the optimal 2RCO /Au molar
ratio. In this study, the concentration of Au was fixed in 0.02 mg/mL, once that
higher concentrations lead to an easier agglomeration of gold, due to the lower
Au interparticle distance. The Au nanoclusters synthesised with different
AuRCO //2 molar ratios were characterised by AFM (Figure 75). AFM
characterisation allowed the Au particle size distributions of the three different
2RCO /Au molar ratios samples to be obtained (Figure 76).

CHAPTER 4: EX-SITU SYNTHESIS OF GOLD NANOCLUSTERS AND CATALYTIC ACTIVITY STUDY
165
Figure 75. AFM topography images of Au nanoclusters prepared with a 2RCO /Au molar
ratio of 0.1 (a), 0.5 (b) and 2 (c). Selected particles are indicated by arrows.
2.00 nm
0.00 nm
220nm
(a)
2.00 nm
0.00 nm
220nm
(b)
5.00 nm
0.00 nm
220nm
(c)
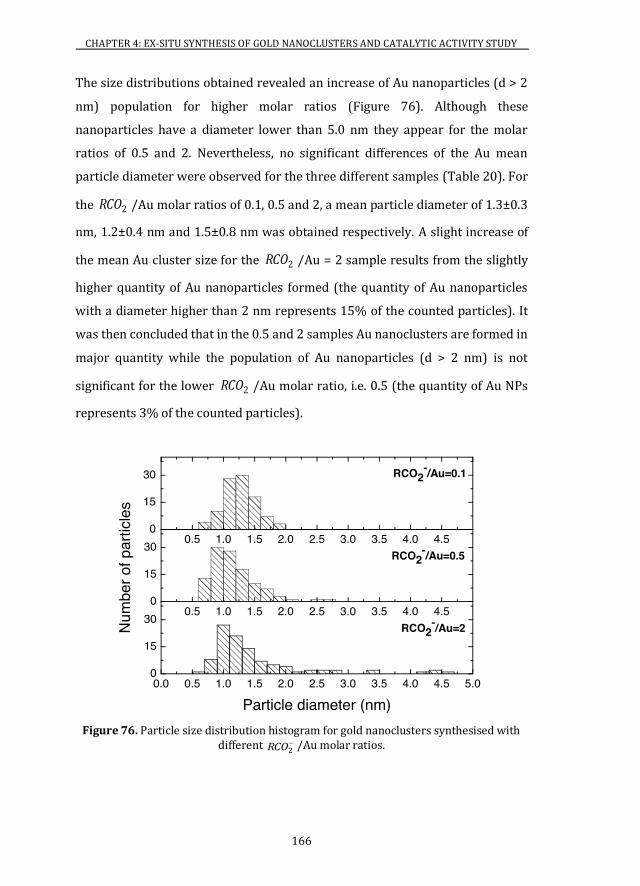
CHAPTER 4: EX-SITU SYNTHESIS OF GOLD NANOCLUSTERS AND CATALYTIC ACTIVITY STUDY
166
The size distributions obtained revealed an increase of Au nanoparticles (d > 2
nm) population for higher molar ratios (Figure 76). Although these
nanoparticles have a diameter lower than 5.0 nm they appear for the molar
ratios of 0.5 and 2. Nevertheless, no significant differences of the Au mean
particle diameter were observed for the three different samples (Table 20). For
the 2RCO /Au molar ratios of 0.1, 0.5 and 2, a mean particle diameter of 1.3±0.3
nm, 1.2±0.4 nm and 1.5±0.8 nm was obtained respectively. A slight increase of
the mean Au cluster size for the 2RCO /Au = 2 sample results from the slightly
higher quantity of Au nanoparticles formed (the quantity of Au nanoparticles
with a diameter higher than 2 nm represents 15% of the counted particles). It
was then concluded that in the 0.5 and 2 samples Au nanoclusters are formed in
major quantity while the population of Au nanoparticles (d > 2 nm) is not
significant for the lower 2RCO /Au molar ratio, i.e. 0.5 (the quantity of Au NPs
represents 3% of the counted particles).
Figure 76. Particle size distribution histogram for gold nanoclusters synthesised with different
2RCO /Au molar ratios.
0.0 0.5 1.0 1.5 2.0 2.5 3.0 3.5 4.0 4.5 5.00
15
30
Num
ber o
f par
ticle
s
Particle diameter (nm)
0.5 1.0 1.5 2.0 2.5 3.0 3.5 4.0 4.50
15
30
RCO2-/Au=2
0.5 1.0 1.5 2.0 2.5 3.0 3.5 4.0 4.50
15
30
RCO2-/Au=0.5
RCO2-/Au=0.1
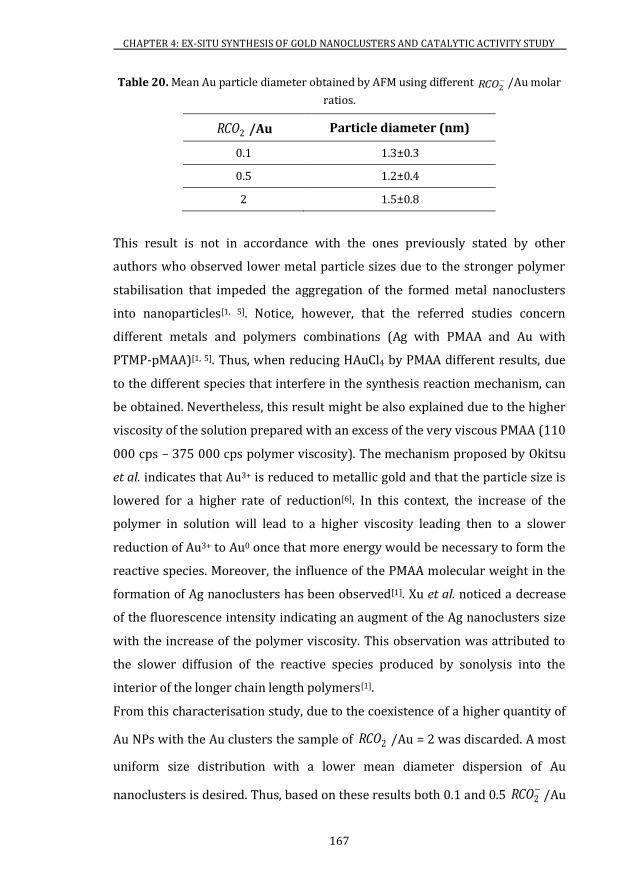
CHAPTER 4: EX-SITU SYNTHESIS OF GOLD NANOCLUSTERS AND CATALYTIC ACTIVITY STUDY
167
Table 20. Mean Au particle diameter obtained by AFM using different 2RCO /Au molar
ratios.
2RCO /Au Particle diameter (nm)
0.1 1.3±0.3
0.5 1.2±0.4
2 1.5±0.8
This result is not in accordance with the ones previously stated by other
authors who observed lower metal particle sizes due to the stronger polymer
stabilisation that impeded the aggregation of the formed metal nanoclusters
into nanoparticles[1, 5]. Notice, however, that the referred studies concern
different metals and polymers combinations (Ag with PMAA and Au with
PTMP-pMAA)[1, 5]. Thus, when reducing HAuCl4 by PMAA different results, due
to the different species that interfere in the synthesis reaction mechanism, can
be obtained. Nevertheless, this result might be also explained due to the higher
viscosity of the solution prepared with an excess of the very viscous PMAA (110
000 cps – 375 000 cps polymer viscosity). The mechanism proposed by Okitsu
et al. indicates that Au3+ is reduced to metallic gold and that the particle size is
lowered for a higher rate of reduction[6]. In this context, the increase of the
polymer in solution will lead to a higher viscosity leading then to a slower
reduction of Au3+ to Au0 once that more energy would be necessary to form the
reactive species. Moreover, the influence of the PMAA molecular weight in the
formation of Ag nanoclusters has been observed[1]. Xu et al. noticed a decrease
of the fluorescence intensity indicating an augment of the Ag nanoclusters size
with the increase of the polymer viscosity. This observation was attributed to
the slower diffusion of the reactive species produced by sonolysis into the
interior of the longer chain length polymers[1].
From this characterisation study, due to the coexistence of a higher quantity of
Au NPs with the Au clusters the sample of 2RCO /Au = 2 was discarded. A most
uniform size distribution with a lower mean diameter dispersion of Au
nanoclusters is desired. Thus, based on these results both 0.1 and 0.5 2RCO /Au
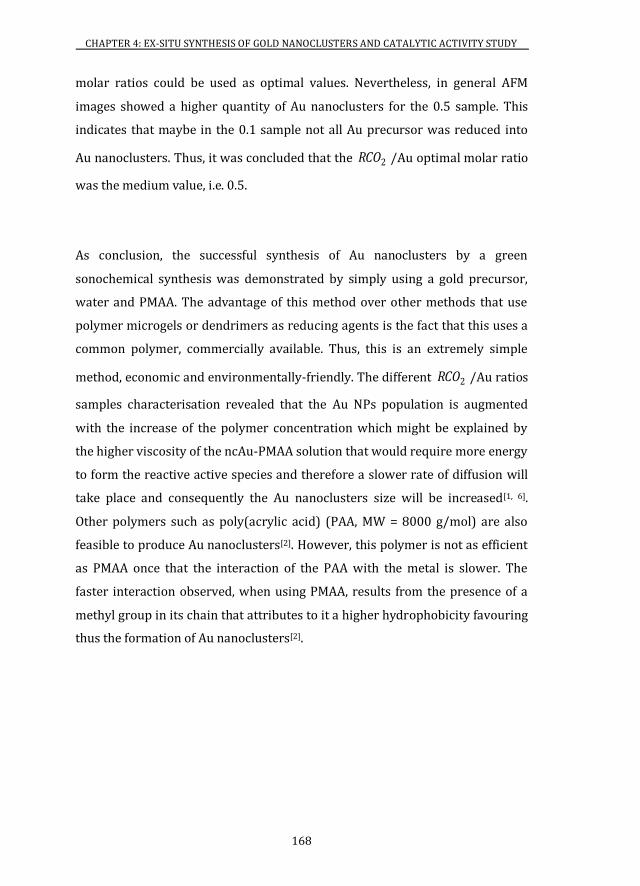
CHAPTER 4: EX-SITU SYNTHESIS OF GOLD NANOCLUSTERS AND CATALYTIC ACTIVITY STUDY
168
molar ratios could be used as optimal values. Nevertheless, in general AFM
images showed a higher quantity of Au nanoclusters for the 0.5 sample. This
indicates that maybe in the 0.1 sample not all Au precursor was reduced into
Au nanoclusters. Thus, it was concluded that the 2RCO /Au optimal molar ratio
was the medium value, i.e. 0.5.
As conclusion, the successful synthesis of Au nanoclusters by a green
sonochemical synthesis was demonstrated by simply using a gold precursor,
water and PMAA. The advantage of this method over other methods that use
polymer microgels or dendrimers as reducing agents is the fact that this uses a
common polymer, commercially available. Thus, this is an extremely simple
method, economic and environmentally-friendly. The different 2RCO /Au ratios
samples characterisation revealed that the Au NPs population is augmented
with the increase of the polymer concentration which might be explained by
the higher viscosity of the ncAu-PMAA solution that would require more energy
to form the reactive active species and therefore a slower rate of diffusion will
take place and consequently the Au nanoclusters size will be increased[1, 6].
Other polymers such as poly(acrylic acid) (PAA, MW = 8000 g/mol) are also
feasible to produce Au nanoclusters[2]. However, this polymer is not as efficient
as PMAA once that the interaction of the PAA with the metal is slower. The
faster interaction observed, when using PMAA, results from the presence of a
methyl group in its chain that attributes to it a higher hydrophobicity favouring
thus the formation of Au nanoclusters[2].

CHAPTER 4: EX-SITU SYNTHESIS OF GOLD NANOCLUSTERS AND CATALYTIC ACTIVITY STUDY
169
4.3 SYNTHESIS OF SUPPORTED Au NANOCLUSTERS
CATALYSTS
The synthesised Au nanoclusters ( 2RCO /Au = 0.5; [Au] = 0.02 mg/mL) were
effectively deposited on MWCNTs, CeO2 and TiO2 surfaces covered with amine
groups. The preparation of the support-PAH hybrids was performed as it was
described in Chapter 3 (Section 3.1). The deposition of the ex-situ synthesised
Au nanoclusters was carried out by simply dropwising the nanoclusters’
solution into the liquid support-PAH suspension under sonication (Figure 77).
The ncAu/support liquid catalysts were left 15 minutes under sonication in an
ice bath. After this time, the pre-synthesised Au nanoclusters were uniformly
dispersed, anchored and stabilised on the supports’ surface (Figure 77). The
catalysts prepared in this work are presented in Table 21.
Figure 77. Ex –situ synthesis scheme procedure (left) and respective schematic representation using MWCNTs as support (right).
NH2 NH2
15 min. sonication
Lyophilisation
ncAu/support (s)
Au nanoclusters
Support-PAH suspension
ncAu/support suspension
Sonication
CHAPTER 4: EX-SITU SYNTHESIS OF GOLD NANOCLUSTERS AND CATALYTIC ACTIVITY STUDY
170
Table 21. List of the ex-situ synthesised catalysts.
Catalyst Nomenclature Au loading (wt%)
Au/CeO2 (74.0 m2/g)
ncAu(0.1wt%)/CeO2 0.1
ncAu(0.3wt%)/CeO2 0.3
ncAu(0.5wt%)/CeO2 0.5
ncAu(3wt%)/CeO2 3
Au/TiO2 ncAu(0.5wt%)/TiO2 0.5
4.3.1 HIGH RESOLUTION TRANSMISSION ELECTRON MICROSCOPY
By HRTEM characterisation it was observed the existence of Au nanoclusters
on the supports’ surface. Taking into account the different surface areas of
these materials, as it was discussed in Chapter 3 (Section 3.3.2), different Au
contents were chosen when using MWCNTs, CeO2 or TiO2 as support. The
successful deposition of Au nanoclusters in these three distinct supports
indicates that ex-situ Au nanoclusters can also be anchored to several different
types of surfaces when these are covered by amine groups, which shows the
versatility of this method. Figure 78 shows an HRTEM image of a
ncAu(0.5wt%)/TiO2 catalyst. A mean particle diameter of 1.4±0.4 nm was
obtained for this catalyst (Figure 79).

CHAPTER 4: EX-SITU SYNTHESIS OF GOLD NANOCLUSTERS AND CATALYTIC ACTIVITY STUDY
171
Figure 78. HRTEM images of a ncAu(0.5wt%)/TiO2 catalyst.
Figure 79. Particle size distribution histogram for a ncAu(0.5wt%)/TiO2 catalyst.
10 nm
202 207 302 307 402 407 5022
4
6
8
:
32
34
36"
Pwod
gt"qh"rctvkengu
R ctvkeng"fkcogvgt"*po +

CHAPTER 4: EX-SITU SYNTHESIS OF GOLD NANOCLUSTERS AND CATALYTIC ACTIVITY STUDY
172
Furthermore, comparing this mean value (1.4±0.4 nm) with the one obtained
by AFM (1.2±0.4 nm), it was concluded that gold nanoclusters did not
agglomerate while in solution and, were well dispersed on the supports
maintaining their size without sinter, by a 15 minute ultrasonication. Using
other supports a similar mean Au particle diameter (1.3 nm – 1.4 nm) was
obtained.
Moreover, the activity of these catalysts was tested after more than one month
of preparation and similar results to fresh catalysts were obtained indicating
that these ex-situ catalysts are stable. This is a very good result once that the
ability to obtain an uniform and stable size distribution of Au nanoclusters
catalysts have been reported essentially using just the DP synthetic protocol[7-9].
This simple sonochemical water soluble synthesis method represents then a
new approach since it is the first time reported to obtain ncAu/support
catalysts by an sonochemical environmental-friendly and economically viable
method.
4.3.2 X-RAY PHOTOELECTRON SPECTROSCOPY
The chemical nature of the ncAu/CeO2 catalysts was investigated by XPS
(Figure 80). Catalysts with a gold loading of 0.1 wt%, 0.5 wt% and 3 wt% were
prepared. The three catalysts showed a BE value close to the bulk Au4f7/2 BE
(84.0 eV) indicating that gold nanoclusters are metallic (Table 22). Thus, it was
concluded that the chemical nature of the Au clusters synthesised by the in-situ
or ex-situ synthesis method is different. Unlike the in-situ synthesised catalysts,
these do not present positively charged gold species. This can be explained by
the different mechanisms of formation of Au clusters of the two synthetic
protocols.

CHAPTER 4: EX-SITU SYNTHESIS OF GOLD NANOCLUSTERS AND CATALYTIC ACTIVITY STUDY
173
Figure 80. XPS spectra of the Au4f peak and respective fit components for gold nanoclusters obtained at different nominal gold loadings on CeO2.
Table 22. XPS data for different Au content ncAu/CeO2 catalysts.
Au content (wt%) 0.1 0.5 3
4f7/2 BE (eV) 84.0 83.9 84.0
The chemical nature of the sonochemically prepared of gold clusters has not
been much reported. Liu et al. observed that the 1.8 nm Au nanoclusters
sonochemically prepared using BSA as reducing agent were composed by both
metallic (Au0) and cationic gold (Auδ+) (Table 23)[10].
Moreover, the synthesis of gold nanodots using different reagents, such as
HAuCl4.3H2O, tetrakis(hydroxymethyl)phosphonium chloride (THPC),
trisodium tetraborate and 11-mercaptoundecanoic acid (11-MUA), by Huang et
al., showed that the BE values of the Au4f7/2 vary with the Au mean particle
diameter (Table 23)[11]. In accordance to what has been observed in Chapter 3
(in-situ), Huang et al. noticed that a decrease of the Au particle size leads to an
increase of the Au4f7/2 BE shift. These authors obtained Au + (~ 85.0 eV) for the
smallest gold nanodots (1.2±0.2 nm). The larger nanodots (1.7±0.2 nm and
2.1±0.1 nm) showed a BE similar to the bulk metallic gold (Au0)[11].
94 92 90 88 86 84 82 80500750
10001250
Au 4f7/2Au 4f5/2
3 wt%
0.5 wt%
0.1 wt%
CPS
Binding Energy (eV)
92 90 88 86 84 82
1000
1250
1500
92 90 88 86 84 82
1125
1250
1375

CHAPTER 4: EX-SITU SYNTHESIS OF GOLD NANOCLUSTERS AND CATALYTIC ACTIVITY STUDY
174
Table 23. Au 4f7/2 BE values of gold nanoclusters synthesised by different methods.
Synthesis method d (nm) Au4f7/2
Sonochemical (using BSA as reducing agent of HAuCl4)[10] ~ 1.8 84.0/85.1
1 - Reduction of HAuCl4.3H2O
with THPC by a vigorously
vortexing;
2 – Reaction between DI water,
trisodium tetraborate, 11-MUA
and THPC-Au NPs[11].
[THPC]/[HAuCl4] - -
1.0 1.2±0.2 84.9
2.0 1.7±0.2 84.2
3.5 2.1±0.1 84.0
Furthermore, in order to check if the surface of Au nanoclusters was modified,
the ncAu(0.5wt%)/CeO2 catalyst was analysed after a three hour calcination at
300 ºC. XPS results revealed (Figure 81) that after calcination Au maintains its
metallic state (BE = 83.9 eV). Therefore, the Au that will participate in the CO
oxidation will be all metallic, when using this ex-situ synthesis method to
prepare the catalysts. In this way, the role of Au0 in the CO oxidation can be
easily concluded.
Figure 81. XPS spectrum of the Au4f peak and respective fit components for the ncAu(0.5wt%)/CeO2 catalysts after a three hour calcination at 300 ºC.
;6 ;4 ;2 :: :8 :6 :4 :2
:22
;22
3222
3322
3422
3522Au 4f
7/2Au 4f
5/2
""
ERU
Dkpfkpi"Gpgti{ "*gX+
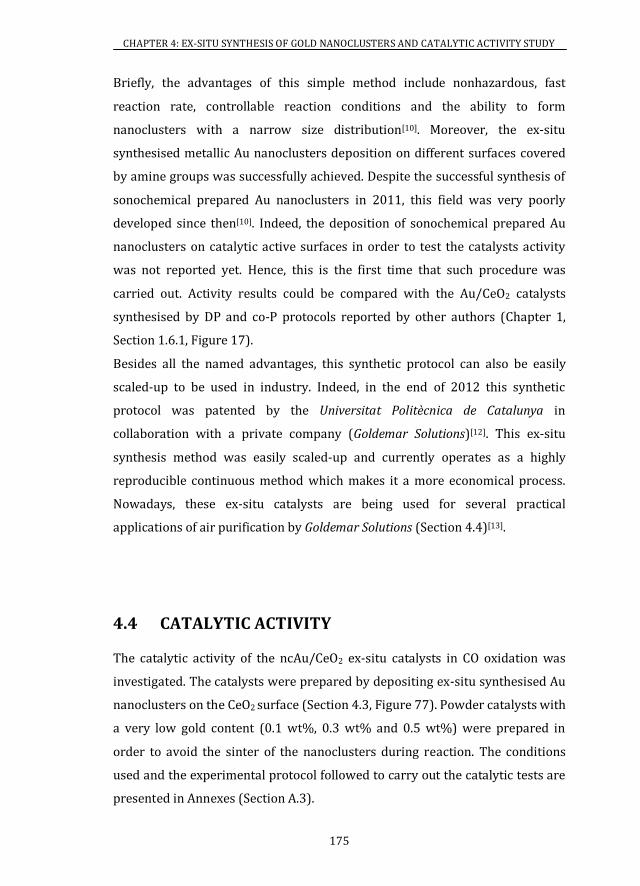
CHAPTER 4: EX-SITU SYNTHESIS OF GOLD NANOCLUSTERS AND CATALYTIC ACTIVITY STUDY
175
Briefly, the advantages of this simple method include nonhazardous, fast
reaction rate, controllable reaction conditions and the ability to form
nanoclusters with a narrow size distribution[10]. Moreover, the ex-situ
synthesised metallic Au nanoclusters deposition on different surfaces covered
by amine groups was successfully achieved. Despite the successful synthesis of
sonochemical prepared Au nanoclusters in 2011, this field was very poorly
developed since then[10]. Indeed, the deposition of sonochemical prepared Au
nanoclusters on catalytic active surfaces in order to test the catalysts activity
was not reported yet. Hence, this is the first time that such procedure was
carried out. Activity results could be compared with the Au/CeO2 catalysts
synthesised by DP and co-P protocols reported by other authors (Chapter 1,
Section 1.6.1, Figure 17).
Besides all the named advantages, this synthetic protocol can also be easily
scaled-up to be used in industry. Indeed, in the end of 2012 this synthetic
protocol was patented by the Universitat Politècnica de Catalunya in
collaboration with a private company (Goldemar Solutions)[12]. This ex-situ
synthesis method was easily scaled-up and currently operates as a highly
reproducible continuous method which makes it a more economical process.
Nowadays, these ex-situ catalysts are being used for several practical
applications of air purification by Goldemar Solutions (Section 4.4)[13].
4.4 CATALYTIC ACTIVITY
The catalytic activity of the ncAu/CeO2 ex-situ catalysts in CO oxidation was
investigated. The catalysts were prepared by depositing ex-situ synthesised Au
nanoclusters on the CeO2 surface (Section 4.3, Figure 77). Powder catalysts with
a very low gold content (0.1 wt%, 0.3 wt% and 0.5 wt%) were prepared in
order to avoid the sinter of the nanoclusters during reaction. The conditions
used and the experimental protocol followed to carry out the catalytic tests are
presented in Annexes (Section A.3).

CHAPTER 4: EX-SITU SYNTHESIS OF GOLD NANOCLUSTERS AND CATALYTIC ACTIVITY STUDY
176
Unlike the in-situ catalysts, all the ncAu/CeO2 catalysts showed a higher CO
conversion than the support CeO2 (Figure 82). This result revealed that metallic
Au nanoclusters are active for the CO oxidation.
Figure 82. Comparison of the CO conversion of CeO2 ( ), ncAu(0.1wt%)/CeO2 ( ), ncAu(0.3wt%)/CeO2 ( ) and ncAu(0.5wt%)/CeO2 ( ) catalysts. Flow
rate: 100 mL/min (96 v/v% N2; 2 v/v% O2; 2 v/v% CO).
Additionally, the higher CO conversion was obtained for the
ncAu(0.5wt%)/CeO2 catalyst. Nevertheless, when normalising these values to
reaction rate (Figure 83) it can be seen that the most active catalyst is the
ncAu(0.1wt%)/CeO2. Thus, it was concluded that the higher conversion
observed for the ncAu(0.5wt%)/CeO2 catalyst is due to the higher quantity of
Au in this catalyst.
2 72 322 372 422 472 522 572 622 672
2
42
62
82
:2
322
"
"
EQ"eqpxgtukqp"*’+
V"*¼E+
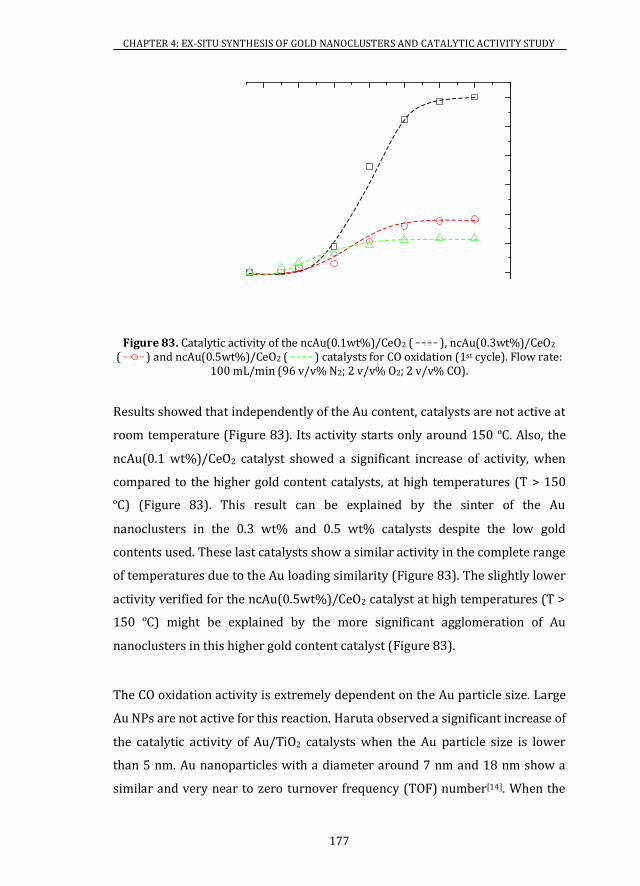
CHAPTER 4: EX-SITU SYNTHESIS OF GOLD NANOCLUSTERS AND CATALYTIC ACTIVITY STUDY
177
Figure 83. Catalytic activity of the ncAu(0.1wt%)/CeO2 ( ), ncAu(0.3wt%)/CeO2 ( ) and ncAu(0.5wt%)/CeO2 ( ) catalysts for CO oxidation (1st cycle). Flow rate:
100 mL/min (96 v/v% N2; 2 v/v% O2; 2 v/v% CO).
Results showed that independently of the Au content, catalysts are not active at
room temperature (Figure 83). Its activity starts only around 150 ºC. Also, the
ncAu(0.1 wt%)/CeO2 catalyst showed a significant increase of activity, when
compared to the higher gold content catalysts, at high temperatures (T > 150
ºC) (Figure 83). This result can be explained by the sinter of the Au
nanoclusters in the 0.3 wt% and 0.5 wt% catalysts despite the low gold
contents used. These last catalysts show a similar activity in the complete range
of temperatures due to the Au loading similarity (Figure 83). The slightly lower
activity verified for the ncAu(0.5wt%)/CeO2 catalyst at high temperatures (T >
150 ºC) might be explained by the more significant agglomeration of Au
nanoclusters in this higher gold content catalyst (Figure 83).
The CO oxidation activity is extremely dependent on the Au particle size. Large
Au NPs are not active for this reaction. Haruta observed a significant increase of
the catalytic activity of Au/TiO2 catalysts when the Au particle size is lower
than 5 nm. Au nanoparticles with a diameter around 7 nm and 18 nm show a
similar and very near to zero turnover frequency (TOF) number[14]. When the
2 72 322 372 422 472 522 572 622
202
302z32 /7
402z32 /7
502z32 /7
602z32 /7
702z32 /7
802z32 /7
"
"
Tgcevkqp"tcvg"*o
qn0u/30o
Cw/4+
V"*¼E+
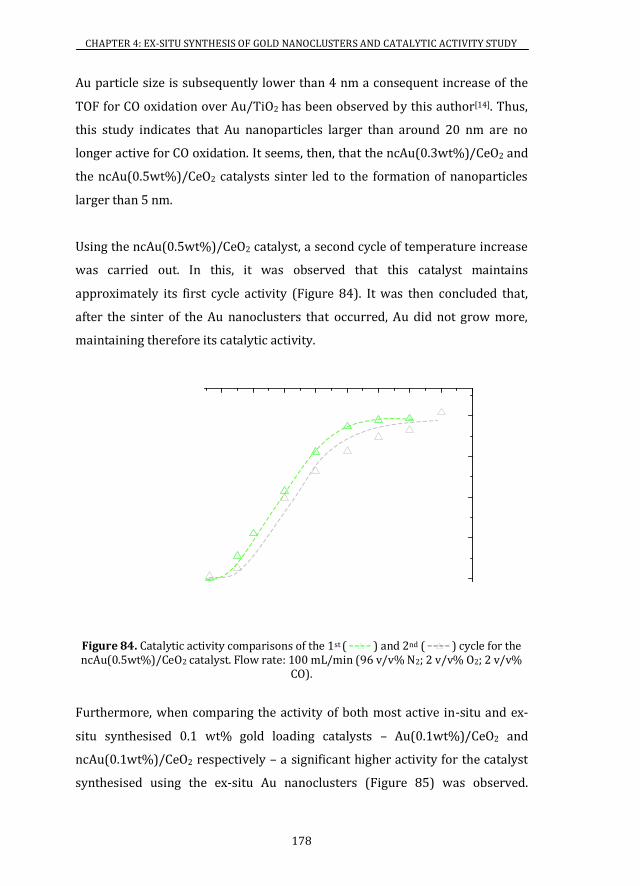
CHAPTER 4: EX-SITU SYNTHESIS OF GOLD NANOCLUSTERS AND CATALYTIC ACTIVITY STUDY
178
Au particle size is subsequently lower than 4 nm a consequent increase of the
TOF for CO oxidation over Au/TiO2 has been observed by this author[14]. Thus,
this study indicates that Au nanoparticles larger than around 20 nm are no
longer active for CO oxidation. It seems, then, that the ncAu(0.3wt%)/CeO2 and
the ncAu(0.5wt%)/CeO2 catalysts sinter led to the formation of nanoparticles
larger than 5 nm.
Using the ncAu(0.5wt%)/CeO2 catalyst, a second cycle of temperature increase
was carried out. In this, it was observed that this catalyst maintains
approximately its first cycle activity (Figure 84). It was then concluded that,
after the sinter of the Au nanoclusters that occurred, Au did not grow more,
maintaining therefore its catalytic activity.
Figure 84. Catalytic activity comparisons of the 1st ( ) and 2nd ( ) cycle for the ncAu(0.5wt%)/CeO2 catalyst. Flow rate: 100 mL/min (96 v/v% N2; 2 v/v% O2; 2 v/v%
CO).
Furthermore, when comparing the activity of both most active in-situ and ex-
situ synthesised 0.1 wt% gold loading catalysts – Au(0.1wt%)/CeO2 and
ncAu(0.1wt%)/CeO2 respectively – a significant higher activity for the catalyst
synthesised using the ex-situ Au nanoclusters (Figure 85) was observed.
2 72 322 372 422 472 522 572 622 672
202
502z32 /8
802z32 /8
;02z32 /8
304z32 /7
"
"
Tgcevkqp"tcvg"*oqn0u/30o
Cw/4+
V"*¼E+

CHAPTER 4: EX-SITU SYNTHESIS OF GOLD NANOCLUSTERS AND CATALYTIC ACTIVITY STUDY
179
Indeed, not even at 600 ºC the in-situ catalyst was able to reach the activity of
the ex-situ catalyst at 350 ºC.
Figure 85. Comparison of the catalytic activity of both synthetic protocols: in-situ Au(0.1wt%)/CeO2 ( ) and ex-situ ncAu(0.1wt%)/CeO2 ( ).
Figure 86. Comparison of the catalytic activity of both synthetic protocols: in-situ Au(0.5wt%)/CeO2 ( ) and ex-situ ncAu(0.5wt%)/CeO2 ( ).
2 322 422 522 622 722 822
202
302z32 /7
402z32 /7
502z32 /7
602z32 /7
702z32 /7
802z32 /7
"
"
Tgcevkqp"tcvg"*o
qn0u/30o
Cw/4+
V"*¼E+
2 322 422 522 622 722 822
202
402z32 /8
602z32 /8
802z32 /8
:02z 32 /8
302z32 /7
304z32 /7
"
"
Tgcevkqp"tcvg"*o
qn0u/30o
Cw/4+
V"*¼E+
CHAPTER 4: EX-SITU SYNTHESIS OF GOLD NANOCLUSTERS AND CATALYTIC ACTIVITY STUDY
180
The same result was observed for the 0.5 wt% gold content catalysts (Figure
86). As before, this gold content catalyst showed a much lower activity when
prepared by the in-situ protocol at 600 ºC, than the ex-situ synthesised at 350
ºC (Figure 86). This difference results essentially from the fact that the ex-situ
synthetic protocol is cleaner, i.e the Au nanoparticles and CeO2 active sites are
not covered by intermediate species formed during the synthesis reaction.
Although it was not observed by XPS, due to the very low signal for the Au4f
and therefore reliable values could not be obtained, it is believed that the
in-situ very low gold content synthesised Au/CeO2 catalysts (0.1 wt% and 0.5
wt%) are composed only by Auδ+. Indeed, by XAS, using the same gold content
MWCNTs catalysts it was concluded that these catalysts were only composed
by Auδ+. Due to the inability of measuring the catalytic activity of the in-situ
catalysts due to the cover of their active sites, the role of the positively charged
Au species in CO oxidation could not be investigated as discussed in Chapter 3
(Section 3.6.2). Nevertheless, using the ex-situ catalysts which are composed
only by metallic gold nanoclusters the role of these species in this reaction
could be concluded. It was concluded that this specie is active for the CO
oxidation. Despite the controversy that exists about which is the Au active
specie for the CO oxidation, these results lead to conclude that metallic gold is
essential to observe the CO oxidation in accordance to what has been observed
by Pillai et al. and Qian et al.[15, 16]. Nevertheless, some authors claimed that
cationic gold species (Auδ+) are more active than Au0 for CO oxidation[17, 18].
Even so, Haruta et al. questioned the role of the cationic species since the
majority of XPS analysis show the presence of metallic gold in the most active
gold catalysts[19-21]. Moreover, these authors also affirmed that oxidised gold
should be reduced during the CO oxidation. Indeed, Han et al., although
claiming that the activity observed was due mostly to the Auδ+ species, noticed
a significant increase of Au0 after CO oxidation[22].

CHAPTER 4: EX-SITU SYNTHESIS OF GOLD NANOCLUSTERS AND CATALYTIC ACTIVITY STUDY
181
Besides, the results experimentally obtained for the sonochemical prepared
ncAu/CeO2 catalysts were compared with the activities observed using
different synthesis methods, namely deposition-precipitation and co-
precipitation (Figure 87).
Figure 87. Comparison of the catalytic activity of the reaction rate of the ncAu(0.1wt%)/CeO2 ( ), ncAu(0.3wt%)/CeO2 ( ), ncAu(0.5wt%)/CeO2 ( )
catalysts with the literature catalysts: DP1[23] ( ), DP2[9] ( ), DP3[9] ( ), DP4[24] ( ), Co-P[25] ( ) for the CO oxidation.
Figure 88 shows a zoom of the temperature range zone between 0 ºC and 150
ºC. Importantly, the ex-situ catalysts showed a similar activity to the
co-precipitation catalyst. Indeed, the activity of the co-precipitation synthesised
catalyst is approximately only twice higher than the ncAu(0.1wt%)/CeO2
catalyst at 150 ºC. In fact, the ncAu(0.1wt%)/CeO2 catalyst reaches the
co-precipitation catalyst maximum activity observed at 150 ºC around a very
similar temperature (160 ºC) (Figure 87).
In general, the DP synthesis gives origin to more active catalysts than the
sonochemical prepared in the range of temperatures of 30 ºC to 150 ºC (Figure
88). Indeed, temperature increases of approximately 60 ºC and 50 ºC were
required to achieve the maximum activity of the DP1 and DP4 respectively, by
the ncAu(0.1wt%)/CeO2 catalyst. Moreover, an approximate 80 ºC increase was
2 72 322 372 422 472 522 572 622
202
302z32 /7
402z32 /7
502z32 /7
602z32 /7
702z32 /7
802z32 /7
"
"
Tgcevkqp"tcvg"*oqn0u/30o
Cw/4+
V"*¼E+

CHAPTER 4: EX-SITU SYNTHESIS OF GOLD NANOCLUSTERS AND CATALYTIC ACTIVITY STUDY
182
necessary to the ncAu(0.1wt%)/CeO2 catalyst to achieve the maximum activity
of the DP2 catalyst.
Figure 88. Comparison of the catalytic activity of the reaction rate of the ncAu(0.1wt%)/CeO2 ( ), ncAu(0.3wt%)/CeO2 ( ), ncAu(0.5wt%)/CeO2
( ) catalysts with the literature catalysts: DP1[23] ( ), DP2[9] ( ), DP3[9] ( ), DP4[24] ( ), Co-P[25] ( ) for the CO oxidation in the range of
0-150 ºC.
In conclusion the ex-situ ncAu/CeO2 catalysts present similar activities to the
catalysts prepared by co-P and, even though, in general, they do not show a
better catalytic activity than the ones prepared by DP method these results are
very promising. This was the first time that active catalysts were prepared for
CO oxidation by a pre-synthesis of Au nanoclusters clean sonochemical
procedure.
Still, this method could be improved by changing some variables that certainly
will lead to an increase of the catalytic activity of these ex-situ synthesised Au
nanoclusters catalysts. For example, the effect of the support characteristics is
extremely important and affects significantly the catalytic activity, as it has
been reported by Carretin et al. where the increase of activity of Au for CO
oxidation in two order of magnitudes was observed by simply using as support
nanocrystalline particles of cerium oxide instead of a regular cerium oxide
support[26]. Thus, by simply changing this variable, an increase of activity will
2 72 322 372
202
702z32 /8
302z32 /7
307z32 /7
"
"Tgcevkqp"tcvg"*oqn0u/30o
Cw/4+
V"*¼E+

CHAPTER 4: EX-SITU SYNTHESIS OF GOLD NANOCLUSTERS AND CATALYTIC ACTIVITY STUDY
183
be likely observed. Besides regular, the cerium here used has a low surface area
(74.0 m2/g) which will also lead to the easier agglomeration of Au at high
temperatures.
Additionally, Zhang et al., despite the discussion between the role of Au0 and
Auδ+ as active species for CO oxidation, claimed that a balanced quantity
between both species is required to obtain higher activities[9]. By XPS it was
concluded that the Au in these ex-situ catalysts is all in the form of Au0
indicating that these species are active and necessary for the CO oxidation.
Nevertheless, the co-existence of Au0 with Auδ+ species could possibly increase
the catalytic activity.
This ex-situ synthesis method is very promising due to the ability of obtaining a
uniform population of Au nanoclusters by a simple and environmental-friendly
protocol. Although CO oxidation catalytic activity was not observed at room
temperature, putting these catalysts below several other developed Au
catalysts actives at this temperature they could be used in other higher
temperature applications. For example, they could be an alternative to the Pt
catalysts used in high temperature proton exchange membrane (HT-PEM) fuel
cells which work at 150 ºC – 200 ºC[27, 28].
Improvements of the synthetic protocol have been carried out since the start of
the company Goldemar Solutions in Barcelona. Since the first synthesis in 2011
and all the characterisation study this protocol was patented in the end of 2012
by Universitat Politècnica de Catalunya in collaboration with Goldemar
Solutions[12]. During the same year the company started to apply this synthetic
protocol to the development of highly active Au nanoclusters catalysts for air
purification applications in an industrial scale[13]. Further characterisation
studies and catalytic activity tests that allowed improvements to the ex-situ
protocol were the object of two final career projects at the Universitat
Politècnica de Catalunya that were carried out in the company[29, 30]. Besides the
supports presented in this work, Au nanoclusters have been successfully
anchored to other surfaces covered with amine groups, such as ZrO2, Fe2O3 and
CHAPTER 4: EX-SITU SYNTHESIS OF GOLD NANOCLUSTERS AND CATALYTIC ACTIVITY STUDY
184
SiO2. For example, promising results have been obtained using Au/CeO2,
Au/ZrO2 and Au/CexZr1-xO2 for the elimination of formaldehyde (a typical
volatile organic compound (VOC) molecule and one of the most common and
noxious indoor gaseous pollutants)[30]. Thus, further improvements in the
synthetic protocol were and are still being carried out by the Goldemar
Solutions team. In this way, more active catalysts were obtained and its
commercialisation is expected soon. Currently, these catalysts are being tested
for environmental interest applications of air purification at low temperature
such as:
-" Reduce of the vehicle emissions (CO oxidation at low temperature; low
temperature combustion of soot) and cost of catalytic converters;
-" Removal of VOCs (formaldehyde or toluene) and pollutants from indoor
air at room temperature;
-" Purification of air in closed environments;
-" Improvement of respirator protective equipment.
Indeed, another patent was submitted in 2013 by our group in collaboration
with Goldemar Solutions[31]. In this document it is demonstrated the oxidation of
CO at room temperature by a 0.1 wt% gold content ncAu/CeO2 catalyst.
Additionally, it was showed that this catalyst was stable after three cycles of
reaction in a temperature range of 30 ºC – 850 ºC. In addition, the ability of
these Au nanoclusters to decrease the carbon black combustion temperature
was also demonstrated (this study is presented in Chapter 5). Finally, the
ability of these catalysts to reduce several different VOCs was also
demonstrated. It was concluded that a 0.1 wt% ncAu/CeO2 catalyst is more
active to reduce aldehydes contents than the until now reported catalysts[31].

CHAPTER 4: EX-SITU SYNTHESIS OF GOLD NANOCLUSTERS AND CATALYTIC ACTIVITY STUDY
185
4.5 CONCLUSIONS
In this chapter a simple and reproducible sonochemical ex-situ synthesis
method of Au nanoclusters was successfully presented and developed. The
sonochemical synthesis of Au nanoclusters was successfully achieved using
PMAA as the reducing and capping agent of the Au nanoclusters. How the
AuRCO //2 ratio influences the Au particle size, was investigated by AFM
characterisation. This study revealed that an increase of the polymer quantity
in solution leads to a slight increase of Au NPs in the Au nanoclusters solution.
A 2RCO /Au molar ratio of 0.5 was concluded as the optimal value. Au
nanoclusters with a mean diameter of approximately 1.2 nm were obtained
using a Au concentration of 0.02 mg/mL and a 2RCO /Au molar ratio of 0.5.
The fresh sonochemical pre-synthesised Au nanoclusters were, for the first
time, successfully anchored to surfaces with amine groups, namely MWCNTs,
CeO2 and TiO2. Stable ncAu/support catalysts were obtained. Agglomerates of
gold were not observed. A Au mean particle diameter similar to the one
obtained by AFM of the unsupported nanoclusters was achieved. XPS analysis
revealed that gold nanoclusters were in the form of metallic gold (Au0)
independently of the gold loading (0.1wt%, 0.5wt% or 3 wt%) of the
ncAu/CeO2 catalysts. The metallic state of gold is maintained after the catalyst
calcination.
Furthermore, for the first time the catalytic activity of supported ex-situ
sonochemical prepared Au clusters catalysts was presented. These ex-situ
ncAu/CeO2 catalysts are active for the CO oxidation. It was, thus, demonstrated
that Au0 is an active specie for the CO oxidation. The ncAu(0.1wt%)/CeO2
catalyst is the most active for this reaction since Au aggregation that takes place
at high temperatures is avoided in such lower Au loading. The
ncAu(0.3wt%)/CeO2 and ncAu(0.5wt%)/CeO2 catalysts showed a low activity
for CO oxidation probably due to the Au sinter. After a first CO oxidation
reaction cycle, the activity of the ncAu(0.5wt%)/CeO2 catalyst was maintained
indicating the end of the Au sinter. It was then concluded that ex-situ catalysts

CHAPTER 4: EX-SITU SYNTHESIS OF GOLD NANOCLUSTERS AND CATALYTIC ACTIVITY STUDY
186
are more active for CO oxidation that in-situ catalysts due to its cleaner surface
(higher amount of active sites available). Furthermore, it was concluded, the ex-
situ ncAu/CeO2 catalysts are less active than the deposition-precipitation
catalysts but have a comparable activity to the co-precipitation catalysts
reported by other authors for CO oxidation.
The results obtained are very promising. Indeed, this synthetic protocol was
patented by the Universitat Politècnica de Catalunya in collaboration with the
Goldemar Solutions company. Also, since this first study, ex-situ catalysts
improvements have been carried out by this company and, currently, these
catalysts are being tested for different practical applications with an
environmental interest.

CHAPTER 4: EX-SITU SYNTHESIS OF GOLD NANOCLUSTERS AND CATALYTIC ACTIVITY STUDY
187
4.6 REFERENCES
[1] H. Xu, K. S. Suslick, ACS Nano 2010, 4, 3209-3214.
[2] L. Shang, S. Dong, Chemical Communications 2008, 1088-1090.
[3] J. Belloni, M. Mostafavi, H. Remita, J.-L. Marignier, M.-O. Delcourt, New
Journal of Chemistry 1998, 1239-1255.
[4] E. Janata, A. Henglein, B. G. Ershov, Journal of Physical Chemistry 1994,
98, 10888-10890.
[5] N. Schaeffer, B. Tan, C. Dickinson, M. J. Rosseinsky, A. Laromaine, D. W.
McComb, M. M. Steven, Y. Wang, l. Petit, C. Barentin, D. G. Spiller, A. I.
Cooper, R. Levy, Chemical Communications 2008, 3986-3988.
[6] K. Okitsu, M. Ashokkumar, F. Grieser, Journal of Physical Chemistry B
2005, 109, 20673-20675.
[7] S. Tsubota, M. Haruta, T. Kobayashi, A. Ueda, Y. Nakahara, Studies in
Surface Science and Catalysis 1991, 72, 695-704.
[8] S. Tsubota, D. A. H. Cunningham, Y. Bando, M. Haruta, Studies in Surface
Science and Catalysis 1995, 91, 227-235.
[9] R.-R. Zhang, L.-H. Ren, A.-H. Lu, W.-C. Li, Catalysis Communications
2011, 13, 18-21.
[10] H. Liu, X. Zhang, X. Wu, L. Jiang, C. Burda, J.-J. Zhu, Chemical
Communications 2011, 47, 4237-4239.
[11] C.-C. Huang, H.-Y. liao, Y.-C. Shiang, Z.-H. Lin, Z. Yang, H.-T. Chang,
Journal of Materials Chemistry 2009, 19, 755-759.
[12] E. Mendoza, J. Llorca, Patent WO2013057349 A1: Method for producing
a substrate with Au nanoclusters affixed to the surface and substrate and
catalyst obtained by means of said method 2013.
[13] http://www.goldemar.com, consulted 03/03/14.
[14] Haruta, Journal of New Materials for Electrochemical Systems 2004, 7,
163-172.
[15] U. R. Pillai, S. Deevi, Applied Catalysis A 2006, 299, 266-273.
[16] K. Qian, S. Lv, X. Xiao, H. Sun, J. Lu, M. Luo, W. Huang, Journal of
Molecular Catalysis A 2009, 306, 40-47.

CHAPTER 4: EX-SITU SYNTHESIS OF GOLD NANOCLUSTERS AND CATALYTIC ACTIVITY STUDY
188
[17] J. Guzman, B. C. Gates, Journal of the American Chemical Society 2004,
126, 2672-2673.
[18] J. Guzman, B. C. Gates, Journal of Physical Chemistry B 2002, 7659-7665.
[19] M. Haruta, The Chemical Record 2003, 3, 75-87.
[20] J.-D. Grunwaldt, M. Maciejewski, O. S. Becker, p. Fabrizioli, A. Baiker,
Journal of Catalysis 1999, 186, 458-469.
[21] L. Guczi, D. Horváth, Z. Pászti, L. Tóth, Z. E. Horváth, A. Karacs, G. Peto,
Journal of Physical Chemistry B 1999, 186, 458.
[22] M. Han, X. Wang, Y. Shen, C. Tang, G. Li, R. L. Jr. Smith, Journal of Physical
Chemistry C 2010, 114, 793-798.
[23] S. Y. Lai, Y. F. Qiu, S. J. Wang, Journal of Catalysis 2006, 237, 303-313.
[24] Tana, F. Wang, H. Li, W. Shen, Catalysis Today 2011, 175, 541-545.
[25] X.-Y. Wang, S.-P. Wang, S.-R. Wang, Y.-Q. Zhao, J. Huang, S.-M. Zhang, W.-
P. Huang, S.-H. Wu, Catalysis Letters 2006, 112, 115-119.
[26] S. Carretin. P. Concepción, A. Corma, J. M. López Nieto, V. F. Puntes,
Angewandte Chemie International Edition 2004, 43, 2538-2540.
[27] G. Naveen, P. Bhat, O. Bhaskar, S. T. Dasari, Fuel Cell System 2012, ME
436, 1-9.
[28] O. Shamardina, A. A. Kulikovsky, A. V. Chertovich, A. R. Khokhlov, Fuel
Cells 2012, 12, 577-582.
[29] E. Galindo, Final Course Project: Estudi del procés en continu de
producció de nanoclústers d’or, ETSEIB, Universitat Politècnica de
Catalunya 2013.
[30] N. Zuasti, Final Course Project: Synthesis of novel catalysts containing
gold nanoclusters for VOCs removal, ETSEIB, Universitat Politècnica de
Catalunya 2013.
[31] E. Mendoza Gómez, J. Llorca Piqué, L. Rodrigues Alves, E. Galindo, M.
Santiago Redondo, Patent submitted 2013, European Patent
Application No: 12382137.1.

CHAPTER 5:
OXIDATION OF
CARBONACEOUS MATERIALS

CHAPTER 5: OXIDATION OF CARBONACEOUS MATERIALS
191
5.1 CATALYSTS SYNTHESIS
While testing the catalytic activity of Au/MWCNTs catalysts for CO oxidation, it
was noticed, after a 400 ºC oxidation, that Au seems to decrease the oxidation
temperature of MWCNTs (Chapter 3, Section 3.6.1). Thus, following this
observation a deeper study about the effect of Au in the thermal stability of
carbonaceous materials was carried out.
Firstly, commercial multiwalled carbon nanotubes (MWCNTs) were decorated
with different contents of Au synthesised in-situ using sodium citrate as
reducing agent of the gold precursor (HAuCl4), according to the method
described in Chapter 3 (Section 3.1, Figure 30). This approach allows tuning the
gold particle size easily (higher Au loads lead to larger particles - Chapter 3,
Section 3.3.1). In this way, with the goal of determining the reactivity-
selectivity-particle size relationships Au/MWCNTs catalysts with Au contents of
0.1 wt%, 0.5 wt%, 1 wt%, 3 wt%, 6 wt%, 13 wt% and 23 wt% were
synthesised. These catalysts were prepared using a sodium citrate/Au molar
excess of 1700. Thus, before lyophilisation, the sodium citrate excess of the
catalysts was removed by centrifugation (twice: 6000 rpm; 10 ºC; 30 minutes).
The solid powder catalyst was then obtained by lyophilisation (P ∽ 2 10-2
mbar; T ∽ - 74 ºC).
Besides these catalysts, a 0.5 wt% of 15 nm Au nanoparticles catalyst -
Au15nm(0.5wt%)/MWCNTs - was also prepared. This catalyst was prepared in
order to do a complementary comparison of the effect of the size of the Au
nanoparticle in the catalyst activity and selectivity to CO2. In this case, the Au
nanoparticles with a concentration of Au of 0.04 mg/mL were firstly pre-
synthesised following the Turkevich method[1]. This method simply consists in
adding a certain quantity of the gold precursor (HAuCl4) to mili-Q water under
stirring. This mixture was left to stir approximately at 100 ºC until it starts to
boil. Then, an aqueous solution of sodium citrate was added to the previous
mixture and left to boil for 10 minutes. During this time the solution changed its

CHAPTER 5: OXIDATION OF CARBONACEOUS MATERIALS
192
colour and, at the end, a red solution of 15 nm Au nanoparticles was obtained.
These nanoparticles were then deposited on the MWCNTs-PAH surface under a
15 minutes sonication in an ice bath. The catalyst was finally lyophilised in
order to obtain the solid powder (P ∽ 2 10-2 mbar; T ∽ - 74 ºC). HRTEM
characterisation of a higher 15 nm Au content catalyst –
Au15nm(3wt%)/MWCNTs – revealed a good dispersion on the MWCNTs-PAH
hybrid surface of the 15 nm Au nanoparticles (Figure 89).
Figure 89. Low (a) and high (b) magnification HRTEM images of a Au15nm(3wt%)/MWCNTs catalyst. The dark dots are 15 nm Au nanoparticles.
0.2 μm
(a)
(b)
10 nm

CHAPTER 5: OXIDATION OF CARBONACEOUS MATERIALS
193
Then, other carbon material, a type of soot (commercial carbon black, CB –
Printex zeta A, Orion), was decorated with different loadings (0.1 wt%, 0.3
wt%, 0.5 wt% and 1.5 wt%) of ex-situ gold nanoclusters with a mean diameter
of approximately 1.3 nm. These gold nanoclusters were pre-synthesised
according to the method explained in Chapter 4 (Section 4.1). Au nanoclusters
were deposited on the CB surface by direct impregnation. As CB is extremely
hydrophobic, the solid material was first impregnated with a few drops of
ethanol, then the nanoclusters suspension was added dropwise under
sonication. The catalysts were left to dry in the oven at 65 ºC during the night.
Finally, using the in-situ synthesis method, Au/CeO2 catalysts were prepared
(Chapter 3, Section 3.1), in order investigate its activity in decreasing the soot
(Printex-U, Degussa) combustion temperature. Two catalysts with gold
loadings of 0.5 wt% and 3 wt% were synthesised using a molar ratio of sodium
citrate/Au of 1.
The catalysts prepared for this study are presented in Table 24 to Table 26. The
mean Au particle diameter of the in-situ Au/MWNCTs and Au/CeO2 catalysts
presented (Table 24 and Table 26) was obtained by HRTEM characterisation
(Chapter 3, Section 3.3). Moreover, the in-situ catalysts with a gold content
lower than 0.5 wt% are composed by single Au atoms (At.) as it has been
demonstrated and discussed in Chapter 3 (Section 3.4). Finally, the mean Au
particle diameter of the ex-situ ncAu/CB catalysts was considered to be around
1.3 nm (Table 25) since the HRTEM size distributions of Au nanoclusters in the
different supports has mean values between 1.3 and 1.4 nm (Chapter 4, Section
4.3.1) and by AFM characterisation the mean Au diameter of unsupported Au
nanoclusters is 1.2 nm (Chapter 4, Section 4.2). The catalysts mass used in each
measure is also presented.
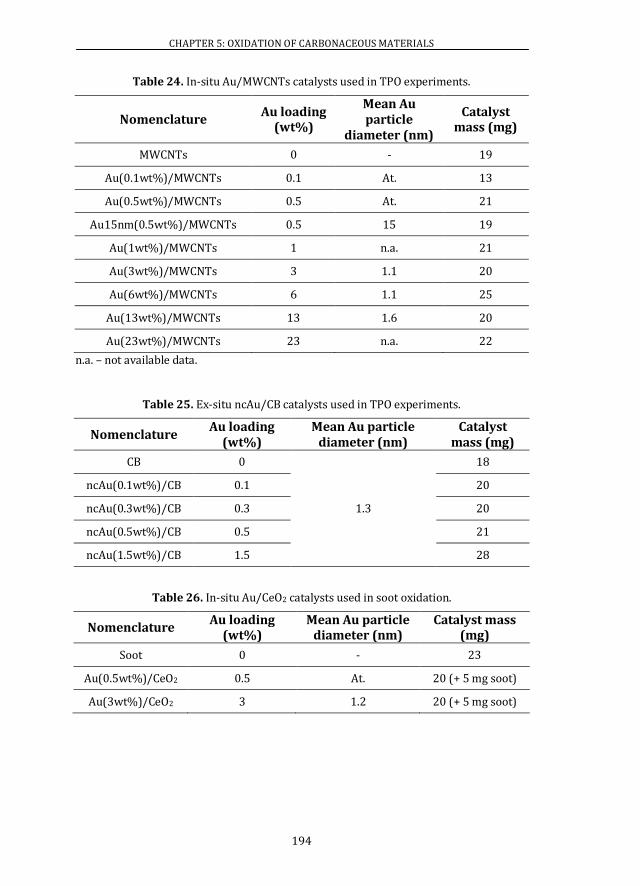
CHAPTER 5: OXIDATION OF CARBONACEOUS MATERIALS
194
Table 24. In-situ Au/MWCNTs catalysts used in TPO experiments.
Nomenclature Au loading
(wt%)
Mean Au particle
diameter (nm)
Catalyst mass (mg)
MWCNTs 0 - 19
Au(0.1wt%)/MWCNTs 0.1 At. 13
Au(0.5wt%)/MWCNTs 0.5 At. 21
Au15nm(0.5wt%)/MWCNTs 0.5 15 19
Au(1wt%)/MWCNTs 1 n.a. 21
Au(3wt%)/MWCNTs 3 1.1 20
Au(6wt%)/MWCNTs 6 1.1 25
Au(13wt%)/MWCNTs 13 1.6 20
Au(23wt%)/MWCNTs 23 n.a. 22
n.a. – not available data.
Table 25. Ex-situ ncAu/CB catalysts used in TPO experiments.
Nomenclature Au loading
(wt%) Mean Au particle
diameter (nm) Catalyst
mass (mg)
CB 0
1.3
18
ncAu(0.1wt%)/CB 0.1 20
ncAu(0.3wt%)/CB 0.3 20
ncAu(0.5wt%)/CB 0.5 21
ncAu(1.5wt%)/CB 1.5 28
Table 26. In-situ Au/CeO2 catalysts used in soot oxidation.
Nomenclature Au loading
(wt%) Mean Au particle
diameter (nm) Catalyst mass
(mg)
Soot 0 - 23
Au(0.5wt%)/CeO2 0.5 At. 20 (+ 5 mg soot)
Au(3wt%)/CeO2 3 1.2 20 (+ 5 mg soot)
CHAPTER 5: OXIDATION OF CARBONACEOUS MATERIALS
195
5.2 CATALYTIC ACTIVITY
Experimentally, the combustion of the MWCNTs, CB or soot was followed by
temperature programmed oxidation (TPO) coupled with a mass spectrometer.
A simplified chemical engineering draw and description of the reaction system
is presented in Chapter 2 (Section 2.10.3, Figure 28).
The oxidation reactions were performed using approximately 20 mg of the
solid catalysts (Au/MWCNTs – Table 24 or ncAu/CB – Table 25 or Au/CeO2-
soot – Table 26). The investigation about soot oxidation was carried out using a
soot/catalyst weight ratio of 1:4. The mixture of catalyst with soot was made
with a spatula (loose contact). All the TCD values of the TPO profiles were
normalised with the carbon mass used in each measure.
The catalytic activity was measured in terms of the temperature at which 50%
of the carbon material was converted (T50). Due to the lack of this temperature,
some literature data is compared in terms of the initial temperature of
combustion of the carbon material (Ti). Moreover, due to the different
combustion temperatures of bare carbon materials, activity is always compared
in terms of ΔT (Equation 15).
)/()( carbonAuTcarbonbareTT TTΔ (15)
where,
)( carbonbareT - temperature of oxidation of bare carbon, in ºC.
)/( carbonAuT - temperature of oxidation of the catalyst-soot mixture, in ºC.
The difficulty of decomposing each type of carbon used, i.e., the initial or the T50
temperature necessary to decompose the bare carbon is also taken into account
when comparing literature data. Carbon materials with similar temperatures of
combustion should be used in order to have a valid comparison of activities.
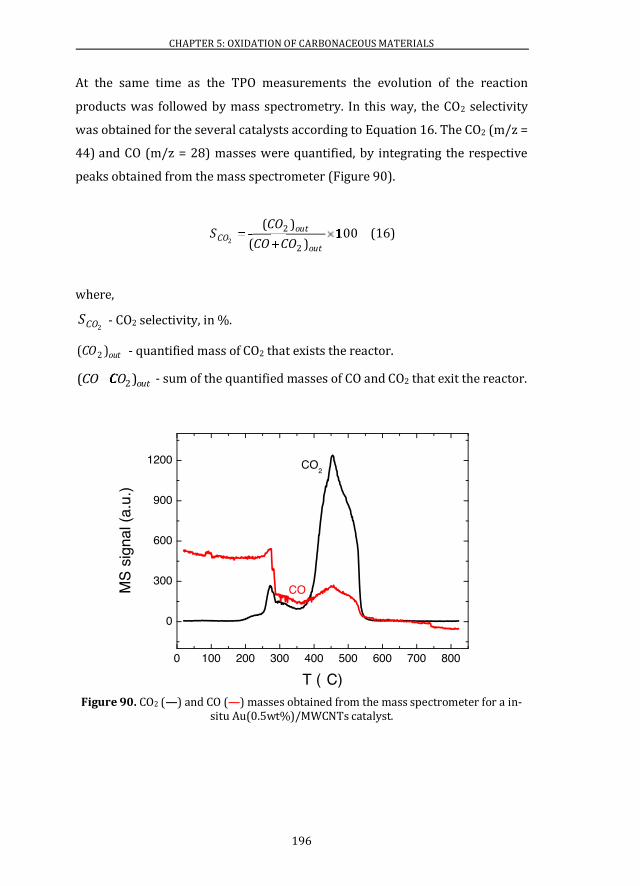
CHAPTER 5: OXIDATION OF CARBONACEOUS MATERIALS
196
At the same time as the TPO measurements the evolution of the reaction
products was followed by mass spectrometry. In this way, the CO2 selectivity
was obtained for the several catalysts according to Equation 16. The CO2 (m/z =
44) and CO (m/z = 28) masses were quantified, by integrating the respective
peaks obtained from the mass spectrometer (Figure 90).
1002
22
100out
outCO
COCO
COS
)(
)( (16)
where,
2COS - CO2 selectivity, in %.
outCO )( 2 - quantified mass of CO2 that exists the reactor.
outCOCO )( 2CO - sum of the quantified masses of CO and CO2 that exit the reactor.
Figure 90. CO2 (—) and CO (—) masses obtained from the mass spectrometer for a in-situ Au(0.5wt%)/MWCNTs catalyst.
0 100 200 300 400 500 600 700 800
0
300
600
900
1200
CO2
MS
sign
al (a
.u.)
T (ºC)
CO

CHAPTER 5: OXIDATION OF CARBONACEOUS MATERIALS
197
5.2.1 COMBUSTION TEMPERATURE OF Au DECORATED MWNCTs
(in-situ)
The effect of the Au loading in the thermal stability of MWCNTs was
investigated using a large range of Au contents (Table 24). Using such a large
range of Au loadings, the determination of reactivity-selectivity-particle size
relationships was obtained. Figure 91 shows the TPO profiles obtained for the
thermal decomposition of the MWCNTs decorated with different Au contents
(in-situ synthesis method).
Figure 91. TPO measures of the different gold content in-situ Au/MWCNTs catalysts.
In literature, the activity results of this type of reaction is presented either
using the temperature at which 50% of the carbon material is converted (T50)
or the temperature of maximum combustion rate (Tm). It is more correct to use
the value of T50 since diffusion limitations usually occur during the reaction.
The catalytic reaction is constituted by several consecutive steps that involves
the mass transport of the reagents and products on the particle surface and in
the interior of the pores and chemical steps of adsorption of the reagents,
2 422 622 822 :22"
VEF"ukipcn"pqtocnkugf"
vq"ucorng"ocuu"*c0w0+
V"*¼E+
""
""
""
""
""
""
35"y v’
8"y v’
5"y v’
3"y v’
207"y v’
203"y v’
2"y v’"
"
"
45"y v’
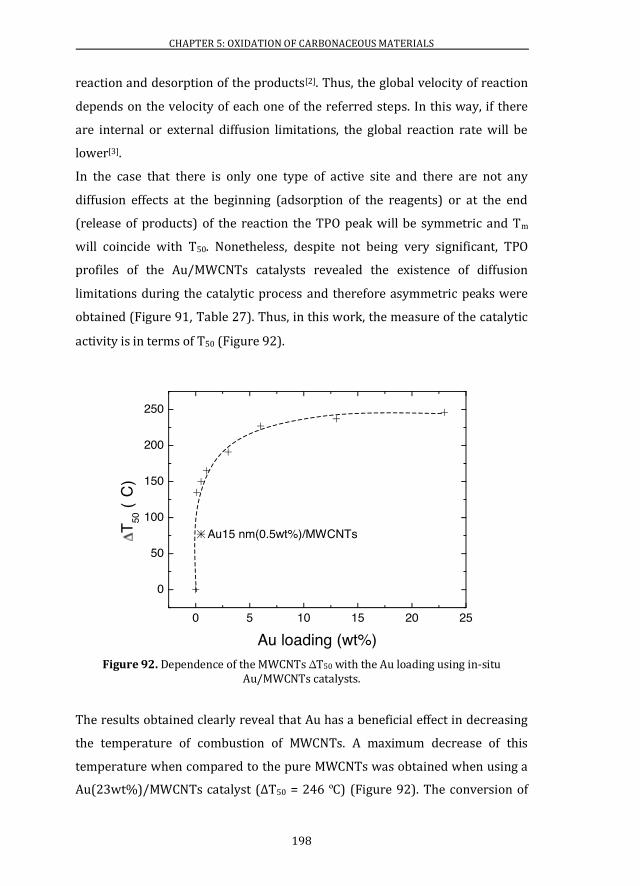
CHAPTER 5: OXIDATION OF CARBONACEOUS MATERIALS
198
reaction and desorption of the products[2]. Thus, the global velocity of reaction
depends on the velocity of each one of the referred steps. In this way, if there
are internal or external diffusion limitations, the global reaction rate will be
lower[3].
In the case that there is only one type of active site and there are not any
diffusion effects at the beginning (adsorption of the reagents) or at the end
(release of products) of the reaction the TPO peak will be symmetric and Tm
will coincide with T50. Nonetheless, despite not being very significant, TPO
profiles of the Au/MWCNTs catalysts revealed the existence of diffusion
limitations during the catalytic process and therefore asymmetric peaks were
obtained (Figure 91, Table 27). Thus, in this work, the measure of the catalytic
activity is in terms of T50 (Figure 92).
Figure 92. Dependence of the MWCNTs ΔT50 with the Au loading using in-situ Au/MWCNTs catalysts.
The results obtained clearly reveal that Au has a beneficial effect in decreasing
the temperature of combustion of MWCNTs. A maximum decrease of this
temperature when compared to the pure MWCNTs was obtained when using a
Au(23wt%)/MWCNTs catalyst (ΔT50 = 246 ºC) (Figure 92). The conversion of
0 5 10 15 20 25
0
50
100
150
200
250
T 50 (º
C)
Au loading (wt%)
Au15 nm(0.5wt%)/MWCNTs

CHAPTER 5: OXIDATION OF CARBONACEOUS MATERIALS
199
50% of MWCNTs was achieved at lower temperatures for higher Au content
catalysts (Table 27) indicating therefore a higher combustion rate for these
catalysts. Between the Au loadings of 6 wt% and 23 wt%, the ΔT50 increase
noticed was not so significant (Figure 92).
Table 27. Temperatures of maximum combustion rate (Tm) and where 50% of carbon (MWCNTs) is converted (T50) obtained for different in-situ Au/MWCNTs catalysts.
Catalyst Tm (ºC) T50 (ºC)
MWCNTs 634 615
Au15nm(0.5wt%)/MWCNTs 538 538
Au(0.1wt%)/MWCNTs 471 480
Au(0.5wt%)/MWCNTs 466 465
Au(1wt%)/MWCNTs 455 450
Au(3wt%)/MWCNTs 435 424
Au(6wt%)/MWCNTs 403 388
Au(13wt%)/MWCNTs 399 378
Au(23wt%)/MWNCTs 380 369
Furthermore, when comparing the decrease of the temperature T50 of MWCNTs
combustion of the Au(0.5wt%)/MWCNTs (ΔT50 = 150 ºC) with the catalyst with
the same gold content of 15 nm Au nanoparticles – Au15nm(0.5wt%)/MWCNTs
(ΔT50 = 77 ºC) (Figure 92), it was concluded that the Au atoms or clusters are
responsible for the significant decrease of the MWCNTs combustion
temperature. Thus, even though the catalysts with a gold content of 23 wt%
present large gold nanoparticles resultant of sinter due the high Au content,
there are still a significant quantity of Au clusters or atoms that remain on the
MWCNTs surface which are responsible for the significant decrease of the
oxidation temperature of the MWCNTs observed. The decrease of T50 with the
enhancement of the Au loading results then from the faster combustion rate
resultant from the existence of a higher quantity of Au active species. Between
6 wt% and 23 wt%, this increase is not so significant due to the fact that at high
temperatures part of the Au sinter and is no more catalytic active.
CHAPTER 5: OXIDATION OF CARBONACEOUS MATERIALS
200
Both size of Au and its chemical nature are related to the temperature
differences observed. By XPS it was observed that, when synthesised by the in-
situ method independently of the Au content, up to 3 wt%, Au in Au/MWCNTs
catalysts is positively charged (Chapter 3, Section 3.5). These positively charged
gold species observed for the catalysts with a small particle size (∽1.1 nm to ∽
1.6 nm) were attributed to gold bonded to oxygen species[4]. Moreover, by XAS
it was also observed Auδ+ on the 0.1 wt% and 0.5 wt% Au/MWCNTs catalysts
(Chapter 3, Section 3.4.2). Therefore, the ability to deliver this surface oxygen
to the reaction will surely be responsible for an increase of the combustion rate
of the MWCNTs and therefore for the decrease of its thermal stability.
Additionally, combustion temperature variations can be explained taking into
account the role of Au in the mechanism of the combustion of carbon materials.
When gold is present, the mechanism of combustion of the carbon material is
accelerated by the ability of Au to dissociate molecular oxygen (O2) from the
gas phase (Equation 17), adsorb it on its surface and by spillover release it and
deliver it to the metal-carbon interface causing the oxidation of carbon in the
vicinity of Au particles (Chapter 1, Section 1.6.2, Figure 20)[5, 6].
OAuAuO surfacesurface OAuAu22
1 (17)
In this context, our work has demonstrated that 1.1 nm Au clusters are able to
dissociate molecular oxygen at room temperature and release it at 80 ºC[4]. In
this way, considering that these active clusters are able to dissociate molecular
oxygen at room temperature and release it at around 80 ºC the fact that a higher
quantity exist will lead to a major quantity of oxygen available to oxidise the
MWCNTs[4]. The process of oxygen spillover from the Au surface to the Au-
MWCNTs interface is not faster in each cluster, but the fact that more active Au
exists in the MWCNTs surface will increase the oxidation reaction rate. Indeed,
our group by theoretical calculations demonstrated that more than one O2
dissociation on partially oxygen covered Au clusters is possible and requires a
CHAPTER 5: OXIDATION OF CARBONACEOUS MATERIALS
201
low activation barrier (6 kcal/mol). It was determined that for example, gold
clusters with a cuboctahedral structure with a diameter of approximately 1 nm,
and considering that each cluster has six active sites where at least two O2
molecules can be dissociated, it is possible to obtain a oxygen monolayer on the
Au cluster surface[4]. As well, the oxygen recombination of two oxygen atoms
adsorbed on the Au surface into O2 is difficult since it requires a much higher
energy barrier (30 kcal/mol) to occur.
Hence, the highest activity of the catalysts with higher gold content is related to
the major quantity of active Au atoms on the Au clusters surface available to
reaction. There will be more active sites available to dissociate and adsorb
molecular oxygen from the gas phase that is then delivered by spillover to the
Au/MWCNTs interface participating in the reaction, increasing for this reason
the MWCNTs combustion rate. In this way, if sinter does not occur, the
Au(23wt%)/MWCNTs should show a sharpest decrease of T50, due to the larger
quantity of active species, when comparing to the lowest Au content catalysts.
Furthermore, using a Au(3wt%)/MWCNTs catalyst and bare MWCNTs, SEM
characterisation was carried out in order to clearly observe the effect of Au in
the combustion of MWCNTs and to complement and corroborate the results
obtained. SEM images of the same zone were acquired using the fresh samples
and then heated in a muffle during 5 hours at different temperatures, namely
100 ºC , 200 ºC, 300 ºC, 400 ºC and 500 ºC (ramp temperature: 5 ºC/min). This
characterisation revealed that up to 300 ºC MWCNTs were not decomposed
independently of being bare or doped with Au. The presence of MWCNTs was
observed in the samples prepared at room temperature (Figure 93a, b) and
after being at 100 ºC, 200 ºC or 300 ºC (Figure 93c, d). Then, after being five
hours at 400 ºC, differences were observed for both samples (Figure 93e, f).
While the MWCNTs of the catalyst containing 3 wt% of Au were all decomposed
(Figure 93f), bare MWCNTs were still present (Figure 93e). SEM images clearly
revealed that five hours was enough time to decompose all the MWCNTs doped
with Au at 400 ºC. Indeed, only the bright dots of Au nanoparticles of the
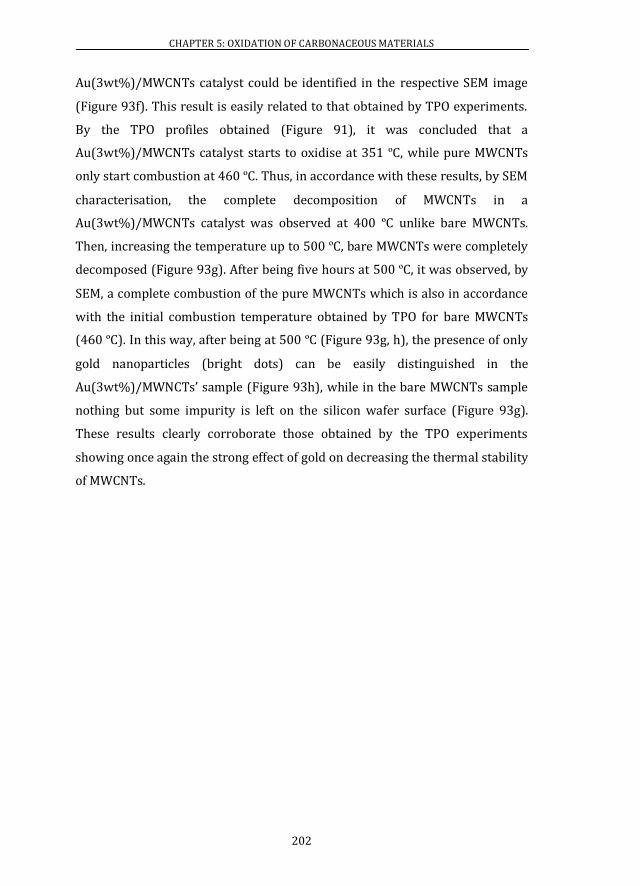
CHAPTER 5: OXIDATION OF CARBONACEOUS MATERIALS
202
Au(3wt%)/MWCNTs catalyst could be identified in the respective SEM image
(Figure 93f). This result is easily related to that obtained by TPO experiments.
By the TPO profiles obtained (Figure 91), it was concluded that a
Au(3wt%)/MWCNTs catalyst starts to oxidise at 351 ºC, while pure MWCNTs
only start combustion at 460 ºC. Thus, in accordance with these results, by SEM
characterisation, the complete decomposition of MWCNTs in a
Au(3wt%)/MWCNTs catalyst was observed at 400 ºC unlike bare MWCNTs.
Then, increasing the temperature up to 500 ºC, bare MWCNTs were completely
decomposed (Figure 93g). After being five hours at 500 ºC, it was observed, by
SEM, a complete combustion of the pure MWCNTs which is also in accordance
with the initial combustion temperature obtained by TPO for bare MWCNTs
(460 ºC). In this way, after being at 500 ºC (Figure 93g, h), the presence of only
gold nanoparticles (bright dots) can be easily distinguished in the
Au(3wt%)/MWNCTs’ sample (Figure 93h), while in the bare MWCNTs sample
nothing but some impurity is left on the silicon wafer surface (Figure 93g).
These results clearly corroborate those obtained by the TPO experiments
showing once again the strong effect of gold on decreasing the thermal stability
of MWCNTs.
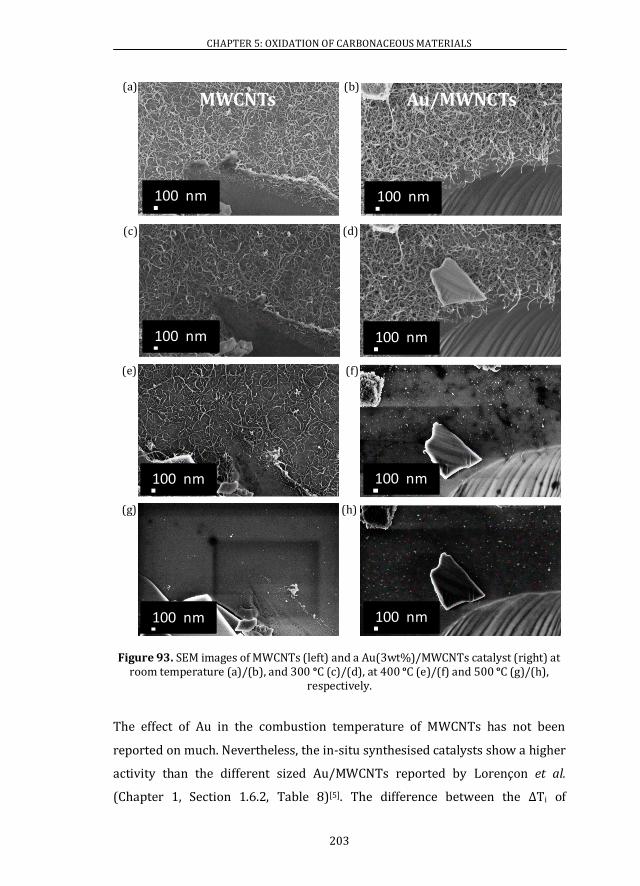
CHAPTER 5: OXIDATION OF CARBONACEOUS MATERIALS
203
Figure 93. SEM images of MWCNTs (left) and a Au(3wt%)/MWCNTs catalyst (right) at room temperature (a)/(b), and 300 ºC (c)/(d), at 400 ºC (e)/(f) and 500 ºC (g)/(h),
respectively.
The effect of Au in the combustion temperature of MWCNTs has not been
reported on much. Nevertheless, the in-situ synthesised catalysts show a higher
activity than the different sized Au/MWCNTs reported by Lorençon et al.
(Chapter 1, Section 1.6.2, Table 8)[5]. The difference between the ΔTi of
(c)
100 nm
(e)
100 nm
(g)
100 nm
(h)
100 nm
(f)
100 nm
(d)
100 nm
(a)
100 nm
MWCNTs(b)
100 nm
Au/MWNCTs

CHAPTER 5: OXIDATION OF CARBONACEOUS MATERIALS
204
combustion of MWCNTs (ΔTi, Au(13wt%)/MWCNTs - ΔTi, Au-MWC-5.8) is 63 ºC lower for
the Au-MWC-5.8 (ΔTi = 90 ºC) when compared to the Au(13wt%)/MWCNTs
catalyst (ΔTi = 153 ºC). This difference is even more significant since the
MWCNTs used in this work are more difficult to decompose (Ti = 460 ºC) than
the MWCNTs used by Lorençon et al. (Ti = 390 ºC). This lower activity results
from the larger Au nanoparticle size (~ 1.3 nm vs 5.8±2.3 nm). Au large
nanoparticles are less active due to their lower capacity of activate molecular
oxygen. Therefore the process of combustion of the carbon material will be
slower in these catalysts and higher temperatures to initiate the combustion
are required.
Moreover, the thermal decomposition of MWCNTs decorated with metal or
metal oxides nanoclusters (d < 2 nm) was recently reported by Leino et al.[6].
Metals like Pt, Pd, Ni and Co were used to decorate this carbonaceous material
(Chapter 1, Section 1.6.2, Table 7). The oxidation temperature of MWCNTs
depends on several intrinsic properties of the MWCNTs, such as the degree of
graphitisation of the materials, the concentration of surface defects and the
diameter of the MWCNTs. As so, in this case, non-decorated MWCNTs (acid pre-
treated nanotubes) started to decompose at 407 ºC (53 ºC lower than the initial
temperature of combustion of MWCNTs used in this work, Ti = 460 ºC)[6].
When decorating the MWCNTs with PtOx or Pd(acac)2 nanoclusters, a decrease
of the carbon initial combustion temperature up to approximately 377 ºC (ΔTi =
30 ºC) was noticed (Figure 94). Furthermore, it was concluded that the highest
decrease of the combustion temperature of the MWCNTs occurs when these are
decorated with the metal precursor, cobalt acetylacetonate - Co(acac)3 -. An
initial temperature of combustion of around 227 ºC (ΔTi = 180 ºC) was obtained
with this metal (Figure 94). When using nickel acetylacetonate - Ni(acac)2 - a
decrease up to around 327 ºC (ΔTi = 80 ºC) was obtained (Figure 94).
Comparing these results with the Au/MWCNTs used in this work, a higher
activity was obtained when compared to almost all the other metal catalysts
except for the most active Co(a)/MWC catalyst (Figure 94). This Co catalyst was
able to start oxidising MWCNTs at 79 ºC and 27 ºC lower temperature than the

CHAPTER 5: OXIDATION OF CARBONACEOUS MATERIALS
205
Au(0.5wt%)/MWCNTs and Au(13wt%)/MWCNTs respectively (Table 28).
Nonetheless, this activity can be considered very similar since the pure
MWCNTs of the in-situ synthesised catalysts require a higher temperature to be
decomposed (460 ºC vs 407 ºC).
Figure 94. Comparison of the initial temperature difference of combustion of MWCNTs using in-situ Au ( ) or other metals ( )[6].
Table 28. Comparison of the catalytic activity of the in-situ synthesised catalysts and MWCNTs decorated with different metals.
Catalysts ΔTi (ºC)
Au(0.5wt%)/MWCNTs 101
Au(13wt%)/MWCNTs 153
Pd(a)-MWC / PtO-MWC[6] 30
Ni(a)-MWC[6] 80
Co(a)-MWC[6] 180
These results are then extremely satisfactory and clearly show the important
role of Au in the thermal decomposition of MWCNTs. However it is also
necessary to take into account the catalysts selectivity to CO2. Active catalysts
0 5 10 15 20 25 30
0
50
100
150
2000 Pd(a)-MWC PtO-MWC Ni(a)-MWC Co(a)-MWC
T i (ºC
)
Au loading (wt%)

CHAPTER 5: OXIDATION OF CARBONACEOUS MATERIALS
206
with higher capacity to oxidise CO to CO2 are required and preferable for the
complete soot combustion[7].
The temperature range at which CO conversion occurs corresponds to that
where MWCNTs are decomposed. As MWCNTs combustion starts at high
temperatures, the CO conversion to CO2 starts immediately as schematically
represented in Figure 95.
Figure 95. Schematic representation gold clusters ( ) on a carbon surface (a) and of the carbon oxidation followed by the CO released oxidation on a Au cluster surface (b).
Au atom: .
CO2 selectivity was determined according to Equation 16. High selectivities of
the order of 75% - 85% were obtained using in-situ Au/MWCNTs catalysts.
Importantly, the ability of the smallest gold (lower gold content catalysts) to
oxidise the CO was verified leading in this way to a higher CO2 selectivity
(Figure 96). As expected, the increase of the Au content/Au particle size led to a
lower CO2 selectivity (Figure 96). Nevertheless, the Au(0.1wt%)/MWCNTs
catalyst showed the lowest SCO2 of the different gold content in-situ catalysts.
This can be explained by the almost inexistence of Au in this catalyst. The
Au(23wt%)/MWCNTs catalyst, even though poorly, was also able to convert
some of the CO formed during the oxidation reaction. This is in accordance to
the previous results and confirms the coexistence of gold clusters on the
MWCNTs surface among larger Au nanoparticles. These small Au clusters are
then responsible for the selectivity to CO2 observed for this catalyst. Finally,
also corroborating the fact that large Au nanoparticles are not able to oxidise
the CO to CO2, it was observed that when using the Au15nm(0.5wt%)/MWNCTs
At. At. At. At.
At. At. At.
At. At.
CO (carbon oxidation)
CO (ads)
CO2(a) (b)
released oxidation: .At.
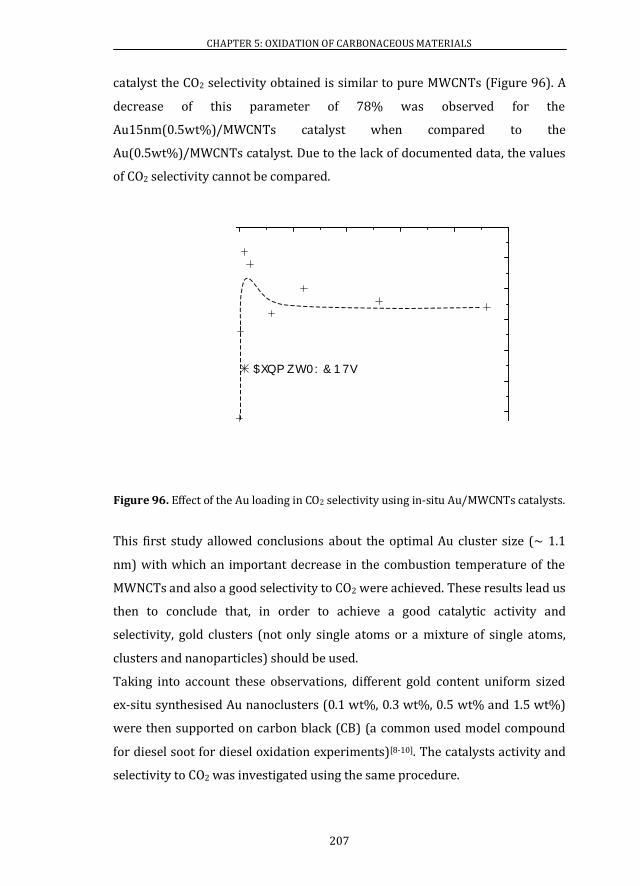
CHAPTER 5: OXIDATION OF CARBONACEOUS MATERIALS
207
catalyst the CO2 selectivity obtained is similar to pure MWCNTs (Figure 96). A
decrease of this parameter of 78% was observed for the
Au15nm(0.5wt%)/MWCNTs catalyst when compared to the
Au(0.5wt%)/MWCNTs catalyst. Due to the lack of documented data, the values
of CO2 selectivity cannot be compared.
Figure 96. Effect of the Au loading in CO2 selectivity using in-situ Au/MWCNTs catalysts.
This first study allowed conclusions about the optimal Au cluster size (~ 1.1
nm) with which an important decrease in the combustion temperature of the
MWNCTs and also a good selectivity to CO2 were achieved. These results lead us
then to conclude that, in order to achieve a good catalytic activity and
selectivity, gold clusters (not only single atoms or a mixture of single atoms,
clusters and nanoparticles) should be used.
Taking into account these observations, different gold content uniform sized
ex-situ synthesised Au nanoclusters (0.1 wt%, 0.3 wt%, 0.5 wt% and 1.5 wt%)
were then supported on carbon black (CB) (a common used model compound
for diesel soot for diesel oxidation experiments)[8-10]. The catalysts activity and
selectivity to CO2 was investigated using the same procedure.
2 7 32 37 42 4777
82
87
92
97
:2
:7
;2
"
"
UEQ4"*’
+
Cw"nqcfkpi "*y v’+
Cw37po *207yv’+ 1OY E P Vu
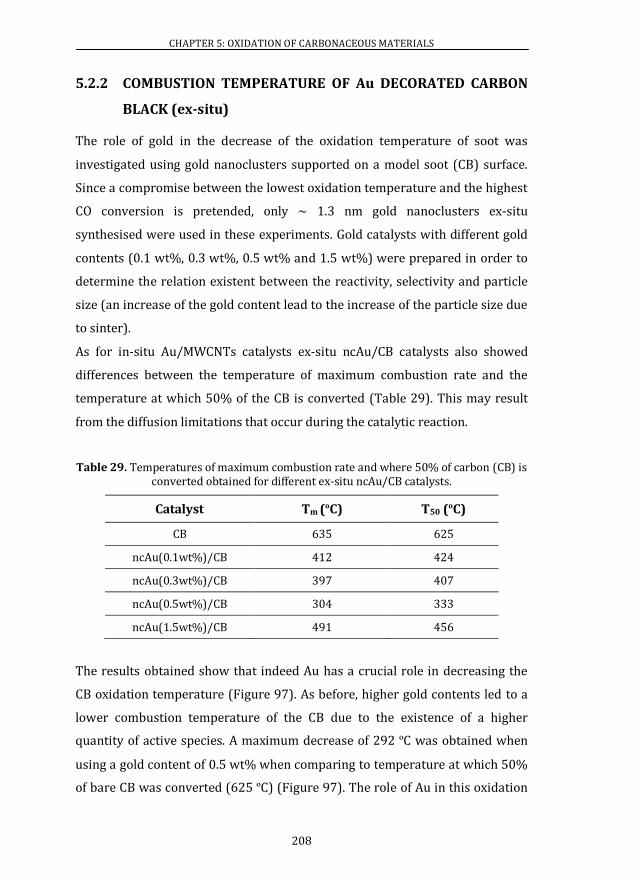
CHAPTER 5: OXIDATION OF CARBONACEOUS MATERIALS
208
5.2.2 COMBUSTION TEMPERATURE OF Au DECORATED CARBON
BLACK (ex-situ)
The role of gold in the decrease of the oxidation temperature of soot was
investigated using gold nanoclusters supported on a model soot (CB) surface.
Since a compromise between the lowest oxidation temperature and the highest
CO conversion is pretended, only ~ 1.3 nm gold nanoclusters ex-situ
synthesised were used in these experiments. Gold catalysts with different gold
contents (0.1 wt%, 0.3 wt%, 0.5 wt% and 1.5 wt%) were prepared in order to
determine the relation existent between the reactivity, selectivity and particle
size (an increase of the gold content lead to the increase of the particle size due
to sinter).
As for in-situ Au/MWCNTs catalysts ex-situ ncAu/CB catalysts also showed
differences between the temperature of maximum combustion rate and the
temperature at which 50% of the CB is converted (Table 29). This may result
from the diffusion limitations that occur during the catalytic reaction.
Table 29. Temperatures of maximum combustion rate and where 50% of carbon (CB) is converted obtained for different ex-situ ncAu/CB catalysts.
Catalyst Tm (ºC) T50 (ºC)
CB 635 625
ncAu(0.1wt%)/CB 412 424
ncAu(0.3wt%)/CB 397 407
ncAu(0.5wt%)/CB 304 333
ncAu(1.5wt%)/CB 491 456
The results obtained show that indeed Au has a crucial role in decreasing the
CB oxidation temperature (Figure 97). As before, higher gold contents led to a
lower combustion temperature of the CB due to the existence of a higher
quantity of active species. A maximum decrease of 292 ºC was obtained when
using a gold content of 0.5 wt% when comparing to temperature at which 50%
of bare CB was converted (625 ºC) (Figure 97). The role of Au in this oxidation
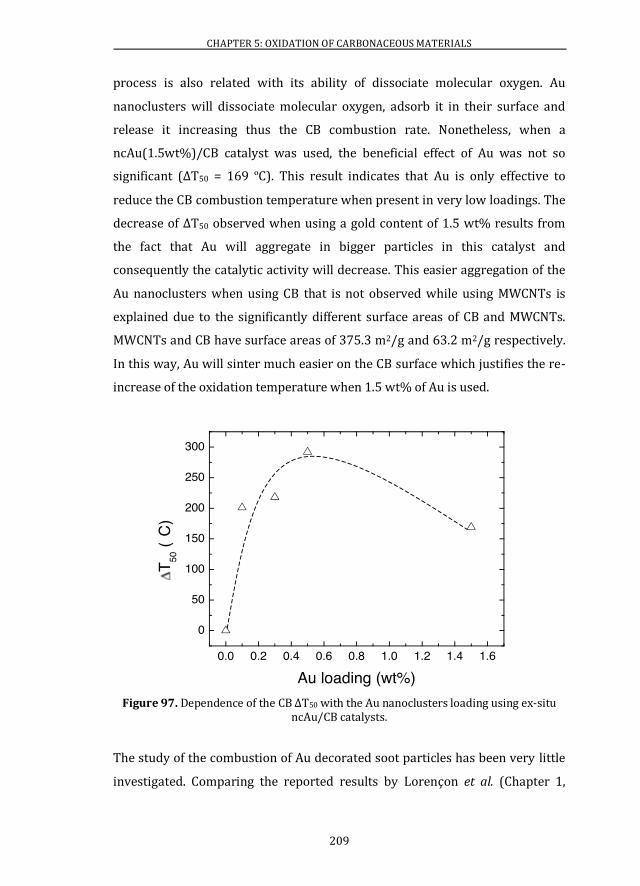
CHAPTER 5: OXIDATION OF CARBONACEOUS MATERIALS
209
process is also related with its ability of dissociate molecular oxygen. Au
nanoclusters will dissociate molecular oxygen, adsorb it in their surface and
release it increasing thus the CB combustion rate. Nonetheless, when a
ncAu(1.5wt%)/CB catalyst was used, the beneficial effect of Au was not so
significant (ΔT50 = 169 ºC). This result indicates that Au is only effective to
reduce the CB combustion temperature when present in very low loadings. The
decrease of ΔT50 observed when using a gold content of 1.5 wt% results from
the fact that Au will aggregate in bigger particles in this catalyst and
consequently the catalytic activity will decrease. This easier aggregation of the
Au nanoclusters when using CB that is not observed while using MWCNTs is
explained due to the significantly different surface areas of CB and MWCNTs.
MWCNTs and CB have surface areas of 375.3 m2/g and 63.2 m2/g respectively.
In this way, Au will sinter much easier on the CB surface which justifies the re-
increase of the oxidation temperature when 1.5 wt% of Au is used.
Figure 97. Dependence of the CB ΔT50 with the Au nanoclusters loading using ex-situ ncAu/CB catalysts.
The study of the combustion of Au decorated soot particles has been very little
investigated. Comparing the reported results by Lorençon et al. (Chapter 1,
0.0 0.2 0.4 0.6 0.8 1.0 1.2 1.4 1.6
0
50
100
150
200
250
300
T 50 (º
C)
Au loading (wt%)

CHAPTER 5: OXIDATION OF CARBONACEOUS MATERIALS
210
Section 1.6.2, Table 8) with the ones obtained using ncAu/CB catalysts,
promising results were observed[5]. The most active ex-situ ncAu/CB catalyst –
ncAu(0.5wt%)/CB – is able to start to oxidise carbon at 55 ºC lower
temperature than the most active catalyst reported (Au-soot-3.7) (Table 30).
Moreover, the bare CB used in this work and the soot used by Lorençon et al.
start to oxidise at similar temperatures (470 ºC and 460 ºC, respectively). This
highest activity surely results from the smallest Au particle size of the ex-situ
synthesised Au nanoclusters (~ 1.3 nm vs 3.7 nm) demonstrating clearly the
ability of these ex-situ nanoclusters to aid the combustion reaction by O2
dissociation. Moreover, a lower activity of the ncAu(1.5wt%)/CB when
compared to Au-soot-3.7 was observed (Table 30). This lower activity can be
explained by the Au sinter indicating that probably Au particles larger than 3.7
nm exist in this catalyst.
Table 30. Comparison of the activity of Au catalysts on the combustion of CB.
Catalysts ΔTi (ºC)
ncAu(0.5wt%)/CB 225
ncAu(1.5wt%)/CB 121
Au-soot-3.7[5] 170
All the different gold content ncAu/CB catalysts are selective towards CO2
(Figure 98). Similar selectivities between 67% and 75% were obtained for the
different Au content catalysts. A maximum selectivity was achieved for both
ncAu(0.3wt%)/CB or ncAu(0.5wt%)/CB catalysts. The slightly lower selectivity
of the ncAu(0.1wt%)/CB catalyst might be explained by the very low gold
content that exists in this catalyst. These results are in accordance with the
tendency noticed in Chapter 4 (Section 4.4, Figure 82) where a higher CO
conversion was obtained for the higher Au content catalyst (0.5 wt%). The 1.5
wt% ncAu catalyst showed a slight decrease of this parameter when compared
to the 0.3 wt% and 0.5 wt% due to the less efficient conversion of CO by large
Au nanoparticles. This observation is in accordance with the CB combustion
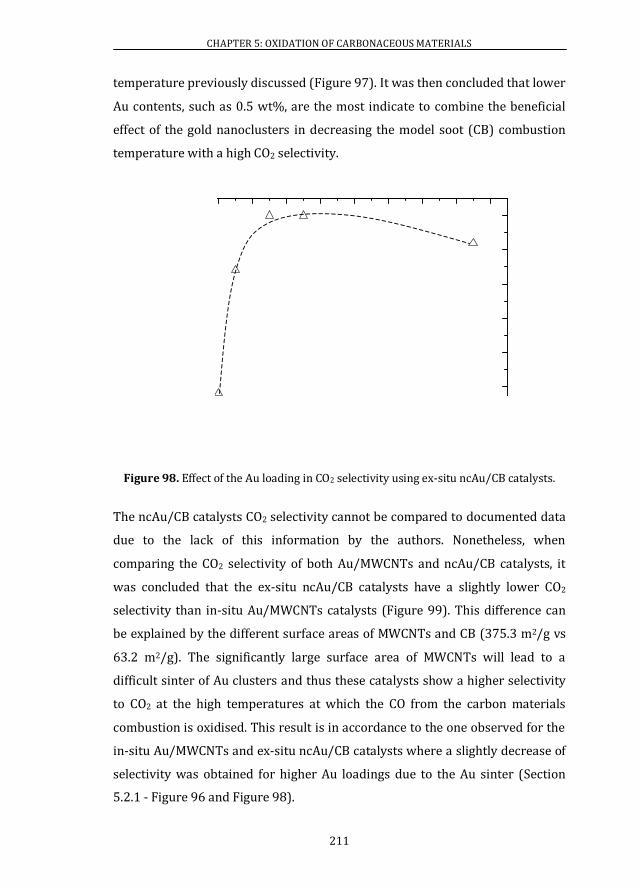
CHAPTER 5: OXIDATION OF CARBONACEOUS MATERIALS
211
temperature previously discussed (Figure 97). It was then concluded that lower
Au contents, such as 0.5 wt%, are the most indicate to combine the beneficial
effect of the gold nanoclusters in decreasing the model soot (CB) combustion
temperature with a high CO2 selectivity.
Figure 98. Effect of the Au loading in CO2 selectivity using ex-situ ncAu/CB catalysts.
The ncAu/CB catalysts CO2 selectivity cannot be compared to documented data
due to the lack of this information by the authors. Nonetheless, when
comparing the CO2 selectivity of both Au/MWCNTs and ncAu/CB catalysts, it
was concluded that the ex-situ ncAu/CB catalysts have a slightly lower CO2
selectivity than in-situ Au/MWCNTs catalysts (Figure 99). This difference can
be explained by the different surface areas of MWCNTs and CB (375.3 m2/g vs
63.2 m2/g). The significantly large surface area of MWCNTs will lead to a
difficult sinter of Au clusters and thus these catalysts show a higher selectivity
to CO2 at the high temperatures at which the CO from the carbon materials
combustion is oxidised. This result is in accordance to the one observed for the
in-situ Au/MWCNTs and ex-situ ncAu/CB catalysts where a slightly decrease of
selectivity was obtained for higher Au loadings due to the Au sinter (Section
5.2.1 - Figure 96 and Figure 98).
202 204 206 208 20: 302 304 306 30867
72
77
82
87
92
97
"
"
UEQ4"*’
+
Cw"nqcfkpi "*y v’+
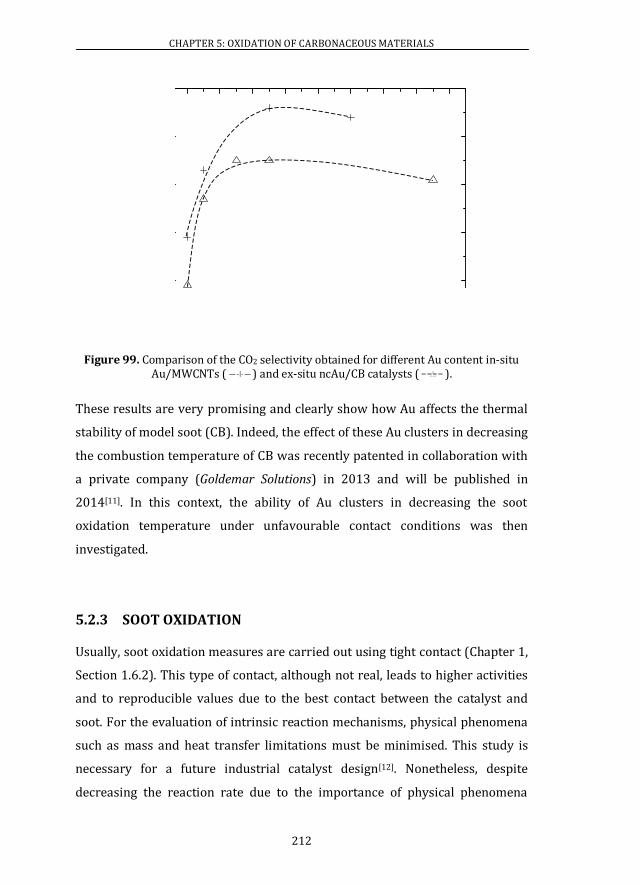
CHAPTER 5: OXIDATION OF CARBONACEOUS MATERIALS
212
Figure 99. Comparison of the CO2 selectivity obtained for different Au content in-situ Au/MWCNTs ( ) and ex-situ ncAu/CB catalysts ( ).
These results are very promising and clearly show how Au affects the thermal
stability of model soot (CB). Indeed, the effect of these Au clusters in decreasing
the combustion temperature of CB was recently patented in collaboration with
a private company (Goldemar Solutions) in 2013 and will be published in
2014[11]. In this context, the ability of Au clusters in decreasing the soot
oxidation temperature under unfavourable contact conditions was then
investigated.
5.2.3 SOOT OXIDATION
Usually, soot oxidation measures are carried out using tight contact (Chapter 1,
Section 1.6.2). This type of contact, although not real, leads to higher activities
and to reproducible values due to the best contact between the catalyst and
soot. For the evaluation of intrinsic reaction mechanisms, physical phenomena
such as mass and heat transfer limitations must be minimised. This study is
necessary for a future industrial catalyst design[12]. Nonetheless, despite
decreasing the reaction rate due to the importance of physical phenomena
202 204 206 208 20: 302 304 306 308
72
82
92
:2
;2
"
"
U EQ4"*’
+
Cw"nqcfkpi "*y v’+
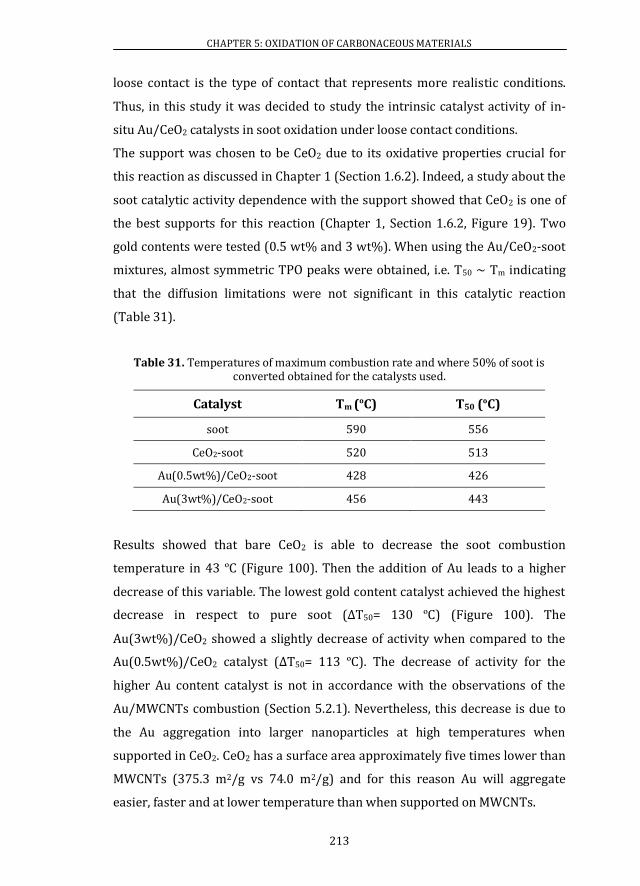
CHAPTER 5: OXIDATION OF CARBONACEOUS MATERIALS
213
loose contact is the type of contact that represents more realistic conditions.
Thus, in this study it was decided to study the intrinsic catalyst activity of in-
situ Au/CeO2 catalysts in soot oxidation under loose contact conditions.
The support was chosen to be CeO2 due to its oxidative properties crucial for
this reaction as discussed in Chapter 1 (Section 1.6.2). Indeed, a study about the
soot catalytic activity dependence with the support showed that CeO2 is one of
the best supports for this reaction (Chapter 1, Section 1.6.2, Figure 19). Two
gold contents were tested (0.5 wt% and 3 wt%). When using the Au/CeO2-soot
mixtures, almost symmetric TPO peaks were obtained, i.e. T50 ~ Tm indicating
that the diffusion limitations were not significant in this catalytic reaction
(Table 31).
Table 31. Temperatures of maximum combustion rate and where 50% of soot is converted obtained for the catalysts used.
Catalyst Tm (ºC) T50 (ºC)
soot 590 556
CeO2-soot 520 513
Au(0.5wt%)/CeO2-soot 428 426
Au(3wt%)/CeO2-soot 456 443
Results showed that bare CeO2 is able to decrease the soot combustion
temperature in 43 ºC (Figure 100). Then the addition of Au leads to a higher
decrease of this variable. The lowest gold content catalyst achieved the highest
decrease in respect to pure soot (ΔT50= 130 ºC) (Figure 100). The
Au(3wt%)/CeO2 showed a slightly decrease of activity when compared to the
Au(0.5wt%)/CeO2 catalyst (ΔT50= 113 ºC). The decrease of activity for the
higher Au content catalyst is not in accordance with the observations of the
Au/MWCNTs combustion (Section 5.2.1). Nevertheless, this decrease is due to
the Au aggregation into larger nanoparticles at high temperatures when
supported in CeO2. CeO2 has a surface area approximately five times lower than
MWCNTs (375.3 m2/g vs 74.0 m2/g) and for this reason Au will aggregate
easier, faster and at lower temperature than when supported on MWCNTs.

CHAPTER 5: OXIDATION OF CARBONACEOUS MATERIALS
214
Figure 100. Dependence of the soot ΔT50 with the Au loading using in-situ Au/CeO2 catalysts mixed with soot under loose contact conditions.
Figure 101. Effect of the Au loading in CO2 selectivity using in-situ Au/CeO2 catalysts mixed with soot under loose contact conditions.
Nevertheless, in terms of the in-situ Au/CeO2 catalysts CO2 selectivity a similar
value for bare CeO2 and both Au/CeO2 catalysts was obtained (Figure 101). This
result is similar to the one observed for CO oxidation using these catalysts
(Chapter 3, Section 3.6.2) indicating once again that in-situ synthesised
0.0 0.5 1.0 1.5 2.0 2.5 3.0
0
30
60
90
120
150
CeO2T 50 (º
C)
Au loading (wt%)
soot
0.0 0.5 1.0 1.5 2.0 2.5 3.030
40
50
60
70
80
90
100
CeO2-soot
soot
S CO
2 (%
)
Au loading (wt%)

CHAPTER 5: OXIDATION OF CARBONACEOUS MATERIALS
215
catalysts are not the most adequate to CO oxidation. Even though the ability of
these Au nanoclusters to decompose soot under unfavourable contact
conditions and the proximity of the liberated CO to Au clusters these are still
not be able to convert CO into CO2.
Despite the low CO2 selectivity, these results are very promising once that when
using real conditions (loose contact) these catalysts are able to reduce the soot
combustion temperature up to 426 ºC which is close to the temperature
required by an engine (300 ºC – 400 ºC) to perform this reaction[13]. The use of
ex-situ ncAu/CeO2 instead in-situ Au/CeO2 catalysts would probably improve
the CO conversion as it was observed for CO oxidation performed under a gas
flow (Chapter 4, Section 4.4).
The catalytic activity of the in-situ synthesised Au/CeO2 catalysts was
compared with the Au catalysts reported in literature for soot combustion
under loose contact conditions. A list of the Au catalysts used for soot oxidation
under loose contact conditions until now is presented in Table 32. The catalysts
activity is compared in terms of ΔT50, i.e. difference between the combustion
temperatures at which 50% of the soot is converted using bare soot and
catalyst-soot catalytic systems. Some authors report the activity of the
catalyst-soot systems in terms of the temperature of maximum combustion rate
(Tm). Despite the temperature profiles most of the times are not presented, it
was considered that Tm = T50 in order to compare literature data with the
results obtained in this work. As explained (Section 5.2.1), it was considered
that these temperatures are coincidental in approximation, since this would
only happen if there is only one type of active site and diffusion limitations do
not occur during the catalytic process affecting the reaction rate. Additionally,
also, the comparison of activities is made taking into account the atmosphere
used to carry out the reaction since the use of NO in the gases flows might
improve the soot oxidation by the formation of strong oxidant species.

CHAPTER 5: OXIDATION OF CARBONACEOUS MATERIALS
216
Table 32. Activity of different Au-based catalysts for soot oxidation under loose contact conditions.
Catalyst ID wt%
Au d (nm)
Soot/ catalyst
ratio
T50 (ºC)
ΔT50 (ºC)
Au/SiO2[7] CAu1 1.5 n.a. 1:10 590
(a), (b) 0
Au/ZrO2[13] CAu2 3.0 ~ 2
(1.5-5) 1:2
511 (a), (b)
21
Au/TiO2[13] CAu3 3.0 ~ 2
(1.5-5) 1:2
490 (a), (b)
42
Au-V/ZrO2[13] CAu4 3.0 ~ 2
(1.5-5) 1:2
478 (a), (b)
54
Au-V/TiO2[13] CAu5 3.0 ~ 2
(1.5-5) 1:2
419 (b)
113
Au/SiO2-CsNO3[7] CAu6 1.0 n.a. 1:10 467
(a), (b) 123
Au/(3DOM ZrO2)[14] CAu7 1.2 1.2 1:10 430
(c) 155
Au/(3DOM LaFeO3)[15] CAu8 n.a. ~ 3 1:10 368 (a), (c)
217
Au/(3DOM Ce0.9Zr0.1O2)[14] CAu9 1.3 3.3 1:10 361
(c) 224
Au/ZrO2-CsNO3 [7] CAu10 0.8 n.a. 1:10 360
(a), (b) 230
Au/(3DOM CeO2)[14] CAu11 1.3 3.4 1:10 349
(c) 236
(a)Temperature of the maximum combustion rate (b)Atmosphere: air (c)Atmosphere: 5 v/v% O2 and 0.2 v/v% NO balanced with Ar. ID – catalyst nomenclature.
When comparing the activity of the in-situ Au/CeO2 catalysts with those Au
catalysts presented in literature for soot oxidation interesting results are
obtained. In this comparison the catalysts with ΔT50 < 20 ºC (first catalyst in
Table 32) was excluded. Figure 102 shows the activity of Au catalysts reported
in literature for soot oxidation grouped by approximately the same Au loading.

CHAPTER 5: OXIDATION OF CARBONACEOUS MATERIALS
217
Figure 102. Catalytic activity comparison of in-situ Au/CeO2 catalysts ( ) and literature reported Au catalysts ( ) for soot oxidation under loose contact
conditions.
The combustion temperature of bare soot particles used in each experiment is
similar. A difference of ~ ±30 ºC exists between T50 of bare soot used in this
work (T50 = 556 ºC) and the bare soot of the catalysts described in literature
(T50 = 532 ºC - 590 ºC).
By Figure 102 it can be seen that the literature Au catalysts prepared with Au
loadings of 1 wt% and 1.3 wt% are in general slightly more active than the in-
situ Au/CeO2 catalysts, even though the soot mixed with the catalysts grouped
in these Au loadings is slightly more difficult to oxidise (T50, bare soot-literature ~ 590
ºC) than the one used in this work (T50, bare soot-Au/CeO2 = 556 ºC). These higher
activities result from the type of supports used in the different reported Au
catalysts and the type of atmosphere used to carry out the reaction. For
example, the 1 wt% catalysts described in literature (CAu6 and CAu10) have
CsNO3. It has been demonstrated that nitrates favour the soot oxidation
reaction[7, 16]. Indeed, the catalysts promoted with CsNO3 higher activity results
from their ability to oxidise soot. The reaction mechanism of CsNO3 catalysts
involves a first step of soot oxidation by nitrate ion reduction and a second step
0.0 0.5 1.0 1.5 2.0 2.5 3.0
0
50
100
150
200
250
T 50 (º
C)
Au loading (wt%)x
x
CHAPTER 5: OXIDATION OF CARBONACEOUS MATERIALS
218
of nitrate regeneration with oxygen from the gaseous phase[7]. Despite this
advantage, one of this CsNO3 catalysts (CAu6) has shown lower activity than the
in-situ Au(0.5wt%)/CeO2 catalyst.
Also, the catalysts prepared with approximately 1.3 wt% Au content (CAu7,
CAu9, CAu11) are the most active. The higher activities obtained for these
catalysts presented in literature can be explained by the use of 3DOM supports
and the fact that reactions were carried out in an atmosphere containing NO.
On the one hand, the 3DOM support significantly increases the activity for soot
oxidation due to the better contact between the catalyst and the soot particle.
The bigger pore sizes (> 100 nm) allow the soot particle (> 20 nm) to enter the
inner pores of the catalyst and to easily transport and diffuse[17, 18]. On the other
hand Au is able to adsorb the NO from the gas flow and generate superficial NO2
which is more oxidising than oxygen increasing therefore the catalytic
activity[7]. Thus, despite the larger Au particle size (∽ 3 nm) of some of the 1.3
wt% catalysts (CAu9, CAu11), these are more active than the in-situ Au/CeO2
catalysts.
Finally, all the catalysts prepared with a Au loading of 3 wt% (CAu2, CAu3,
CAu4, CAu5) show a lower activity than both Au(0.5wt%)/CeO2 and
Au(3wt%)/CeO2 catalysts. The in-situ Au/CeO2 catalysts, unlike the similar size
Au supported catalysts reported (Au/ZrO2 – CAu2, Au/TiO2 – CAu3, Au-V/ZrO2
– CAu4 and Au-V/TiO2 – CAu5), showed a high activity for soot oxidation being
able to reduce the T50 soot combustion temperature in 130 ºC when using a
Au(0.5wt%)/CeO2 catalyst. This result is extremely positive. Firstly, because
the soot used in this work is more difficult to oxidise than the one mixed with 3
wt% Au literature catalysts (T50, bare soot-literature = 532 ºC vs T50, bare soot-Au/CeO2 = 556
ºC), and secondly, because the Au literature catalysts mean particle diameter (d
∽ 2 nm) is close to the in-situ Au mean particle diameter of the Au(3wt%)/CeO2
catalyst (d ∽ 1.2 nm). Nevertheless, the co-existence of gold nanoparticles with
a size range between 1.5 nm and 5 nm in the CAu2, CAu3, CAu4 and CAu5
catalysts can explain their lowest activity. Larger gold nanoparticles will be less

CHAPTER 5: OXIDATION OF CARBONACEOUS MATERIALS
219
active for this reaction and, therefore, the existence of a higher quantity of small
Au clusters will favour the reaction due to the existence of more Au active sites.
All in all, these results are extremely satisfactory. The in-situ Au/CeO2 catalysts
are more active for soot oxidation than Au/supported similar sized catalysts
and with a similar gold content when using supports with similar
characteristics under the same atmosphere. The higher activities observed
under the same atmosphere were only due to the presence of nitrates in the
catalyst support. Additionally, Au/(3DOM support) catalysts in a NO
atmosphere also showed a higher catalytic activity.
Regarding CO conversion the authors that studied the soot oxidation using Au
catalysts refer CO2 selectivities of the order of 97.8 % using Au/(3DOM ZrO2)
catalysts to 99.7 % using Au/(3DOM LaFeO3) catalysts[14, 15]. The selectivity
obtained with the in-situ Au/CeO2 catalysts is slightly lower (around 80%)
since the effect of Au in CO oxidation using these catalysts was not observed
(Figure 101).
Then, the in-situ synthesised Au/CeO2 catalysts activity for soot oxidation was
also compared with a compilation of the most common used catalysts described
in literature for this reaction (Table 33). All the literature comparison was
made for catalysts mixed by loose contact and taking into account the different
atmospheres used to carry out the reaction (containing or non-containing NO
atmosphere).
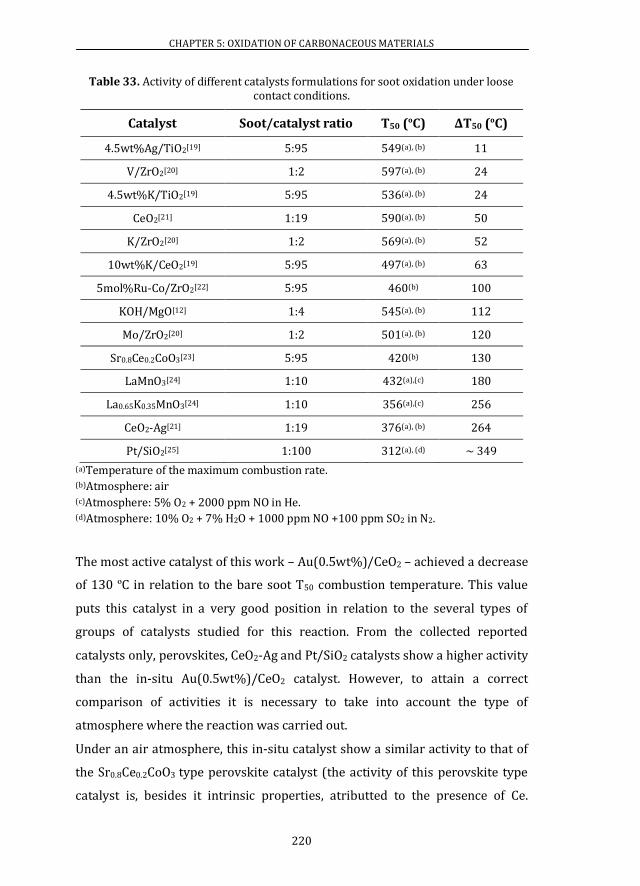
CHAPTER 5: OXIDATION OF CARBONACEOUS MATERIALS
220
Table 33. Activity of different catalysts formulations for soot oxidation under loose contact conditions.
Catalyst Soot/catalyst ratio T50 (ºC) ΔT50 (ºC)
4.5wt%Ag/TiO2[19] 5:95 549(a), (b) 11
V/ZrO2[20] 1:2 597(a), (b) 24
4.5wt%K/TiO2[19] 5:95 536(a), (b) 24
CeO2[21] 1:19 590(a), (b) 50
K/ZrO2[20] 1:2 569(a), (b) 52
10wt%K/CeO2[19] 5:95 497(a), (b) 63
5mol%Ru-Co/ZrO2[22] 5:95 460(b) 100
KOH/MgO[12] 1:4 545(a), (b) 112
Mo/ZrO2[20] 1:2 501(a), (b) 120
Sr0.8Ce0.2CoO3[23] 5:95 420(b) 130
LaMnO3[24] 1:10 432(a),(c) 180
La0.65K0.35MnO3[24] 1:10 356(a),(c) 256
CeO2-Ag[21] 1:19 376(a), (b) 264
Pt/SiO2[25] 1:100 312(a), (d) ~ 349
(a)Temperature of the maximum combustion rate. (b)Atmosphere: air (c)Atmosphere: 5% O2 + 2000 ppm NO in He. (d)Atmosphere: 10% O2 + 7% H2O + 1000 ppm NO +100 ppm SO2 in N2.
The most active catalyst of this work – Au(0.5wt%)/CeO2 – achieved a decrease
of 130 ºC in relation to the bare soot T50 combustion temperature. This value
puts this catalyst in a very good position in relation to the several types of
groups of catalysts studied for this reaction. From the collected reported
catalysts only, perovskites, CeO2-Ag and Pt/SiO2 catalysts show a higher activity
than the in-situ Au(0.5wt%)/CeO2 catalyst. However, to attain a correct
comparison of activities it is necessary to take into account the type of
atmosphere where the reaction was carried out.
Under an air atmosphere, this in-situ catalyst show a similar activity to that of
the Sr0.8Ce0.2CoO3 type perovskite catalyst (the activity of this perovskite type
catalyst is, besides it intrinsic properties, atributted to the presence of Ce.
CHAPTER 5: OXIDATION OF CARBONACEOUS MATERIALS
221
Apparently Ce contributes to the reaction by enhancing the redox properties of
the catalyst.). Moreover, from the rest of collected catalysts only the CeO2-Ag
catalyst is more active under an air atmosphere. The activity of the CeO2-Ag
catalyst with a “rice-ball” morpholopgy (Ag particles surrounded by fine CeO2
particles) has been attributed to the formation of xnO species. The oxygen
species adsorbed on the Ag surface migrate to the CeO2 surface by the Ag/CeO2
interface to form these species. These oxidising species migrate then to the soot
particles thus decreasing their combustion temperature[21].
Furthermore, under an NO containing atmosphere, perovskites catalysts
(LaMnO3 and La0.65K0.35MnO3) and the Pt/SiO2 catalyst are more active than the
in-situ Au(0.5wt%)/CeO2 catalyst. Nevertheless, when comparing these
catalysts activity it is necessary to take into account that their reaction
atmosphere contained NO that will favour the reaction and therefore lead to
higher activities. The activity of perovskite catalysts is related to its good
stability and ability to deliver oxygen species that will assist the soot oxidation.
Moreover, the addition of a metal like K increases its intrinsic activity, which
can be explained by different possibilities: La3+ is partially replace by K+ and
consequently a part of Mn3+ changed to Mn4+ that has a better catalytic
oxidation activity than Mn3+[24]; the addition of K will lead to an increase of
oxygen vacancies which consequently increases the adsorption and oxygen
activation at the catalyst surface. Another possible explanation is that La1-
xKxMnO3 nanoparticle perovskite-type will be formed. The particles on the
surface of these nanopaticles will be smaller and surface atoms on the
nanoparticle surface have a high mobility[24]. For these reasons the contact
between the soot and the catalyst is still good even under loose contact
conditions. Besides, the soot used in the perovskites reaction requires a higher
temperature to achieve 50% of conversion than the soot used in this work (T50,
bare soot-perovskites = 612 ºC vs T50, bare soot-Au/CeO2 = 556 ºC). Moreover, Pt catalysts are
one of the best catalytic systems known for soot combustion under loose
contact conditions[15, 24, 25]. Indeed, the Pt/SiO2 catalyst in a NO atmosphere is
able to decrease the soot combustion temperature in approximately 219 ºC

CHAPTER 5: OXIDATION OF CARBONACEOUS MATERIALS
222
(ΔT50, Pt/SiO2 - ΔT50, Au(0.5wt%)/CeO2 = 219 ºC) more than the Au(0.5wt%)/CeO2
catalyst.
It has been observed that in loose contact conditions the results obtained using
in-situ synthesised Au/CeO2 catalysts for soot oxidation are very promising.
These catalysts are able to decrease significantly the soot oxidation
temperature and show a higher activity than several reported gold or other
metal catalysts for the reaction carried out under the same atmosphere. Due to
the catalytic results obtained for CO oxidation (Chapter 4, Section 4.4), it is
believed that ex-situ Au catalysts would be even more efficient. A higher CO2
selectivity than when using in-situ catalysts would be probably obtained.
Moreover, carrying out experiments using tight contact also would increase
significantly the catalytic activity, as demonstrated by several authors[12, 20, 26,
27]. Modifications of the support with other elements such as transition or rare
earth metals in order to decrease the thermal deactivation of CeO2 at high
temperatures (stabilises the CeO2 surface area) and to improve the CeO2 redox
properties or the use of supports with higher pore sizes would also increase
significantly the Au/CeO2 catalytic activity in soot oxidation as discussed for
literature reported catalysts.
5.3 CONCLUSIONS
In this chapter, how Au affects the thermal stability of carbonaceous materials
was investigated for what might be the first time. Until now this field of
investigation has been explored very little.
It was concluded that MWCNTs oxidation temperature is significantly
decreased when these are decorated with gold (in-situ synthesis method).
Increasing the Au content up to 23 wt%, a decrease of the temperature at which
50% of MWCNTs are converted of 246 ºC is obtained. Furthermore, the in-situ
Au/MWCNTs catalyst with a gold loading of 0.5 wt% is the most selective to
CHAPTER 5: OXIDATION OF CARBONACEOUS MATERIALS
223
CO2. Thus, it was concluded that in order to have a compromise between a good
activity and selectivity, gold clusters catalysts must be used in this reaction.
Additionally, SEM characterisation corroborated the effect of Au in decreasing
the oxidation temperature of MWCNTs. By this technique it was noticed that,
when using a Au/MWCNTs catalyst, all the MWCNTs are decomposed at 400 ºC,
unlike undecorated MWCNTs which oxidation only starts at 460 ºC and
therefore their complete oxidation was only observed at 500 ºC. Comparing
these results with literature it was concluded that a stronger decrease of the
initial combustion temperature of MWCNTs was obtained using in-situ
Au/MWCNTs catalysts rather than the ~ 5.8 nm Au-MWCNTs catalyst (Au-
MWC-5.8) reported by Lorençon et al.. In-situ Au/MWCNTs catalysts also
showed a higher ability to decrease the initial combustion temperature of
MWCNTs than other similar sized metal catalysts such as Pt or Pd. A slightly
lower activity was obtained only when compared to a Co(a)-MWC catalyst.
Furthermore, using a model soot (CB) decorated with Au nanoclusters (ex-situ
synthesis method), the ability of Au to decrease the combustion temperature of
soot was verified. The higher ncAu/CB catalyst activity and selectivity was
noticed for the catalyst with a gold content of 0.5 wt% (ΔT50 = 292 ºC). It has
been noticed that low Au loadings are preferential to avoid Au agglomeration.
Importantly these results were patented in collaboration with a private
company (Goldemar Solutions) in 2013 and will be published in 2014.
Moreover, the most active catalyst - ncAu(0.5wt%)/CB - showed a higher
decrease of the carbon oxidation initial temperature than the catalyst of soot
decorated with 3.7 nm Au nanoparticles (Au-soot-3.7) studied by Lorençon et
al..
Finally, soot oxidation combustion using in-situ Au/CeO2 catalysts under loose
contact conditions revealed a high activity of these catalysts. A
Au(0.5wt%)/CeO2 catalyst was able to decrease the soot combustion
temperature up to 426 ºC (ΔT50 = 130 ºC), although it is not selective to CO2.
This catalyst has a higher activity than other Au/supported catalysts and than
almost all of the collected catalysts used in soot oxidation under loose contact
CHAPTER 5: OXIDATION OF CARBONACEOUS MATERIALS
224
conditions. A lower activity was observed only when compared to gold
catalysts promoted with CsNO3 and to the CeO2-Ag catalyst (NO non-containing
atmosphere) and to the Au/(3DOM support), to perovskites catalysts or to the
Pt/SiO2 catalyst (NO containing atmosphere).
Overall, the results obtained are very promising and lead to a new field of
investigation, about the effect of Au in the thermal stability of carbonaceous
materials, which has been until now hardly investigated.

CHAPTER 5: OXIDATION OF CARBONACEOUS MATERIALS
225
5.4 REFERENCES
[1] J. Turkevich, P. C. Stevenson, J. Hillier, Discussions of the Faraday Society
1951, 11, 55-75.
[2] J. L. Figueiredo, F. R. Ribeiro, Catálise Heterogênea, Lisboa, Fundação
Calouste Gulbenkian 1989.
[3] F. V. Caldas, R. R. de Cassia Moreira da Silva, A. de Almeida Rocha,
Engevista 2009, 11, 117-126.
[4] L. Alves, B. Ballesteros, M. Boronat, J. R. Cabrero-Antonino, P.
Concepción, A. Corma, M. A. Correa-Duarte, E. Mendoza Journal of the
American Chemical Society 2011, 133 (26), 10251-10261.
[5] E. Lorençon, R. G. Lacerda, L. O. Ladeira, R. R. Resende, A. S. Ferlauto, U.
Schuchardt, R. M. Lago, Journal of Thermal Analysis and Calorimetry
2011, 105, 953-959.
[6] A.-R. Leino, M. Mohl, J. Kikkola, P. Maki-Arvela, T. Kokkonen, A.
Schukarev, K. Kordas, Carbon 2013, 57, 99-107.
[7] M. L. Ruiz, I. D. Lick, M. I. Ponzi, E. Rodriguez-Castellón, A. Jiménez-
Lopez, E. N. Ponzi, Applied Catalysis A: General 2011, 392, 45-56.
[8] A. Bredin, A. V. Larcher, B. J. Mullins, Tribology International 2011, 44,
1642-1650.
[9] H. N. Sharma, L. Pahalagedara, A. Joshi, S. L. Suib, A. B. Mhadeshwar,
Energy Fuels 2012, 26, 5613-5625.
[10] M. Dhakad, S. Rayalu, J. Subrt, S. Bakardjieva, T. Mitsuhashi, H. Haneda,
S. Devotta, N. Labhsetwar, Current Science 2007, 92, 1125-1128.
[11] E. Mendoza Gómez, J. Llorca Piqué, L. Rodrigues Alves, E. Galindo, M.
Santiago Redondo, Patent submitted 2013, European Patent
Application No: 12382137.1.
[12] R. Jiménez, X. García, C. Cellier, P. Ruiz, A. L. Gordón, Applied Catalysis A:
General 2006, 297, 125-134.
[13] J. V. Craenenbroeck, D. Andreeva, T. Tabakova, K. V. Werde, J. Mullens,
F. Verpoort, Journal of Catalysis 2002, 209, 515-527.

CHAPTER 5: OXIDATION OF CARBONACEOUS MATERIALS
226
[14] Y. Wei, J. liu, Z. Zhao, A. Duan, G. Jiang, Journal of Catalysis 2012, 287,
13-29.
[15] Y. Wei, J. Liu, Z. Zhao, Y. Chen, C. Xu, A. Duan, G. Jiang, H. He,
Angewandte Chemie International Edition 2011, 50, 2326-2329.
[16] M. L. Ruiz I. D. Lick, M. S. L. Aparicio, M. I. Ponzi, E. Rodriguez-Castellón,
E. N. Ponzi, Industrial & Engineering Chemistry Research 2012, 51,
1150-1157.
[17] M. Sadakane, T. Horiuchi, N. Kato, C. Takahashi, W. Ueda, Chemistry of
Materials 2007, 19, 5779-5785.
[18] G. Zhang, Z. Zhao, J. Liu, G. Jiang, A. Duan, J. Zheng, S. Chen, R. Zhou,
Chemical Communications 2010, 46, 457-459.
[19] H. Shimokawa, Y. Kurihara, H. Kusaba, H. Einaga, Y. Teraoka, Catalysis
Today 2012, 185, 99-103.
[20] J. P. A. Neeft, M. Makkee, J. A. Moulijn, Applied Catalysis B:
Environmental 8 1996, 8, 57-58.
[21] K. Yamazaki, T. Kayama, F. Dong, H. Shinjoh, Journal of Catalysis 2011,
282, 289-298.
[22] M. Dhakad, D. Fino, S. S. Rayalu, R. Kumar, A. Watanabe, H. Haneda, S.
Devotta, T. Mitsuhashi, N. Labhsetwar, Topics in Catalysis 2007, 42-43,
273-276.
[23] M. Chakad, S. S. Rayalu, R. Kumar, P. Doggali, S. Bakardjieva, J. Subrt, T.
Mitsuhashi, H. Haneda, N. Labhsetwar, Catalysis Letters 2008, 121, 137-
143.
[24] H. Wang, Z. Zhao, C.-m. Xu, J. Liu, Catalysis Letters 2005, 102, 3-4, 251-
256.
[25] J. O. Uchisawa, A. Obuchi, Z. Zhao, S. Kushiyama, Applied Catalysis B:
Environmental 1998, 18, L183-L187.
[26] E. Aneggi, J. Llorca, C. de Leitenburg, G. Dolcetti, A. Trovarelli, Applied
Catalysis B 2009, 489-498.
[27] K. Yamazaki, T. Kayama, F. Dong, H. Shinjoh, Journal of Catalysis 2011,
282, 289-298.

CHAPTER 6:
GENERAL CONCLUSIONS


CHAPTER 6: GENERAL CONCLUSIONS
229
This thesis contributes to the field of development of new simple, reproducible
and environmentally friendly synthetic protocols which allow us to obtain
uniform stable populations of Au nanoclusters (d < 2 nm) or single Au atoms
deposited on nanostructured surfaces. Two different synthesis methods were
presented. The first (in-situ) was developed starting with a patented method
from our group to obtain Au clusters on amine surfaces. The second (ex-situ)
was newly developed for the first time based on a synthetic protocol utilised for
the sonochemical synthesis of Ag nanoclusters.
In this thesis a thorough characterisation of the prepared catalysts was carried
out. Thus the optimisation and understanding of how the Au mean diameter
might vary with different variables was achieved. The ability of these catalysts
to oxidise CO was investigated. Finally, the Au clusters contribution in
decreasing the combustion temperature of carbonaceous materials and their
activity for soot oxidation was also investigated.
This investigation presents the successful synthesis of in-situ Au clusters in
three different surfaces, namely MWCNTs-PAH, CeO2-PAH and TiO2-PAH
hybrids demonstrating the ability of this method to be further explored using
other supports covered with amine groups. Additionally, the synthesis of a
unique population of single Au atoms, until now scarcely reported, was
achieved by this in-situ protocol using Au loadings lower than 0.5 wt%. This
opens then a new field of investigation about these Au atoms activity in
different chemical reactions. Moreover, by aberration-corrected HRTEM it was
concluded that higher in-situ Au content catalysts (> 3 wt%) are not composed
by a unique population of Au clusters but by the coexistence of single Au atoms,
very small Au clusters (Aun, n = 2-3) or Au clusters (d ~ 1.1 nm). The quantity
of the lower sized species is decreased with the increase of the Au content.
Furthermore, HRTEM characterisation revealed that the mean Au particle size
of the in-situ synthesised catalysts is easily varied by simply changing the
nominal Au content. The Au mean diameter is increased for higher Au loadings.
Agglomeration of Au clusters was not observed up to a nominal Au content of

CHAPTER 6: GENERAL CONCLUSIONS
230
13 wt% but in-situ Au catalysts with a loading of 50 wt% showed the
coexistence of Au nanoclusters with large Au nanoparticles. It was also
observed that the support surface area also affects the Au particle size. Lower
support surface areas lead to an increase of the Au particle size when using the
same Au content. Thus, using the same Au content, the Au particle size
decreases in the following order: TiO2 > CeO2 > MWCNTs. XPS characterisation
revealed that in-situ Au/MWCNTs, independently of the Au content (up to 3
wt%), are composed only by positively charged Au (Auδ+). This positive charge
was attributed to oxygen species bonded to the Au surface. In-situ Au/CeO2 and
Au/TiO2 catalysts are composed by both cationic (Auδ+) and metallic (Au0) gold
species. It was noticed that the quantity of metallic Au species rises with the
increase of the Au particle size. Finally, it was concluded that the in-situ
protocol is not the most adequate to prepare active CO oxidation catalysts. The
surface of both CeO2 and gold is covered by intermediate species of the gold
synthesis reaction. This limits dramatically the catalytic activity of the material,
specially at low temperature. Thus, another synthetic protocol (ex-situ) to
obtain Au clusters catalysts was developed.
Using a new clean sonochemical synthetic protocol (ex-situ) an uniform
population of Au nanoclusters (d < 2 nm) was obtained. The polymer PMAA
acted as reducing and capping agent. Au nanoclusters with a mean diameter of
1.3 nm were obtained using a concentration of Au of 0.02 mg/mL and a
AuRCO //2 molar ratio of 0.5. By AFM characterisation an increase of the Au
nanoparticles (d > 2 nm) in solution for higher 2RCO /Au molar ratios was
noticed. Furthermore, ex-situ gold catalysts were for the first time successfully
prepared by anchoring these pre-synthesised Au nanoclusters to
MWCNTs-PAH, CeO2-PAH or TiO2-PAH surfaces by a simple 15 minutes
ultrasonication. Ex-situ ncAu/support catalysts with a mean diameter of
approximately 1.4±0.4 nm were obtained. XPS characterisation revealed that
ex-situ ncAu/CeO2 catalysts are composed only by metallic gold (Au0).
Additionally, for the first time the activity of supported sonochemical prepared
Au nanoclusters catalysts was reported. It was observed that ex-situ ncAu/CeO2
CHAPTER 6: GENERAL CONCLUSIONS
231
catalysts are active for CO oxidation. These catalysts showed a lower activity
than the Au/CeO2 catalysts usually prepared by deposition-precipitation but a
similar activity to the ones prepared by co-precipitation. Thus, based on the CO
oxidation activity results of the ex-situ ncAu/CeO2 catalysts, it was verified that
the presence of metallic Au is essential for this reaction.
Additionally, it was concluded that Au clusters synthesised by both in-situ or
ex-situ protocols decrease the thermal stability of carbon materials such as
MWCNTs or CB. By SEM characterisation, it was noticed that MWCNTs doped
with 3 wt% of Au (in-situ) were all decomposed at 400 ºC while bare MWCNTs
were only decomposed at 500 ºC. It was observed that Au clusters are the most
active species in the combustion reaction of carbonaceous materials and that
higher CO2 selectivities were obtained for lower gold contents (lower Au
particle size).
Finally, it was demonstrated that in-situ Au/CeO2 catalysts mixed by loose
contact with soot were able to decrease the soot oxidation temperature
although they were not selective to CO2. A Au(0.5wt%)/CeO2 catalyst decreased
this temperature down to 426 ºC (ΔT50 = 130 ºC). These results were
comparable to or even better than most of other common used catalysts for this
reaction. Prior to this study, Au catalysts had been scarcely used for soot
oxidation reaction thus opening a new field of investigation. In order to achieve
both good activity and CO2 selectivity, the use of ex-situ instead of in-situ Au
clusters can be a good alternative.

ANNEXES


ANNEXES
235
A.1 DETERMINATION OF THE NOMINAL NUMBER OF
Au CLUSTERS PER MWNCT
The nominal number of Au clusters per MWCNT presented in Chapter 3
(Section 3.3.2, Figure 40) was determined considering a nanotube with 100 nm
of length and 10 nm of diameter in accordance with Equations 18 to 24.
MWCNTsnr
clustersAunrMWCNTperclustersAuofNumber
.
.nr (18)
where,
MWCNTperclustersAuofNumber – nominal number of Au clusters per
MWCNT.
clustersAunr . – number of Au clusters in the catalyst.
MWCNTsnr. – number of MWCNTs in the catalyst.
clusterAu
Au
m
mclustersAunr. (19)
where,
Aum – total mass of Au in the catalyst, in mg.
clusterAum – mass of a Au cluster, in mg.
catalystAu mloadingAu
m mAu
100 (20)
where,
loadingAu – nominal Au loading in wt%.
catalystm – total catalyst mass, in mg.
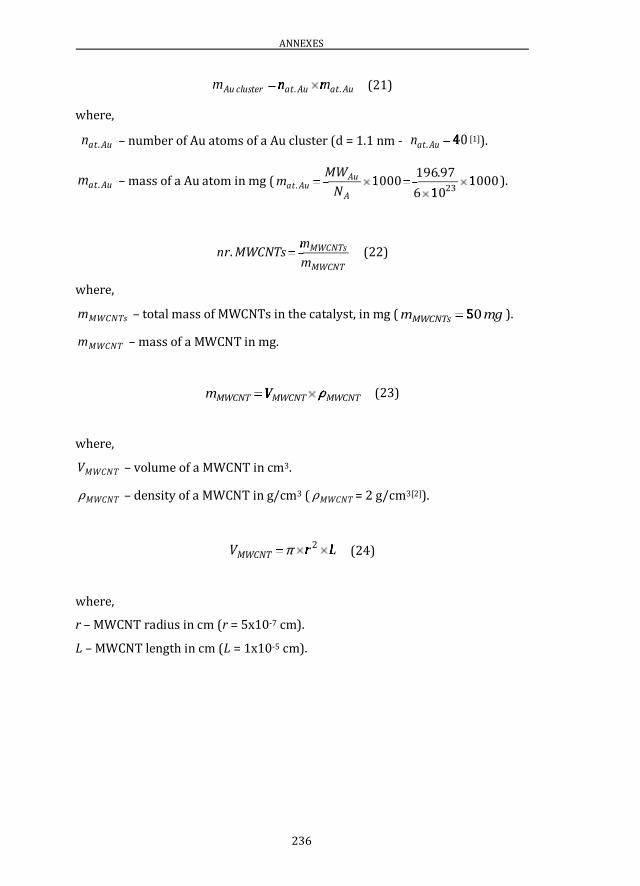
ANNEXES
236
AuatAuatclusterAu mnm .. mn (21)
where,
Auatn . – number of Au atoms of a Au cluster (d = 1.1 nm - 4040Auatn .[1]).
Auatm . – mass of a Au atom in mg ( 1000106
971961000
231000
10
1961000
..
A
AuAuat
N
MWm ).
MWCNT
MWCNTs
m
mMWCNTsnr
m. (22)
where,
MWCNTsm – total mass of MWCNTs in the catalyst, in mg ( mgmMWCNTs 5050 ).
MWCNTm – mass of a MWCNT in mg.
MWCNTMWCNTMWCNT Vm ρρV (23)
where,
MWCNTV – volume of a MWCNT in cm3.
MWCNTρ – density of a MWCNT in g/cm3 ( MWCNTρ = 2 g/cm3[2]).
LrVMWCNT Lr 2π (24)
where,
r – MWCNT radius in cm (r = 5x10⁻⁷ cm).
L – MWCNT length in cm (L = 1x10⁻⁵ cm).
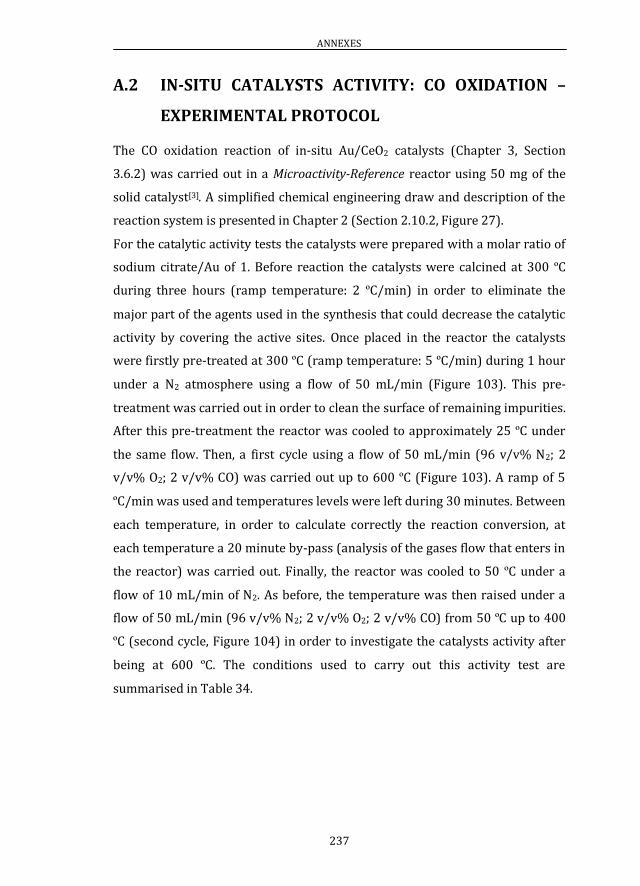
ANNEXES
237
A.2 IN-SITU CATALYSTS ACTIVITY: CO OXIDATION –
EXPERIMENTAL PROTOCOL
The CO oxidation reaction of in-situ Au/CeO2 catalysts (Chapter 3, Section
3.6.2) was carried out in a Microactivity-Reference reactor using 50 mg of the
solid catalyst[3]. A simplified chemical engineering draw and description of the
reaction system is presented in Chapter 2 (Section 2.10.2, Figure 27).
For the catalytic activity tests the catalysts were prepared with a molar ratio of
sodium citrate/Au of 1. Before reaction the catalysts were calcined at 300 ºC
during three hours (ramp temperature: 2 ºC/min) in order to eliminate the
major part of the agents used in the synthesis that could decrease the catalytic
activity by covering the active sites. Once placed in the reactor the catalysts
were firstly pre-treated at 300 ºC (ramp temperature: 5 ºC/min) during 1 hour
under a N2 atmosphere using a flow of 50 mL/min (Figure 103). This pre-
treatment was carried out in order to clean the surface of remaining impurities.
After this pre-treatment the reactor was cooled to approximately 25 ºC under
the same flow. Then, a first cycle using a flow of 50 mL/min (96 v/v% N2; 2
v/v% O2; 2 v/v% CO) was carried out up to 600 ºC (Figure 103). A ramp of 5
ºC/min was used and temperatures levels were left during 30 minutes. Between
each temperature, in order to calculate correctly the reaction conversion, at
each temperature a 20 minute by-pass (analysis of the gases flow that enters in
the reactor) was carried out. Finally, the reactor was cooled to 50 ºC under a
flow of 10 mL/min of N2. As before, the temperature was then raised under a
flow of 50 mL/min (96 v/v% N2; 2 v/v% O2; 2 v/v% CO) from 50 ºC up to 400
ºC (second cycle, Figure 104) in order to investigate the catalysts activity after
being at 600 ºC. The conditions used to carry out this activity test are
summarised in Table 34.

ANNEXES
238
Figure 103. Schematic representation of the CO oxidation catalytic activity test for in-situ Au/CeO2 catalysts (pre-treatment and 1st cycle).

ANNEXES
239
Figure 104. Schematic representation of the CO oxidation catalytic activity test for
in-situ Au/CeO2 catalysts (2nd cycle).
Table 34. CO oxidation reaction conditions for in-situ Au/CeO2 catalysts.
Catalyst mass (mg) 50
Flow (mL/min) 50
WHSV (mL.h-1.gcat.-1) 60 000
Contact time (s) 0.08
The values of weight hourly space velocity (WHSV) and contact time, presented
in Table 34, were determined according to Equations 25 and 26.

ANNEXES
240
catalystm
FWHSV (25)
where,
WHSV - weight hourly space velocity in mL.h-1.g-1.
F - total gases flow fed to the reactor in mL/h (F = 3000 mL/h).
catalystm - catalyst mass in g ( catalystm = 0.05 g).
F
LRtimeContact
.. 2ππ (26)
where,
timeContact - contact time in seconds.
R - ratio of the quartz tube in cm (R = 0.46 cm).
L - height of the catalytic bed in cm (L ~ 0.1 cm).
F - total gases flow fed to the reactor in mL/s (F = 0.8 mL/s).
The comparison of the catalytic activities observed with the documented values
is difficult due to the different conditions used to carry out the reaction, namely
catalyst weight, CO/O2 ratio, flow-rate etc.. Along these lines, in this work the
catalytic activity is measured and compared in terms of reaction rate, i.e. all the
conversion values experimentally obtained were normalised to mol of CO
converted per unit of second and square meter of gold. In this way, the values of
CO conversion were firstly determined (Equation 27) and then normalised
according to Equation 28. The value of the Au area was determined by Equation
29 considering that all the gold was on the support surface available for
reaction. The diameter of the Au catalysts used to determine the catalytic
activity in terms of reaction rate was that obtained by HRTEM for the
Au(3wt%)/CeO2 catalyst (d = 1.2 nm). The diameter of a single Au atom (0.1
wt% and 0.5 wt% catalysts) was considered to be 0.27 nm as reported by
Slater[4].

ANNEXES
241
100100in
outin
conversionCO
COCOCO (27)
where,
conversionCO - carbon monoxide conversion in %.
inCO - CO quantity that enters in the reactor.
outCO - CO quantity that exists the reactor.
Aum
conversionin
AV
COCOF
rateaction1100100
A
CO%
Re (28)
where,
rateactionRe - molar quantity of CO converted per second and square meter
of gold in mol.s-1.mAu-2.
F - total gases flow fed to the reactor in mL/s (F = 0.8 mL/s).
inCO% - percentage of CO in volume in the feed mixture ( %/% vvCOin 22 ).
conversionCO - carbon monoxide conversion in %.
mV - molar volume of an ideal gas at 1 atmosphere of pressure and 0 ºC
)/( molmLVm 2240022400 .
AuA - area of Au on the surface of the support in m2.
rd
mA
Au
AuAu
33
d
m (29)
where,
AuA - area of Au on the surface of the support in m2.
Aum - mass of Au in the catalyst in g (determined by Equation 20).
Aud - density of Au (3610319 mgdAu /. 1019 ).
r - the radius of the mean Au cluster diameter in m.

ANNEXES
242
A.3 EX-SITU CATALYSTS ACTIVITY: CO OXIDATION –
EXPERIMENTAL PROTOCOL
The CO oxidation reaction of the ex-situ Au/CeO2 catalysts (Chapter 4, Section
4.4) was carried out in the same reaction system as the in-situ catalysts
presented and described in Chapter 2 (Section 2.10.2, Figure 27). In these
experiments 100 mg of powder catalyst were used. Activity tests were carried
out using the conditions registered in Table 35. The values of weight hourly
space velocity (WHSV) and contact time were determined by Equations 25 and
26 respectively (Section A.2). For these catalysts, the height of the catalytic bed
(L) was approximately 0.3 cm.
Table 35. CO oxidation reaction conditions for ex-situ ncAu/CeO2 catalysts.
Catalyst mass (mg) 100
Flow (mL/min) 100
WHSV (mL.h-1.gcat.-1) 60 000
Contact time (s) 0.1
Before entering the reactor, in order to increase the catalytic activity, the
catalysts were calcined during three hours at 300 ºC (ramp: 2 ºC/min). In this
way, the major part of the reagents used during the synthesis were eliminated,
leading to the increase of the number of the active sites available to reaction.
Once placed in the quartz reactor, the catalysts were firstly pre-treated for one
hour at 300 ºC (ramp: 3 ºC/min) under a 100 mL/min N2 flow in order to
remove any remaining impurities from the catalyst surface (Figure 105). Then,
the cooling of the reactor down to approximately 30 ºC was followed by a
consequent increase of temperature up to 350 ºC under the 100 mL/min
reaction flow (96 v/v% N2; 2 v/v% O2; 2 v/v% CO) (first cycle) (Figure 105). A
ramp of 5 ºC/min was used and each temperature analysed was left stable for
30 minutes. Between each temperature, a 20 minute by-pass analysis was
carried out in order to measure the gases quantities that enter in the reactor.
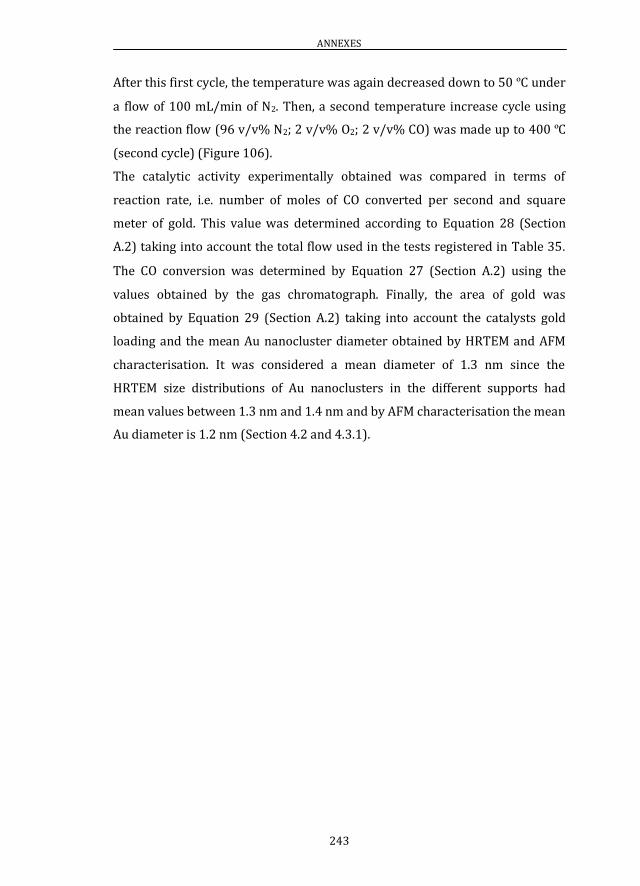
ANNEXES
243
After this first cycle, the temperature was again decreased down to 50 ºC under
a flow of 100 mL/min of N2. Then, a second temperature increase cycle using
the reaction flow (96 v/v% N2; 2 v/v% O2; 2 v/v% CO) was made up to 400 ºC
(second cycle) (Figure 106).
The catalytic activity experimentally obtained was compared in terms of
reaction rate, i.e. number of moles of CO converted per second and square
meter of gold. This value was determined according to Equation 28 (Section
A.2) taking into account the total flow used in the tests registered in Table 35.
The CO conversion was determined by Equation 27 (Section A.2) using the
values obtained by the gas chromatograph. Finally, the area of gold was
obtained by Equation 29 (Section A.2) taking into account the catalysts gold
loading and the mean Au nanocluster diameter obtained by HRTEM and AFM
characterisation. It was considered a mean diameter of 1.3 nm since the
HRTEM size distributions of Au nanoclusters in the different supports had
mean values between 1.3 nm and 1.4 nm and by AFM characterisation the mean
Au diameter is 1.2 nm (Section 4.2 and 4.3.1).
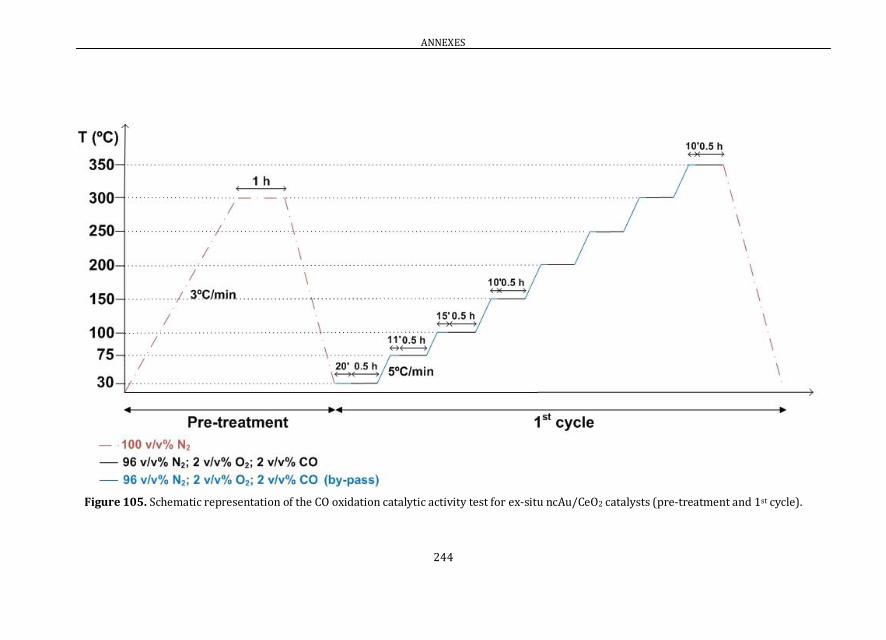
ANNEXES
244
Figure 105. Schematic representation of the CO oxidation catalytic activity test for ex-situ ncAu/CeO2 catalysts (pre-treatment and 1st cycle).
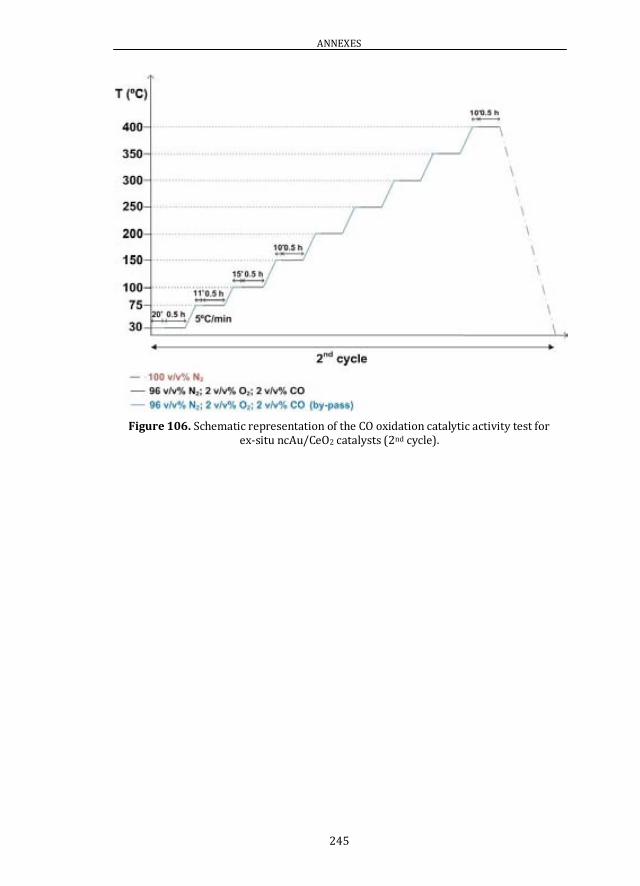
ANNEXES
245
Figure 106. Schematic representation of the CO oxidation catalytic activity test for ex-situ ncAu/CeO2 catalysts (2nd cycle).

ANNEXES
246
A.4 REFERENCES
[1] T. G. Schaaff, M. N. Shafigullin, J. T. Khoury, I. Vezmar, R. L. Whetten, W.
G. Cullen, P. N. First, J. Phys. Chem. B 1997, 101, 7885-7891.
[2] http://www.nanocyl.com/en/CNT-Expertise-Centre/Carbon-Nanotubes,
consulted 07/01/2014.
[3] http://www.pidengtech.com/thereference.html, consulted 12/02/2014.
[4] J. C. Slater, The Journal of Chemical Physics 1964, 41, 3199-3203.

This doctoral thesis is about the synthesis and the catalytic activity study of gold
particles with a diameter lower than 2 nm, gold nanoclusters. The interest is due to
the catalytic activity that gold has at room temperature when its size is less than
approximately 5 nm.
In this thesis, two distinct synthesis’ methods that allow stable gold clusters with a
well defined particle size to be obtained have been developed. In one method, gold
clusters with a narrow size distribution and a particle diameter less than 2 nm are
firstly synthesised and then deposited on a support. In the other method, gold clusters
are directly synthesised on the selected support. In the latter method, the size of gold
can be easily varied by simply altering the gold precursor quantity during the
synthesis process. Thus, uniformly dispersed isolated gold atoms, 2 nm Au clusters or
nanoparticles larger than 10 nm can be obtained on the material support surface.
The synthesised catalysts were characterised using distinct physico-chemical
techniques: HRTEM, SEM, AFM, XPS and XAS. Additionally, their catalytic activity was
investigated for the oxidation of CO and carbonaceous materials. Finally, the particle
size was related with the catalytic activity of the material.