synergistic effect of zinc stearate and natural zeolite on...
TRANSCRIPT
Synergistic Effect of Zinc Stearate and Natural Zeolite
on PVC Thermal Stability
By
Sevdiye ATAKUL
A Dissertation Submitted to the
Graduate School in Partial Fulfillment of the
Requirement for the Degree of
MASTER OF SCIENCE
Department: Chemical Engineering
Major: Chemical Engineering
Ýzmir Institute of Technology
Ýzmir, Turkey
We approve the thesis of Sevdiye ATAKUL
Date of Signature
………………………………………….. 30.01.2004
Prof. Dr. Devrim BALKÖSE
Supervisor
Department of Chemical Engineering
………………………………………….. 30.01.2004
Prof. Dr. Semra ÜLKÜ
Co-Supervisor
Department of Chemical Engineering
………………………………………….. 30.01.2004
Assoc. Prof. Dr. Sevgi ULUTAN
Department of Chemical Engineering
………………………………………….. 30.01.2004
Assist. Prof. Dr. Selahattin YILMAZ
Department of Chemical Engineering
………………………………………….. 30.01.2004
Assist. Prof. Dr. Fikret ÝNAL
Department of Chemical Engineering
………………………………………….. 30.01.2004
Prof. Dr. Devrim BALKÖSE
Head of Department
ACKNOWLEDGEMENT
The financial support of this project Technical and Scientific Research Council of
Turkey (TÜBÝTAK) (Misag-185) is gratefully acknowledged. I would like to express
my sincere gratitude to my advisors Prof. Devrim Balköse and Prof. Semra Ülkü for
their support, guidance and encouragement during this study and the preparation of the
thesis.
I am very grateful to Burcu Alp and Mehmet Gönen for their help, encouragement and
friendship throughout this project. I want to express my thanks for the experts of
IZTECH Center For Material Research (CMR). I appreciate the help of Seda Alper, for
UV analysis, Filiz Özmýhçý and Gülnihal Yelken for TGA analysis and Özlem Çaðlar
Duvarcý for FTIR analysis.
I also present my deepest thanks to my officemates, Hacer Yenal, Metin Becer, ªule
Uçar, Yýlmaz Yürekli and all other friends for their friendship and encouragement. I
would like to thank Sever Can, Hülya Eser and C.Aykut Erdoðdu for their friendship
and understandings during this study.
Finally, my thanks go to my family for their help and encouragement during the
preparation of the thesis.
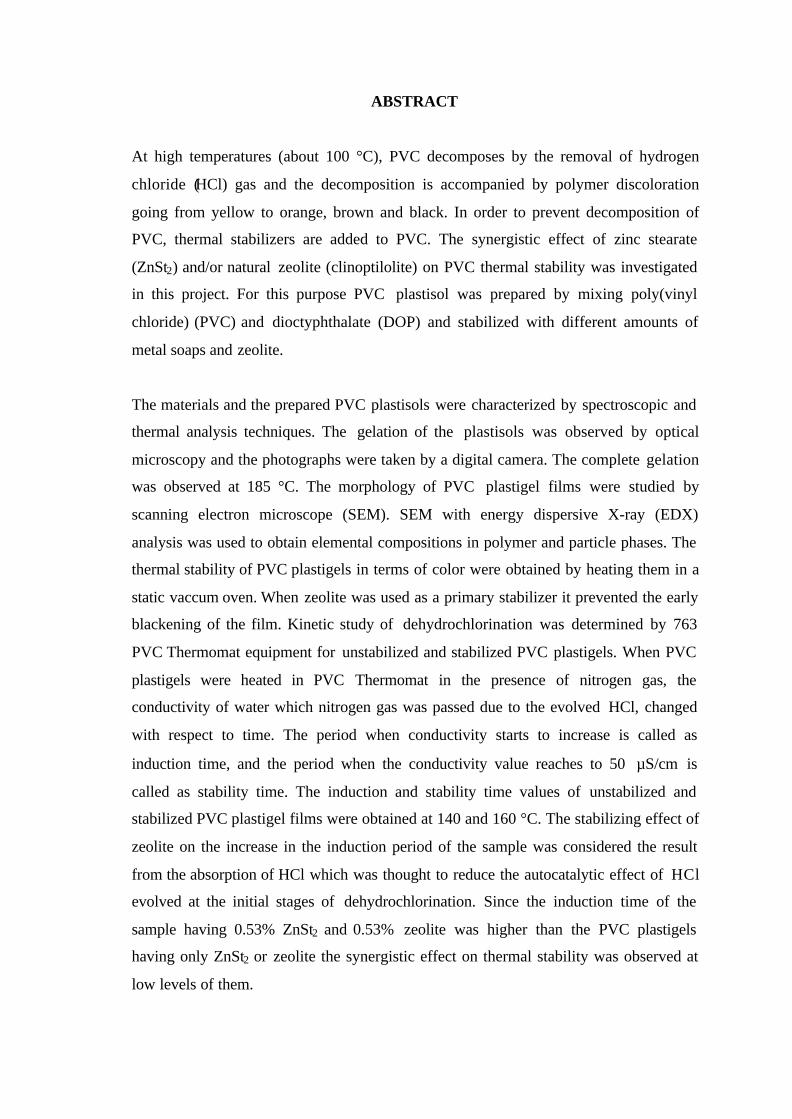
ABSTRACT
At high temperatures (about 100 °C), PVC decomposes by the removal of hydrogen
chloride (HCl) gas and the decomposition is accompanied by polymer discoloration
going from yellow to orange, brown and black. In order to prevent decomposition of
PVC, thermal stabilizers are added to PVC. The synergistic effect of zinc stearate
(ZnSt2) and/or natural zeolite (clinoptilolite) on PVC thermal stability was investigated
in this project. For this purpose PVC plastisol was prepared by mixing poly(vinyl
chloride) (PVC) and dioctyphthalate (DOP) and stabilized with different amounts of
metal soaps and zeolite.
The materials and the prepared PVC plastisols were characterized by spectroscopic and
thermal analysis techniques. The gelation of the plastisols was observed by optical
microscopy and the photographs were taken by a digital camera. The complete gelation
was observed at 185 °C. The morphology of PVC plastigel films were studied by
scanning electron microscope (SEM). SEM with energy dispersive X-ray (EDX)
analysis was used to obtain elemental compositions in polymer and particle phases. The
thermal stability of PVC plastigels in terms of color were obtained by heating them in a
static vaccum oven. When zeolite was used as a primary stabilizer it prevented the early
blackening of the film. Kinetic study of dehydrochlorination was determined by 763
PVC Thermomat equipment for unstabilized and stabilized PVC plastigels. When PVC
plastigels were heated in PVC Thermomat in the presence of nitrogen gas, the
conductivity of water which nitrogen gas was passed due to the evolved HCl, changed
with respect to time. The period when conductivity starts to increase is called as
induction time, and the period when the conductivity value reaches to 50 µS/cm is
called as stability time. The induction and stability time values of unstabilized and
stabilized PVC plastigel films were obtained at 140 and 160 °C. The stabilizing effect of
zeolite on the increase in the induction period of the sample was considered the result
from the absorption of HCl which was thought to reduce the autocatalytic effect of HCl
evolved at the initial stages of dehydrochlorination. Since the induction time of the
sample having 0.53% ZnSt2 and 0.53% zeolite was higher than the PVC plastigels
having only ZnSt2 or zeolite the synergistic effect on thermal stability was observed at
low levels of them.
ÖZ
PVC yüksek sýcaklýklarda (100 °C) hidrojen klorür (HCl) gazý çýkararak bozunur ve bu
bozunma polimerin renginin sarýdan turuncuya daha sonrada kahverengi ve siyaha
dönüþmesiyle birlikte gerçekleþir. PVC’nin bozunmasýný önlemek için ýsýl kararlý
kýlýcýlar PVC’ ye eklenir. Bu çalýþmada, çinko stearat (ZnSt2) ve doðal zeolitin PVC’nin
ýsýl kararlýlýðýna sinerjistik etkisi incelenmiþtir. Bu amaçla PVC ve DOP’un
karýþtýrýlmasýyla PVC plastisolleri hazýrlanmýþ ve bu karýþýmlara farklý miktarlarda
metal sabunlarý ve doðal zeolit eklenmiþtir.
Bu proje kapsamýnda kullanýlan malzemeler ve hazýrlanan PVC plastisolleri
spektroskopik ve termal analiz teknikleriyle karakterize edilmiºtir. PVC plastisollerin
jelleþme davranýþlarý optik mikroskopla incelenmiþ ve farklý sýcaklýklarda mikro
fotoðraflarý çekilmiþtir. Jelleþmenin 185 °C’ de çok kýsa sürede gerçekleþtiði
gözlemlenmiþtir. PVC plastijellerin morfolojisi elektron taramalý mikroskobu ile
çalýþýlmýþ, elementlerin polimer ve tanecik fazýndaki kompozisyonlarýný elde etmek için
EDX analizi yapýlmýþtýr. Ayrýca filmler vakumlu etüvde 140 ve 160 °C’ de farklý
sürelerde ýsýtýlmýþ ve zamanla renk deðiþimleri gözlemlenmiþtir. Zeolit tek baþýna ýsýl
kararlý kýlýcýsý olarak kullanýldýðýnda filmin erken sürede kararmasýný önlemiþtir. PVC
plastijellerin ýsýl kararlýlýðý ve bozunma reaksiyon kinetiði 763 PVC Thermomat cihazý
ile çalýþýlmýþtýr. Isýl kararlýlýk, PVC plastijellerini PVC Thermomat cihazýnda ýsýtýp, azot
gazýnýn geçtiði suyun iletkenliði ölçülerek saptanmýþtýr. PVC ýsýtýldýðýnda HCl gazý
çýkararak bozunur ve HCl azot gazý ile suya taþýnýr ve su tarafýndan absorplanýr.
Böylece suyun iletkenliði deðiþir. Ýletkenliðin artmaya baþladýðý süre indüksiyon
zamaný, iletkenliðin 50 µS/cm’e ulaþtýðý süre kararlýlýk zamaný olarak tanýmlanýr. Bu
çalýþmada PVC plastijellerin 140 ve 160 °C’ deki indüksiyon ve kararlýlýk zamanlarý
bulunmuþtur. Zeolit tek baþýna ýsýl kararlý kýlýcý olarak PVC plastisole eklendiðinde
indüksiyon süresinde artýþ olmuþ ve bu artýþ PVC ‘nin bozunmasýyla ortaya çýkan HCl
gazýnýn zeolit tarafýndan absorblanmasýyla açýklanmýþtýr. Böylece oluþan HCl gazýnýn
tekrar PVC’nin bozunma reaksiyonuna girip, bozunmayý katalizlemesi engellenmiþtir.
%0.53 ZnSt2 ve %0.53 zeolit içeren PVC plastijelinin indüksiyon süresi (1.25 s) sadece
ZnSt2 ve sadece zeolit içeren örneklerin indüksiyon zamanlarýndan daha yüksek olduðu
için ZnSt2 ve zeolitin PVC’nin ýsýl karalýlýðýna sinerjistik etkisi bu malzemelerden düþük
oranlarda kullanýldýðýnda gözlemlenmiþtir.
TABLE OF CONTENTS
Page
LIST OF FIGURES……………………………………………………………… iii
LIST OF TABLES………………………………………………………………... viii
CHAPTER 1. INTRODUCTION………………………………………………… 1
CHAPTER 2. THERMAL DEGRADATION OF PVC………………………….. 3
CHAPTER 3. THERMAL STABILIZATION OF PVC…………………………. 6
3.1. Thermal Stabilization Theory…………………………………… 6
3.2. Heat Stabilizers for PVC………………………………………... 7
3.2.1. Lead Compounds…………………………………………. 7
3.2.2. Organotin Compounds…………………………………… 8
3.2.3. Organic Stabilizers……………………………………….. 9
3.2.4. Metal Soaps………………………………………………. 10
3.2.5. Inorganic Stabilizers 14
3.2.6. Synergism between Zinc Stearate and Natural Zeolite…... 15
CHAPTER 4. PVC PLASTISOL AND PVC PLASTIGEL……………………… 17
4.1. Gelation and Fusion Behaviours of PVC Plastisol……………… 17
4.2. Kinetic Models for Degradation of PVC Plastisol……………… 19
4.3. Yellowness Index of PVC Plastigels…………………………… 26
CHAPTER 5. MATERIALS AND METHOD…………………………………… 28
5.1. Materials………………………………………………………… 28
5.2. Method………………………………………………………….. 29
CHAPTER 6. RESULTS AND DISCUSSION…………………………………... 33
6.1. Characterization of the Materials……………………………….. 33
6.2. Characterization of PVC Plastisol and PVC Plastigel………….. 37
6.2.1. Gelation and Fusion Behaviour of PVC Plastisol………... 37
6.2.2. Morphology of PVC Plastigels………………………….. 43
6.2.3. Elemental Analysis of PVC Plastigels…………………… 50
6.2.4. Color Test of PVC Plastigels…………………………….. 58
6.2.4.1. Static Oven Test ………………………………….. 58
6.2.4.2. Yellowness Index of PVC Plastigels……………... 62
6.2.5. UV Study of PVC Plastigels…………………………….. 64
6.2.6. FTIR Study of PVC Plastigels …………………………… 71
6.2.7. TGA Study of PVC Plastigel Films………………………. 82
3. Kinetic Study of Dehydrochlorination of PVC Plastigels……… 89
6.3.1. Kinetic Study of PVC and PVC Plastigels………………. 89
6.3.2. Kinetic Study of PVC Plastigels Containing 33% DOP…. 94
6.3.3. Kinetic Study of PVC Plastigels Containing 43% DOP…. 97
6.3.4. Activation Energies of Dehydrochlorination Reactions…. 103
6.3.4. Preexponential Factors of Dehydrochlorination Reactions. 106
CHAPTER 7. CONCLUSIONS………………………………………………….. 112
REFERENCES……………………………………………………………………. 115
LIST OF FIGURES
Page
Figure 3.1. HCl evolution from mixtures with degradation time at different
temperatures……………………………………………………. 13
Figure 3.2. Crystal structure of the hydrotalcite-like compounds…………... 15
Figure 4.1. FTIR spectrum of PVC resin Etinox 450 (pressed disc), the
DOP plasticizer and the plastisol with 65 phr of DOP…………. 18
Figure 4.2. Dynamic TG and DTG curves at 10 °C/min of PVC:DEHP
(100:70) plastisol……………………………………………….. 20
Figure 4.3. Integration of DTG curves for the calculated and experimental
data…………………………………………………………….. 22
Figure 4.4. Comparison between the model and the experimental data on
DEHP 30%................................................................................... 23
Figure 4.5. Yellowing index for mixtures with degradation time at different
temperatures……………………………………………………. 27
Figure 5.1. The structure of DOP………………………………………….... 28
Figure 5.2. Schematic representation of film applicator……………………. 30
Figure 5.3. The measuring arrangement of 763 PVC Thermomat………….. 31
Figure 6.1. FTIR spectrum of PVC produced by Petkim…………………… 34
Figure 6.2. TGA curve of PVC……………………………………………... 35
Figure 6.3. FTIR spectrum of natural zeolite……………………………….. 35
Figure 6.4. FTIR spectrum of viscobyk 5025………………………………. 36
Figure 6.5. FTIR spectrum of ZnSt2………………………………………... 36
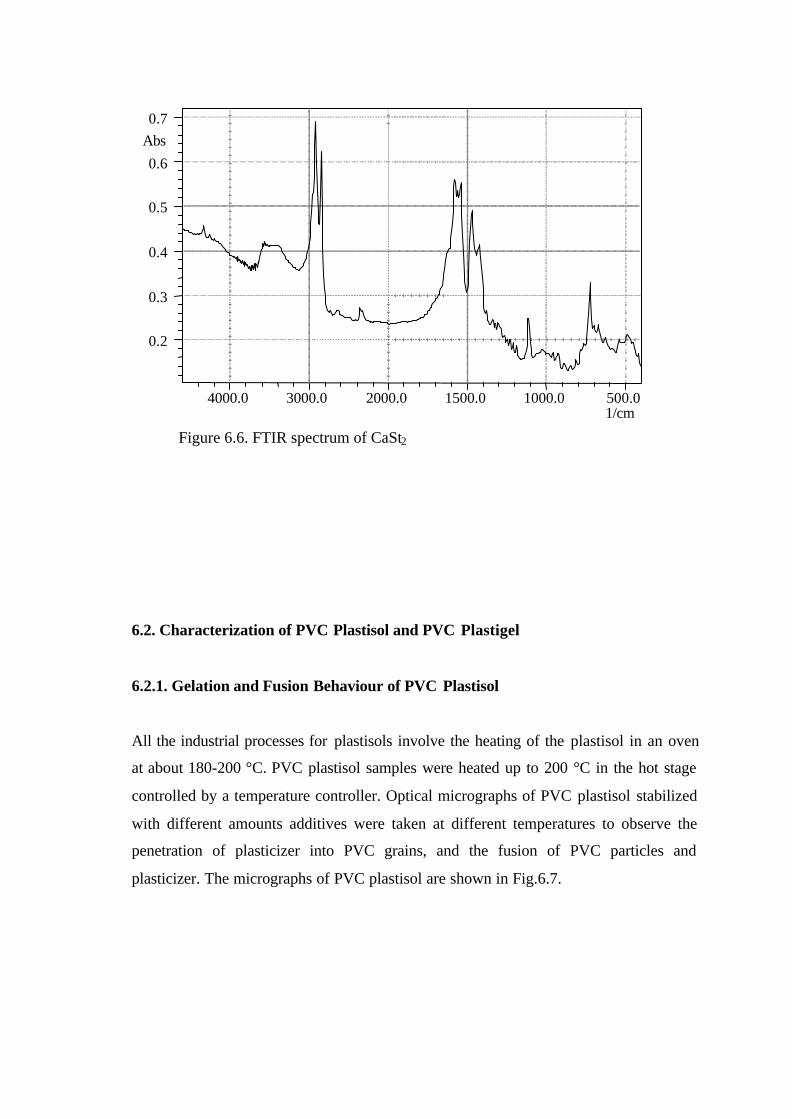
Figure 6.6. FTIR spectrum of CaSt2………………………………………... 37
Figure 6.7. Optical micrographs of PVC plastisol…………………………. 38
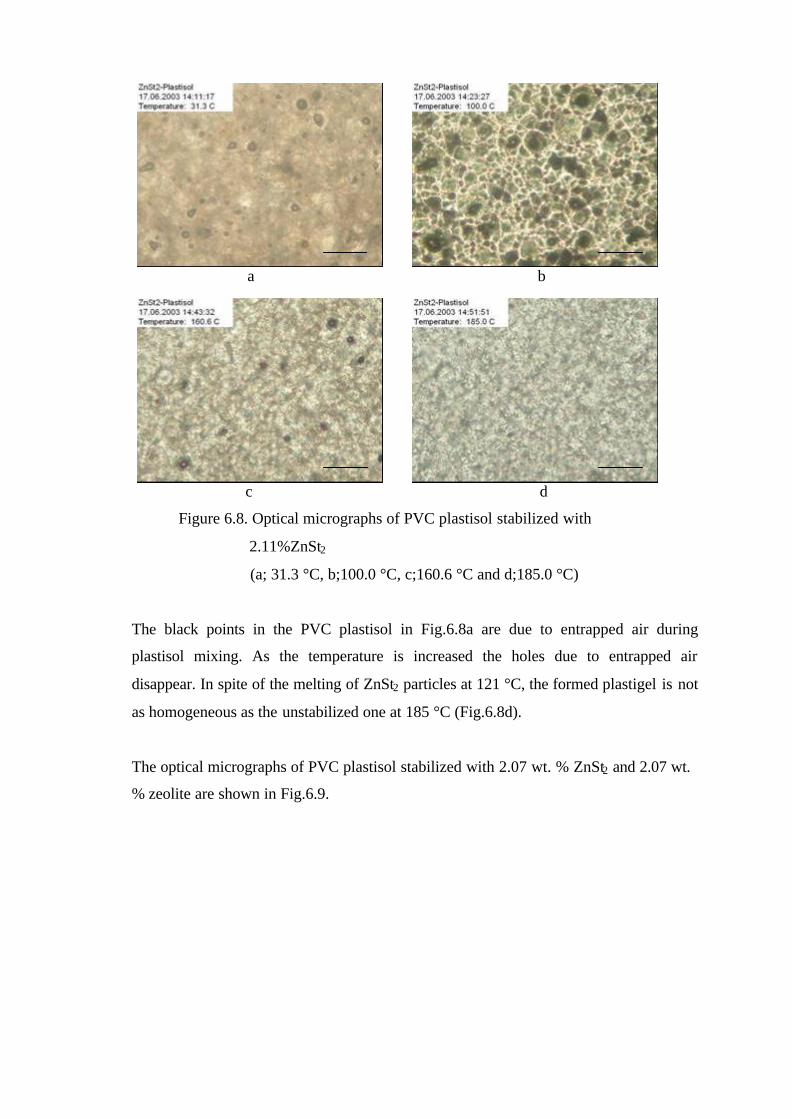
Figure 6.8. Optical micrographs of PVC plastisol stabilized with
2.11% ZnSt2…………………………………………………….. 39
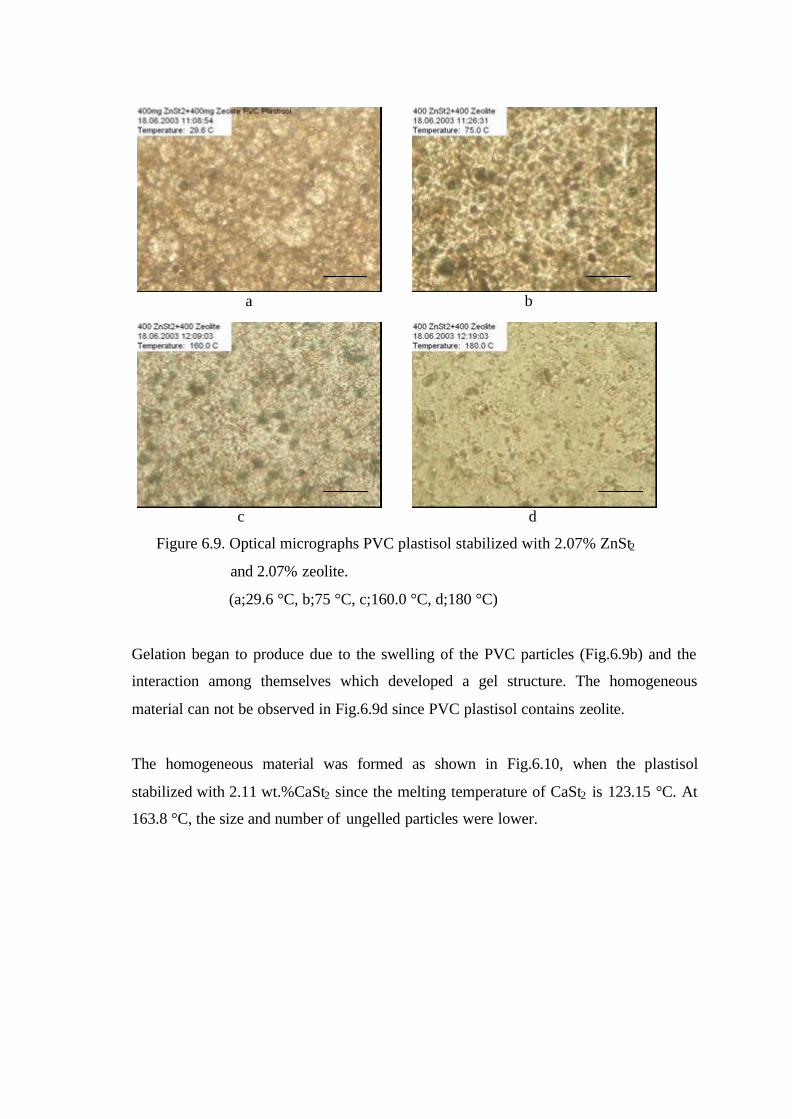
Figure 6.9. Optical micrographs PVC plastisol stabilized with 2.07% ZnSt2
and 2.07% zeolite……………………………………………..... 40
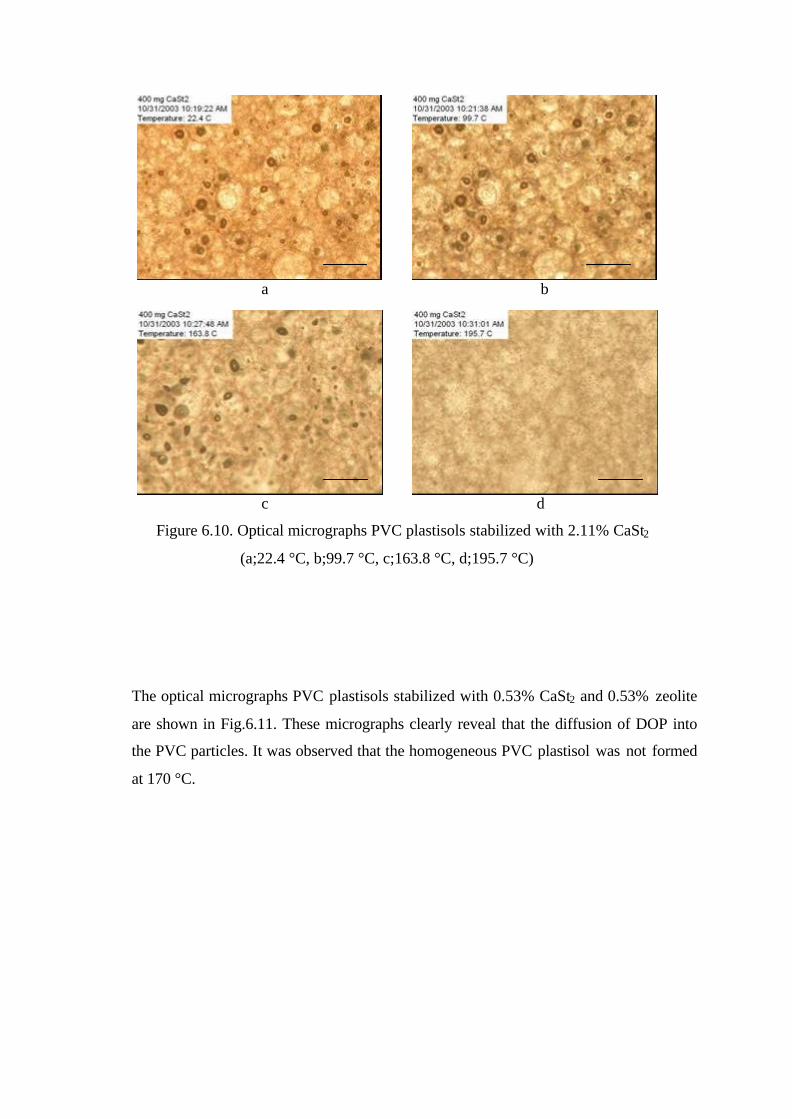
Figure 6.10. Optical micrographs PVC plastisol stabilized with
2.11% CaSt2……………………………………………………. 41
Figure 6.11. Optical micrographs PVC plastisol stabilized with 0.53% CaSt2
and 0.53% zeolite ……………………………………………… 42
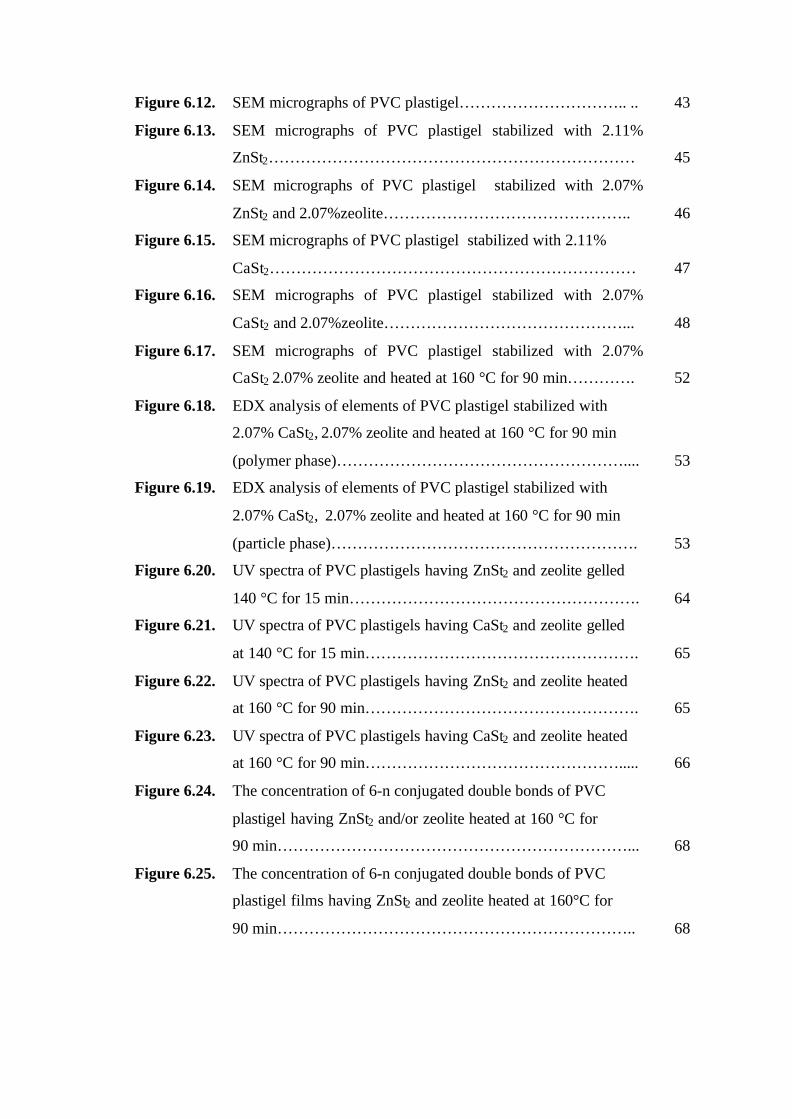
Figure 6.12. SEM micrographs of PVC plastigel………………………….. .. 43
Figure 6.13. SEM micrographs of PVC plastigel stabilized with 2.11%
ZnSt2…………………………………………………………… 45
Figure 6.14. SEM micrographs of PVC plastigel stabilized with 2.07%
ZnSt2 and 2.07%zeolite……………………………………….. 46
Figure 6.15. SEM micrographs of PVC plastigel stabilized with 2.11%
CaSt2…………………………………………………………… 47
Figure 6.16. SEM micrographs of PVC plastigel stabilized with 2.07%
CaSt2 and 2.07%zeolite………………………………………... 48
Figure 6.17. SEM micrographs of PVC plastigel stabilized with 2.07%
CaSt2 2.07% zeolite and heated at 160 °C for 90 min…………. 52
Figure 6.18. EDX analysis of elements of PVC plastigel stabilized with
2.07% CaSt2, 2.07% zeolite and heated at 160 °C for 90 min
(polymer phase)……………………………………………….... 53
Figure 6.19. EDX analysis of elements of PVC plastigel stabilized with
2.07% CaSt2, 2.07% zeolite and heated at 160 °C for 90 min
(particle phase)…………………………………………………. 53
Figure 6.20. UV spectra of PVC plastigels having ZnSt2 and zeolite gelled
140 °C for 15 min………………………………………………. 64
Figure 6.21. UV spectra of PVC plastigels having CaSt2 and zeolite gelled
at 140 °C for 15 min……………………………………………. 65
Figure 6.22. UV spectra of PVC plastigels having ZnSt2 and zeolite heated
at 160 °C for 90 min……………………………………………. 65
Figure 6.23. UV spectra of PVC plastigels having CaSt2 and zeolite heated
at 160 °C for 90 min…………………………………………..... 66
Figure 6.24. The concentration of 6-n conjugated double bonds of PVC
plastigel having ZnSt2 and/or zeolite heated at 160 °C for
90 min…………………………………………………………... 68
Figure 6.25. The concentration of 6-n conjugated double bonds of PVC
plastigel films having ZnSt2 and zeolite heated at 160°C for
90 min………………………………………………………….. 68
Figure 6.27. The concentration of 6-n conjugated double bonds of PVC
plastigel films having CaSt2 and zeolite heated at 160 °C for 90
min……………………………………………………………… 69
Figure 6.28. FTIR spectra of PVC and PVC plastigel gelled at 140 °C for
15 min…………………………………………………………... 73
Figure 6.29. FTIR spectrum of PVC plastigel gelled at 160 °C for 90 min…. 73
Figure 6.30. FTIR spectra of PVC and PVC plastigel stabilized with
2.11%ZnSt2 and gelled at 140 °C for 15 min…………………... 74
Figure 6.31. FTIR spectra of PVC and PVC plastigel stabilized with
2.11%ZnSt2 and heated at 160 °C for 90 min………………….. 74
Figure 6.32. FTIR spectra of PVC and PVC plastigel stabilized with 2.11%
zeolite and gelled at 140 °C for 15 min……………………….... 75
Figure 6.33. FTIR spectra of PVC and PVC plastigel stabilized with
2.11%zeolite and heated at 160 °C for 90 min…………………. 75
Figure 6.34. FTIR spectra of PVC and PVC plastigel stabilized with
2.07%ZnSt2 and 2.07% zeolite gelled at 140 °C for 15 min….... 76
Figure 6.35. FTIR spectra of PVC and PVC plastigel stabilized with
2.07%ZnSt2 and 2.07% zeolite heated at 160 °C for 90 min…... 76
Figure 6.36. FTIR spectra of PVC and PVC plastigel stabilized with
2.11%CaSt2 and gelled at 140 °C for 15 min…………………... 77
Figure 6.37. FTIR spectra of PVC and PVC plastigel stabilized with
2.11%CaSt2 and heated at 160 °C for 90 min………………….. 77
Figure 6.38. FTIR spectra of PVC and PVC plastigel stabilized with
2.07%CaSt2 and 2.07% zeolite gelled at 140 °C for 15 min….... 78
Figure 6.39. FTIR spectra of PVC and PVC plastigel stabilized with
2.07%CaSt2 and 2.07% zeolite heated at 160 °C for 90 min…... 78
Figure 6.40. Absorbance difference at 1540 cm-1/film thickness of PVC
plastigel films stabilized with ZnSt2 and zeolite……………….. 80
Figure 6.41. Absorbance difference at 1540 cm-1 /film thickness of PVC
plastigel films stabilized with CaSt2 and zeolite……………….. 81
Figure 6.42. TGA curves of unstabilized plastigel and the plastigels
stabilized ZnSt2 or zeolite………………………………………. 83
Figure 6.43. TGA curves of unstabilized plastigel and the plastigels
stabilized with ZnSt2 and zeolite……………………………….. 83
Figure 6.44. TGA curves of unstabilized plastigel and the plastigels
stabilized with CaSt2 or zeolite…………………………………. 84
Figure 6.45. TGA curves of unstabilized plastigel and the plastigels
stabilized with CaSt2 and zeolite……………………………….. 84
Figure 6.46. Residual mass % values of PVC plastigel stabilized with ZnSt2
and /or zeolite at 225 °C………………………………………... 87
Figure 6.47. Residual mass % values of PVC plastigel stabilized with ZnSt2
and zeolite at 225 °C…………………………………………... 87
Figure 6.48. Residual mass % values of PVC plastigel stabilized with CaSt2
and /or zeolite at 225°C……………………………………….... 88
Figure 6.49. Residual mass % values of PVC plastigel stabilized with CaSt2
and zeolite at 225 °C………………………………………….... 88
Figure 6.50. The change of conductivity of the aqueous solution with respect
to time for PVC, PVC plastigels and DOP at 160 °C…………... 90
Figure 6.51. The change of conductivity of aqueous solution with respect to
time at 140 °C for PVC plastigels having 33%DOP…………… 95
Figure 6.52. The change of conductivity of aqueous solution with respect to
time at 160 °C for PVC plastigels having 33%DOP…………... 96
Figure 6.53. The change of conductivity of aqueous solution with respect to
time at 140 °C for PVC plastigels stabilized with ZnSt2 and
zeolite…………………………………………………………… 98
Figure 6.54. The change of conductivity of aqueous solution with respect to
time at 160 °C for PVC plastigels stabilized with ZnSt2 and
zeolite…………………………………………………………… 99
Figure 6.55. The change of conductivity of aqueous solution with respect to
time at 140 °C for PVC plastigels stabilized with CaSt2 and
zeolite…………………………………………………………… 101
Figure 6.56. The change of conductivity of aqueous solution with respect to
time at 160 °C for PVC plastigels stabilized with CaSt2 and
zeolite…………………………………………………………... 102
Figure 6.57. Kinetic compensation effect curve for the samples having
33%DOP……………………………………………………….. 109
Figure 6.58. Kinetic compensation effect curve for the samples having
43%DOP and stabilized with ZnSt2 and zeolite……………….. 109
Figure 6.59. Kinetic compensation effect curve for the samples having
43%DOP and stabilized with CaSt2 and zeolite……………….. 110
LIST OF TABLES
Page
Table 3.1. Dehydrochlorination data at 170 °C for PVC films containing
various ratios of Ca/Zn in the absence of and the presence of
epoxidized sunflower oil………………………………………… 10
Table 4.1. Results of kinetic analysis……………………………………….. 22
Table 4.2. Molar absorption coefficient of H-(-CH=CH-)n-H……………… 24
Table 4.3. Determined rate constants for steps of the suggested reaction
mechanism…………………………………………….................. 25
Table 5.1. The weight % of additives used to stabilize the PVC plastisols… 29
Table 6.1. Film thickness of PVC plastigels at 140 and 160 °C……………. 49
Table 6.2. Theoretical Compositions of Components………………………. 52
Table 6.3. Elemental analysis of polymer phase of PVC plastigel films
gelled at 140 °C for 15 min……………………………………… 54
Table 6.4. Elemental analysis of particle phase of PVC plastigel films gelled
at 140 °C for 15 min……………………………………… 55
Table 6.5. Elemental analysis of polymer phase of PVC plastigel films
heated at 160 °C for 90 min……………………………………... 56
Table 6.6. Elemental analysis of particle phase of PVC plastigel films
heated at 160 °C for 90 min……………………………………... 57
Table 6.7. The color change of PVC plastigel having ZnSt2 and zeolite films
with respect to time at 140 °C…………………………….. 59
Table 6.8. The color change of PVC plastigel films having CaSt2 and zeolite
with respect to time at 140 °C…………………………… 59
Table 6.9. The color change of PVC plastigel films having ZnSt2 and zeolite
with respect to time at 160 °C…………………………… 60
Table 6.10. The color change of PVC plastigel films having CaSt2and zeolite
with respect to time at 160 °C…………………………………… 60
Table 6.11. The change of the color of PVC plastigels having ZnSt2 and
zeolite with respect to time………………………………………. 61
Table 6.12. The change of the color of PVC plastigels having CaSt2 and
zeolite with respect to time……………………………………… 61
Table 6.13. PVC Plastigels stabilized with ZnSt2 and zeolite gelled for 15
min at 140 °C……………………………………………………. 62
Table 6.14. PVC Plastigels stabilized with CaSt2 and zeolite gelled for 15
min at 140 °C……………………………………………………. 62
Table 6.15. PVC Plastigels stabilized with ZnSt2 and zeolite heated for 90
min at 160 °C……………………………………………………. 63
Table 6.16. PVC Plastigels stabilized with CaSt2 and zeolite heated for 90
min at 160 °C……………………………………………………. 63
Table 6.17. The absorbance (A), film thickness and the concentration of 6-n
conjugated double bonds of PVC plastigels stabilized with ZnSt2
and zeolite at λ=364 nm…………………………………………. 67
Table 6.18. The absorbance (A), film thickness and the concentration of 6-n
conjugated double bonds of PVC plastigels stabilized with CaSt2
and zeolite at λ=364 nm…………………………………………. 67
Table 6.19. Absorbance difference / film thickness (cm) values of PVC
plastisol stabilized with ZnSt2 and zeolite gelled 15 min. at
140°C…………………………………………………………….. 79
Table 6.20. Absorbance difference / film thickness (cm) values of PVC
plastisol stabilized with ZnSt2 and zeolite and heated 90 min. at
160 °C……………………………………………………………. 79
Table 6.21. Absorbance difference / film thickness (cm) values of PVC
plastisol stabilized with CaSt2 and zeolite and gelled 15 min. at
140 °C……………………………………………………………. 80
Table 6.22. Absorbance difference / film thickness (cm) values of PVC
plastisol stabilized with CaSt2 and zeolite heated 90 min. at
160 °C……………………………………………………………. 81
Table 6.23. Residual mass of PVC plastigels stabilized with ZnSt2 and zeolite
at 400 °C and 600 °C…………………………………….. 85
Table 6.24. Residual mass of PVC plastigels stabilized with CaSt2 and zeolite
at 400 °C and 600 °C…………………………………….. 85
Table 6.25. Onset temperature of mass loss and the residual mass of PVC
plastigels stabilized with ZnSt2 and zeolite at 225 °C…………… 86
Table 6.26. Onset temperature of mass loss and the residual mass of PVC
plastigels stabilized with CaSt2 and zeolite at 225 °C…………… 86
Table 6.27. Induction, stabilization time values and rate constants at
160 °C for PVC and PVC plastigels……………………………... 93
Table 6.28. Induction, stabilization time values and rate constants at 140 °C
for PVC plastigels having 33% DOP……………………………. 95
Table 6.29. Induction, stabilization time values and rate constants at 160 °C
for PVC plastigels having 33% DOP……………………………. 96
Table 6.30. Induction, stabilization time values and rate constants at 140 °C
for PVC plastigels stabilized with ZnSt2 and zeolite……………. 99
Table 6.31. Induction, stabilization time values and rate constants at 160 °C
for PVC plastigels stabilized with ZnSt2 and zeolite……………. 100
Table 6.32. Induction, stabilization time values and rate constants at 140 °C
for PVC plastigels stabilized with CaSt2 and zeolite……………. 101
Table 6.33. Induction, stabilization time values and rate constants at 160 °C
for PVC plastigels stabilized with CaSt2 and zeolite……………. 102
Table 6.34. Activation energies of initial and linear region of the kinetic
curves for the samples having 33% DOP………………………... 105
Table 6.35. Activation energies of initial and linear region of the kinetic
curves for the samples stabilized with ZnSt2 and zeolite………... 105
Table 6.36. Activation energies of initial and linear region of the kinetic
curves for the samples stabilized with CaSt2 and zeolite………... 106
Table 6.37. Preexponential factor of PVC plastigels having 33%DOP……… 106
Table 6.38. Preexponential factor of PVC plastigels stabilized with ZnSt2 and
zeolite……………………………………………………….. 107
Table 6.39. Preexponential factor of PVC plastigels stabilized with CaSt2 and
zeolite……………………………………………………….. 107
CHAPTER 1
INTRODUCTION
Poly (vinyl chloride) (PVC) has large and broad uses in commerce. It has a unique
ability to be compounded with a wide variety of additives, making it possible to produce
materials in a range from flexible elastomers to rigid compounds. PVC finds use in
construction, packaging, appliances and machines, medical and safety, automotive etc.
PVC is clear, colorable, nontoxic when fabricated and produced by free radical
polymerization.
Most of PVC applications require the use of additives, which provide flexibility of
processing and different properties to final products. One of the most common PVC
compounds is plastisol (Jimenez et al., 2000). PVC plastisol is a suspension of small
particles of PVC resin in a plasticizer (mainly some long chain phthalate). Plastigels in
the form of coatings, films, sheets, foams, and rotational casting are obtained by heating
the plastisol. As the plastisol is heated, diffusion of the plasticizer into the particles of
PVC resin take place (Baltacýoðlu et al., 1999). Gelation of a PVC plastisol is the
process whereby absorption of the plasticizer by PVC particles, which is the first major
consequence of heat treatment, brings about the formation of a relatively weal gel.
Fusion is the process whereby, as a result of heating PVC particles are permeated by the
plasticizer which they have entirely absorbed become fully merged to form a physically
homogeneous plasticized PVC material. In general, the higher the computability of the
plasticizer with the polymer in a plastisol brings about the easier and faster gelation and
fusion. Therefore phthalates are generally used for this purpose (Titow, 1985).
One of the most serious problems for PVC processing and handling is the rather low
thermal stability. The dehydrochlorination of PVC starts at about 100 °C and is the
reason for discoloration, owing to the formation of polyene sequences. It is catalyzed by
HCl evolved (autocatalysis), and also be promoted by other strong acids. So a number
of chemicals can be used as stabilizers against these very undesirable degradation
processes. The basic principles of stabilization against heat and light were developed
between 1930 and 1950, but the search for more effective, less toxic, and
environmentally friendly systems has been one of the most important tasks of the PVC
industry up to now. The compounds used as heat stabilizers for PVC are lead
compounds, organotin compounds, organic stabilizers, compounds of other metals
(calcium, zinc, barium, aluminum and their composites),and inorganic stabilizers
(zeolite and hydrotalcite). Metal compounds are used to displace the labile chlorine
atom in PVC polymer chain by more stable groups. Zeolite and hydrotalcite are used as
acid absorbers in PVC in order to absorb evolved HCl and other strong acids which
catalyzed the dehydrochlorination of PVC.
Thermal stabilization of PVC can be determined by PVC Thermomat equipment. When
PVC plastigels are heated in PVC Thermomat in the presence of nitrogen gas, the
conductivity of water, which nitrogen gas is passed, changes with respect to time. The
period when the conductivity starts to increase is called as induction time, and the
period when the conductivity value reaches to 50 µS/cm is called as stability time. This
value is the maximum acceptable level of degradation.
This study aims to investigate the synergistic effect of zinc stearate (ZnSt2) and natural
zeolite on PVC thermal stability. For this purpose, ZnSt2 with high purity was produced
by precipitation technique. Also clinoptilolite- rich natural zeolite from Gördes
(Manisa) region was used as stabilizer for PVC.
CHAPTER 2
THERMAL DEGRADATION OF PVC
The main outward indicators of thermal degradation of PVC are the evolution of
hydrogen chloride, development of color (from light yellow through reddish brown, to
almost black in severe cases) and deterioration of physical, chemical and electrical
properties.
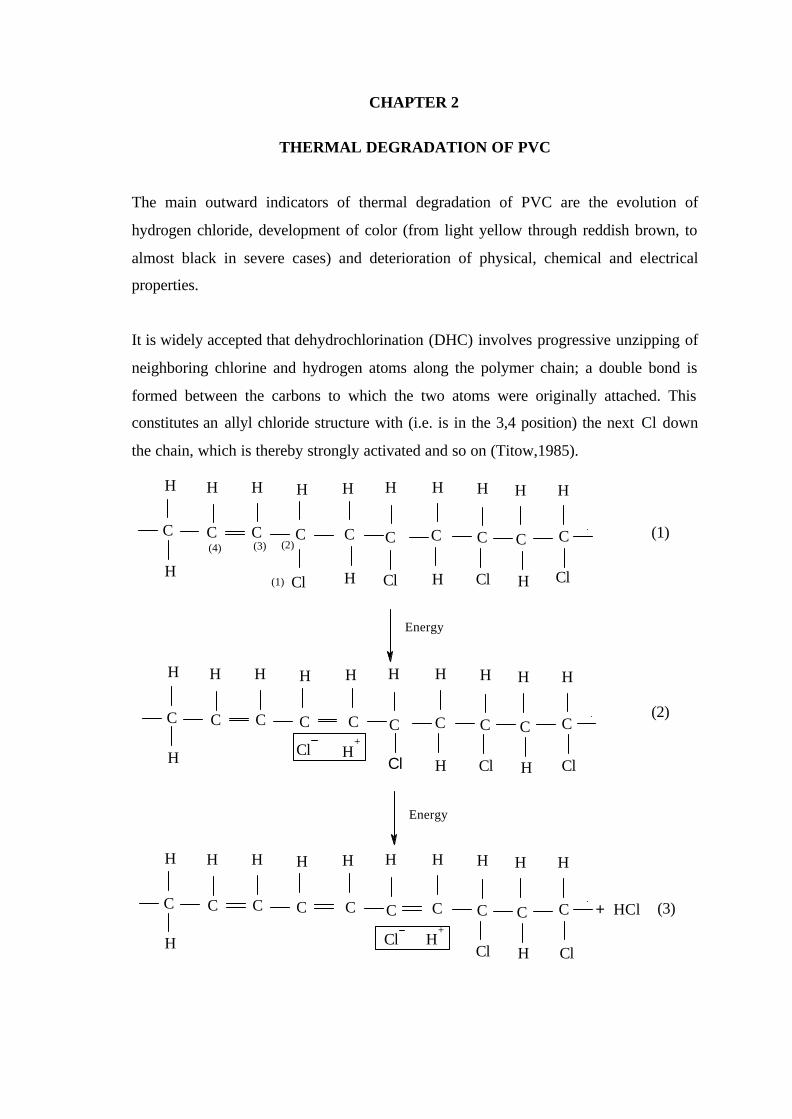
It is widely accepted that dehydrochlorination (DHC) involves progressive unzipping of
neighboring chlorine and hydrogen atoms along the polymer chain; a double bond is
formed between the carbons to which the two atoms were originally attached. This
constitutes an allyl chloride structure with (i.e. is in the 3,4 position) the next Cl down
the chain, which is thereby strongly activated and so on (Titow,1985).
C C C C C C C C C C
H H H H H H H H H H
HCl H Cl H Cl H Cl
C C C C C C C C C C
H H H H H H H H H H
H H Cl H ClH
+
C C C C C C C C C C
H H H H H H H H H H
H Cl H Cl
ClCl
Cl H+
(1)
(2)(3)(4)
Energy
Energy
+ HCl
(1)
(2)
(3)
The development of color is attributed to the conjugated double bond systems formed in
this process. The process starts with a chlorine atom activated by an adjacent allylic
bond configuration where that is already present in mid-chain.
Dehydrochlorination can occur at only moderately elevated temperatures (about 100
°C). It is catalyzed by the HCl evolved (autocatalysis), and can also be promoted or
initiated by other strong acids.
In addition to dehydrochlorination, thermal degradation of PVC polymer in the presence
of oxygen also involves oxidation, with the formation of hydroperoxide, cylic peroxide,
and keto groups, some of which can provide additional active sites for initiation of
dehydrochlorination
Chain scission and cross-linking can also take place as degradation proceeds, both in air
and in an inert atmosphere (although some investigators report no scission in nitrogen at
190 °C). These effects contribute to the general deterioration in properties.
If the thermal stability of PVC polymer or composition at a given temperature is defined
in terms of time required for one of the main principles of degradation to reach a stated
level and if the degradation is treated as a unified process, thermally activated in the
classic manner, the appropriate Arrhenius-type relationship may be written in the form:
t=t0 x exp(E/RT) (4)
where ;
t is the duration of stability; t0 is a constant; E is the activation energy for thermal
degradation of PVC polymer in the conditions ( and /or composition) concerned; R is
the ideal gas constant; T is the absolute temperature.
Susceptibility to the thermal degradation varies with the process of manufacture of the
PVC polymer and also with the source of supply. Other things being equal, the
susceptibility increases (inherent stability decreases) in the sequence:
mass polymer suspension polymer emulsion polymer
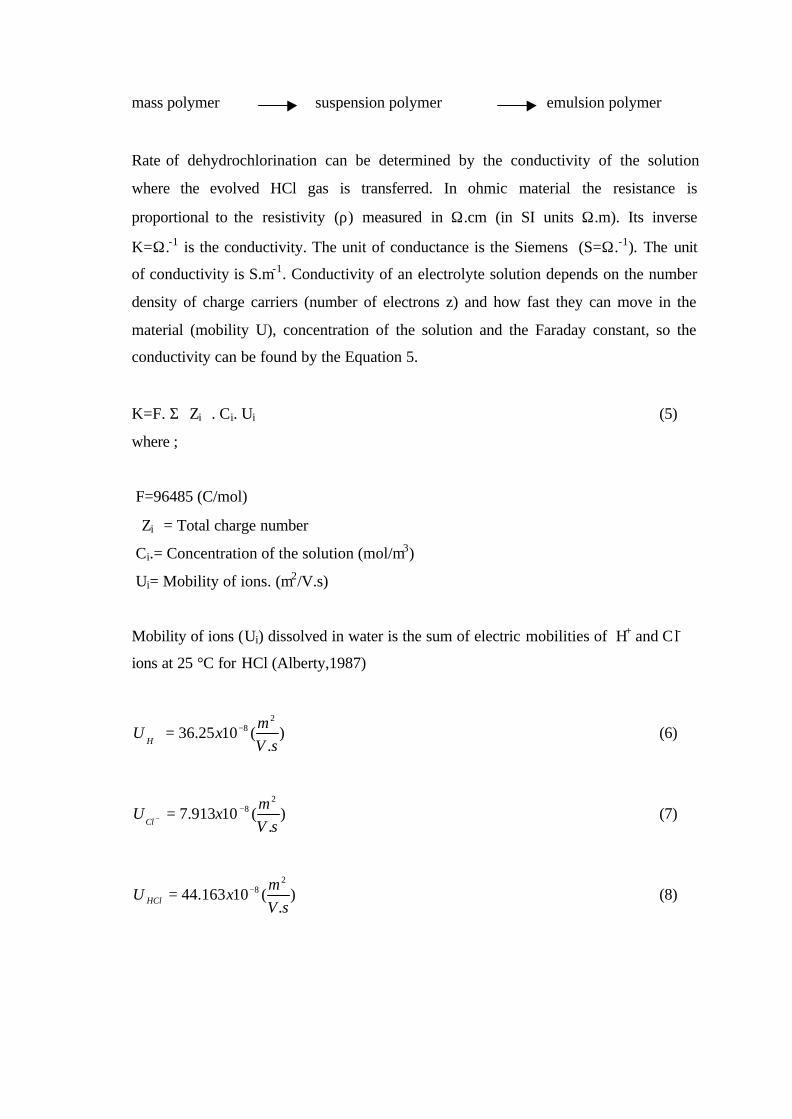
Rate of dehydrochlorination can be determined by the conductivity of the solution
where the evolved HCl gas is transferred. In ohmic material the resistance is
proportional to the resistivity (ρ) measured in Ω.cm (in SI units Ω.m). Its inverse
K=Ω.-1 is the conductivity. The unit of conductance is the Siemens (S=Ω.-1). The unit
of conductivity is S.m-1. Conductivity of an electrolyte solution depends on the number
density of charge carriers (number of electrons z) and how fast they can move in the
material (mobility U), concentration of the solution and the Faraday constant, so the
conductivity can be found by the Equation 5.
K=F. ΣZi. Ci. Ui (5)
where ;
F=96485 (C/mol)
Zi= Total charge number
Ci.= Concentration of the solution (mol/m3)
Ui= Mobility of ions. (m2/V.s)
Mobility of ions (Ui) dissolved in water is the sum of electric mobilities of H+ and Cl-
ions at 25 °C for HCl (Alberty,1987)
).
(1025.362
8
sVm
xUH
−=+ (6)
).
(10913.72
8
sVm
xUCl
−=− (7)
).
(10163.442
8
sVm
xU HCl−= (8)
CHAPTER 3
THERMAL STABILIZATION OF PVC
3.1. Thermal Stabilization Theory
A stabilizer is used to increase of the chemical stabilization of PVC at the processing
temperature of the material. An ideal stabilizer should ;
- have rapid binding of free HCl
- have high ability to replace labile Cl atoms with stable groups
- have saturation of double bonds
- have antioxidant action
- disrupt the chromophoric groups
- absorb the free radicals
- neutralize the impurities and degradation products
- have effective screening of UV radiation
- be readily dispersible in the PVC compound, and fully compatible with all its
constituents even after prolonged service
- have no adverse effect on processing properties
- be equally effective in PVC resin of all types and from all sources
- be inexpensive and effective in small proportions.
The ideal stabilizer does not exist. However, many of the available stabilizers, and
particularly composite stabilizer systems, can be highly effective in compositions and
applications for which they are appropriate.
Commercial heat stabilizers in the market are actually synergistic mixtures of various
compounds. The mixture has a better stabilizing effect than the pure substances. On the
other hand, unknown composition of commercial heat stabilizers may cause drastic
detrimental effect on degradation of PVC. The heat stabilizers and the PVC product
having heat stabilizers should be handled with care considering their effect on human
health (Gökçel et al.,1998).
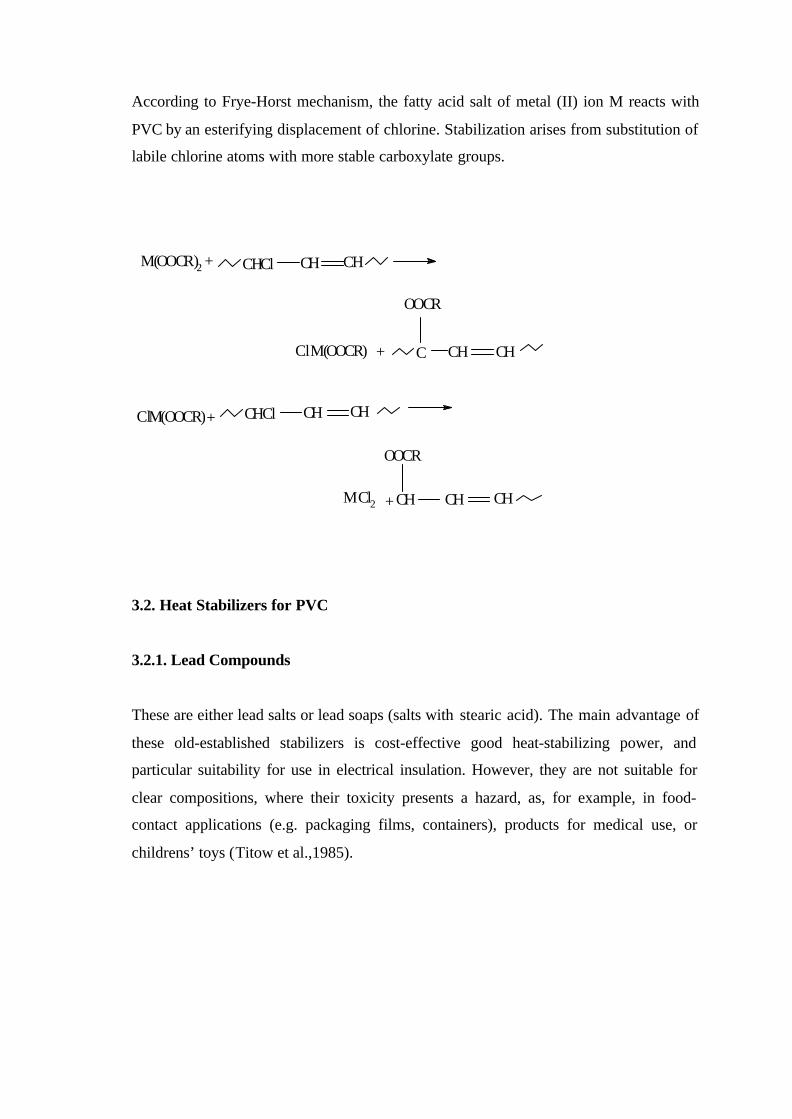
According to Frye-Horst mechanism, the fatty acid salt of metal (II) ion M reacts with
PVC by an esterifying displacement of chlorine. Stabilization arises from substitution of
labile chlorine atoms with more stable carboxylate groups.
3.2. Heat Stabilizers for PVC
3.2.1. Lead Compounds
These are either lead salts or lead soaps (salts with stearic acid). The main advantage of
these old-established stabilizers is cost-effective good heat-stabilizing power, and
particular suitability for use in electrical insulation. However, they are not suitable for
clear compositions, where their toxicity presents a hazard, as, for example, in food-
contact applications (e.g. packaging films, containers), products for medical use, or
childrens’ toys (Titow et al.,1985).
(9)
(10)
M(OOCR)2 CHCl CH CH
Cl M(OOCR) C CH CH
OOCR
ClM(OOCR) CHCl CH CH
M Cl2 CH
OOCR
CH CH
+
+
+
+
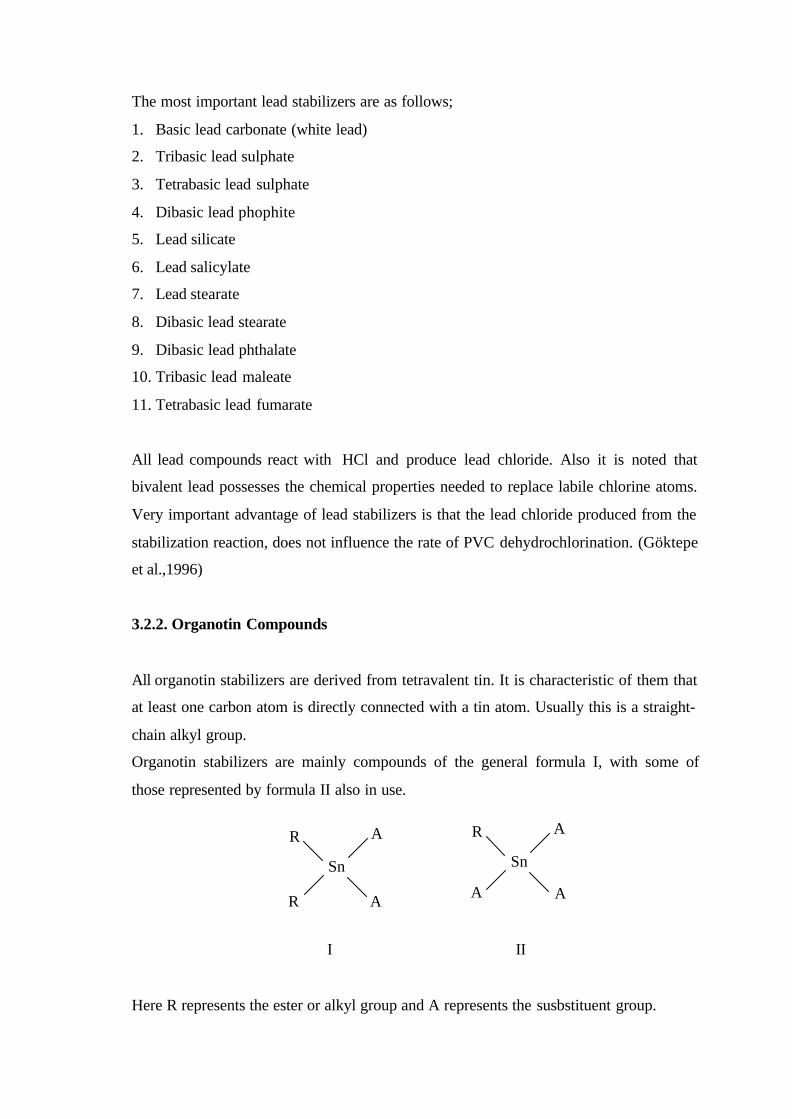
The most important lead stabilizers are as follows;
1. Basic lead carbonate (white lead)
2. Tribasic lead sulphate
3. Tetrabasic lead sulphate
4. Dibasic lead phophite
5. Lead silicate
6. Lead salicylate
7. Lead stearate
8. Dibasic lead stearate
9. Dibasic lead phthalate
10. Tribasic lead maleate
11. Tetrabasic lead fumarate
All lead compounds react with HCl and produce lead chloride. Also it is noted that
bivalent lead possesses the chemical properties needed to replace labile chlorine atoms.
Very important advantage of lead stabilizers is that the lead chloride produced from the
stabilization reaction, does not influence the rate of PVC dehydrochlorination. (Göktepe
et al.,1996)
3.2.2. Organotin Compounds
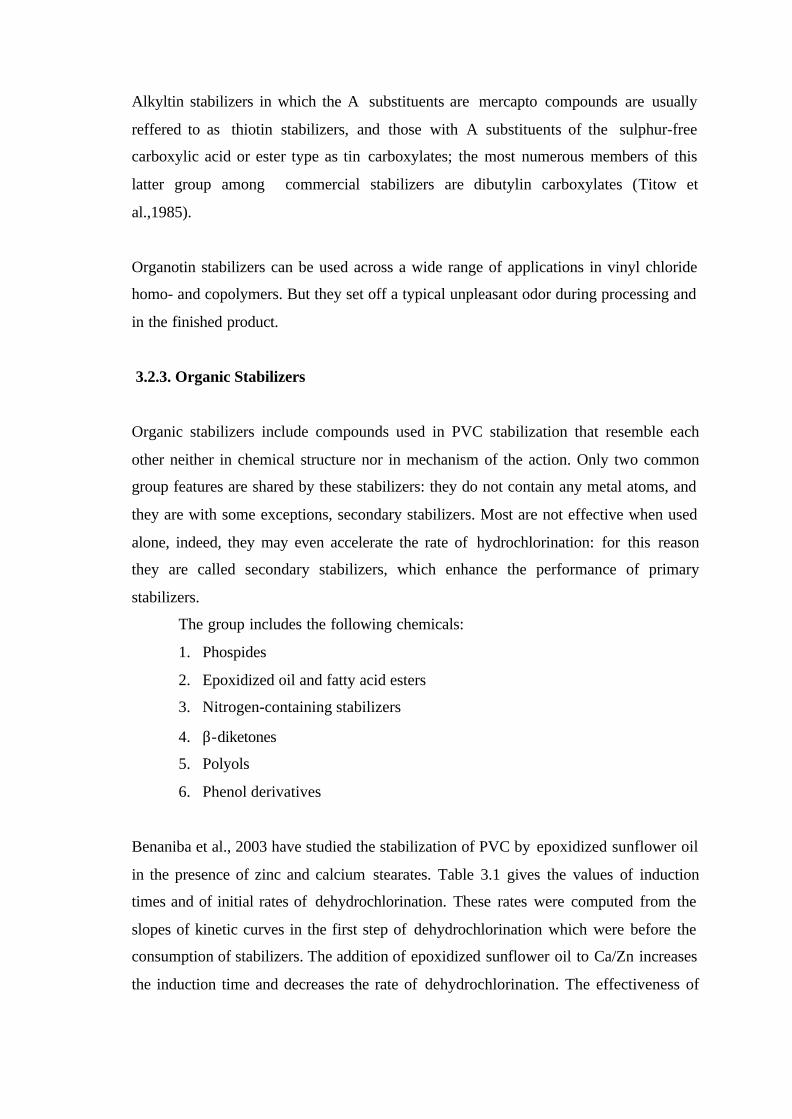
All organotin stabilizers are derived from tetravalent tin. It is characteristic of them that
at least one carbon atom is directly connected with a tin atom. Usually this is a straight-
chain alkyl group.
Organotin stabilizers are mainly compounds of the general formula I, with some of
those represented by formula II also in use.
I II
Here R represents the ester or alkyl group and A represents the susbstituent group.
Sn
A
A
R
R
Sn
AR
AA
Alkyltin stabilizers in which the A substituents are mercapto compounds are usually
reffered to as thiotin stabilizers, and those with A substituents of the sulphur-free
carboxylic acid or ester type as tin carboxylates; the most numerous members of this
latter group among commercial stabilizers are dibutylin carboxylates (Titow et
al.,1985).
Organotin stabilizers can be used across a wide range of applications in vinyl chloride
homo- and copolymers. But they set off a typical unpleasant odor during processing and
in the finished product.
3.2.3. Organic Stabilizers
Organic stabilizers include compounds used in PVC stabilization that resemble each
other neither in chemical structure nor in mechanism of the action. Only two common
group features are shared by these stabilizers: they do not contain any metal atoms, and
they are with some exceptions, secondary stabilizers. Most are not effective when used
alone, indeed, they may even accelerate the rate of hydrochlorination: for this reason
they are called secondary stabilizers, which enhance the performance of primary
stabilizers.
The group includes the following chemicals:
1. Phospides
2. Epoxidized oil and fatty acid esters
3. Nitrogen-containing stabilizers
4. β-diketones
5. Polyols
6. Phenol derivatives
Benaniba et al., 2003 have studied the stabilization of PVC by epoxidized sunflower oil
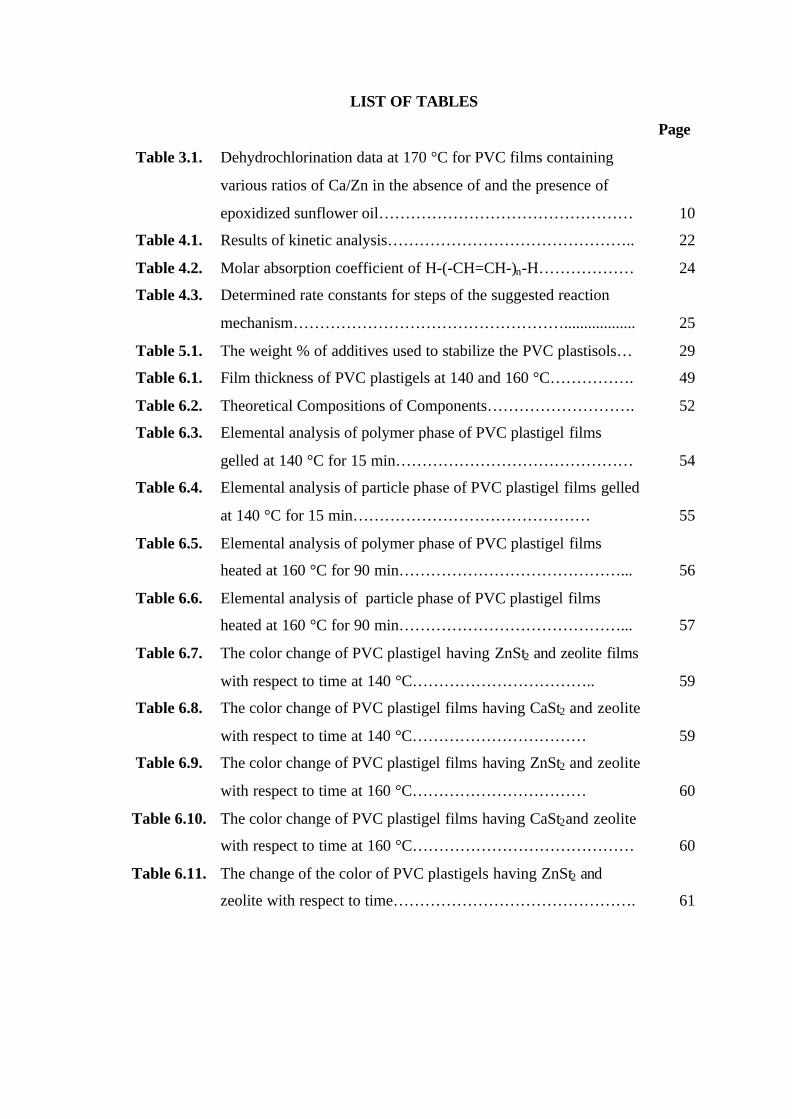
in the presence of zinc and calcium stearates. Table 3.1 gives the values of induction
times and of initial rates of dehydrochlorination. These rates were computed from the
slopes of kinetic curves in the first step of dehydrochlorination which were before the
consumption of stabilizers. The addition of epoxidized sunflower oil to Ca/Zn increases
the induction time and decreases the rate of dehydrochlorination. The effectiveness of
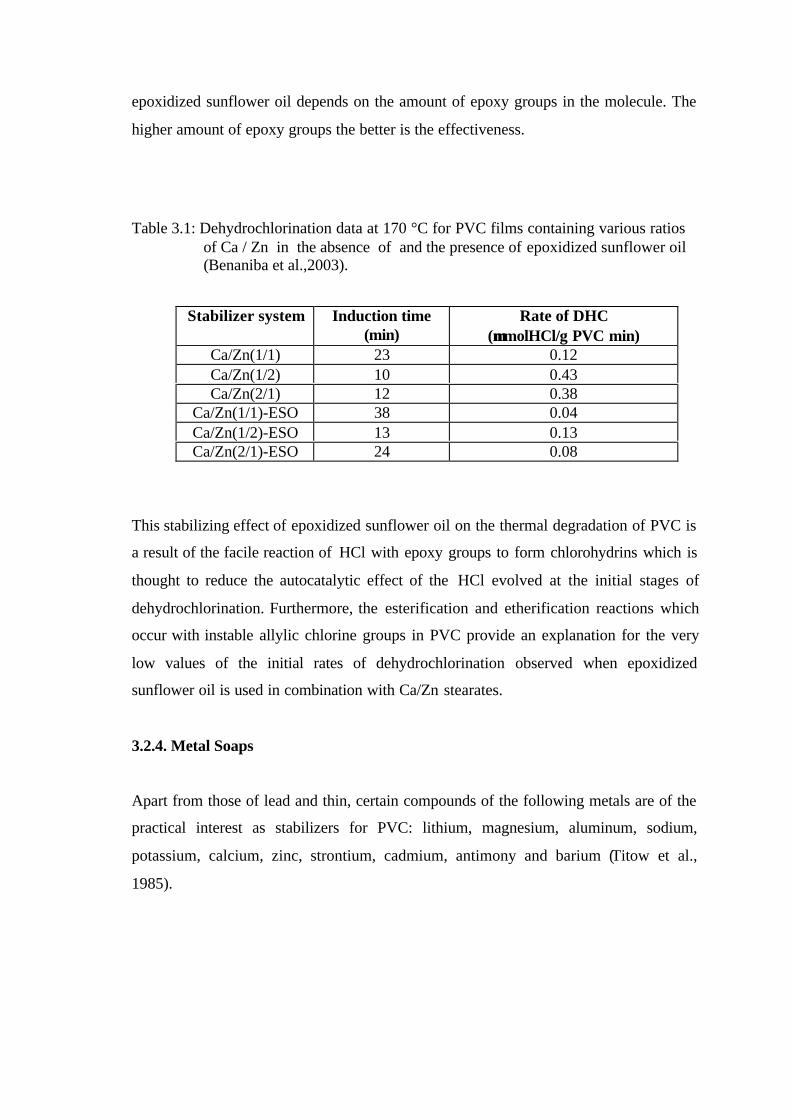
epoxidized sunflower oil depends on the amount of epoxy groups in the molecule. The
higher amount of epoxy groups the better is the effectiveness.
Table 3.1: Dehydrochlorination data at 170 °C for PVC films containing various ratiosof Ca / Zn in the absence of and the presence of epoxidized sunflower oil(Benaniba et al.,2003).
Stabilizer system Induction time(min)
Rate of DHC(µµmolHCl/g PVC min)
Ca/Zn(1/1) 23 0.12Ca/Zn(1/2) 10 0.43Ca/Zn(2/1) 12 0.38
Ca/Zn(1/1)-ESO 38 0.04Ca/Zn(1/2)-ESO 13 0.13Ca/Zn(2/1)-ESO 24 0.08
This stabilizing effect of epoxidized sunflower oil on the thermal degradation of PVC is
a result of the facile reaction of HCl with epoxy groups to form chlorohydrins which is
thought to reduce the autocatalytic effect of the HCl evolved at the initial stages of
dehydrochlorination. Furthermore, the esterification and etherification reactions which
occur with instable allylic chlorine groups in PVC provide an explanation for the very
low values of the initial rates of dehydrochlorination observed when epoxidized
sunflower oil is used in combination with Ca/Zn stearates.
3.2.4. Metal Soaps
Apart from those of lead and thin, certain compounds of the following metals are of the
practical interest as stabilizers for PVC: lithium, magnesium, aluminum, sodium,
potassium, calcium, zinc, strontium, cadmium, antimony and barium (Titow et al.,
1985).
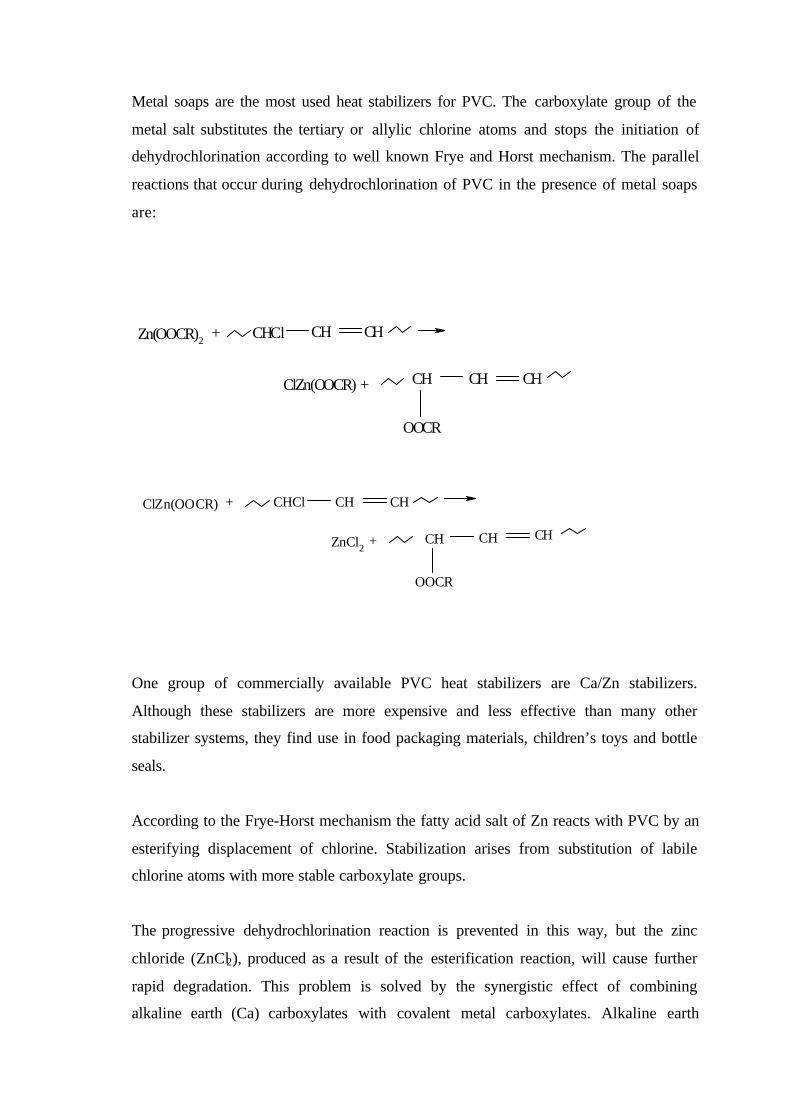
Metal soaps are the most used heat stabilizers for PVC. The carboxylate group of the
metal salt substitutes the tertiary or allylic chlorine atoms and stops the initiation of
dehydrochlorination according to well known Frye and Horst mechanism. The parallel
reactions that occur during dehydrochlorination of PVC in the presence of metal soaps
are:
One group of commercially available PVC heat stabilizers are Ca/Zn stabilizers.
Although these stabilizers are more expensive and less effective than many other
stabilizer systems, they find use in food packaging materials, children’s toys and bottle
seals.
According to the Frye-Horst mechanism the fatty acid salt of Zn reacts with PVC by an
esterifying displacement of chlorine. Stabilization arises from substitution of labile
chlorine atoms with more stable carboxylate groups.
The progressive dehydrochlorination reaction is prevented in this way, but the zinc
chloride (ZnCl2), produced as a result of the esterification reaction, will cause further
rapid degradation. This problem is solved by the synergistic effect of combining
alkaline earth (Ca) carboxylates with covalent metal carboxylates. Alkaline earth
(11)
(12)
Zn(OOCR)2CHCl CH CH
ClZn(OOCR) CH CHCH
OOCR
+
+
ClZn(OOCR) CHCl CH CH
ZnCl2CH CHCH
OOCR
+
+
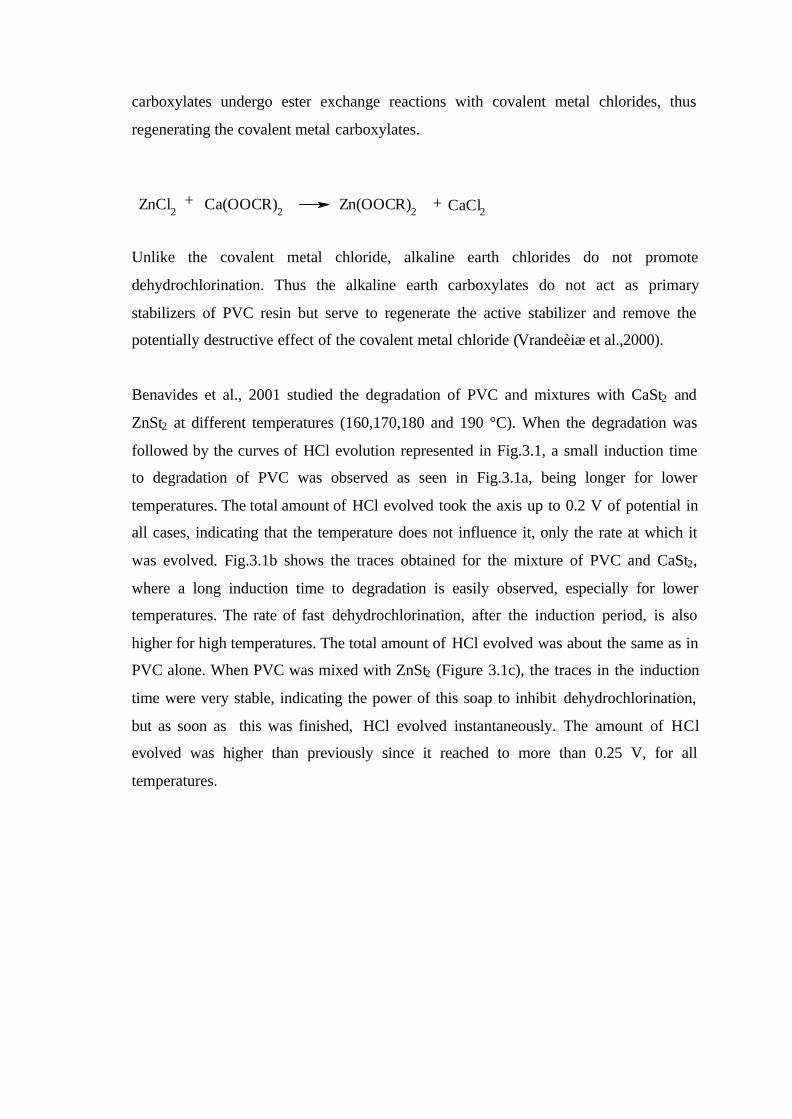
carboxylates undergo ester exchange reactions with covalent metal chlorides, thus
regenerating the covalent metal carboxylates.
Unlike the covalent metal chloride, alkaline earth chlorides do not promote
dehydrochlorination. Thus the alkaline earth carboxylates do not act as primary
stabilizers of PVC resin but serve to regenerate the active stabilizer and remove the
potentially destructive effect of the covalent metal chloride (Vrandeèiæ et al.,2000).
Benavides et al., 2001 studied the degradation of PVC and mixtures with CaSt2 and
ZnSt2 at different temperatures (160,170,180 and 190 °C). When the degradation was
followed by the curves of HCl evolution represented in Fig.3.1, a small induction time
to degradation of PVC was observed as seen in Fig.3.1a, being longer for lower
temperatures. The total amount of HCl evolved took the axis up to 0.2 V of potential in
all cases, indicating that the temperature does not influence it, only the rate at which it
was evolved. Fig.3.1b shows the traces obtained for the mixture of PVC and CaSt2,
where a long induction time to degradation is easily observed, especially for lower
temperatures. The rate of fast dehydrochlorination, after the induction period, is also
higher for high temperatures. The total amount of HCl evolved was about the same as in
PVC alone. When PVC was mixed with ZnSt2 (Figure 3.1c), the traces in the induction
time were very stable, indicating the power of this soap to inhibit dehydrochlorination,
but as soon as this was finished, HCl evolved instantaneously. The amount of HCl
evolved was higher than previously since it reached to more than 0.25 V, for all
temperatures.
(13)ZnCl2 Ca(OOCR)2 Zn(OOCR)2 CaCl2+ +

Figure 3.1. HCl evolution from mixtures with degradation time at different
temperatures (Benavides et al., 2001)
Ulutan, 2003 studied the influence of additional thermal stabilizers on the reprocessing
of postconsumer poly (vinyl chloride) bottles. According to this study, calcium and zinc
stearates have worked well in combination with epoxy soy bean oil to prevent
degradation and dioctyl phthalate was an adequate plasticizer for reformulating PVC
resin that was cut out of label-free parts of water bottles. The effectiveness of the
reformulating has been justified with spectroscopic, calorimetric, and weight-loss
measurements after various heat treatments. It was observed that only after high-
temperature treatments for long times had a small amount of decomposition been
detected during UV and IR investigations.
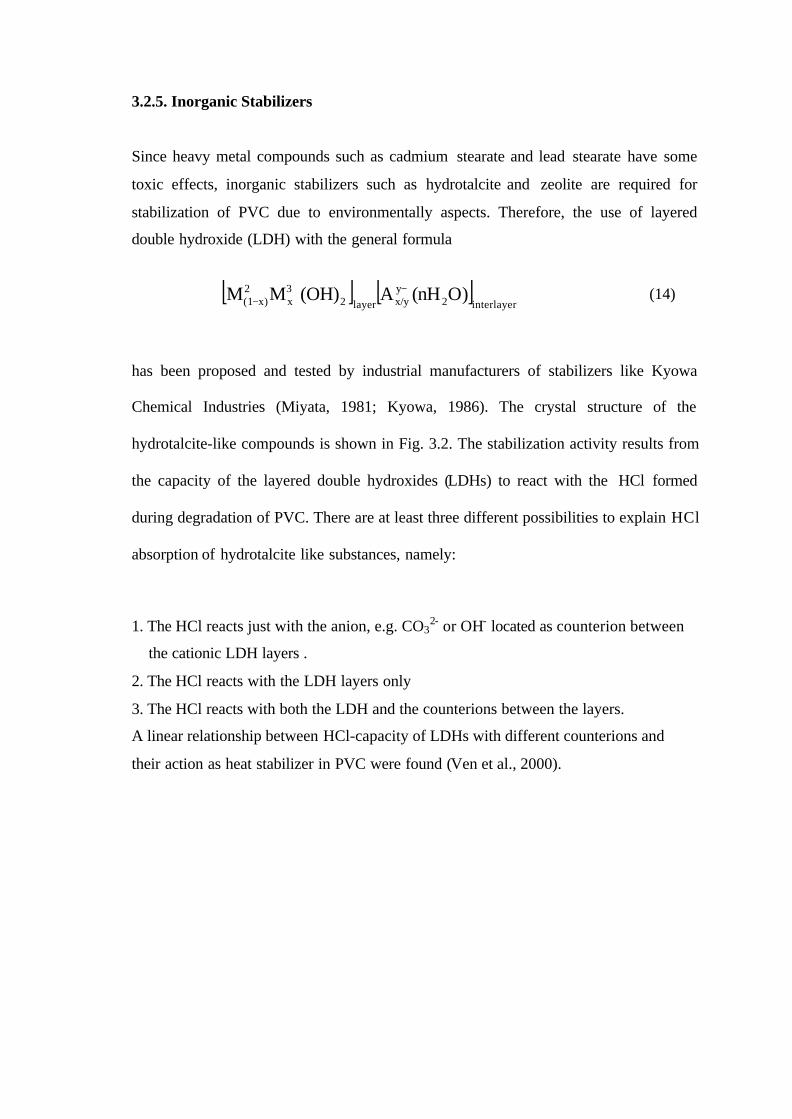
3.2.5. Inorganic Stabilizers
Since heavy metal compounds such as cadmium stearate and lead stearate have some
toxic effects, inorganic stabilizers such as hydrotalcite and zeolite are required for
stabilization of PVC due to environmentally aspects. Therefore, the use of layered
double hydroxide (LDH) with the general formula
has been proposed and tested by industrial manufacturers of stabilizers like Kyowa
Chemical Industries (Miyata, 1981; Kyowa, 1986). The crystal structure of the
hydrotalcite-like compounds is shown in Fig. 3.2. The stabilization activity results from
the capacity of the layered double hydroxides (LDHs) to react with the HCl formed
during degradation of PVC. There are at least three different possibilities to explain HCl
absorption of hydrotalcite like substances, namely:
1. The HCl reacts just with the anion, e.g. CO32- or OH- located as counterion between
the cationic LDH layers .
2. The HCl reacts with the LDH layers only
3. The HCl reacts with both the LDH and the counterions between the layers.
A linear relationship between HCl-capacity of LDHs with different counterions and
their action as heat stabilizer in PVC were found (Ven et al., 2000).
[ ] [ ]interlayer2
yx/ylayer2
3x
2x)(1 O)(nHA(OH)MM −++
− (14)
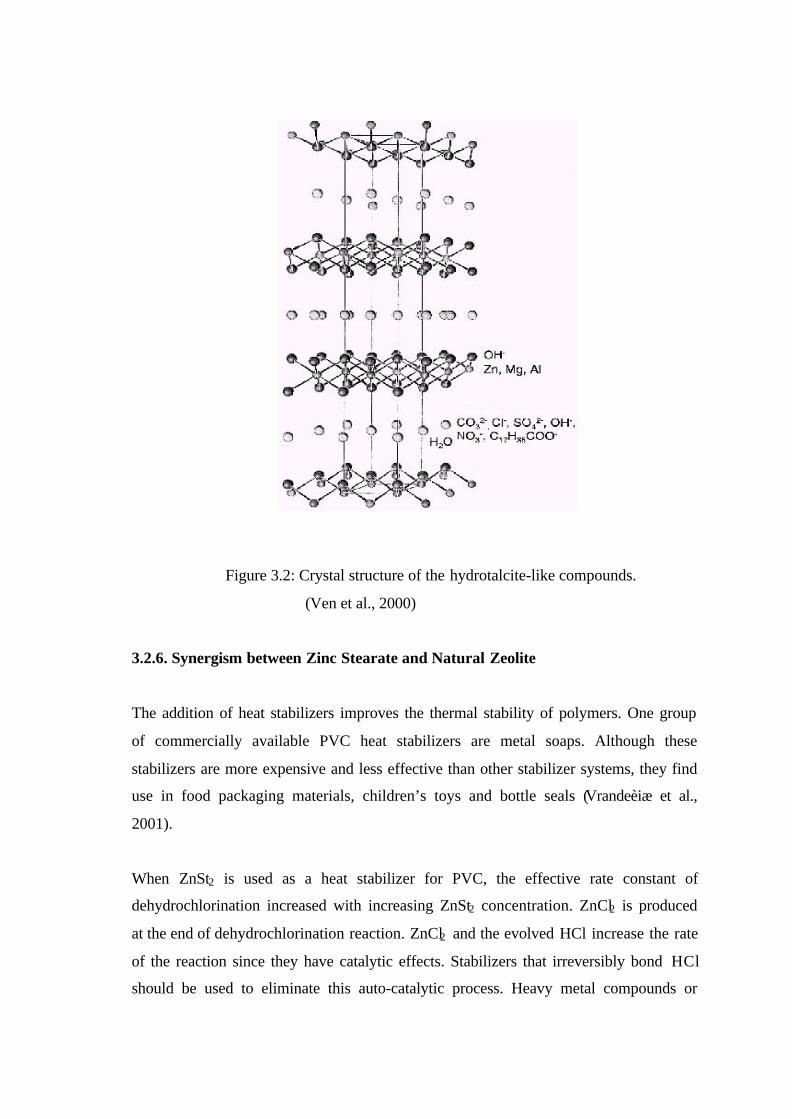
Figure 3.2: Crystal structure of the hydrotalcite-like compounds.
(Ven et al., 2000)
3.2.6. Synergism between Zinc Stearate and Natural Zeolite
The addition of heat stabilizers improves the thermal stability of polymers. One group
of commercially available PVC heat stabilizers are metal soaps. Although these
stabilizers are more expensive and less effective than other stabilizer systems, they find
use in food packaging materials, children’s toys and bottle seals (Vrandeèiæ et al.,
2001).
When ZnSt2 is used as a heat stabilizer for PVC, the effective rate constant of
dehydrochlorination increased with increasing ZnSt2 concentration. ZnCl2 is produced
at the end of dehydrochlorination reaction. ZnCl2 and the evolved HCl increase the rate
of the reaction since they have catalytic effects. Stabilizers that irreversibly bond HCl
should be used to eliminate this auto-catalytic process. Heavy metal compounds or
metal soaps or salts are used for this purpose up to now. However, alternatives such as
zeolite and hydrotalcite are required due to environmental aspects.
Zeolite is used as an acid absorber in PVC. It has been suggested that the acid absorbers
that are effective as stabilizers form addition complexes at degrading sites, tending to
deactivate such sites and capture catalytic, highly mobile HCl before elimination of
further HCl occur. When zeolite is used as a primary stabilizer, the process stability is
long, but color hold poor. This problem has been corrected in practice by combination
with zinc carboxylates. Acid absorbers coated with zinc carboxylates are useful in
flexible PVC compounds (Grossman, 2000).
Ertan et al., 2003 have investigated the chemical behaviour of natural zeolite from
Gördes in aqueous medium. It was observed that pH values of the solution increased
with time and this proved that depending on the amphoteric character of natural zeolite,
it had a tendency to neutralize the acidic medium.
In this study, zeolite was used to neutralize of the evolved hydrogen chloride gas and
metal soaps were used to replace the weakly bonded labile chlorine atoms by
substituents which were of greater stability.
CHAPTER 4
PVC PLASTISOL AND PVC PLASTIGEL
4.1. Gelation and Fusion Behaviours of PVC Plastisol
PVC plastisols are suspensions of fine particles of PVC emulsion resins in a plasticizer.
Plastisols are used in a growing number of applications (Beltran et al., 1997). Some of
the application areas are:
-Construction (window seals, window screens, cable sheating, electrical wire insulation)
-Packaging (meat wrap, shrink wrap)
-Appliances and machines (refrigerator door seals, electrical wire insulation, telephone
cords)
-Medical and safety (blood bags, goggles, gloves, aprons, tubing etc.)
-Automotive (dash boards, coated fabrics, handles, side panels etc.)
-Miscellaneous (room dividers, briefcases, table cloths, shower curtains etc.)
All the industrial processes for plastisols involve the heating of the platisol in an oven at
about 180-200 °C, where the plastisol undergoes two processes known as gelation and
fusion (Garcia et al., 1998). The stages of plasticization can be summarized as follows;
1. Irreversible uptake of plasticizer into the porous resin
2. Absorption of the plasticizer, during which the total resin-plasticizer volume
may decrease although the resin particles swell slowly on the outside.
3. Diffusion of the plasticizer within the particles with little or no volume change,
but involving high activation energies. At this stage the plasticizer is probably
present as clusters of molecules between bundles of polymer segments or
molecules.
4. The final step of plasticization when plasticizer molecules penetrate the bundles
of polymer molecules so that they are no longer rigidly held together but behave
as a polymer in its rubbery than glassy state (Titow, 1985).
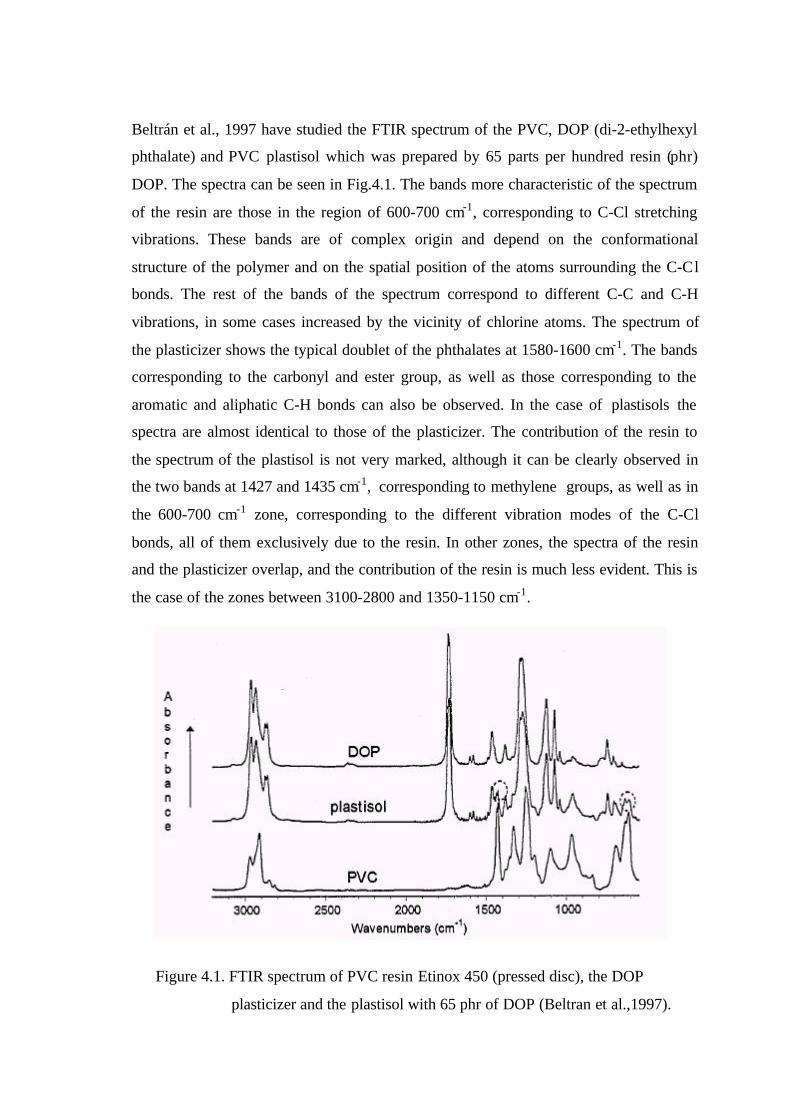
Beltrán et al., 1997 have studied the FTIR spectrum of the PVC, DOP (di-2-ethylhexyl
phthalate) and PVC plastisol which was prepared by 65 parts per hundred resin (phr)
DOP. The spectra can be seen in Fig.4.1. The bands more characteristic of the spectrum
of the resin are those in the region of 600-700 cm-1, corresponding to C-Cl stretching
vibrations. These bands are of complex origin and depend on the conformational
structure of the polymer and on the spatial position of the atoms surrounding the C-Cl
bonds. The rest of the bands of the spectrum correspond to different C-C and C-H
vibrations, in some cases increased by the vicinity of chlorine atoms. The spectrum of
the plasticizer shows the typical doublet of the phthalates at 1580-1600 cm-1. The bands
corresponding to the carbonyl and ester group, as well as those corresponding to the
aromatic and aliphatic C-H bonds can also be observed. In the case of plastisols the
spectra are almost identical to those of the plasticizer. The contribution of the resin to
the spectrum of the plastisol is not very marked, although it can be clearly observed in
the two bands at 1427 and 1435 cm-1, corresponding to methylene groups, as well as in
the 600-700 cm-1 zone, corresponding to the different vibration modes of the C-Cl
bonds, all of them exclusively due to the resin. In other zones, the spectra of the resin
and the plasticizer overlap, and the contribution of the resin is much less evident. This is
the case of the zones between 3100-2800 and 1350-1150 cm-1.
Figure 4.1. FTIR spectrum of PVC resin Etinox 450 (pressed disc), the DOP
plasticizer and the plastisol with 65 phr of DOP (Beltran et al.,1997).
Beltrán and Marcilla (1997) found by TG that the evolution of the plasticizers from the
plastisol samples took place at temperatures somewhat higher than from samples where
the contact between the PVC and the plasticizer was avoided. The plasticizer is
adsorbed by the resin in the plastisols during the gelation process, consequently
delaying its evolution. On the other hand, the decomposition of the PVC from plastisol
samples occurs at temperatures lower than those when the PVC and the DOP are
separated in the sample holder. It was concluded that the presence of the DOP
accelerates the process of decomposition of the PVC.
4.2. Kinetic Models for Degradation of PVC Plastisol
Phthalate plasticizers are thermally degraded from 200 °C on. However, when they are
included in a polymer matrix, the evaporation of plasticizers is shifted to higher
temperatures. It has been suggested that their thermal degradation lead first to the
formation of monoester and olefins by a cis-elimination mechanism, and secondly to the
cleaving of the monoester into phthalic anhydride and alcohol by a scission mechanism
(Jiménez et al.,2000).
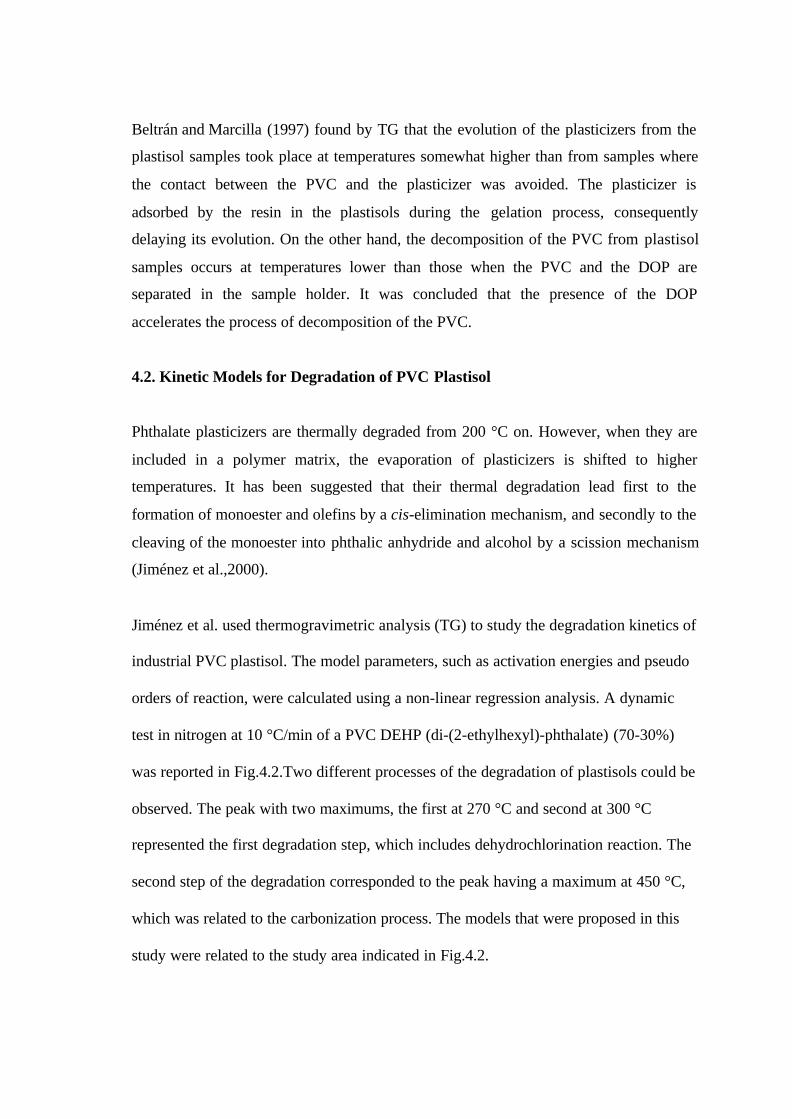
Jiménez et al. used thermogravimetric analysis (TG) to study the degradation kinetics of
industrial PVC plastisol. The model parameters, such as activation energies and pseudo
orders of reaction, were calculated using a non-linear regression analysis. A dynamic
test in nitrogen at 10 °C/min of a PVC DEHP (di-(2-ethylhexyl)-phthalate) (70-30%)
was reported in Fig.4.2.Two different processes of the degradation of plastisols could be
observed. The peak with two maximums, the first at 270 °C and second at 300 °C
represented the first degradation step, which includes dehydrochlorination reaction. The
second step of the degradation corresponded to the peak having a maximum at 450 °C,
which was related to the carbonization process. The models that were proposed in this
study were related to the study area indicated in Fig.4.2.
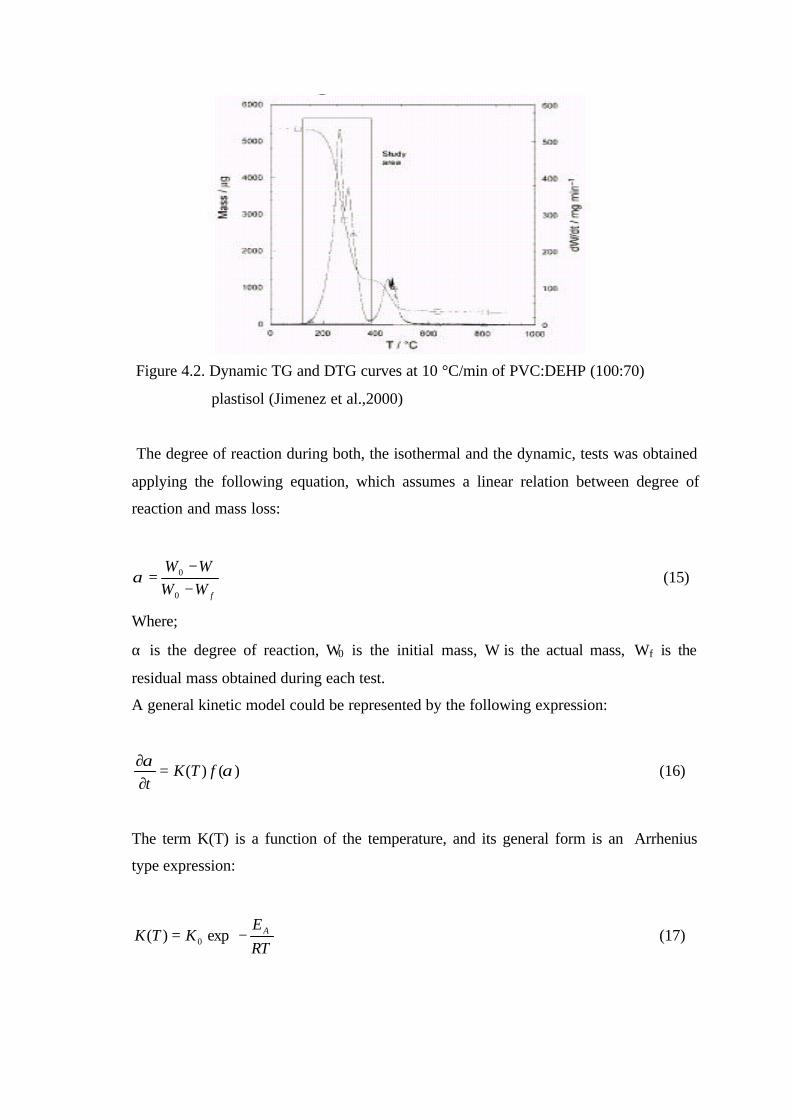
Figure 4.2. Dynamic TG and DTG curves at 10 °C/min of PVC:DEHP (100:70)
plastisol (Jimenez et al.,2000)
The degree of reaction during both, the isothermal and the dynamic, tests was obtained
applying the following equation, which assumes a linear relation between degree of
reaction and mass loss:
fWWWW
−−
=0
0α (15)
Where;
α is the degree of reaction, W0 is the initial mass, W is the actual mass, Wf is the
residual mass obtained during each test.
A general kinetic model could be represented by the following expression:
)()( ααfTK
t=
∂∂
(16)
The term K(T) is a function of the temperature, and its general form is an Arrhenius
type expression:
−=
RT
EKTK Aexp)( 0 (17)
The shape of the reaction rate curves and the considerations about the maximum
isothermal degree of reaction brought to a definition of the following models for the two
indicated processes:
)1)(( αα −= TKdtd
(18)
nmTKdtd
)1()( ααα −= (19)
Equation (18) was related to the evaporation of the plasticizer, while Equation (17) was
related to the dehydrochlorination reaction. The overall kinetic equation proposed for
the degradation of plastisols has to take into account the fact that these two processes
occurred simultaneously. Therefore a parallel kinetic model was proposed.
21 )1( ααα yy −+= (20)
where α1 and α2 referred to the degrees of reaction of the processes represented by
Equations (15) and (16) respectively and y was a mass factor. An expression for the rate
of reaction was obtained by the time derivative of Equation (20):
ty
ty
t ∂∂
−+∂
∂=
∂∂ 21 )1(
ααα (21)
Each α was calculated from TG data obtained by the integration of the peaks
represented in Fig.4.3.
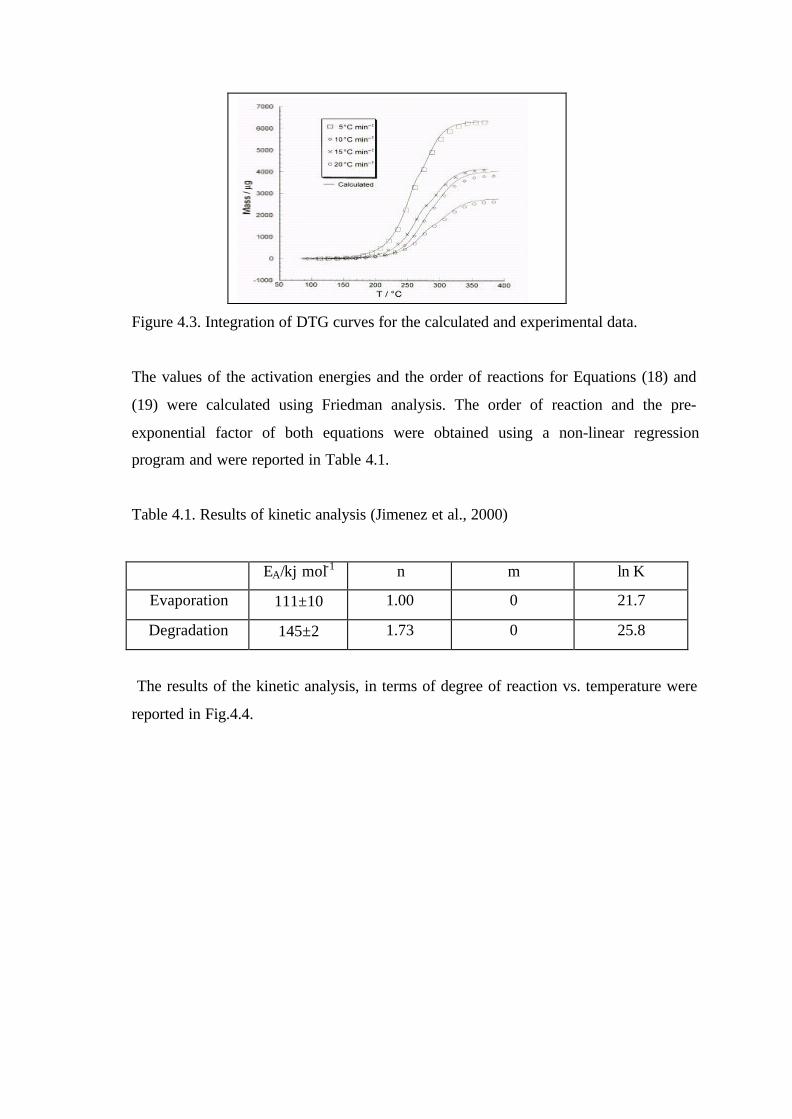
Figure 4.3. Integration of DTG curves for the calculated and experimental data.
The values of the activation energies and the order of reactions for Equations (18) and
(19) were calculated using Friedman analysis. The order of reaction and the pre-
exponential factor of both equations were obtained using a non-linear regression
program and were reported in Table 4.1.
Table 4.1. Results of kinetic analysis (Jimenez et al., 2000)
EA/kj mol-1 n m ln K
Evaporation 111±10 1.00 0 21.7
Degradation 145±2 1.73 0 25.8
The results of the kinetic analysis, in terms of degree of reaction vs. temperature were
reported in Fig.4.4.

Figure 4.4. Comparison between the model and the experimental data on DEHP 30%.
Beltrán and Marcilla (1997) proposed two groups of kinetic models in order to explain
the thermal decomposition of PVC plastisol. Both groups consider that the plasticizer
volatilizes from the sample following a single reaction. One of the models considers
that PVC decomposition takes place via two sets of parallel/consecutive reactions with
an intermediate species that undergoes further decomposition. The other model
considers that the interaction between the plasticizer and the resin leads two
differentiated fractions in PVC with different levels of plasticization, both decomposing
at well differentiated temperatures.
Baltacýoðlu and Balköse (1999) calculated the rate constant of dehydrochlorination
reaction by using the concentration of the polyene sequences. It is generally accepted
that the fine structure in the absorption spectra of dehydrochlorinated PVC is due to the
formation of conjugated polyenes of the type H-(-CH=CH-)n-H or CH3-(-CH=CH-)n-
CH3. Table 4.2 shows the number of produced conjugated double bonds, wavelength
where the strongest absorption occurs and the related absorption coefficients.
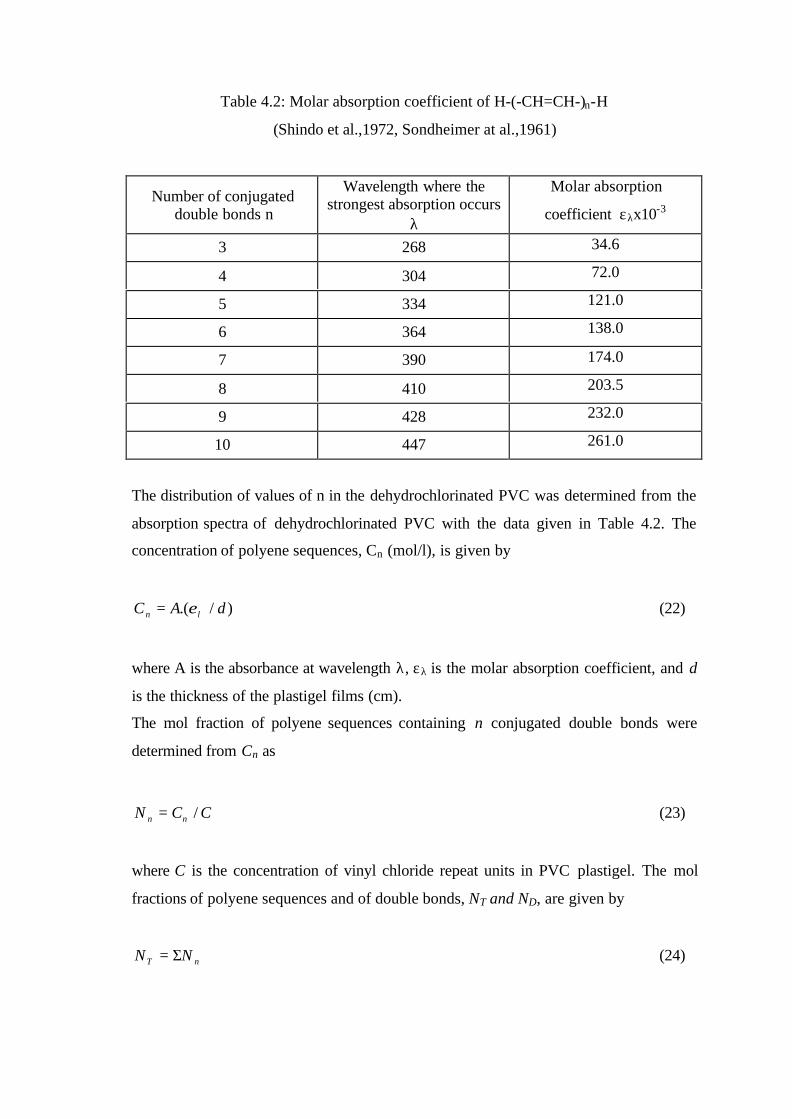
Table 4.2: Molar absorption coefficient of H-(-CH=CH-)n-H
(Shindo et al.,1972, Sondheimer at al.,1961)
Number of conjugateddouble bonds n
Wavelength where thestrongest absorption occurs
λ
Molar absorption
coefficient ελx10-3
3 268 34.6
4 304 72.0
5 334 121.0
6 364 138.0
7 390 174.0
8 410 203.5
9 428 232.0
10 447 261.0
The distribution of values of n in the dehydrochlorinated PVC was determined from the
absorption spectra of dehydrochlorinated PVC with the data given in Table 4.2. The
concentration of polyene sequences, Cn (mol/l), is given by
)/.( dACn λε= (22)
where A is the absorbance at wavelength λ, ελ is the molar absorption coefficient, and d
is the thickness of the plastigel films (cm).
The mol fraction of polyene sequences containing n conjugated double bonds were
determined from Cn as
CCN nn /= (23)
where C is the concentration of vinyl chloride repeat units in PVC plastigel. The mol
fractions of polyene sequences and of double bonds, NT and ND, are given by
nT NN Σ= (24)

nD NnN .Σ= (25)
The mol fractions of conjugated double bonds formed by dehydrochlorination were
calculated using their UV spectra of the films for plastigels having different
composition. The total number of double bonds of the polyene sequences was
practically equal to the HCl molecules split off. Since thermal dehydrochlorination is a
first order reaction, Equation (26) was obtained;
tkND .)1ln( 1=−− (26)
where k1 is the reaction rate constant, t is time, and ND is the mol fraction of conjugated
double bonds. For small values of ND can be written as
tkN D .1= (27)
Also ND vs. t lines was plotted and the rate constant k1 of each sample were determined
the slopes of the first 45-min part of the lines. The rate constants (k2) of the
autoaccelerated reaction due to ZnCl2 accumulation or HCl formation were found from
the slopes of ND vs. t lines in a 45-60 min heating range. The values of k1 and k2 were
as reported in Table 4.3.
Table 4.3. Determined rate constants for steps of the suggested reaction mechanism
(Baltacýoðlu and Balköse, 1999)
Content of Plastigel k1x10 4
(min-1) k2 (min-1)
Control 1.62 6.60
2.5 phr ZnSt2 0.77
5 phr ZnSt2 2.11
5 phr ESO 0.47 0.47
5 phr ESO and 2.5 phr ZnSt2 0.70 4.20
5 phr ESO and 5 phr ZnSt2 can not be determined
4.3. Yellowness Index of PVC Plastigels
Yellowness index is a measure of color change when compared with a white standard.
Yellowness index of the plastigels were calculated by using their tristimulus (L, a, b)
values. This index can be calculated by using Equation (28)
Lxbxa
YI100).79.172.0( += (28)
The positive values of yellowness index point out the yellowness of the material and the
minus values point out the blueness of the material. (Arý and Ýçten., 1989)
Benavides et al. (2001) obtained the change of yellowing index for PVC and its
mixtures at different temperatures as seen in Fig.4.5. Fig.4.5a shows the results for PVC
alone, where the highest yellowing index (YI) obtained sees to depend on the
temperature of degradation. For 160 °C maximum value of 80 was obtained, while for
180 and 190 °C it went to top (120 and 180). The rate is also higher for high
temperatures. On the other hand, the mixture of PVC+ CaSt2 (Fig.4.5b) gives the
highest value of YI for the temperature of 160 °C. Fig.4.5c shows the YI traces for the
mixture PVC+ ZnSt2, where the highest value obtained is the same for the four
temperatures. The rates of YI increments are higher for high temperatures.
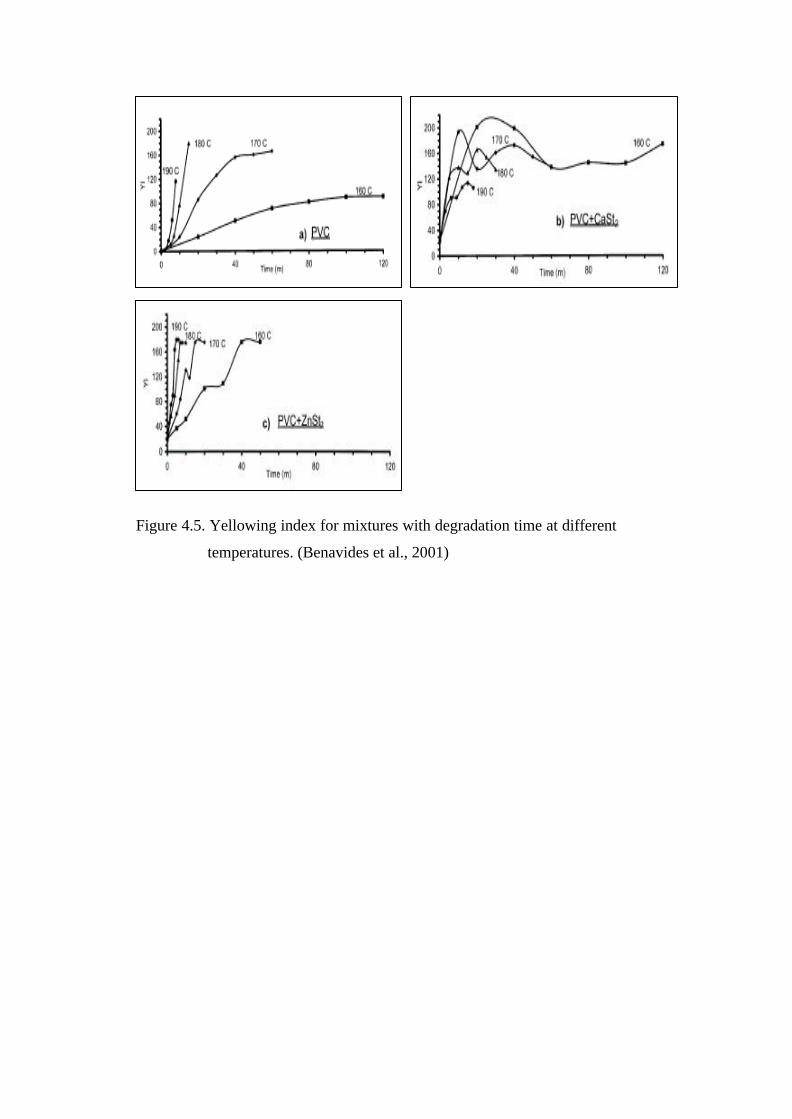
Figure 4.5. Yellowing index for mixtures with degradation time at different
temperatures. (Benavides et al., 2001)
CHAPTER 5
MATERIALS AND METHOD
5.1. Materials
In this study, PVC plastisol films were prepared to determine the heat stabilization of
PVC. Poly vinyl chloride, dioctylphthalate (DOP), viscobyk 5025, and different
amounts of zinc stearate (ZnSt2 ), calcium stearate (CaSt2) and natural zeolite were used
to produce PVC plastisol. Plastisol mixtures having composition given in Table 5.1
were obtained by mixing the additives and PVC plastisol.
The PVC used in this study was the product from Petkim (Petvinil P.38/74). It was
emulsion type PVC.
Dioctylphthalate (DOP) was used as a plasticizer and the product of Merck. Its density
is 0.98 g/ml and molecular weight is 390.54 g/mol. Its purity is greater than 98%. The
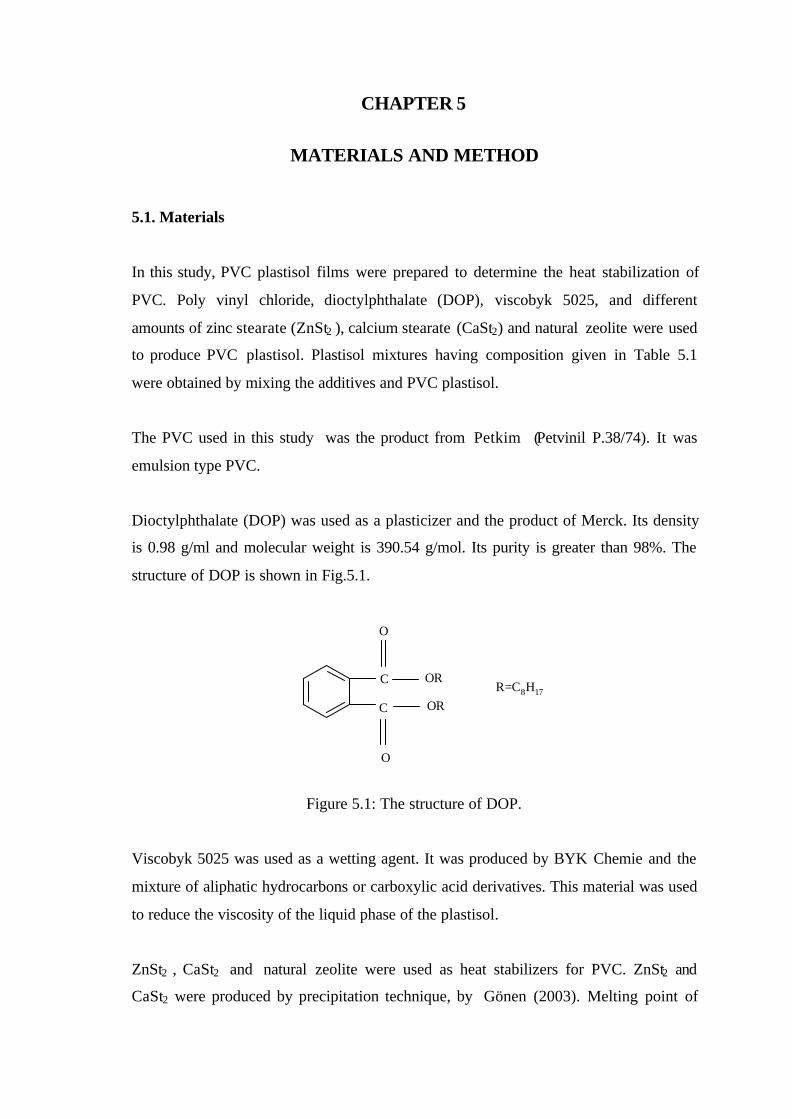
structure of DOP is shown in Fig.5.1.
Figure 5.1: The structure of DOP.
Viscobyk 5025 was used as a wetting agent. It was produced by BYK Chemie and the
mixture of aliphatic hydrocarbons or carboxylic acid derivatives. This material was used
to reduce the viscosity of the liquid phase of the plastisol.
ZnSt2 , CaSt2 and natural zeolite were used as heat stabilizers for PVC. ZnSt2 and
CaSt2 were produced by precipitation technique, by Gönen (2003). Melting point of
C
C
O
O
OR
ORR=C8H17
ZnSt2 was 120-121 °C. Melting point of CaSt2 is 123.15 °C. Zeolitic tuff 1 rich in
klinoptilolite mineral from Gördes in Western Anatolia was used. It was characterized
in a previous study (Metin, 2002), used after grinding and using the fraction passing
through 45 µm sieve.
5.2. Method
PVC plastisols having two different DOP concentrations were prepared. In the first part
of the project, the plastisol was prepared by using 60 per hundred parts (phr) DOP
(wt.33% DOP) for each 100 parts of PVC resin. PVC, DOP and the stabilizers were
mixed in a mortar. The mixture was gelled in 10 cm diameter petri dishes in a static
vacuum oven at 140 °C for 15 min. The gelled plastigels were used to test by PVC
Thermomat. Because of the high viscosity of PVC plastisol and, the samples were not
appropriate to characterize them by spectroscopic techniques.
The plastisol was prepared by using 80 per hundred parts (phr) DOP (wt.43% DOP) for
each 100 parts of PVC resin. DOP, PVC and viscobyk 5025 were stirred by a
mechanical mixer (IKA Labortechnik) at 20 °C for 30 minute. The additives were added
to PVC plastisol samples and stirred by a glass rod.
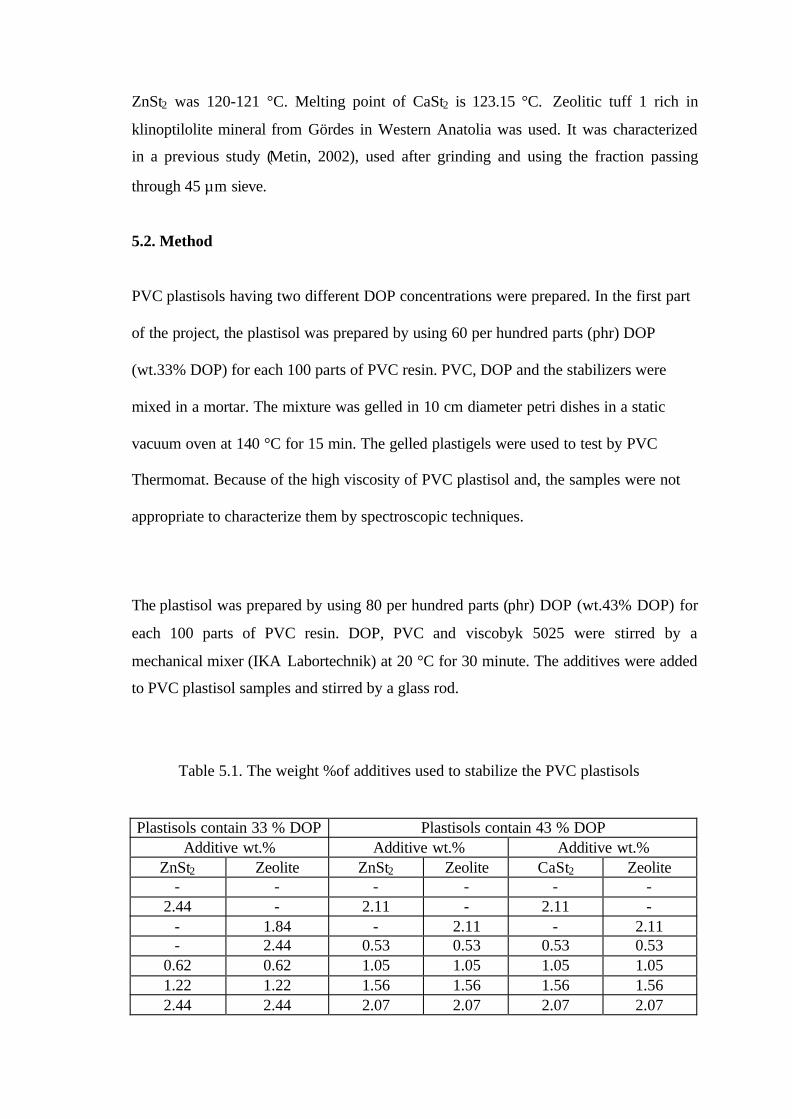
Table 5.1. The weight %of additives used to stabilize the PVC plastisols
Plastisols contain 33 % DOP Plastisols contain 43 % DOPAdditive wt.% Additive wt.% Additive wt.%
ZnSt2 Zeolite ZnSt2 Zeolite CaSt2 Zeolite- - - - - -
2.44 - 2.11 - 2.11 -- 1.84 - 2.11 - 2.11- 2.44 0.53 0.53 0.53 0.53
0.62 0.62 1.05 1.05 1.05 1.051.22 1.22 1.56 1.56 1.56 1.562.44 2.44 2.07 2.07 2.07 2.07
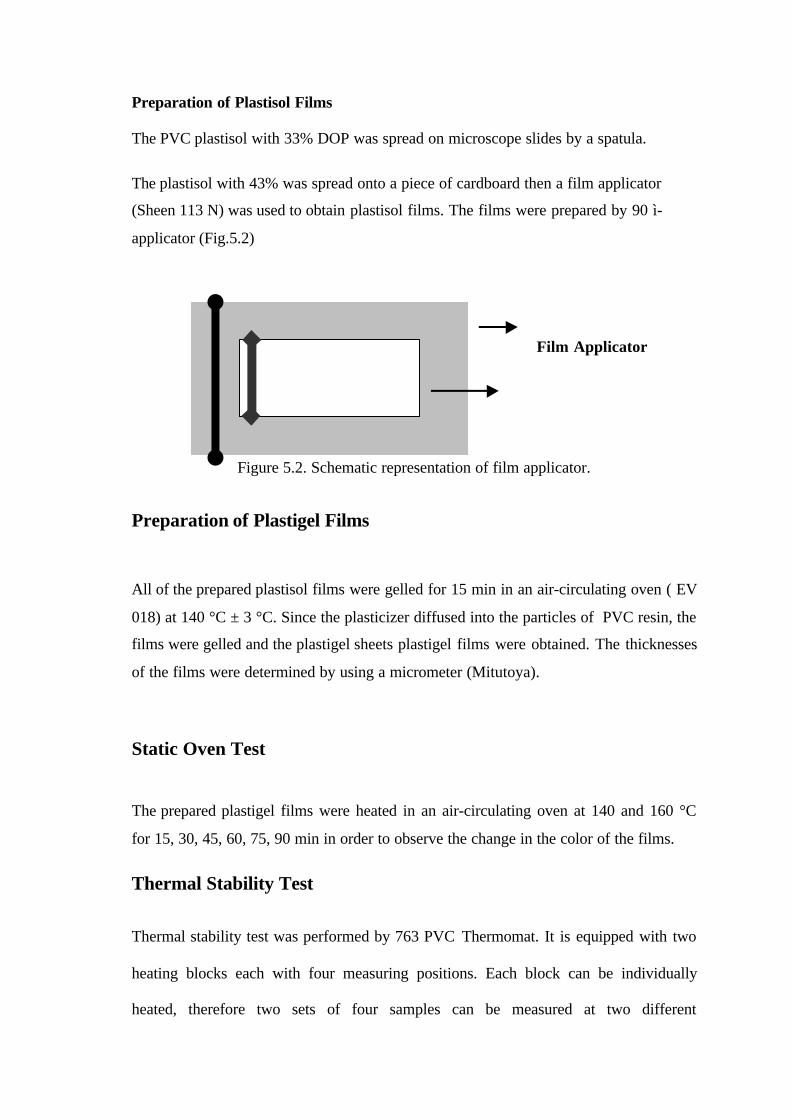
Preparation of Plastisol Films
The PVC plastisol with 33% DOP was spread on microscope slides by a spatula.
The plastisol with 43% was spread onto a piece of cardboard then a film applicator
(Sheen 113 N) was used to obtain plastisol films. The films were prepared by 90 ì-
applicator (Fig.5.2)
Figure 5.2. Schematic representation of film applicator.
Preparation of Plastigel Films
All of the prepared plastisol films were gelled for 15 min in an air-circulating oven ( EV
018) at 140 °C ± 3 °C. Since the plasticizer diffused into the particles of PVC resin, the
films were gelled and the plastigel sheets plastigel films were obtained. The thicknesses
of the films were determined by using a micrometer (Mitutoya).
Static Oven Test
The prepared plastigel films were heated in an air-circulating oven at 140 and 160 °C
for 15, 30, 45, 60, 75, 90 min in order to observe the change in the color of the films.
Thermal Stability Test
Thermal stability test was performed by 763 PVC Thermomat. It is equipped with two
heating blocks each with four measuring positions. Each block can be individually
heated, therefore two sets of four samples can be measured at two different
Film Applicator
Plastisol film
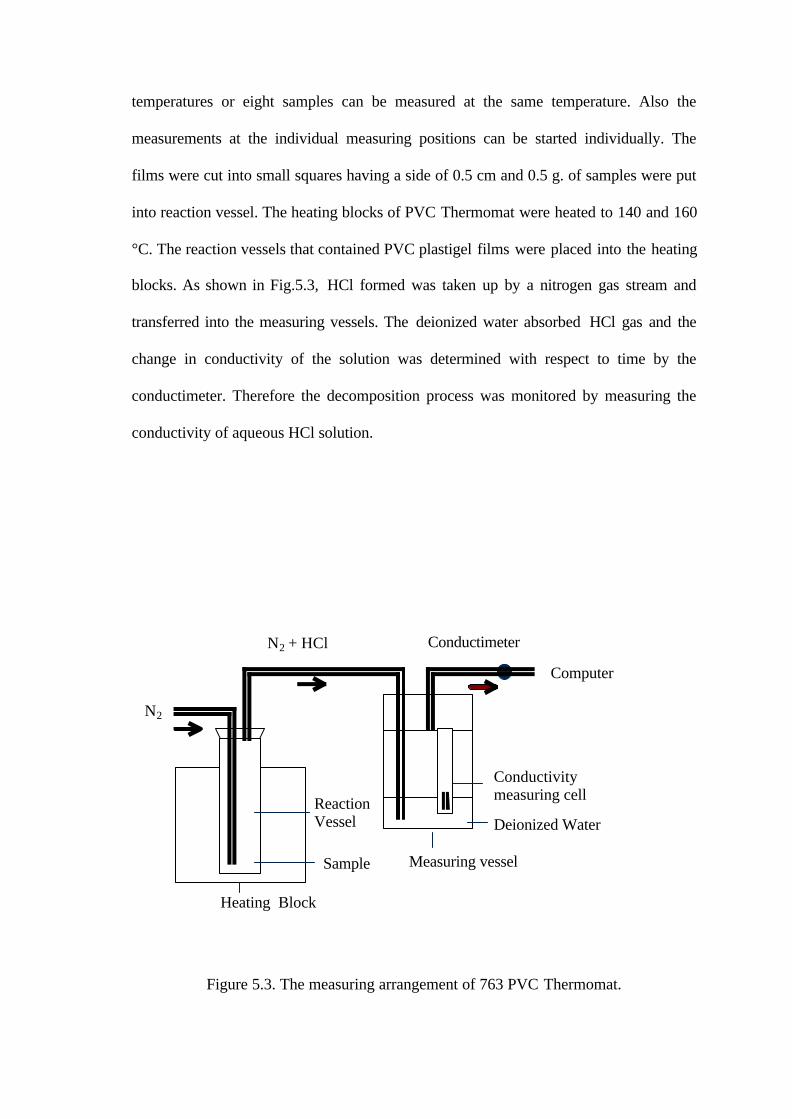
temperatures or eight samples can be measured at the same temperature. Also the
measurements at the individual measuring positions can be started individually. The
films were cut into small squares having a side of 0.5 cm and 0.5 g. of samples were put
into reaction vessel. The heating blocks of PVC Thermomat were heated to 140 and 160
°C. The reaction vessels that contained PVC plastigel films were placed into the heating
blocks. As shown in Fig.5.3, HCl formed was taken up by a nitrogen gas stream and
transferred into the measuring vessels. The deionized water absorbed HCl gas and the
change in conductivity of the solution was determined with respect to time by the
conductimeter. Therefore the decomposition process was monitored by measuring the
conductivity of aqueous HCl solution.
Figure 5.3. The measuring arrangement of 763 PVC Thermomat.
N2
Heating Block
N2 + HCl
Sample
ReactionVessel Deionized Water
Conductivitymeasuring cell
Measuring vessel
Conductimeter
Computer
Study of the Films with FTIR, UV Spectroscopy and Spectrocam
FTIR spectra of PVC, viscobyk 5025 DOP, ZnSt2, and CaSt2 were obtained by KBr disc
method.
The films having 43% DOP gelled at 140 °C for 15 min and heated at 160 °C for 90
min were studied by using FTIR spectroscopy (Shimadzu 8601 PC) and UV
spectroscopy (Shimadzu UV-2450). Also the L, a, b values of these films were
determined by Avantes Spectrocam.
Study of the Films with Scanning Electron Microscopy and Optical
Microscopy
The cross section areas of the PVC films which were gelled at 140 °C for 15 min and
heated at 160 °C for 90 min were studied by scanning electron microscopy (Philips, XL-
30SFG). The elemental analysis of the particle and polymer phases was performed.
PVC plastisols were heated up to 200 °C in the hot stage controlled by a temperature
controller (INSTEC STC 200) and the gelation of the plastisols were observed by
optical microscopy (Olympus CH40) and the photographs were taken by a digital
camera (Camedia C-4040 ).
TGA Study
TGA curves of PVC plastigels which were gelled at 140 °C for 15 min
were obtained by heating the samples to 600 °C, with 10 °C/min heating
rate under N2 atmosphere. TGA studies were performed by Shimadzu
TGA-51.
CHAPTER 6
RESULTS AND DISCUSSION
6.1. Characterization of the Materials
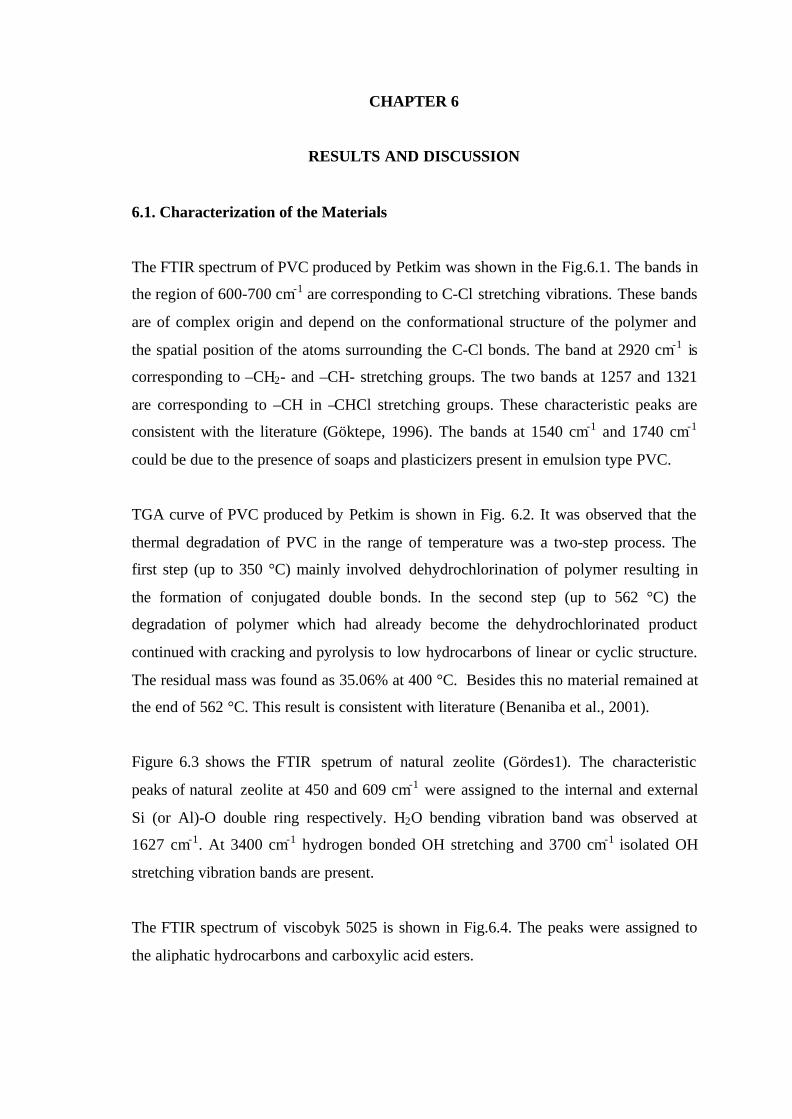
The FTIR spectrum of PVC produced by Petkim was shown in the Fig.6.1. The bands in
the region of 600-700 cm-1 are corresponding to C-Cl stretching vibrations. These bands
are of complex origin and depend on the conformational structure of the polymer and
the spatial position of the atoms surrounding the C-Cl bonds. The band at 2920 cm-1 is
corresponding to –CH2- and –CH- stretching groups. The two bands at 1257 and 1321
are corresponding to –CH in –CHCl stretching groups. These characteristic peaks are
consistent with the literature (Göktepe, 1996). The bands at 1540 cm-1 and 1740 cm-1
could be due to the presence of soaps and plasticizers present in emulsion type PVC.
TGA curve of PVC produced by Petkim is shown in Fig. 6.2. It was observed that the
thermal degradation of PVC in the range of temperature was a two-step process. The
first step (up to 350 °C) mainly involved dehydrochlorination of polymer resulting in
the formation of conjugated double bonds. In the second step (up to 562 °C) the
degradation of polymer which had already become the dehydrochlorinated product
continued with cracking and pyrolysis to low hydrocarbons of linear or cyclic structure.
The residual mass was found as 35.06% at 400 °C. Besides this no material remained at
the end of 562 °C. This result is consistent with literature (Benaniba et al., 2001).
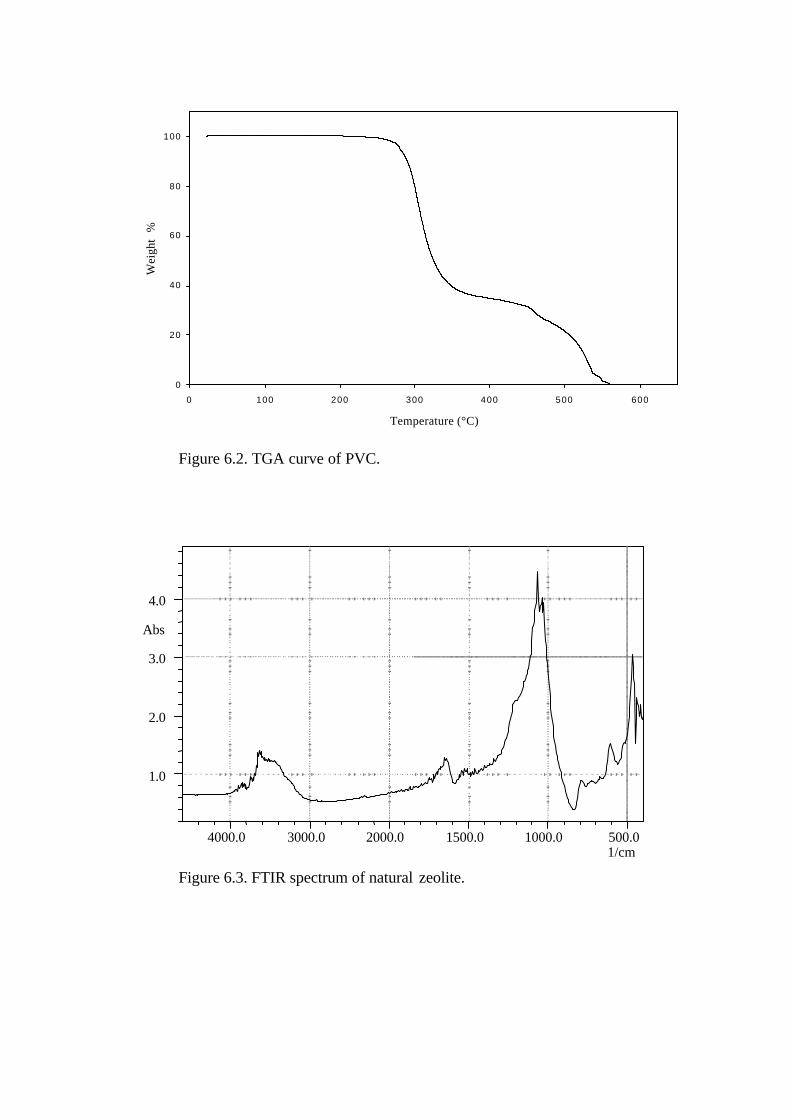
Figure 6.3 shows the FTIR spetrum of natural zeolite (Gördes1). The characteristic
peaks of natural zeolite at 450 and 609 cm-1 were assigned to the internal and external
Si (or Al)-O double ring respectively. H2O bending vibration band was observed at
1627 cm-1. At 3400 cm-1 hydrogen bonded OH stretching and 3700 cm-1 isolated OH
stretching vibration bands are present.
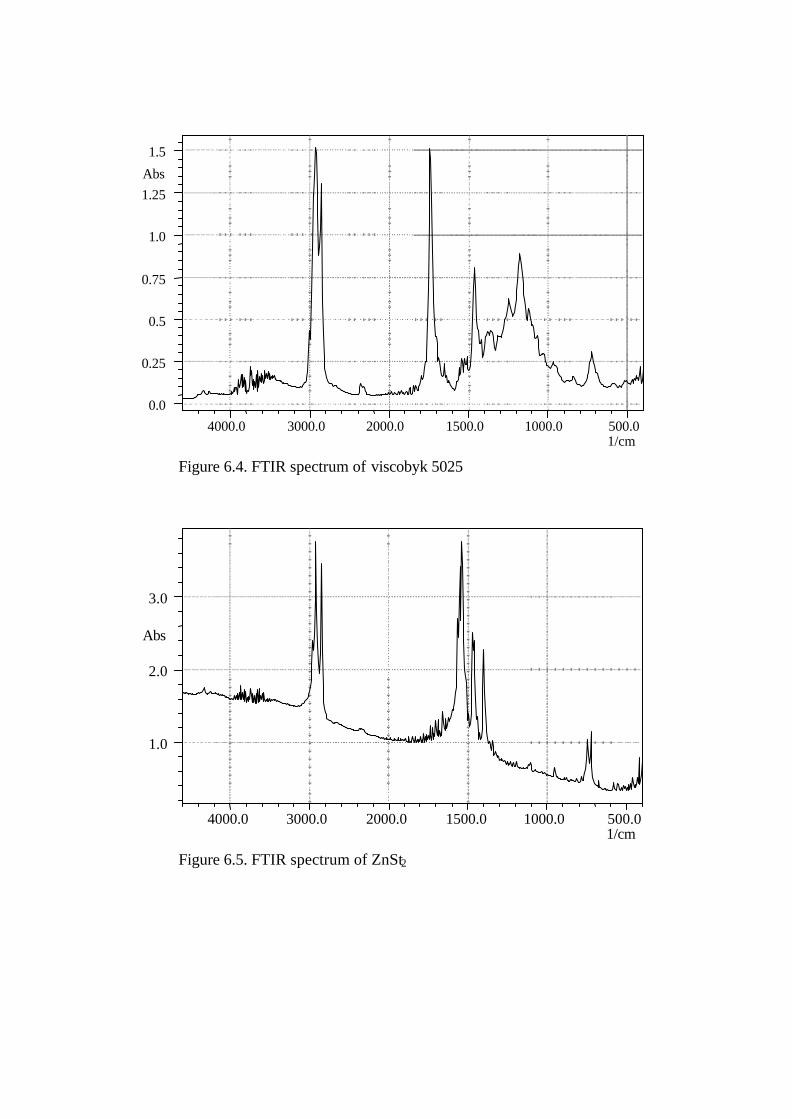
The FTIR spectrum of viscobyk 5025 is shown in Fig.6.4. The peaks were assigned to
the aliphatic hydrocarbons and carboxylic acid esters.
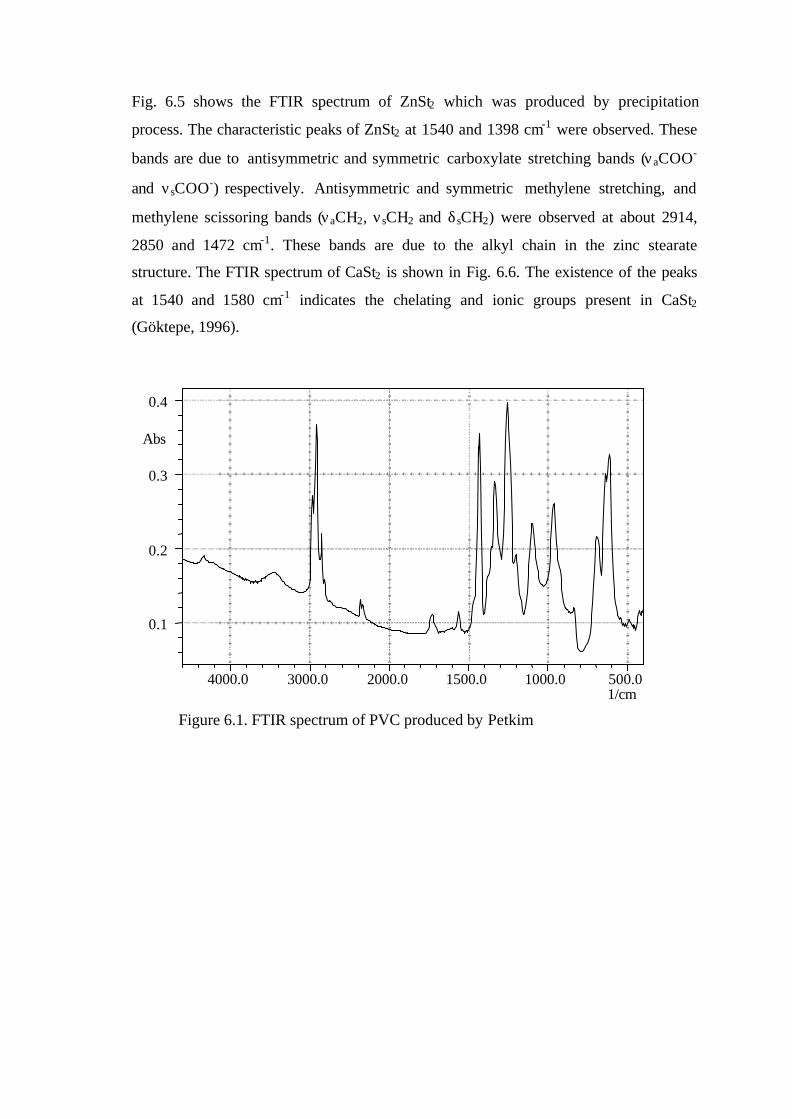
Fig. 6.5 shows the FTIR spectrum of ZnSt2 which was produced by precipitation
process. The characteristic peaks of ZnSt2 at 1540 and 1398 cm-1 were observed. These
bands are due to antisymmetric and symmetric carboxylate stretching bands (νaCOO-
and νsCOO-) respectively. Antisymmetric and symmetric methylene stretching, and
methylene scissoring bands (νaCH2, νsCH2 and δsCH2) were observed at about 2914,
2850 and 1472 cm-1. These bands are due to the alkyl chain in the zinc stearate
structure. The FTIR spectrum of CaSt2 is shown in Fig. 6.6. The existence of the peaks
at 1540 and 1580 cm-1 indicates the chelating and ionic groups present in CaSt2
(Göktepe, 1996).
500.01000.01500.02000.03000.04000.01/cm
0.1
0.2
0.3
0.4
Abs
Figure 6.1. FTIR spectrum of PVC produced by Petkim
0
20
40
60
80
100
0 100 200 300 400 500 600
Temperature (°C)
Wei
ght
%
Figure 6.2. TGA curve of PVC.
500.01000.01500.02000.03000.04000.01/cm
1.0
2.0
3.0
4.0
Abs
Figure 6.3. FTIR spectrum of natural zeolite.
500.01000.01500.02000.03000.04000.01/cm
0.0
0.25
0.5
0.75
1.0
1.25
1.5
Abs
Figure 6.4. FTIR spectrum of viscobyk 5025
500.01000.01500.02000.03000.04000.01/cm
1.0
2.0
3.0
Abs
Figure 6.5. FTIR spectrum of ZnSt2
500.01000.01500.02000.03000.04000.01/cm
0.2
0.3
0.4
0.5
0.6
0.7Abs
Figure 6.6. FTIR spectrum of CaSt2
6.2. Characterization of PVC Plastisol and PVC Plastigel
6.2.1. Gelation and Fusion Behaviour of PVC Plastisol
All the industrial processes for plastisols involve the heating of the plastisol in an oven
at about 180-200 °C. PVC plastisol samples were heated up to 200 °C in the hot stage
controlled by a temperature controller. Optical micrographs of PVC plastisol stabilized
with different amounts additives were taken at different temperatures to observe the
penetration of plasticizer into PVC grains, and the fusion of PVC particles and
plasticizer. The micrographs of PVC plastisol are shown in Fig.6.7.

Figure 6.7. Optical micrographs of PVC plastisol.
(a; 29.6 °C, b;74.5 °C, c;160.0 °C and d;185.0 °C)
It was observed that as the temperature was increased, plasticizer (DOP) swelled PVC
particles and the particles touched each other. Since the parts where DOP diffuses into
PVC particles are transparent, they are white in these micrographs (Baltacýoðlu, 1994).
On the other hand the black parts indicate PVC as seen in Fig.6.7c. Finally a
homogeneous material was formed called as plastigel. The gelation of PVC plastisol
was completed at 185 °C.
Optical micrographs of PVC plastisol stabilized with 2.11%ZnSt2 are shown in Fig.6.8.
a b
c d
50 µ 50 µ
50 µ50 µ
a b
c d
Figure 6.8. Optical micrographs of PVC plastisol stabilized with
2.11%ZnSt2
(a; 31.3 °C, b;100.0 °C, c;160.6 °C and d;185.0 °C)
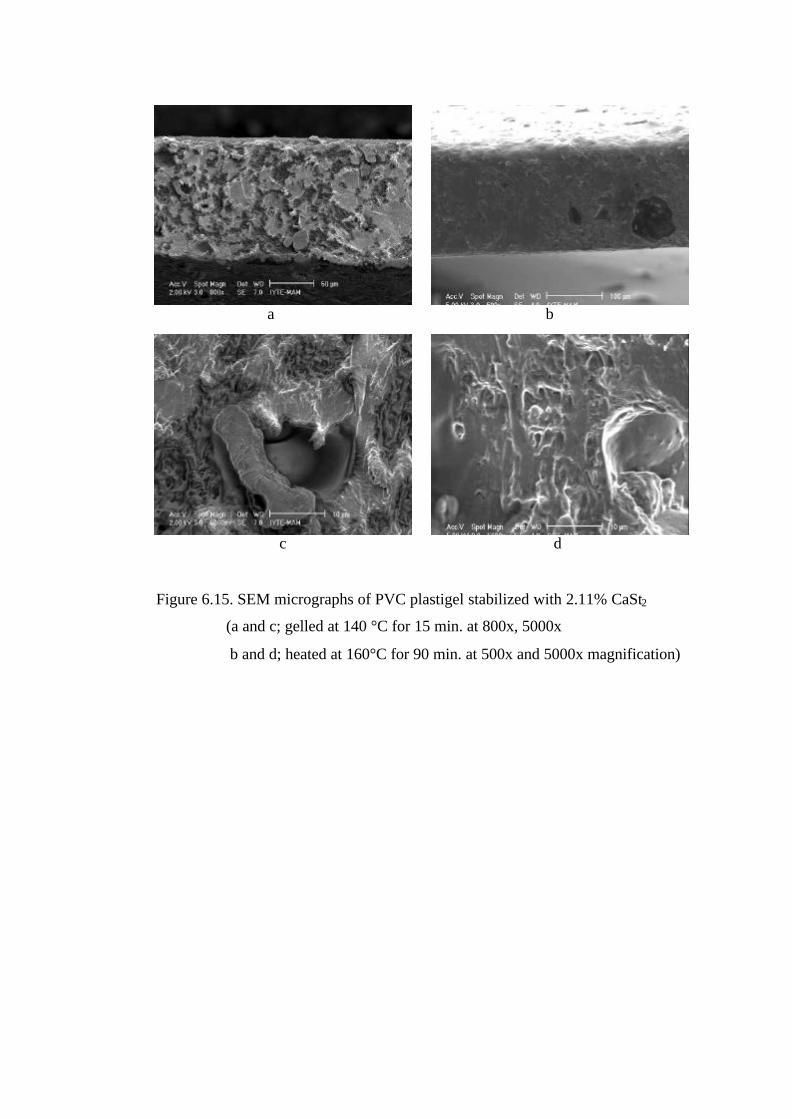
The black points in the PVC plastisol in Fig.6.8a are due to entrapped air during
plastisol mixing. As the temperature is increased the holes due to entrapped air
disappear. In spite of the melting of ZnSt2 particles at 121 °C, the formed plastigel is not
as homogeneous as the unstabilized one at 185 °C (Fig.6.8d).
The optical micrographs of PVC plastisol stabilized with 2.07 wt. % ZnSt2 and 2.07 wt.
% zeolite are shown in Fig.6.9.
50 µ 50 µ
50 µ 50 µ
a b
c d
Figure 6.9. Optical micrographs PVC plastisol stabilized with 2.07% ZnSt2
and 2.07% zeolite.
(a;29.6 °C, b;75 °C, c;160.0 °C, d;180 °C)
Gelation began to produce due to the swelling of the PVC particles (Fig.6.9b) and the
interaction among themselves which developed a gel structure. The homogeneous
material can not be observed in Fig.6.9d since PVC plastisol contains zeolite.
The homogeneous material was formed as shown in Fig.6.10, when the plastisol
stabilized with 2.11 wt.%CaSt2 since the melting temperature of CaSt2 is 123.15 °C. At
163.8 °C, the size and number of ungelled particles were lower.
50 µ 50 µ
50 µ 50 µ
a b
c d
Figure 6.10. Optical micrographs PVC plastisols stabilized with 2.11% CaSt2
(a;22.4 °C, b;99.7 °C, c;163.8 °C, d;195.7 °C)
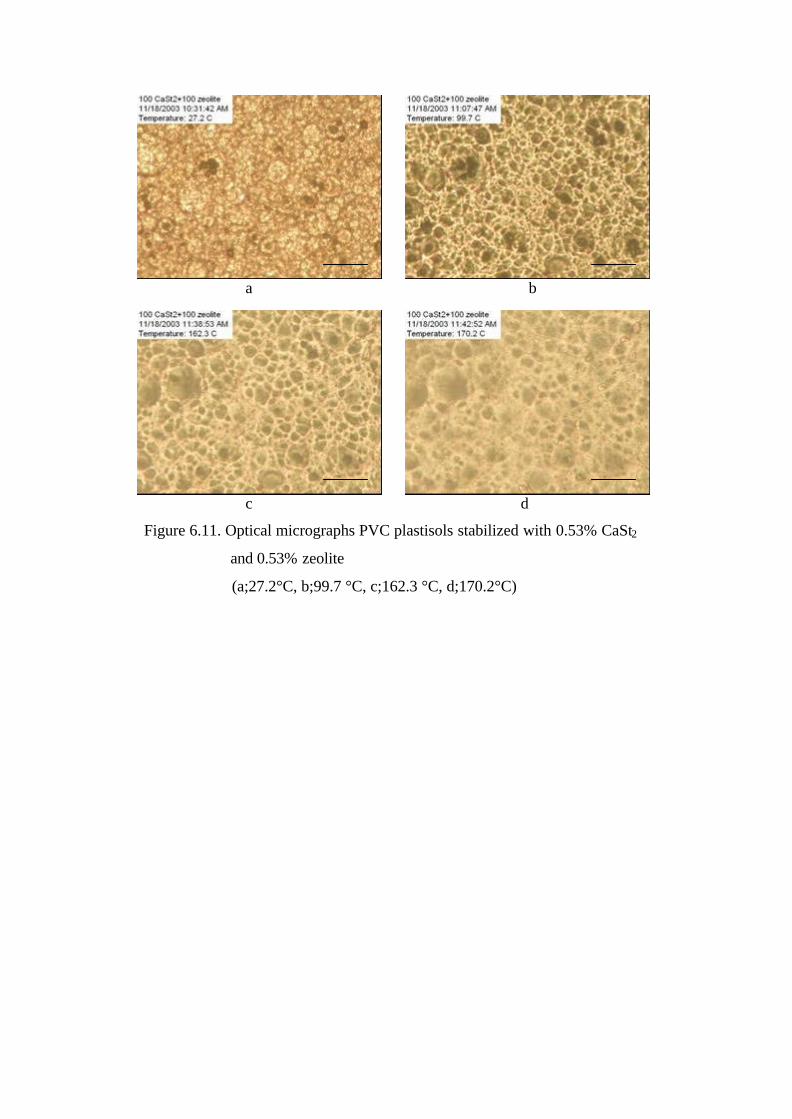
The optical micrographs PVC plastisols stabilized with 0.53% CaSt2 and 0.53% zeolite
are shown in Fig.6.11. These micrographs clearly reveal that the diffusion of DOP into
the PVC particles. It was observed that the homogeneous PVC plastisol was not formed
at 170 °C.
50 µ 50 µ
50 µ 50 µ
a b
c d
Figure 6.11. Optical micrographs PVC plastisols stabilized with 0.53% CaSt2
and 0.53% zeolite
(a;27.2°C, b;99.7 °C, c;162.3 °C, d;170.2°C)
50 µ 50 µ
50 µ 50 µ
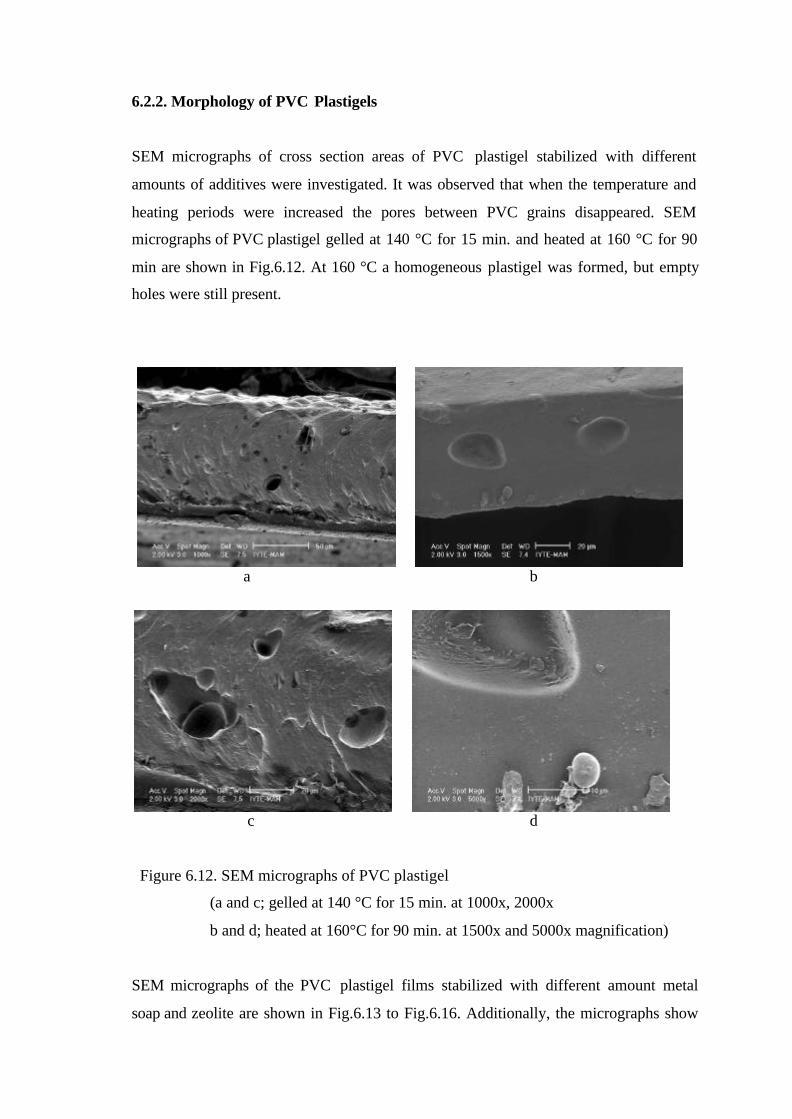
6.2.2. Morphology of PVC Plastigels
SEM micrographs of cross section areas of PVC plastigel stabilized with different
amounts of additives were investigated. It was observed that when the temperature and
heating periods were increased the pores between PVC grains disappeared. SEM
micrographs of PVC plastigel gelled at 140 °C for 15 min. and heated at 160 °C for 90
min are shown in Fig.6.12. At 160 °C a homogeneous plastigel was formed, but empty
holes were still present.
a b
c d
Figure 6.12. SEM micrographs of PVC plastigel
(a and c; gelled at 140 °C for 15 min. at 1000x, 2000x
b and d; heated at 160°C for 90 min. at 1500x and 5000x magnification)
SEM micrographs of the PVC plastigel films stabilized with different amount metal
soap and zeolite are shown in Fig.6.13 to Fig.6.16. Additionally, the micrographs show
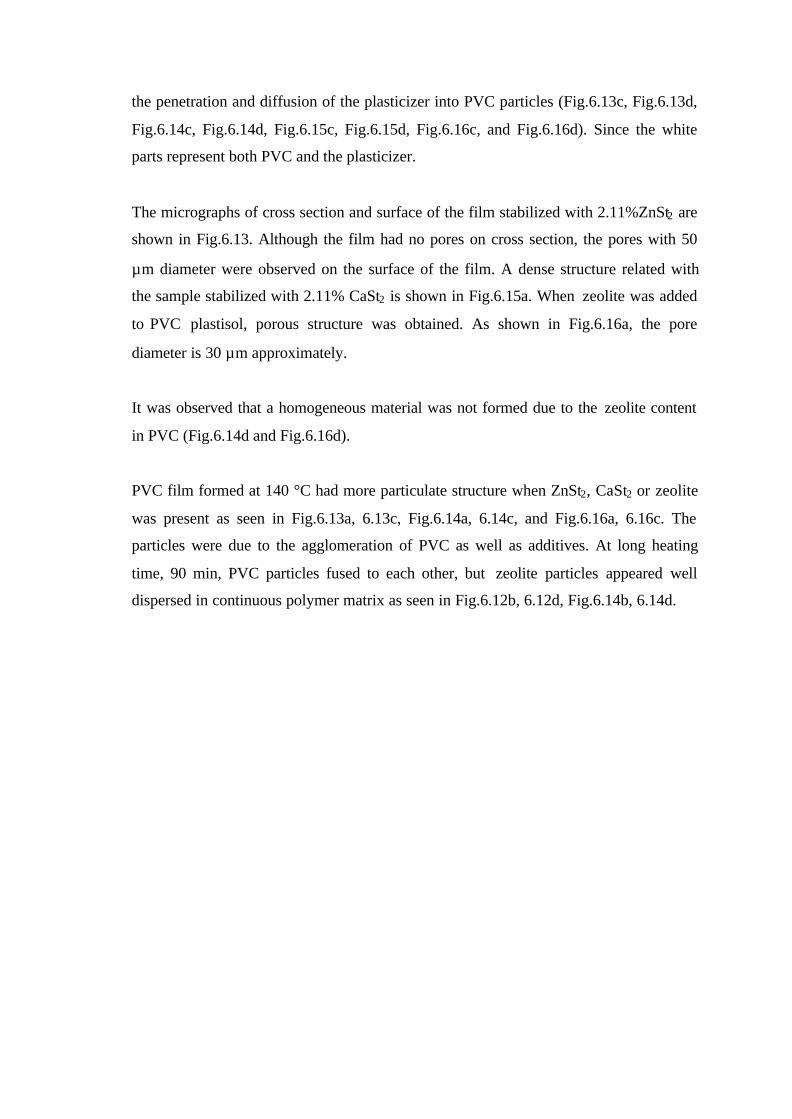
the penetration and diffusion of the plasticizer into PVC particles (Fig.6.13c, Fig.6.13d,
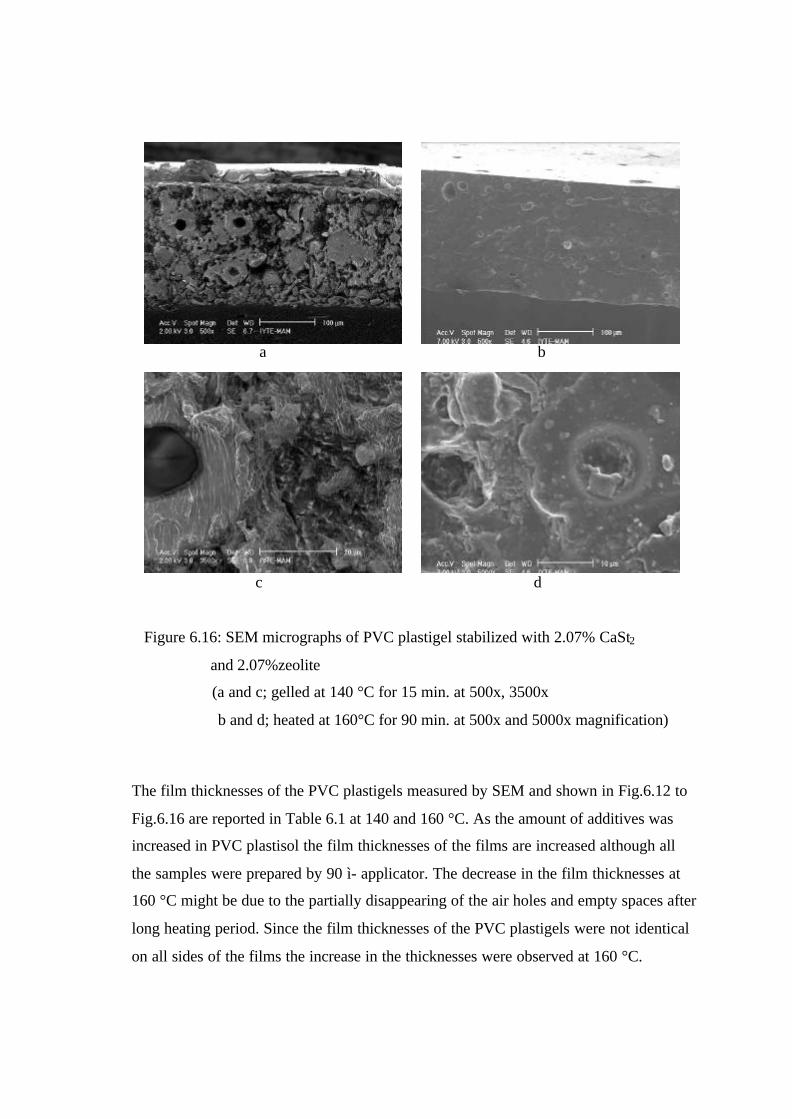
Fig.6.14c, Fig.6.14d, Fig.6.15c, Fig.6.15d, Fig.6.16c, and Fig.6.16d). Since the white
parts represent both PVC and the plasticizer.
The micrographs of cross section and surface of the film stabilized with 2.11%ZnSt2 are
shown in Fig.6.13. Although the film had no pores on cross section, the pores with 50
µm diameter were observed on the surface of the film. A dense structure related with
the sample stabilized with 2.11% CaSt2 is shown in Fig.6.15a. When zeolite was added
to PVC plastisol, porous structure was obtained. As shown in Fig.6.16a, the pore
diameter is 30 µm approximately.
It was observed that a homogeneous material was not formed due to the zeolite content
in PVC (Fig.6.14d and Fig.6.16d).
PVC film formed at 140 °C had more particulate structure when ZnSt2, CaSt2 or zeolite
was present as seen in Fig.6.13a, 6.13c, Fig.6.14a, 6.14c, and Fig.6.16a, 6.16c. The
particles were due to the agglomeration of PVC as well as additives. At long heating
time, 90 min, PVC particles fused to each other, but zeolite particles appeared well
dispersed in continuous polymer matrix as seen in Fig.6.12b, 6.12d, Fig.6.14b, 6.14d.

a b
c d
e
Figure 6.13. SEM micrographs of PVC plastigel stabilized with 2.11% ZnSt2
(a and c; gelled at 140 °C for 15 min. at 800x, 2500x
b and d; heated at 160°C for 90 min. at 800x and 5000x magnification
e is the surface of PVC plastigel heated at 160 °C for 90 min.at 650x)
a b
c d
Figure 6.14. SEM micrographs of PVC plastigel stabilized with 2.07% ZnSt2 and
2.07%zeolite
(a and c; gelled at 140 °C for 15 min. at 500x, 6000x
b and d; heated at 160°C for 90 min. at 650x and 5000x magnification)
a b
c d
Figure 6.15. SEM micrographs of PVC plastigel stabilized with 2.11% CaSt2
(a and c; gelled at 140 °C for 15 min. at 800x, 5000x
b and d; heated at 160°C for 90 min. at 500x and 5000x magnification)
a b
c d
Figure 6.16: SEM micrographs of PVC plastigel stabilized with 2.07% CaSt2
and 2.07%zeolite
(a and c; gelled at 140 °C for 15 min. at 500x, 3500x
b and d; heated at 160°C for 90 min. at 500x and 5000x magnification)
The film thicknesses of the PVC plastigels measured by SEM and shown in Fig.6.12 to
Fig.6.16 are reported in Table 6.1 at 140 and 160 °C. As the amount of additives was
increased in PVC plastisol the film thicknesses of the films are increased although all
the samples were prepared by 90 ì- applicator. The decrease in the film thicknesses at
160 °C might be due to the partially disappearing of the air holes and empty spaces after
long heating period. Since the film thicknesses of the PVC plastigels were not identical
on all sides of the films the increase in the thicknesses were observed at 160 °C.
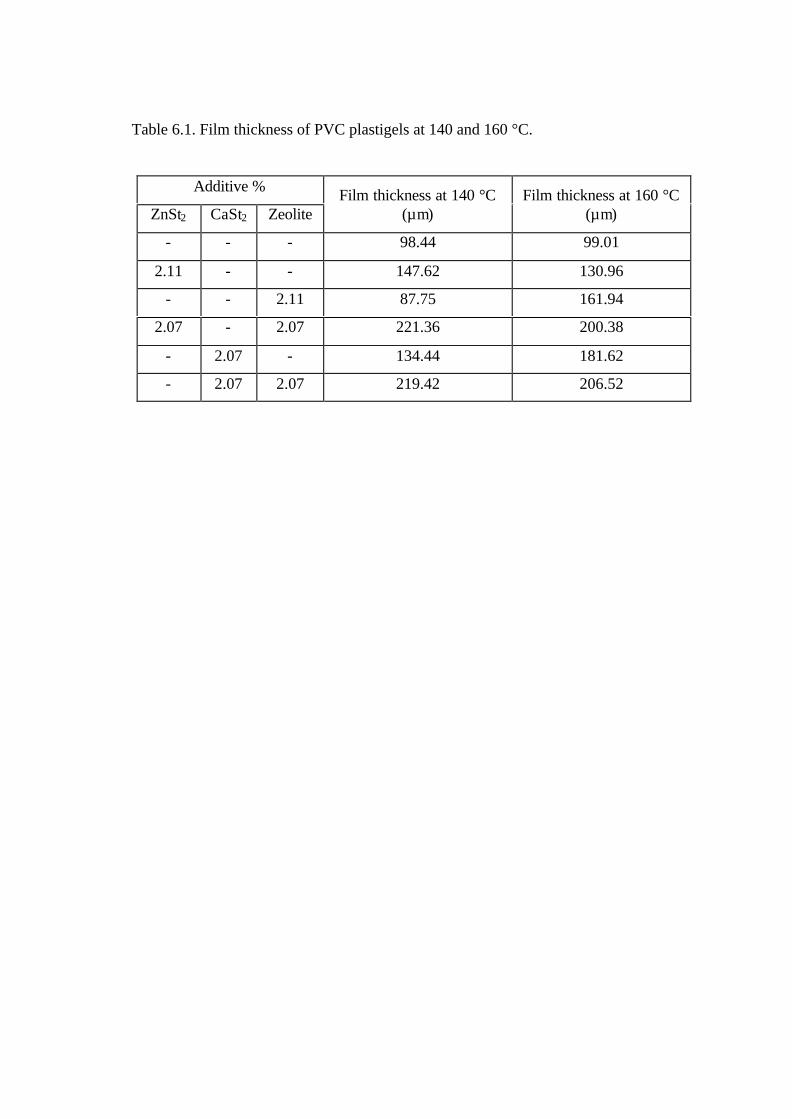
Table 6.1. Film thickness of PVC plastigels at 140 and 160 °C.
Additive %
ZnSt2 CaSt2 ZeoliteFilm thickness at 140 °C
(µm)Film thickness at 160 °C
(µm)
- - - 98.44 99.01
2.11 - - 147.62 130.96
- - 2.11 87.75 161.94
2.07 - 2.07 221.36 200.38
- 2.07 - 134.44 181.62
- 2.07 2.07 219.42 206.52
6.2.3. Elemental Analysis of PVC Plastigels
PVC plastigels were analyzed with EDX coupled to a scanning electron microscope
(SEM) in order to investigate the composition of elements in polymer and particle
phases and the dispersion of metal soap particles in PVC plastigel. Five different points
were chosen to determine the weight % of each element in polymer and particle phases.
The weight % of each element in particle phase was investigated for the samples
stabilized with zeolite. The weight % values of each element were evaluated by taking
the average of these five values. Additionally, the standard deviation values of each
element were calculated. High standard deviations were evaluated since PVC plastigel
was not a homogeneous material. An example for EDX analysis is shown in Fig.6.17 to
Fig.6.19. As shown in these micrographs, the weight % of each element was
investigated in polymer and particle phases. Fig.6.18 and Fig.6.19 show the distribution
of elements in polymer and particle phases. The peaks corresponding to silicon (Si) and
aluminum (Al) are not clear in polymer phase (Fig.6.18) but they become clear in
particle phase since this particle belongs to natural zeolite (Fig.6.19). The theoretical
values of composition of elements were calculated and they are reported in Table 6.2.
The results of elemental analysis are shown in Table 6.3 to Table 6.6. Natural zeolite
composition was previously reported by Özmýhçý et al., 2000.
It was observed that for all samples, the weight % values of carbon (C) in the range
70.06-81.20% at 140 °C were close to the weight % of carbon of the plasticizer (DOP)
73.81% (Table 6.2). Also the weight % of chlorine (Cl), 6.49-23.8%, at 140 °C was
lower than the weight % in the range 14.01-64.12% at 160 °C. This indicated the
incomplete gelation at low temperature. The high weight % of oxygen (O), 5.07-12.72%
at 140 °C also justified this result, since DOP was not absorbed by PVC particles and it
covered the surface where EDX analysis was performed. At 160 °C, the gelation was
completed, DOP diffused into PVC particles. Accordingly, the weight % of oxygen
decreased from 9.09 to 2.18, whereas the weight % of chlorine increased from 16.37 to
64.12 for PVC plastigel.
In particle phase, the weight % values of chlorine (Cl) were evaluated as 2.51 for the
sample stabilized with 2.11% zeolite, 1.83 for the sample stabilized with 2.07% ZnSt2
and 2.07% zeolite, 3.08 for the sample stabilized with 2.07% CaSt2 and 2.07% zeolite at
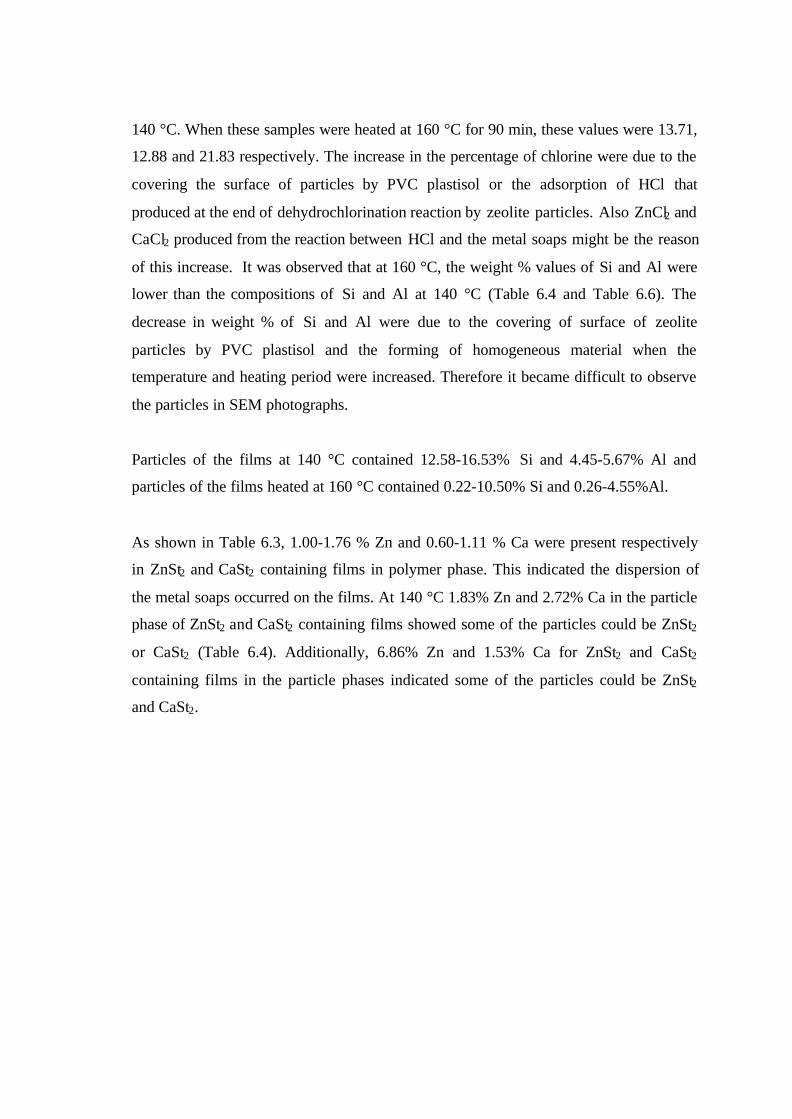
140 °C. When these samples were heated at 160 °C for 90 min, these values were 13.71,
12.88 and 21.83 respectively. The increase in the percentage of chlorine were due to the
covering the surface of particles by PVC plastisol or the adsorption of HCl that
produced at the end of dehydrochlorination reaction by zeolite particles. Also ZnCl2 and
CaCl2 produced from the reaction between HCl and the metal soaps might be the reason
of this increase. It was observed that at 160 °C, the weight % values of Si and Al were
lower than the compositions of Si and Al at 140 °C (Table 6.4 and Table 6.6). The
decrease in weight % of Si and Al were due to the covering of surface of zeolite
particles by PVC plastisol and the forming of homogeneous material when the
temperature and heating period were increased. Therefore it became difficult to observe
the particles in SEM photographs.
Particles of the films at 140 °C contained 12.58-16.53% Si and 4.45-5.67% Al and
particles of the films heated at 160 °C contained 0.22-10.50% Si and 0.26-4.55%Al.
As shown in Table 6.3, 1.00-1.76 % Zn and 0.60-1.11 % Ca were present respectively
in ZnSt2 and CaSt2 containing films in polymer phase. This indicated the dispersion of
the metal soaps occurred on the films. At 140 °C 1.83% Zn and 2.72% Ca in the particle
phase of ZnSt2 and CaSt2 containing films showed some of the particles could be ZnSt2
or CaSt2 (Table 6.4). Additionally, 6.86% Zn and 1.53% Ca for ZnSt2 and CaSt2
containing films in the particle phases indicated some of the particles could be ZnSt2
and CaSt2.
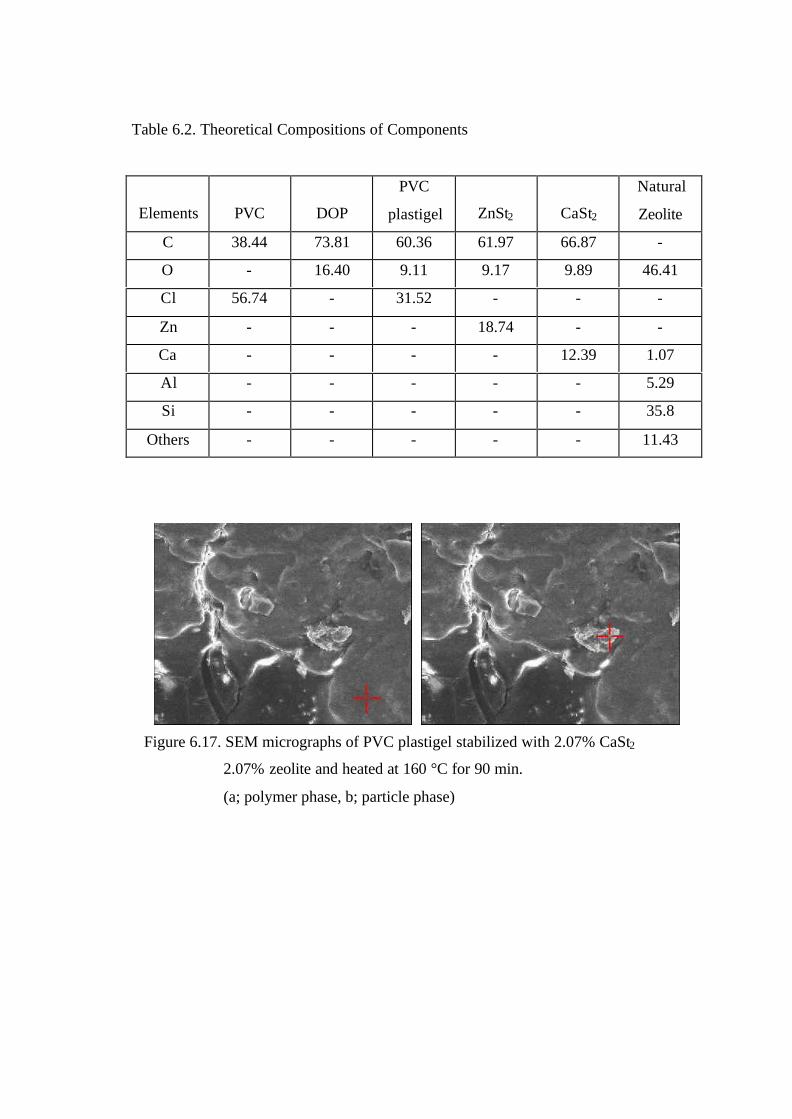
Table 6.2. Theoretical Compositions of Components
Elements PVC DOP
PVC
plastigel ZnSt2 CaSt2
Natural
Zeolite
C 38.44 73.81 60.36 61.97 66.87 -
O - 16.40 9.11 9.17 9.89 46.41
Cl 56.74 - 31.52 - - -
Zn - - - 18.74 - -
Ca - - - - 12.39 1.07
Al - - - - - 5.29
Si - - - - - 35.8
Others - - - - - 11.43
a b
Figure 6.17. SEM micrographs of PVC plastigel stabilized with 2.07% CaSt2
2.07% zeolite and heated at 160 °C for 90 min.
(a; polymer phase, b; particle phase)
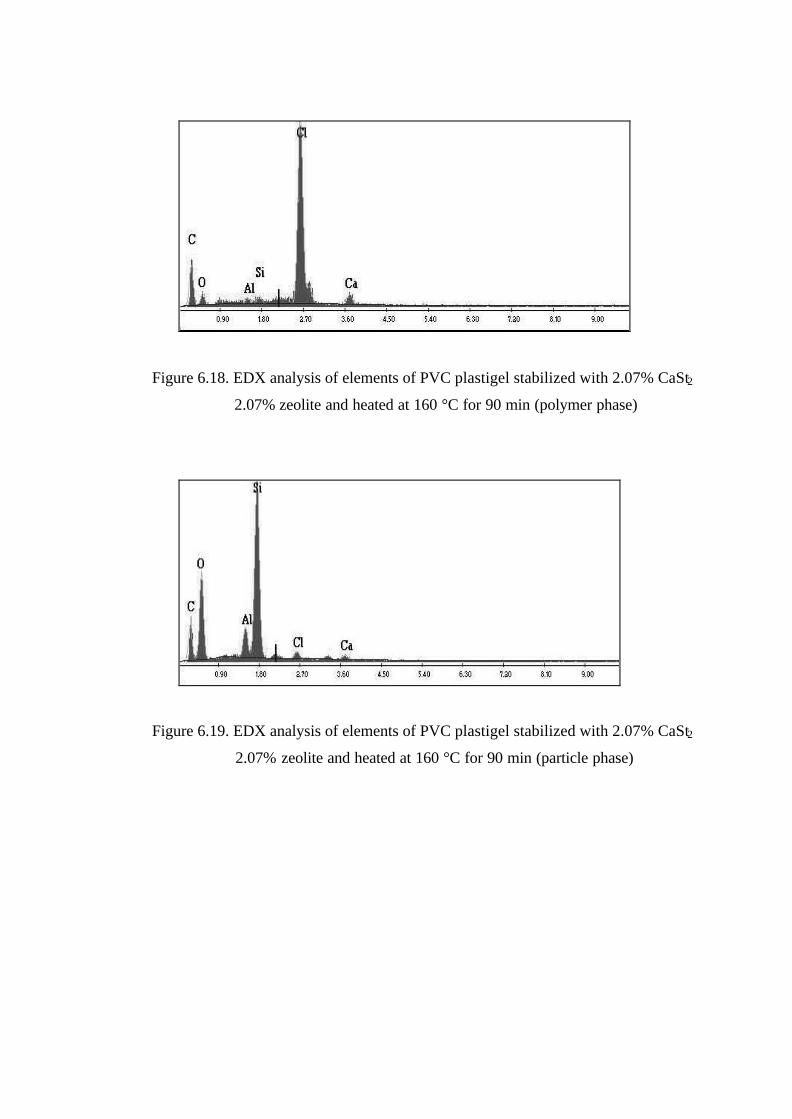
Figure 6.18. EDX analysis of elements of PVC plastigel stabilized with 2.07% CaSt2
2.07% zeolite and heated at 160 °C for 90 min (polymer phase)
Figure 6.19. EDX analysis of elements of PVC plastigel stabilized with 2.07% CaSt2
2.07% zeolite and heated at 160 °C for 90 min (particle phase)

Table 6.3. Elemental analysis of polymer phase of PVC plastigel films gelled at 140 °C for 15 min.
% Additive Polymer Phase
C% O% Cl% Zn% Ca%ZnSt2 CaSt2 Zeolite
Av. Std.dev Av. Std.dev Av Std.dev Av. Std.dev Av. Std.dev
- - - 73.90 0.98 9.09 0.40 16.37 0.78 - - - -
2.11 - - 79.59 3.68 11.35 5.28 7.29 3.70 1.76 1.64 - -
- - 2.11 81.20 0.89 12.31 1.41 6.49 0.87 - - - -
2.07 - 2.07 70.06 8.56 5.07 0.39 23.87 8.50 1.00 0.14 - -
- 2.11 - 74.17 1.68 12.72 7.65 12.01 7.88 - - 1.11 0.09
- 2.07 2.07 74.90 3.40 5.72 0.58 18.79 3.77 - - 0.60 0.39
54
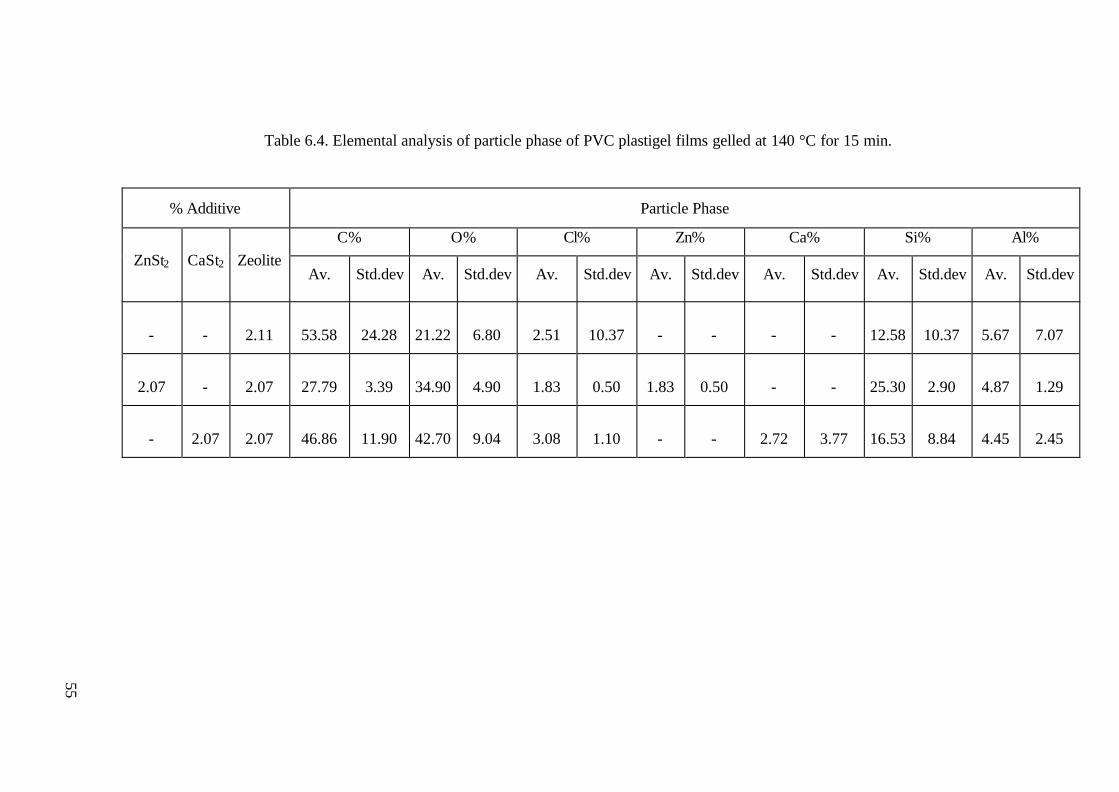
Table 6.4. Elemental analysis of particle phase of PVC plastigel films gelled at 140 °C for 15 min.
% Additive Particle Phase
C% O% Cl% Zn% Ca% Si% Al%ZnSt2 CaSt2 Zeolite
Av. Std.dev Av. Std.dev Av. Std.dev Av. Std.dev Av. Std.dev Av. Std.dev Av. Std.dev
- - 2.11 53.58 24.28 21.22 6.80 2.51 10.37 - - - - 12.58 10.37 5.67 7.07
2.07 - 2.07 27.79 3.39 34.90 4.90 1.83 0.50 1.83 0.50 - - 25.30 2.90 4.87 1.29
- 2.07 2.07 46.86 11.90 42.70 9.04 3.08 1.10 - - 2.72 3.77 16.53 8.84 4.45 2.45
55
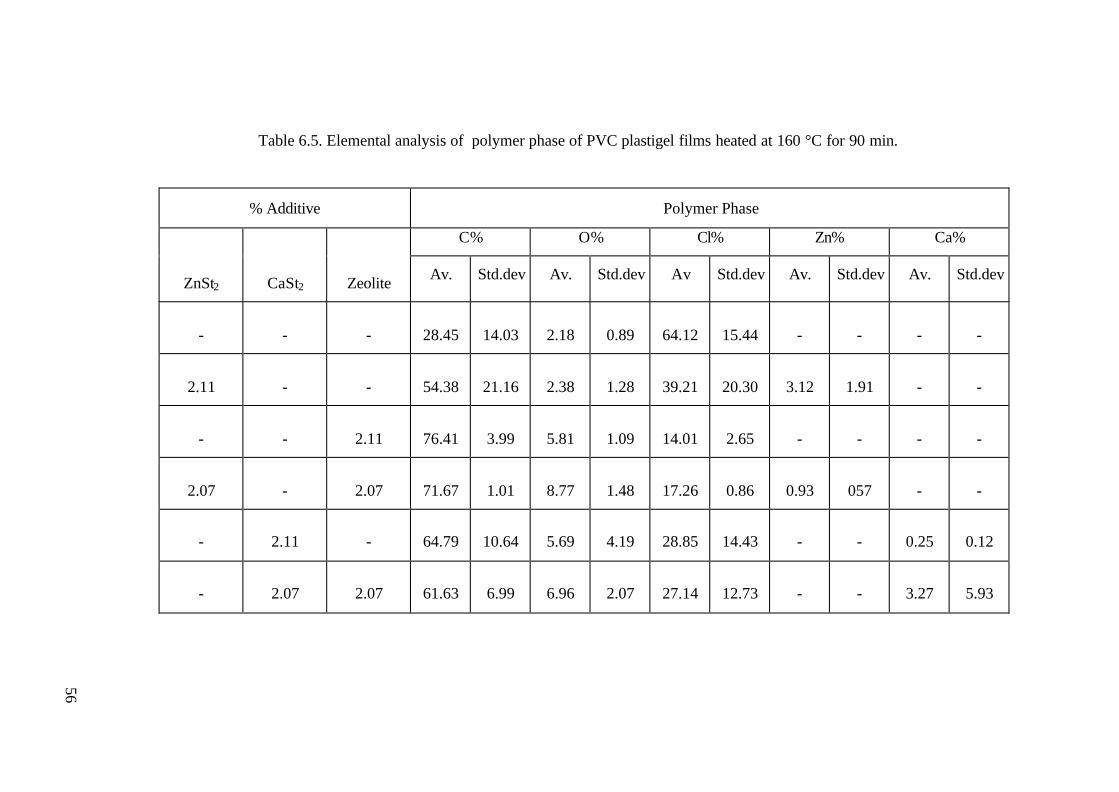
Table 6.5. Elemental analysis of polymer phase of PVC plastigel films heated at 160 °C for 90 min.
% Additive Polymer Phase
C% O% Cl% Zn% Ca%
ZnSt2 CaSt2 Zeolite Av. Std.dev Av. Std.dev Av Std.dev Av. Std.dev Av. Std.dev
- - - 28.45 14.03 2.18 0.89 64.12 15.44 - - - -
2.11 - - 54.38 21.16 2.38 1.28 39.21 20.30 3.12 1.91 - -
- - 2.11 76.41 3.99 5.81 1.09 14.01 2.65 - - - -
2.07 - 2.07 71.67 1.01 8.77 1.48 17.26 0.86 0.93 057 - -
- 2.11 - 64.79 10.64 5.69 4.19 28.85 14.43 - - 0.25 0.12
- 2.07 2.07 61.63 6.99 6.96 2.07 27.14 12.73 - - 3.27 5.93
56
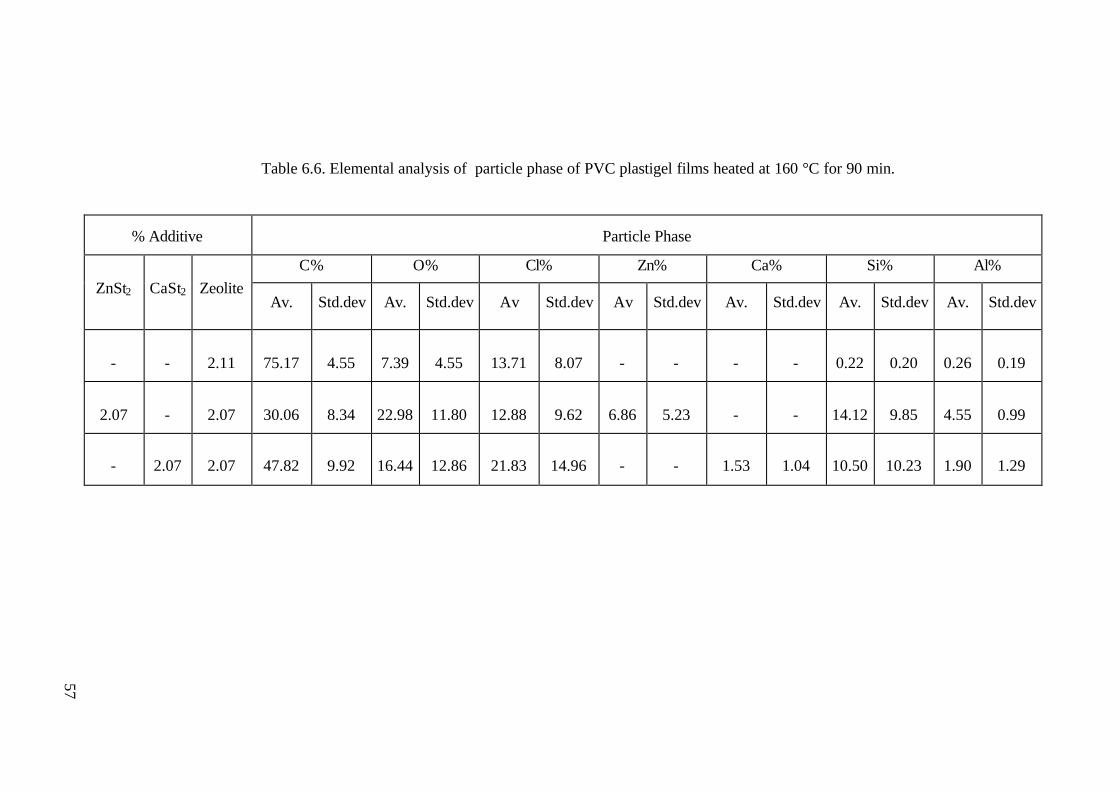
Table 6.6. Elemental analysis of particle phase of PVC plastigel films heated at 160 °C for 90 min.
% Additive Particle Phase
C% O% Cl% Zn% Ca% Si% Al%ZnSt2 CaSt2 Zeolite
Av. Std.dev Av. Std.dev Av Std.dev Av Std.dev Av. Std.dev Av. Std.dev Av. Std.dev
- - 2.11 75.17 4.55 7.39 4.55 13.71 8.07 - - - - 0.22 0.20 0.26 0.19
2.07 - 2.07 30.06 8.34 22.98 11.80 12.88 9.62 6.86 5.23 - - 14.12 9.85 4.55 0.99
- 2.07 2.07 47.82 9.92 16.44 12.86 21.83 14.96 - - 1.53 1.04 10.50 10.23 1.90 1.29
57

58
6.2.4. Color Test of PVC Plastigels
6.2.4.1. Static Oven Test
When PVC is exposed to heat, its color changes from white to black because of the
formation of polyene sequences. The color of PVC is an indication of the presence of
conjugated diens in it. The color changes from yellow-orange-brown as number of
conjugated double bond sequences increases. Four conjugated double bonds indicate
light yellow color whereas six conjugated double bonds indicate yellow color of PVC.
Additionally, PVC which has eight and eleven conjugated double bonds in its polymer
chain appears orange and red colors respectively (Braude and Nachod, 1955).
The prepared PVC plastigel films were heated in a static vacuum oven at 140 and 160
°C for different time periods. The observed colors are shown in Table 6.7 to 6.10. As
seen from Table 6.9, while the control film without any additive appear white at 150 °C
they become light yellow in 45 min. Thus yellow films were dehydrochlorinated with
conjugated double bond formation. The color of the samples that were stabilized with
ZnSt2 became black at the end of 90 min in long heating periods. Because after
consumption of ZnSt2, the conjugated polyenes reinitiated the unzipping process to
yield free HCl, and long polyenes were formed and the films discolored, known as
blackening. The samples stabilized with CaSt2 were still white or light yellow at the end
of 90 min. since CaCl2 produced from dehydrochlorination does not accelerate the
decomposition process as ZnCl2 did. Table 6.11 and 6.12 show the change of the color
of PVC plastigel films with respect to time. The films demonstrated how the extent of
discoloration was strongly affected by the time of degradation. Discoloration of the
films was observed even in the presence of large amounts of stabilizers. In other words,
the initiation of dehydrochlorination could not be prevented by stabilizers, at least not
efficiently. When zeolite was used as a primary stabilizer for PVC it prevented the early
blackening of the samples.

Table 6.7. The color change of PVC plastigel having ZnSt2 and zeolite films with respect to time at 140 °C
Additive wt. % ColorZnSt2 Zeolite 15 (min) 30 (min) 45 (min) 60 (min) 75 (min) 90 (min)
- - white white white white white white2.11 - white white white white light yellow light yellow
- 2.11 white white white light yellow light yellow light yellow0.53 0.53 white white white white white white1.05 1.05 white white white light yellow light yellow light yellow1.56 1.56 white white white white light yellow light yellow2.07 2.07 white white white white light yellow light yellow
Table 6.8. The color change of PVC plastigel films having CaSt2 and zeolite with respect to time at 140 °C
Additive wt. % ColorCaSt2 Zeolite 15 (min) 30 (min) 45 (min) 60 (min) 75 (min) 90 (min)
- - white white white white white white2.11 - white white white white white white
- 2.11 white white white white white white0.53 0.53 white white white white white white1.05 1.05 white white white white white white1.56 1.56 white white white white white white2.07 2.07 white white white white white white
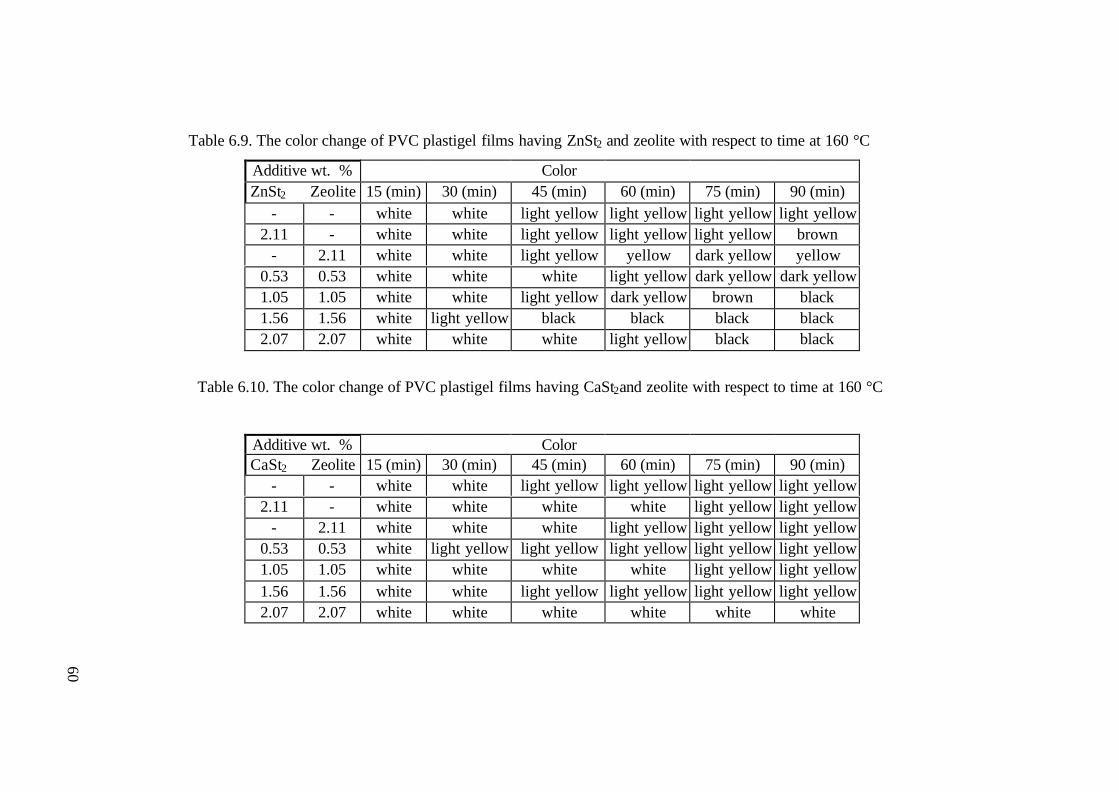
Table 6.9. The color change of PVC plastigel films having ZnSt2 and zeolite with respect to time at 160 °C
Additive wt. % ColorZnSt2 Zeolite 15 (min) 30 (min) 45 (min) 60 (min) 75 (min) 90 (min)
- - white white light yellow light yellow light yellow light yellow2.11 - white white light yellow light yellow light yellow brown
- 2.11 white white light yellow yellow dark yellow yellow0.53 0.53 white white white light yellow dark yellow dark yellow1.05 1.05 white white light yellow dark yellow brown black1.56 1.56 white light yellow black black black black2.07 2.07 white white white light yellow black black
Table 6.10. The color change of PVC plastigel films having CaSt2and zeolite with respect to time at 160 °C
Additive wt. % ColorCaSt2 Zeolite 15 (min) 30 (min) 45 (min) 60 (min) 75 (min) 90 (min)
- - white white light yellow light yellow light yellow light yellow2.11 - white white white white light yellow light yellow
- 2.11 white white white light yellow light yellow light yellow0.53 0.53 white light yellow light yellow light yellow light yellow light yellow1.05 1.05 white white white white light yellow light yellow1.56 1.56 white white light yellow light yellow light yellow light yellow2.07 2.07 white white white white white white
60
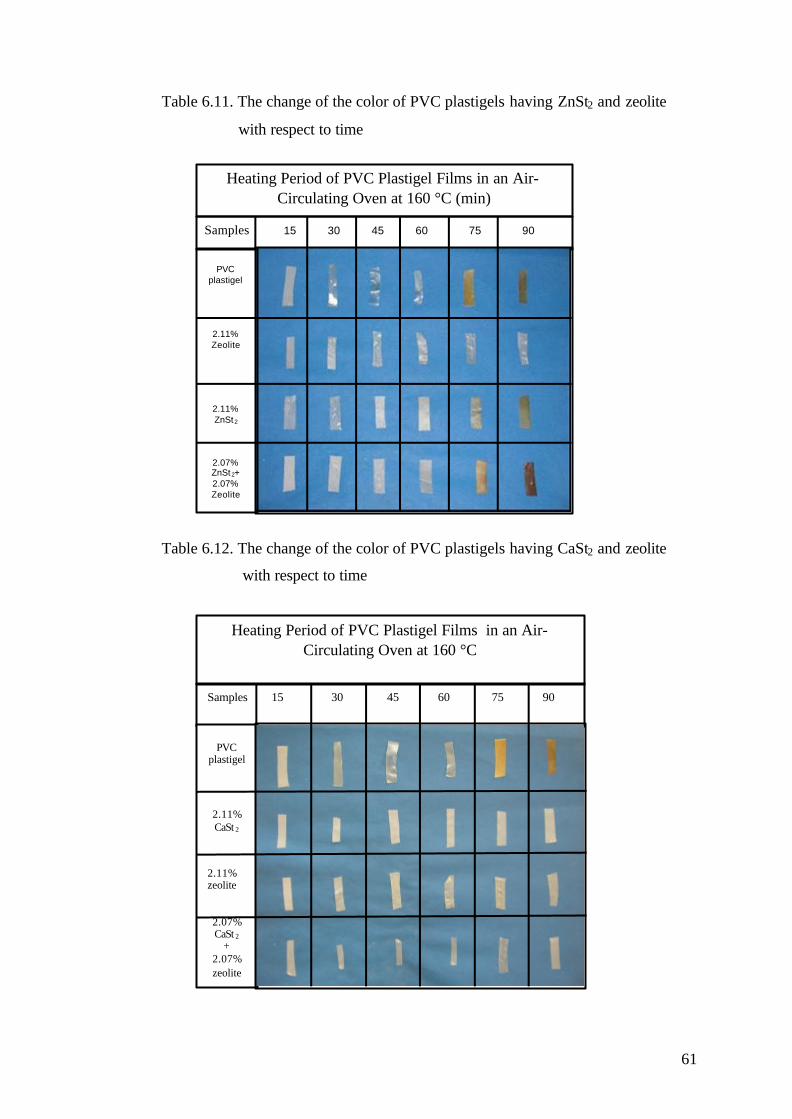
61
Table 6.11. The change of the color of PVC plastigels having ZnSt2 and zeolite
with respect to time
Table 6.12. The change of the color of PVC plastigels having CaSt2 and zeolite
with respect to time
Heating Period of PVC Plastigel Films in an Air-Circulating Oven at 160 °C
Samples 15 30 45 60 75 90
PVCplastigel
2.11%CaSt 2
2.11%zeolite
2.07%CaSt 2
+2.07%zeolite
Samples 15 30 45 60 75 90
Heating Period of PVC Plastigel Films in an Air-Circulating Oven at 160 °C (min)
PVCplastigel
2.11%Zeolite
2.11%ZnSt2
2.07%ZnSt2+2.07%Zeolite
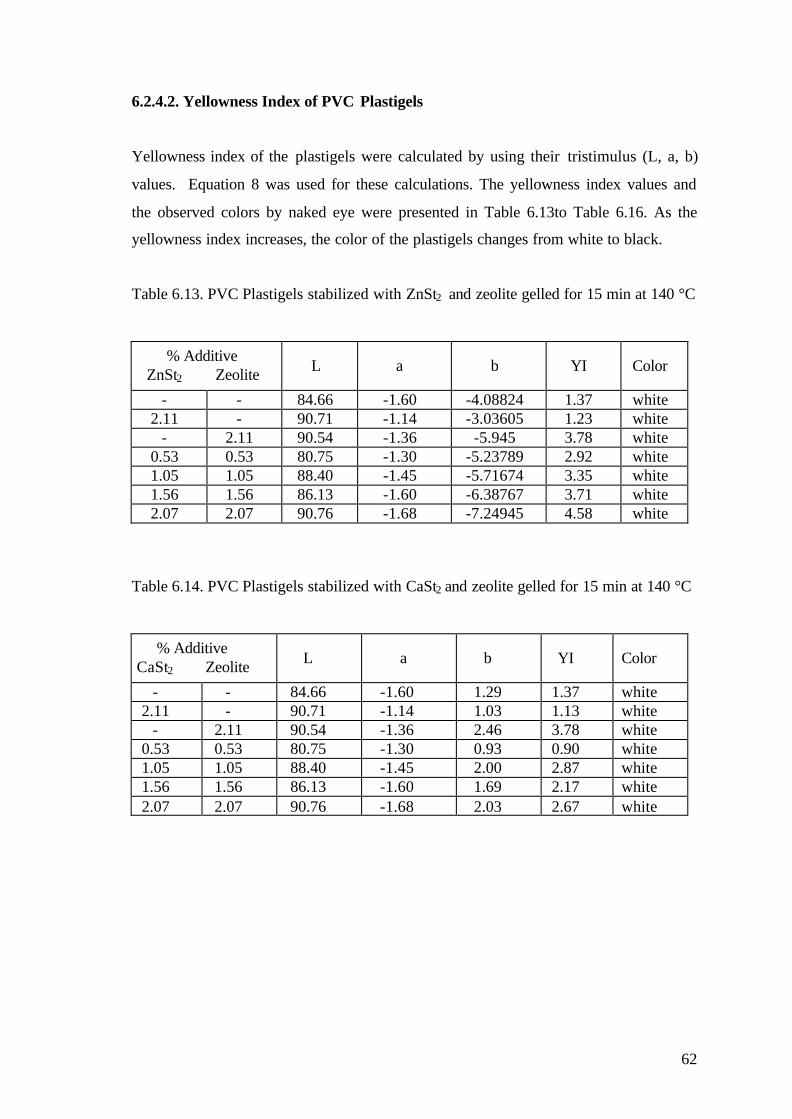
62
6.2.4.2. Yellowness Index of PVC Plastigels
Yellowness index of the plastigels were calculated by using their tristimulus (L, a, b)
values. Equation 8 was used for these calculations. The yellowness index values and
the observed colors by naked eye were presented in Table 6.13to Table 6.16. As the
yellowness index increases, the color of the plastigels changes from white to black.
Table 6.13. PVC Plastigels stabilized with ZnSt2 and zeolite gelled for 15 min at 140 °C
% AdditiveZnSt2 Zeolite L a b YI Color
- - 84.66 -1.60 -4.08824 1.37 white2.11 - 90.71 -1.14 -3.03605 1.23 white
- 2.11 90.54 -1.36 -5.945 3.78 white0.53 0.53 80.75 -1.30 -5.23789 2.92 white1.05 1.05 88.40 -1.45 -5.71674 3.35 white1.56 1.56 86.13 -1.60 -6.38767 3.71 white2.07 2.07 90.76 -1.68 -7.24945 4.58 white
Table 6.14. PVC Plastigels stabilized with CaSt2 and zeolite gelled for 15 min at 140 °C
% AdditiveCaSt2 Zeolite L a b YI Color
- - 84.66 -1.60 1.29 1.37 white2.11 - 90.71 -1.14 1.03 1.13 white
- 2.11 90.54 -1.36 2.46 3.78 white0.53 0.53 80.75 -1.30 0.93 0.90 white1.05 1.05 88.40 -1.45 2.00 2.87 white1.56 1.56 86.13 -1.60 1.69 2.17 white2.07 2.07 90.76 -1.68 2.03 2.67 white

63
Table 6.15. PVC Plastigels stabilized with ZnSt2 and zeolite heated for 90 min at 160 °C
% AdditiveZnSt2 Zeolite L a b YI Color
- - 93.72 -1.31 7.15 12.65 Light yellow2.11 - 99.77 -0.51 4.62 7.92 Light yellow
- 2.11 93.17 -1.32 9.33 16.90 Yellow0.53 0.53 94.56 -1.80 16.64 30.13 Dark yellow1.05 1.05 74.45 6.57 47.77 121.21 Black1.56 1.56 72.60 6.29 47.00 122.12 Black2.07 2.07 28.30 12.77 12.45 111.24 Black
Table 6.16. PVC Plastigels stabilized with CaSt2 and zeolite heated for 90 min at 160 °C
% AdditiveCaSt2 Zeolite L a b YI Color
- - 93.72 -1.31 7.15 12.65 Light yellow2.11 - 91.49 -1.62 7.33 13.07 Light yellow
- 2.11 93.17 -1.32 9.33 16.90 Yellow0.53 0.53 92.55 -1.27 7.73 13.96 Light yellow1.05 1.05 91.46 -1.38 7.33 13.26 Light yellow1.56 1.56 92.04 -1.01 11.63 21.83 Light yellow2.07 2.07 90.67 -0.97 7.41 13.86 Light yellow
Benavides et al., (2000) determined yellowness index of the PVC samples degraded at
160 °C. The yellowness index for PVC was found as 80 whereas the values for mixtures
PVC+CaSt2 and PVC+ZnSt2 were determined as 160 and 170 respectively. The
measured yellowness index values were not consistent with the literature (Benavides et
al., 2000) since they have prepared the mixtures without a plasticizer in a dry blender
and measured the yellowness index values in a Hunter Lab D25-2 instrument.
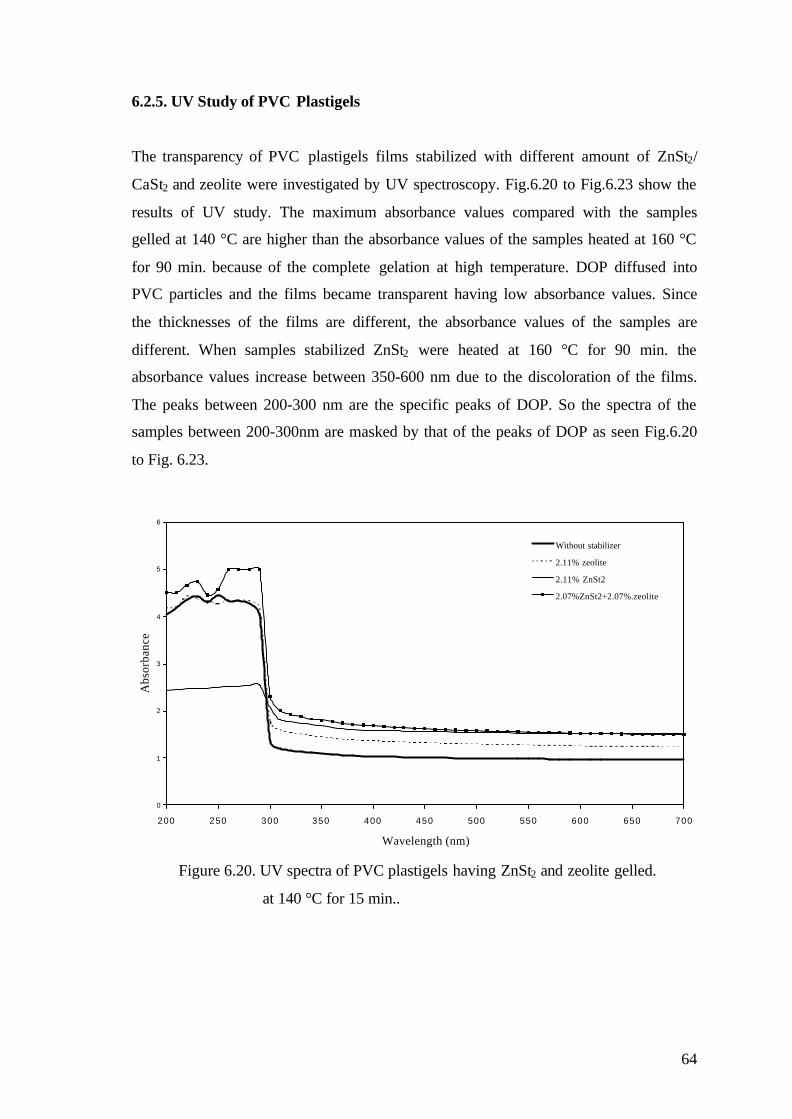
64
6.2.5. UV Study of PVC Plastigels
The transparency of PVC plastigels films stabilized with different amount of ZnSt2/
CaSt2 and zeolite were investigated by UV spectroscopy. Fig.6.20 to Fig.6.23 show the
results of UV study. The maximum absorbance values compared with the samples
gelled at 140 °C are higher than the absorbance values of the samples heated at 160 °C
for 90 min. because of the complete gelation at high temperature. DOP diffused into
PVC particles and the films became transparent having low absorbance values. Since
the thicknesses of the films are different, the absorbance values of the samples are
different. When samples stabilized ZnSt2 were heated at 160 °C for 90 min. the
absorbance values increase between 350-600 nm due to the discoloration of the films.
The peaks between 200-300 nm are the specific peaks of DOP. So the spectra of the
samples between 200-300nm are masked by that of the peaks of DOP as seen Fig.6.20
to Fig. 6.23.
0
1
2
3
4
5
6
200 250 300 350 400 450 500 550 600 650 700
Wavelength (nm)
Abs
orba
nce
Without stabilizer
2.11% zeolite
2.11% ZnSt2
2.07%ZnSt2+2.07%.zeolite
Figure 6.20. UV spectra of PVC plastigels having ZnSt2 and zeolite gelled.
at 140 °C for 15 min..
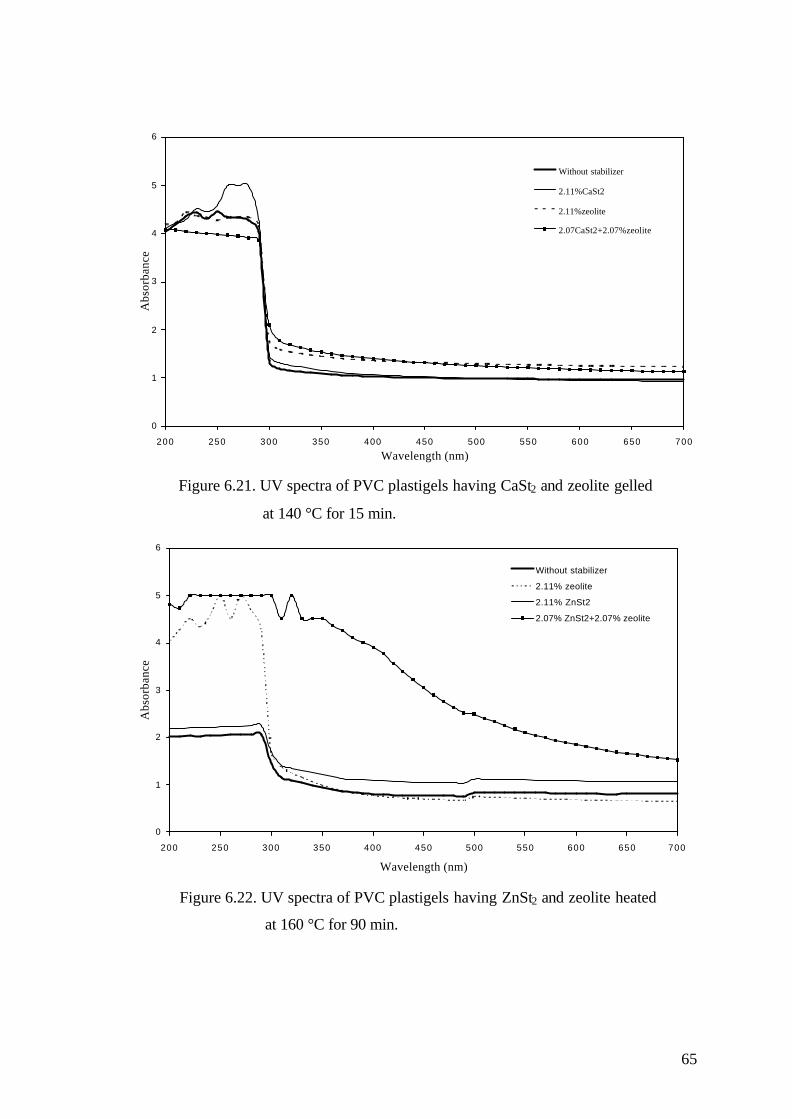
65
0
1
2
3
4
5
6
200 250 300 350 400 450 500 550 600 650 700
Wavelength (nm)
Abs
orba
nce
Without stabilizer
2.11%CaSt2
2.11%zeolite
2.07CaSt2+2.07%zeolite
Figure 6.21. UV spectra of PVC plastigels having CaSt2 and zeolite gelled
at 140 °C for 15 min.
0
1
2
3
4
5
6
200 250 300 350 400 450 500 550 600 650 700
Wavelength (nm)
Abs
orba
nce
Without stabilizer
2.11% zeolite
2.11% ZnSt2
2.07% ZnSt2+2.07% zeolite
Figure 6.22. UV spectra of PVC plastigels having ZnSt2 and zeolite heated
at 160 °C for 90 min.
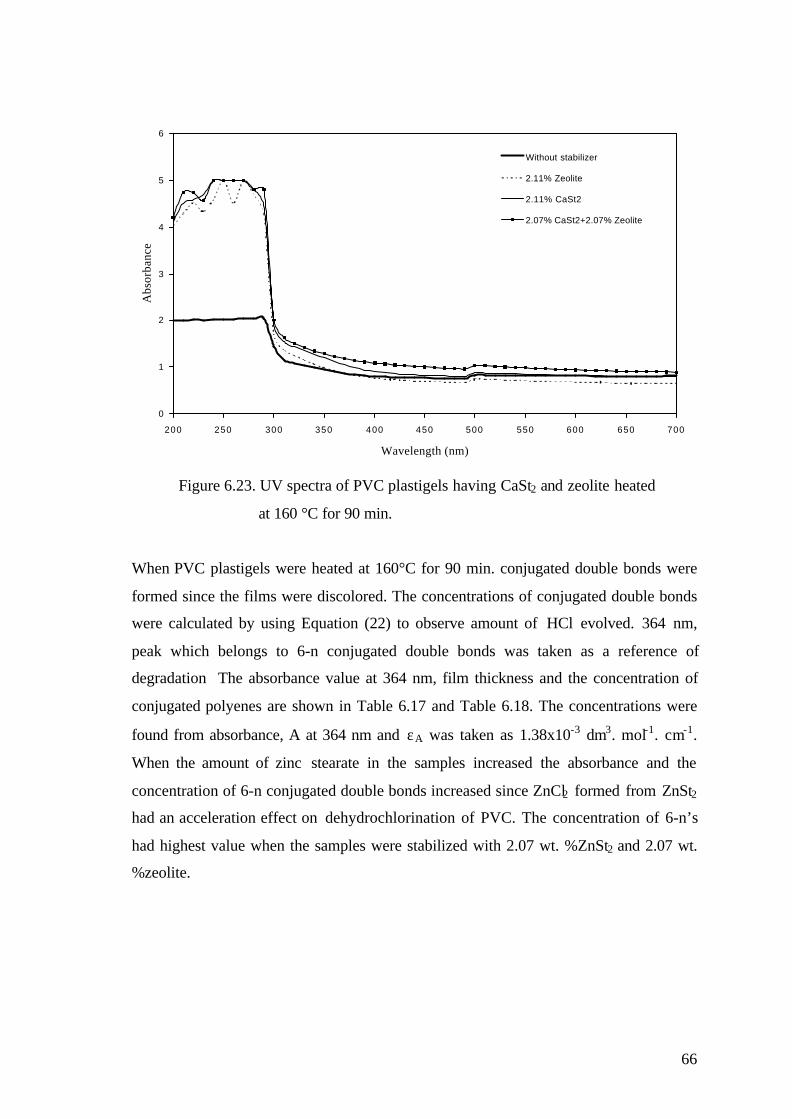
66
0
1
2
3
4
5
6
200 250 300 350 400 450 500 550 600 650 700
Wavelength (nm)
Abs
orba
nce
Without stabilizer
2.11% Zeolite
2.11% CaSt2
2.07% CaSt2+2.07% Zeolite
Figure 6.23. UV spectra of PVC plastigels having CaSt2 and zeolite heated
at 160 °C for 90 min.
When PVC plastigels were heated at 160°C for 90 min. conjugated double bonds were
formed since the films were discolored. The concentrations of conjugated double bonds
were calculated by using Equation (22) to observe amount of HCl evolved. 364 nm,
peak which belongs to 6-n conjugated double bonds was taken as a reference of
degradation The absorbance value at 364 nm, film thickness and the concentration of
conjugated polyenes are shown in Table 6.17 and Table 6.18. The concentrations were
found from absorbance, A at 364 nm and εA was taken as 1.38x10⁻³ dm3. mol-1. cm-1.
When the amount of zinc stearate in the samples increased the absorbance and the
concentration of 6-n conjugated double bonds increased since ZnCl2 formed from ZnSt2
had an acceleration effect on dehydrochlorination of PVC. The concentration of 6-n’s
had highest value when the samples were stabilized with 2.07 wt. %ZnSt2 and 2.07 wt.
%zeolite.

67
Table 6.17. The absorbance (A), film thickness and the concentration of 6-n conjugated
double bonds of PVC plastigels stabilized with ZnSt2 and zeolite at λ=364 nm.
% AdditiveZnSt2 Zeolite A (λ364)
FilmThickness(µ)
C x 104 (mol/l)
- - 0.88 99.01 6.402.11 - 0.90 161.94 4.01
- 2.11 1.14 130.96 6.300.53 0.53 0.79 150.00 3.801.05 1.05 2.11 200.00 7.651.56 1.56 2.26 220.00 7.432.07 2.07 4.31 200.38 15.57
Table 6.18. The absorbance (A), film thickness and the concentration of 6-n conjugated
double bonds of PVC plastigels stabilized with CaSt2 and zeolite at λ=364 nm.
% AdditiveCaSt2 Zeolite A (λ364)
FilmThickness(µ) C x 104 (mol/l)
- - 0.88 99.01 6.402.11 - 1.08 181.62 4.29
- 2.11 1.14 130.96 6.300.53 0.53 0.68 173.00 2.841.05 1.05 1.03 213.00 3.521.56 1.56 1.138 183.00 5.462.07 2.07 1.19 206.52 4.19
The concentration of 6-n conjugated double bonds of the samples shown in Table 6.17
and 6.18, were plotted in Fig. 6.24 to Fig. 6.27.
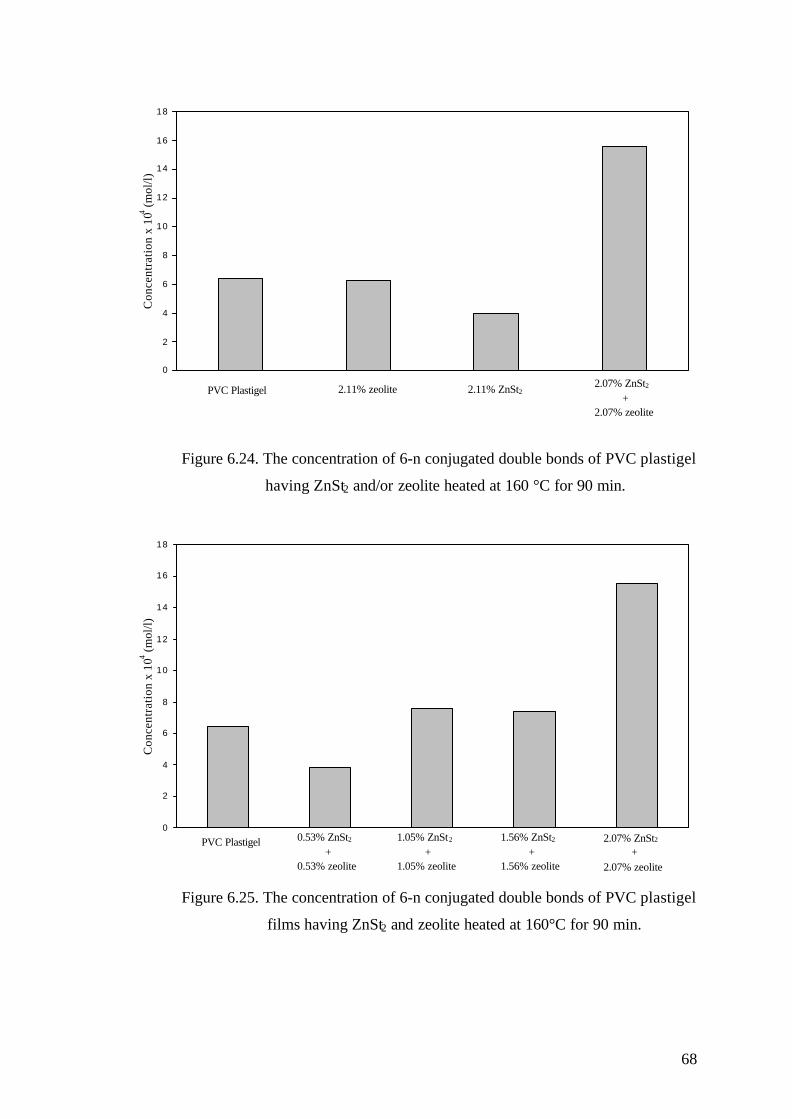
68
0
2
4
6
8
10
12
14
16
18
Con
cent
rati
on x
104 (m
ol/l)
PVC Plastigel 2.11% zeolite 2.11% ZnSt22.07% ZnSt2 +2.07% zeolite
Figure 6.24. The concentration of 6-n conjugated double bonds of PVC plastigel
having ZnSt2 and/or zeolite heated at 160 °C for 90 min.
0
2
4
6
8
10
12
14
16
18
Con
cent
rati
on x
104 (m
ol/l)
PVC Plastigel 0.53% ZnSt2 +0.53% zeolite
1.05% ZnSt2
+1.05% zeolite
1.56% ZnSt2 +1.56% zeolite
2.07% ZnSt2 +2.07% zeolite
Figure 6.25. The concentration of 6-n conjugated double bonds of PVC plastigel
films having ZnSt2 and zeolite heated at 160°C for 90 min.
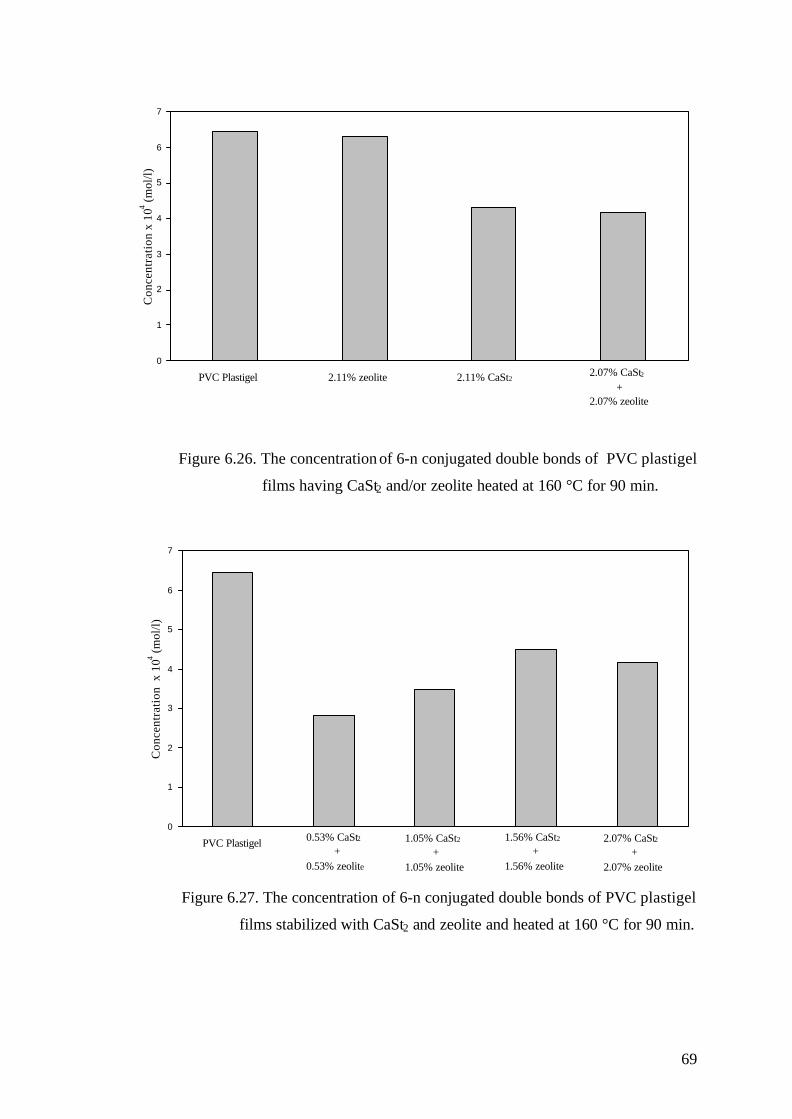
69
0
1
2
3
4
5
6
7
Con
cent
rati
on x
104 (m
ol/l)
PVC Plastigel 2.11% zeolite 2.11% CaSt22.07% CaSt2 +2.07% zeolite
Figure 6.26. The concentration of 6-n conjugated double bonds of PVC plastigel
films having CaSt2 and/or zeolite heated at 160 °C for 90 min.
0
1
2
3
4
5
6
7
Con
cent
rati
on x
104 (m
ol/l)
PVC Plastigel 0.53% CaSt2 +0.53% zeolite
1.05% CaSt2
+1.05% zeolite
1.56% CaSt2
+1.56% zeolite
2.07% CaSt2 +2.07% zeolite
Figure 6.27. The concentration of 6-n conjugated double bonds of PVC plastigel
films stabilized with CaSt2 and zeolite and heated at 160 °C for 90 min.
70
In the theory of dehydrochlorination, discoloration of PVC is the result of the produced
conjugated double bonds. As seen in Table 6.11 the sample stabilized with 2.07%ZnSt2
and 2.07% zeolite is black at the end of 90 min and this film has highest concentration
of 6-n’s as shown in Fig.6.24 and Fig.6.25. Therefore these results are consistent with
the theory in literature. When the sample stabilized with 0.53%ZnSt2 and 0.53%zeolite
was compared with PVC plastigel that did not contain any additive, the synergism was
observed because the concentration of 6-n conjugated double bonds of this film was
found as 3.80x10⁻⁴ mol/l and lower than the concentration of 6-n’s of PVC plastigel. So
if the amount of ZnSt2 was low in PVC, it prevented the degradation process.
On the other hand the films stabilized with CaSt2 were not discolored after 90 min. The
concentrations of 6-n’s of the samples stabilized with 2.11% Zeolite and 2.11% CaSt2
were evaluated as 4.01x10⁻⁴ and 4.29x10⁻⁴. But the concentration of 6-n’s of the sample
stabilized with 0.53% CaSt2 and 0.53%zeolite was found as 2.84x10⁻⁴ mol/l. The
observed decrease in the 6-n’s concentration when they were used at low level indicated
the synergism between CaSt2 and zeolite. Additionally the concentration of 6-n double
conjugated bonds of all samples stabilized with different amount of CaSt2 and zeolite
are lower than the concentration of 6-n conjugated double bonds of PVC plastigel as
shown in Fig.6.26 and Fig.6.27.
71
6.2.6. FTIR Study of PVC Plastigels
FTIR spectra of PVC produced by Petkim and PVC plastigel which was prepared by
43% DOP and gelled at 140 °C for 15 min. are shown in Fig.6.28. The spectrum of PVC
plastigel prepared by 43% DOP shows the typical doublet of the phthalates at 1580-
1600 cm-1 corresponding to the aromatic ring of the plasticizer. These bands are
consistent with the literature (Beltrán, 1997). Fig.6.30 to Fig.6.35 show the FTIR
spectrum of PVC plastigels stabilized with ZnSt2 and zeolite. The peak at 1540 cm-1 is
characteristic vibration of COO- group of ZnSt2 and the peak at 1640 cm-1 and 3400 cm-
1 are due to the vibration of H2O absorbed by zeolite. The band at 3700 cm-1 is the
characteristic peak of natural zeolite. Fig.6.36 to Fig 6.39 show the FTIR spectrum of
PVC plastigels stabilized with CaSt2 and zeolite. The peak at 1540 cm-1 is
corresponding to the antisymmetrical stretching vibration of carboxylate group of CaSt2.
When PVC with metal soaps was heated labile chlorine atoms undergo ester
interchange reaction with COO- groups according to Frye and Horst Mechanism shown
in Eq.9 and 10. The ester groups substituted with labile Cl atoms had also limited
thermal stability and they were broken at long heating periods and the
dehydrochlorination of PVC was initiated.
When PVC was dehydrochlorinated at high temperature, HCl formed with the
dehydrochlorination reacted with zinc or calcium carboxylate and carboxylate anion
was transferred into organic acid. The reactions can be shown as;
ZnSt2 + 2HCl ZnCl2 + 2HSt (29)
CaSt2 + 2HCl CaCl2 + 2HSt (30)
Reaction stoichiometry with zinc stearate and calcium stearate with HCl showed that
5.0 g metal soap in 100 g PVC could react with 0.6 g of HCl (Balköse et al., 2001). This
was also indicated by the decrease of COO- band of metal soap in FTIR spectrum. So
the decrease in the amount of metal soap was observed by the decrease in the intensity
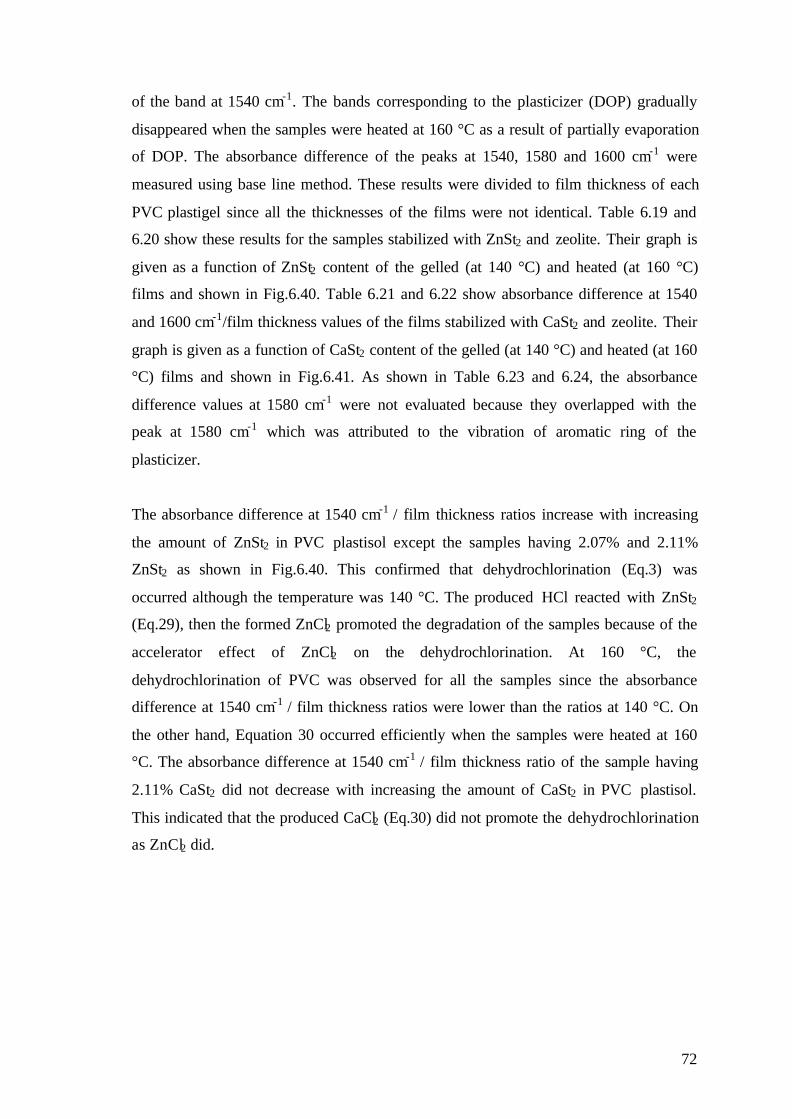
72
of the band at 1540 cm-1. The bands corresponding to the plasticizer (DOP) gradually
disappeared when the samples were heated at 160 °C as a result of partially evaporation
of DOP. The absorbance difference of the peaks at 1540, 1580 and 1600 cm-1 were
measured using base line method. These results were divided to film thickness of each
PVC plastigel since all the thicknesses of the films were not identical. Table 6.19 and
6.20 show these results for the samples stabilized with ZnSt2 and zeolite. Their graph is
given as a function of ZnSt2 content of the gelled (at 140 °C) and heated (at 160 °C)
films and shown in Fig.6.40. Table 6.21 and 6.22 show absorbance difference at 1540
and 1600 cm-1/film thickness values of the films stabilized with CaSt2 and zeolite. Their
graph is given as a function of CaSt2 content of the gelled (at 140 °C) and heated (at 160
°C) films and shown in Fig.6.41. As shown in Table 6.23 and 6.24, the absorbance
difference values at 1580 cm-1 were not evaluated because they overlapped with the
peak at 1580 cm-1 which was attributed to the vibration of aromatic ring of the
plasticizer.
The absorbance difference at 1540 cm-1 / film thickness ratios increase with increasing
the amount of ZnSt2 in PVC plastisol except the samples having 2.07% and 2.11%
ZnSt2 as shown in Fig.6.40. This confirmed that dehydrochlorination (Eq.3) was
occurred although the temperature was 140 °C. The produced HCl reacted with ZnSt2
(Eq.29), then the formed ZnCl2 promoted the degradation of the samples because of the
accelerator effect of ZnCl2 on the dehydrochlorination. At 160 °C, the
dehydrochlorination of PVC was observed for all the samples since the absorbance
difference at 1540 cm-1 / film thickness ratios were lower than the ratios at 140 °C. On
the other hand, Equation 30 occurred efficiently when the samples were heated at 160
°C. The absorbance difference at 1540 cm-1 / film thickness ratio of the sample having
2.11% CaSt2 did not decrease with increasing the amount of CaSt2 in PVC plastisol.
This indicated that the produced CaCl2 (Eq.30) did not promote the dehydrochlorination
as ZnCl2 did.
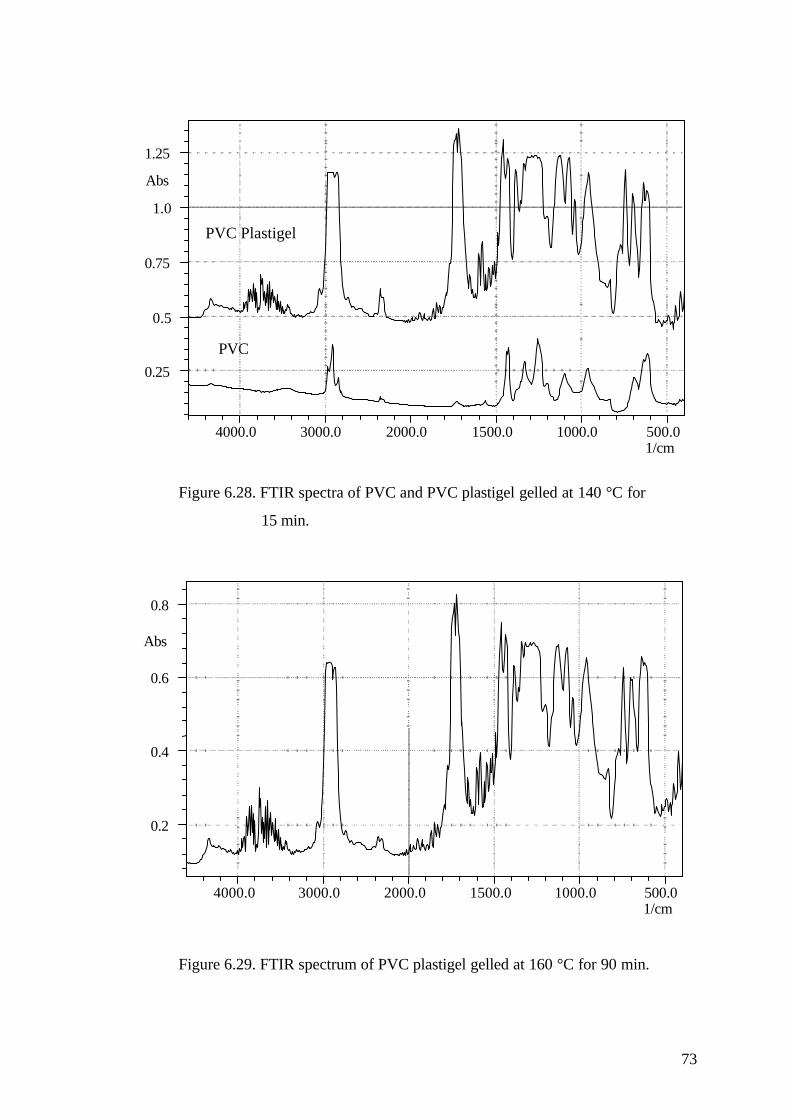
73
Figure 6.28. FTIR spectra of PVC and PVC plastigel gelled at 140 °C for
15 min.
500.01000.01500.02000.03000.04000.01/cm
0.2
0.4
0.6
0.8
Abs
Figure 6.29. FTIR spectrum of PVC plastigel gelled at 160 °C for 90 min.
PVC
PVC Plastigel
500.01000.01500.02000.03000.04000.01/cm
0.25
0.5
0.75
1.0
1.25
Abs
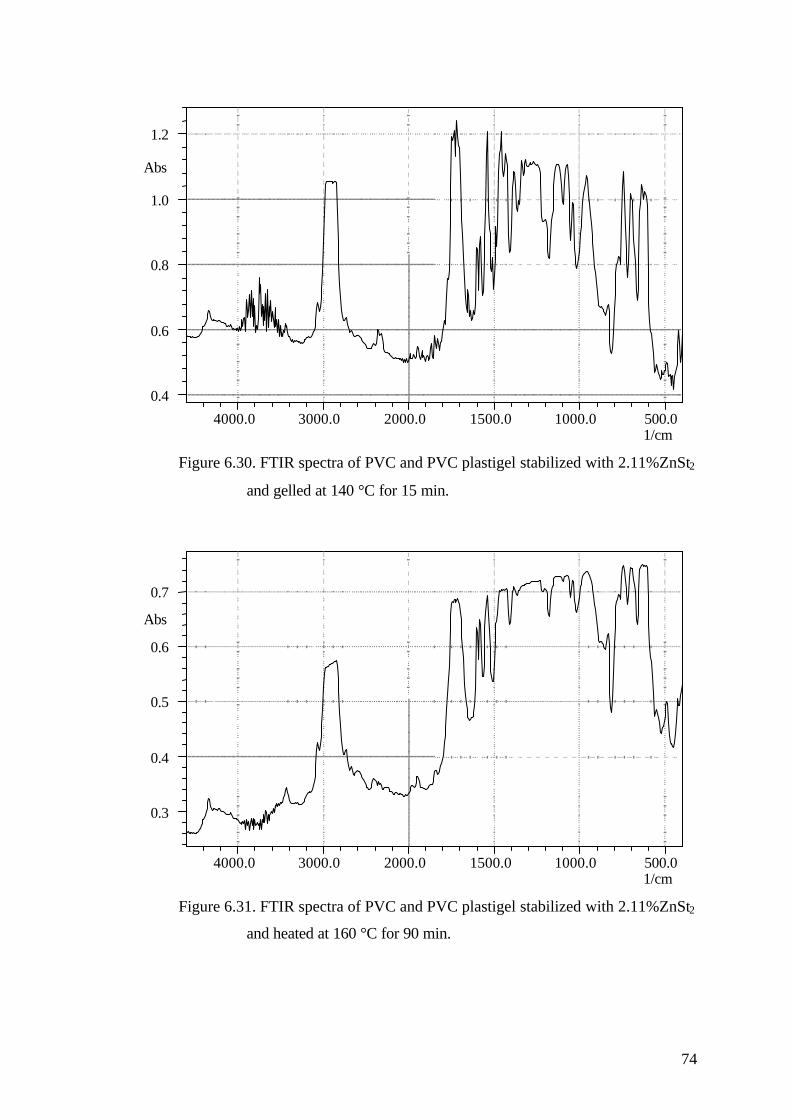
74
500.01000.01500.02000.03000.04000.01/cm
0.4
0.6
0.8
1.0
1.2
Abs
Figure 6.30. FTIR spectra of PVC and PVC plastigel stabilized with 2.11%ZnSt2
and gelled at 140 °C for 15 min.
500.01000.01500.02000.03000.04000.01/cm
0.3
0.4
0.5
0.6
0.7
Abs
Figure 6.31. FTIR spectra of PVC and PVC plastigel stabilized with 2.11%ZnSt2
and heated at 160 °C for 90 min.
75
500.01000.01500.02000.03000.04000.01/cm
0.6
0.8
1.0
1.2
Abs
Figure 6.32. FTIR spectra of PVC and PVC plastigel stabilized with 2.11%
zeolite and gelled at 140 °C for 15 min.
500.01000.01500.02000.03000.04000.01/cm
1.0
2.0
3.0
Abs
Figure 6.33. FTIR spectra of PVC and PVC plastigel stabilized with
2.11%zeolite and heated at 160 °C for 90 min.
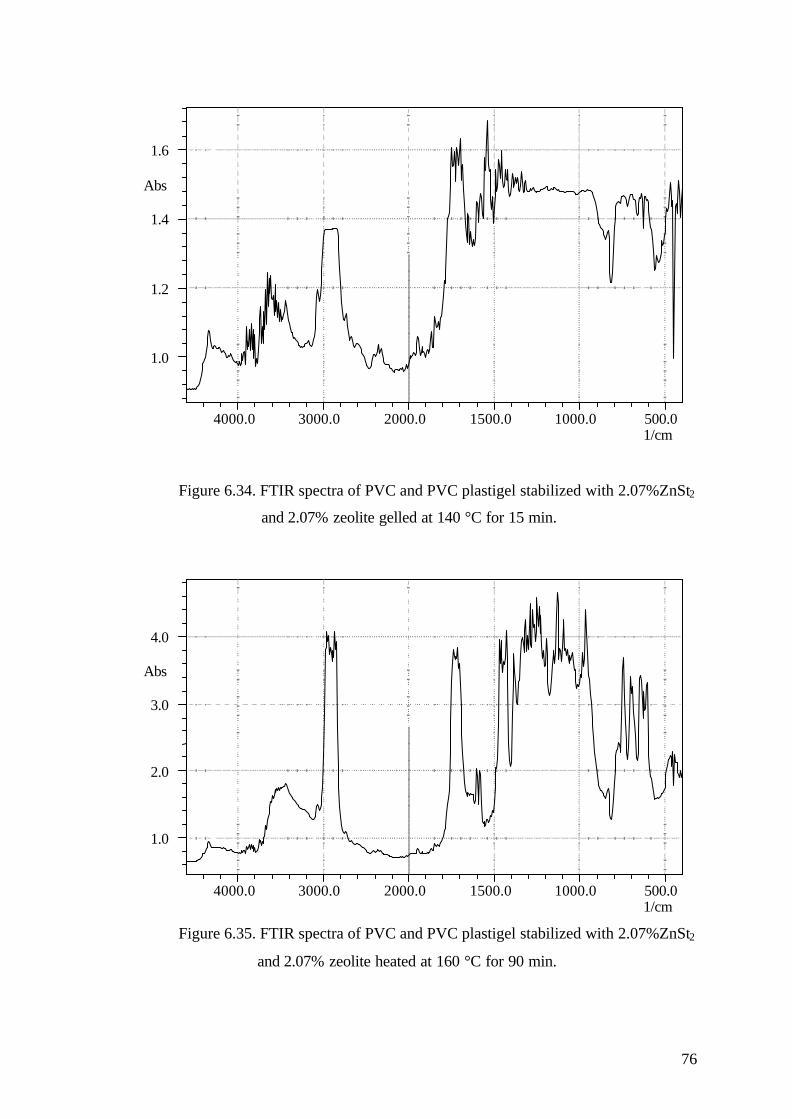
76
500.01000.01500.02000.03000.04000.01/cm
1.0
1.2
1.4
1.6
Abs
Figure 6.34. FTIR spectra of PVC and PVC plastigel stabilized with 2.07%ZnSt2
and 2.07% zeolite gelled at 140 °C for 15 min.
500.01000.01500.02000.03000.04000.01/cm
1.0
2.0
3.0
4.0
Abs
Figure 6.35. FTIR spectra of PVC and PVC plastigel stabilized with 2.07%ZnSt2
and 2.07% zeolite heated at 160 °C for 90 min.
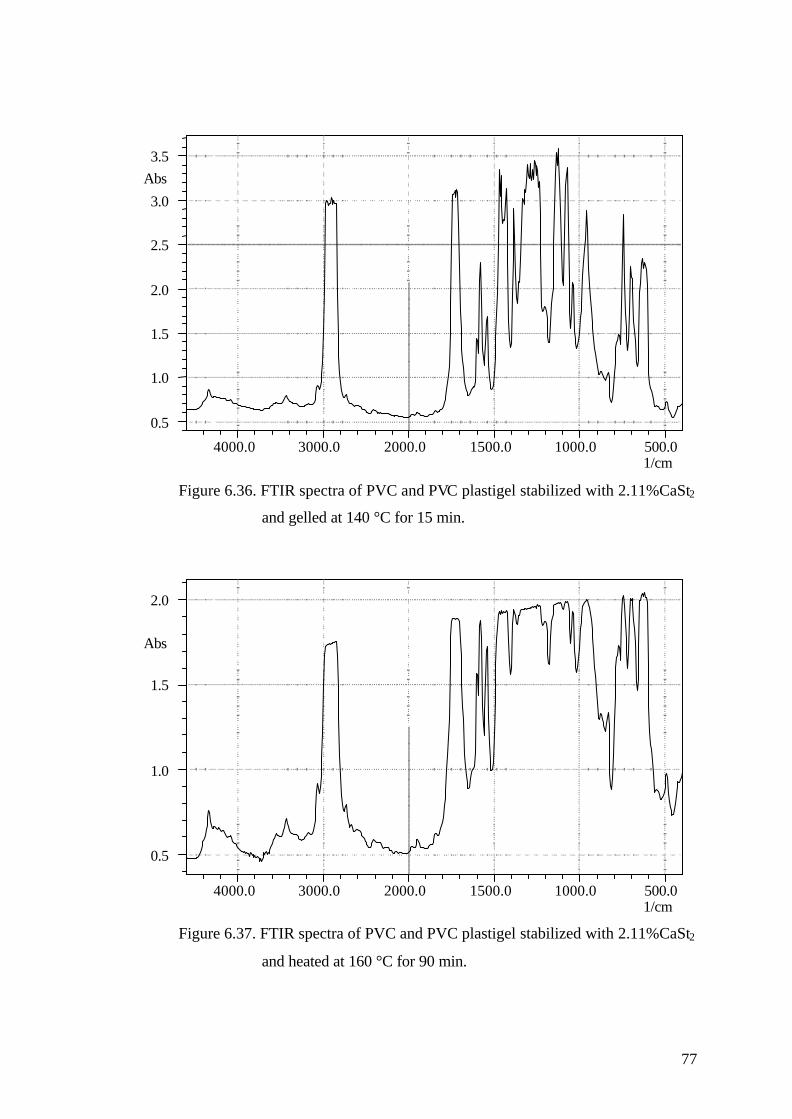
77
500.01000.01500.02000.03000.04000.01/cm
0.5
1.0
1.5
2.0
2.5
3.0
3.5Abs
Figure 6.36. FTIR spectra of PVC and PVC plastigel stabilized with 2.11%CaSt2
and gelled at 140 °C for 15 min.
500.01000.01500.02000.03000.04000.01/cm
0.5
1.0
1.5
2.0
Abs
Figure 6.37. FTIR spectra of PVC and PVC plastigel stabilized with 2.11%CaSt2
and heated at 160 °C for 90 min.

78
500.01000.01500.02000.03000.04000.01/cm
1.0
1.5
2.0
2.5
3.0
3.5
Abs
Figure 6.38. FTIR spectra of PVC and PVC plastigel stabilized with 2.07%CaSt2
and 2.07% zeolite gelled at 140 °C for 15 min.
500.01000.01500.02000.03000.04000.01/cm
0.5
1.0
1.5
2.0
Abs
Figure 6.39. FTIR spectra of PVC and PVC plastigel stabilized with 2.07%CaSt2
and 2.07% zeolite heated at 160 °C for 90 min.
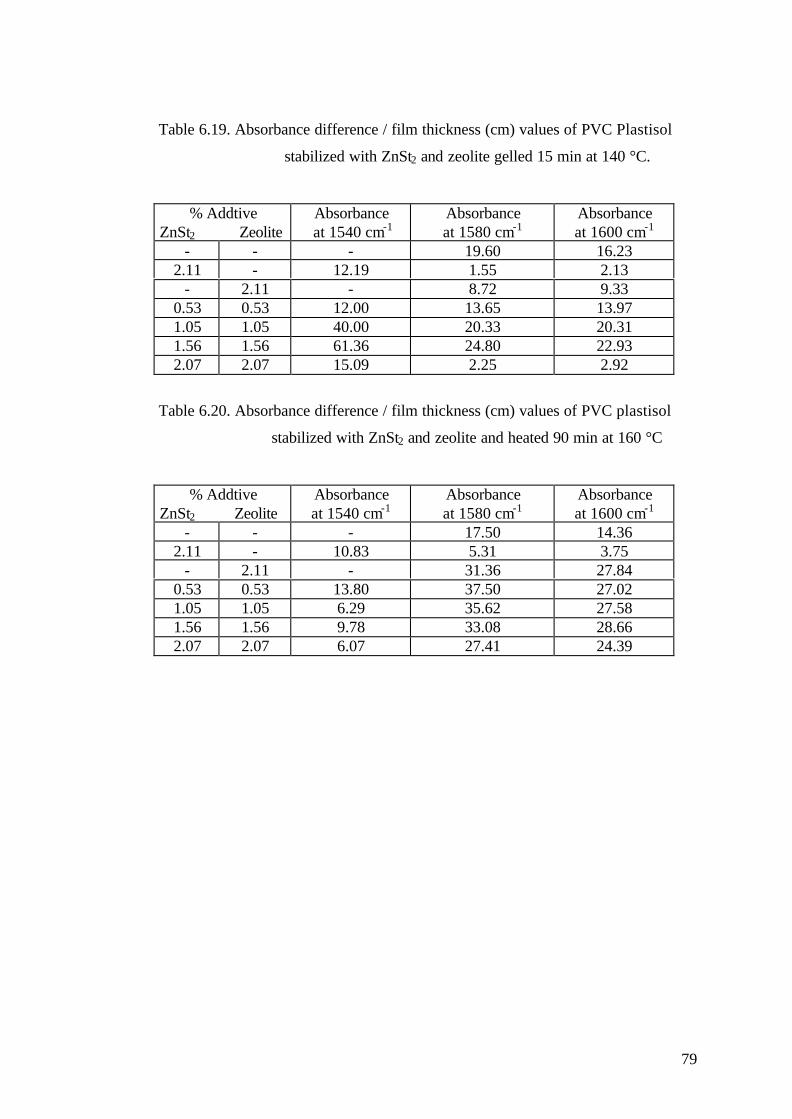
79
Table 6.19. Absorbance difference / film thickness (cm) values of PVC Plastisol
stabilized with ZnSt2 and zeolite gelled 15 min at 140 °C.
% AddtiveZnSt2 Zeolite
Absorbance at 1540 cm-1
Absorbanceat 1580 cm-1
Absorbanceat 1600 cm-1
- - - 19.60 16.232.11 - 12.19 1.55 2.13
- 2.11 - 8.72 9.330.53 0.53 12.00 13.65 13.971.05 1.05 40.00 20.33 20.311.56 1.56 61.36 24.80 22.932.07 2.07 15.09 2.25 2.92
Table 6.20. Absorbance difference / film thickness (cm) values of PVC plastisol
stabilized with ZnSt2 and zeolite and heated 90 min at 160 °C
% AddtiveZnSt2 Zeolite
Absorbanceat 1540 cm-1
Absorbanceat 1580 cm-1
Absorbanceat 1600 cm-1
- - - 17.50 14.362.11 - 10.83 5.31 3.75
- 2.11 - 31.36 27.840.53 0.53 13.80 37.50 27.021.05 1.05 6.29 35.62 27.581.56 1.56 9.78 33.08 28.662.07 2.07 6.07 27.41 24.39
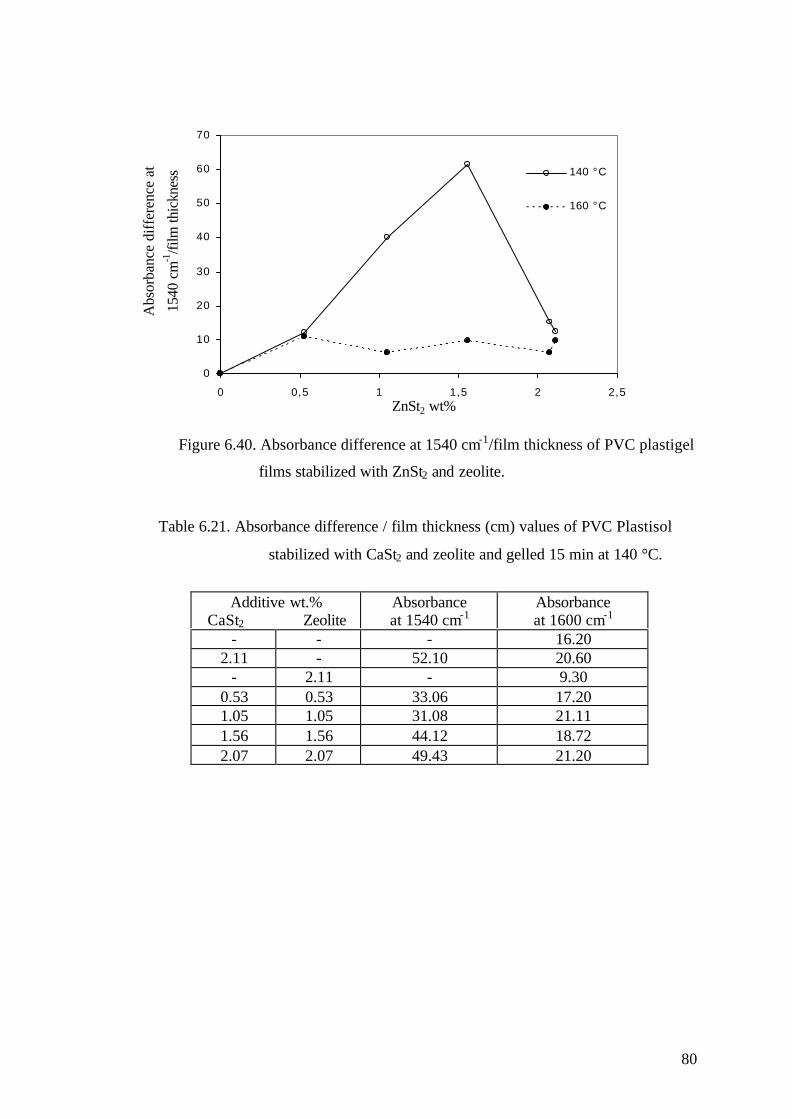
80
0
10
20
30
40
50
60
70
0 0,5 1 1,5 2 2,5ZnSt2 wt%
Abs
orba
nce
diff
eren
ce a
t
1540
cm
-1/fi
lm th
ickn
ess 140 °C
160 °C
Figure 6.40. Absorbance difference at 1540 cm-1/film thickness of PVC plastigel
films stabilized with ZnSt2 and zeolite.
Table 6.21. Absorbance difference / film thickness (cm) values of PVC Plastisol
stabilized with CaSt2 and zeolite and gelled 15 min at 140 °C.
Additive wt.%CaSt2 Zeolite
Absorbanceat 1540 cm-1
Absorbanceat 1600 cm-1
- - - 16.202.11 - 52.10 20.60
- 2.11 - 9.300.53 0.53 33.06 17.201.05 1.05 31.08 21.111.56 1.56 44.12 18.722.07 2.07 49.43 21.20
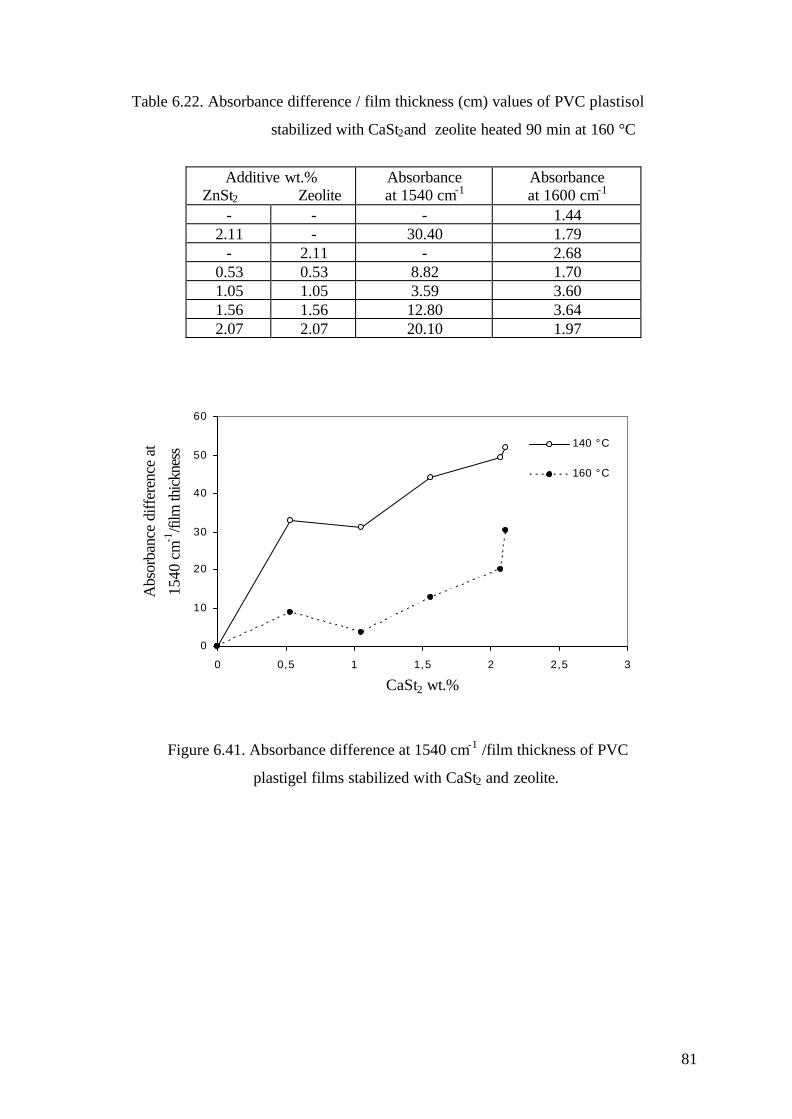
81
Table 6.22. Absorbance difference / film thickness (cm) values of PVC plastisol
stabilized with CaSt2and zeolite heated 90 min at 160 °C
Figure 6.41. Absorbance difference at 1540 cm-1 /film thickness of PVC
plastigel films stabilized with CaSt2 and zeolite.
Additive wt.%ZnSt2 Zeolite
Absorbanceat 1540 cm-1
Absorbanceat 1600 cm-1
- - - 1.442.11 - 30.40 1.79
- 2.11 - 2.680.53 0.53 8.82 1.701.05 1.05 3.59 3.601.56 1.56 12.80 3.642.07 2.07 20.10 1.97
0
10
20
30
40
50
60
0 0,5 1 1,5 2 2,5 3
CaSt2 wt.%
Abs
orba
nce
diff
eren
ce a
t
1540
cm
-1/fi
lm th
ickn
ess 140 °C
160 °C
82
6.2.7. TGA Study of PVC Plastigel Films
Thermogravimetric analysis is one of the most known techniques to observe the loss of
mass caused by elimination of HCl and the evaporation of plasticizer from plastisols.
Elimination of HCl is the first step of the thermal degradation of PVC plastisol and
simultaneously conjugated double bond are formed in the polymer chain. At higher
temperatures the material undergoes a partial carbonization with the release of benzene
and other aromatics. Phthalate plasticizers are thermally degraded from 200 °C and the
boiling point of DOP is 231 °C. Therefore, the weight loss before 231 °C is mainly due
to the elimination of HCl gas and partially to evaporation of DOP. TGA curves of PVC
plastigel films gelled at 140 °C for 15 min. were obtained by heating them from 25 °C
to 600 °C at a rate of 10 °C/min. The weight losses of the samples by heating are shown
in Fig.6.42 to Fig.6.45. To determine the thermal stability of the PVC plastigels the
following characteristics of the first and the second degradation step were evaluated
from the TGA curves: the residual mass % at, 400 and 600 °C. These results were
reported in Table 6.23 and 6.24. Unstabilized PVC plastigel had the lowest residual
mass loss at 400 and 600 °C due to the catalytic effect of HCl on dehydrochlorination of
PVC at a low level of degradation. The residual mass loss % values of stabilized PVC
plastigels were somewhat different depending on the zeolite content. Onset
temperatures (the intersection of the extrapolated base line with inflection tangent) of
mass loss are shown in Table 6.25 and 6.26 for both stabilized and unstabilized samples.
The sample stabilized with 1.05%Znst2 and 1.05%zeolite presented the highest onset
temperature (204.4 °C). So these stabilizers prevented early dehydrochlorination when
they were used at low levels. It was observed that when ZnSt2 or zeolite was used
individually the onset temperature has never reached to 204.4 °C This might be the
synergistic effect between these stabilizers on PVC thermal degradation at low levels.
On the other hand, the samples stabilized with CaSt2 and zeolite presents lower onset
temperature than the unstabilized PVC plastigel.
Since PVC is unstable and rapidly degrades at processing temperature, the residual
mass% of the samples at 225 °C are reported in Table 6.25 and 6.26 and shown in
Fig.6.46 to 6.49. Although the sample stabilized with 1.05% ZnSt2 and 1.05% zeolite
increased the onset temperature up to 204.4 °C, it could not reduce the mass loss % at
the processing temperature. As shown in Fig.6.46 and 6.47, the addition of ZnSt2 and/or
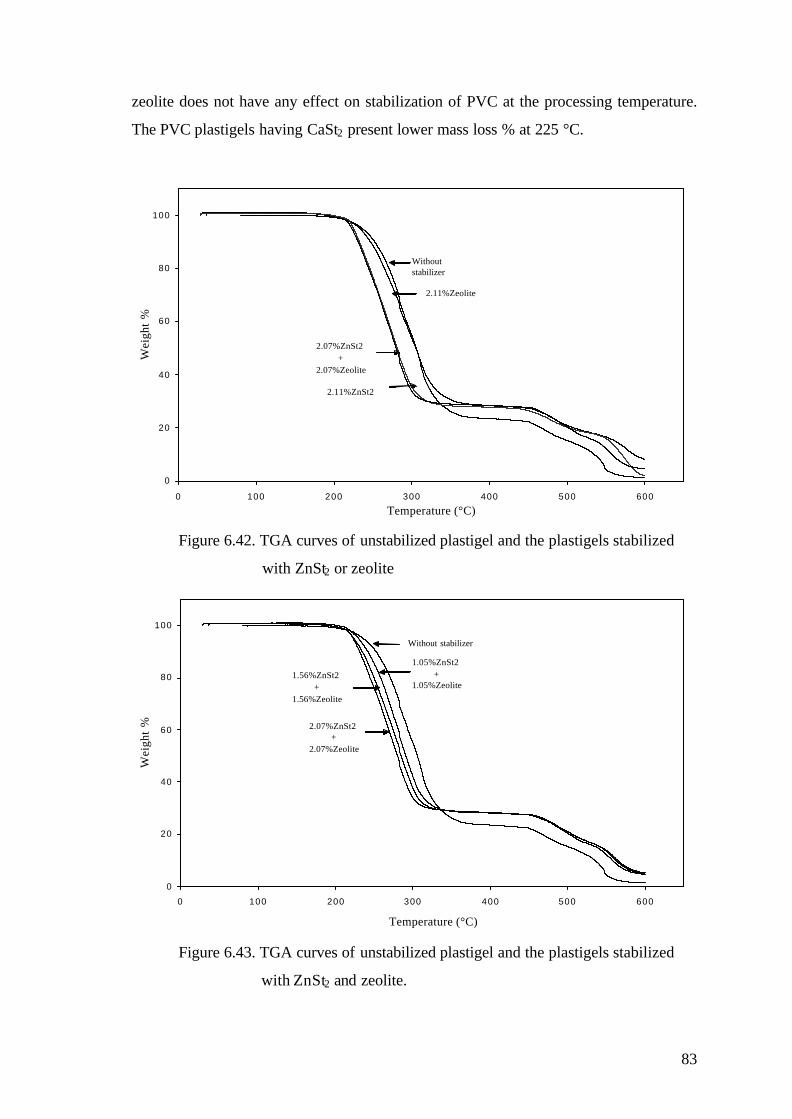
83
zeolite does not have any effect on stabilization of PVC at the processing temperature.
The PVC plastigels having CaSt2 present lower mass loss % at 225 °C.
0
20
40
60
80
100
0 100 200 300 400 500 600
Temperature (°C)
Wei
ght
%
2.11%Zeolite
Without stabilizer
2.07%ZnSt2 +2.07%Zeolite
2.11%ZnSt2
Figure 6.42. TGA curves of unstabilized plastigel and the plastigels stabilized
with ZnSt2 or zeolite
0
20
40
60
80
100
0 100 200 300 400 500 600
Temperature (°C)
Wei
ght
%
Without stabilizer
1.05%ZnSt2 +1.05%Zeolite
2.07%ZnSt2 +2.07%Zeolite
1.56%ZnSt2 +1.56%Zeolite
Figure 6.43. TGA curves of unstabilized plastigel and the plastigels stabilized
with ZnSt2 and zeolite.
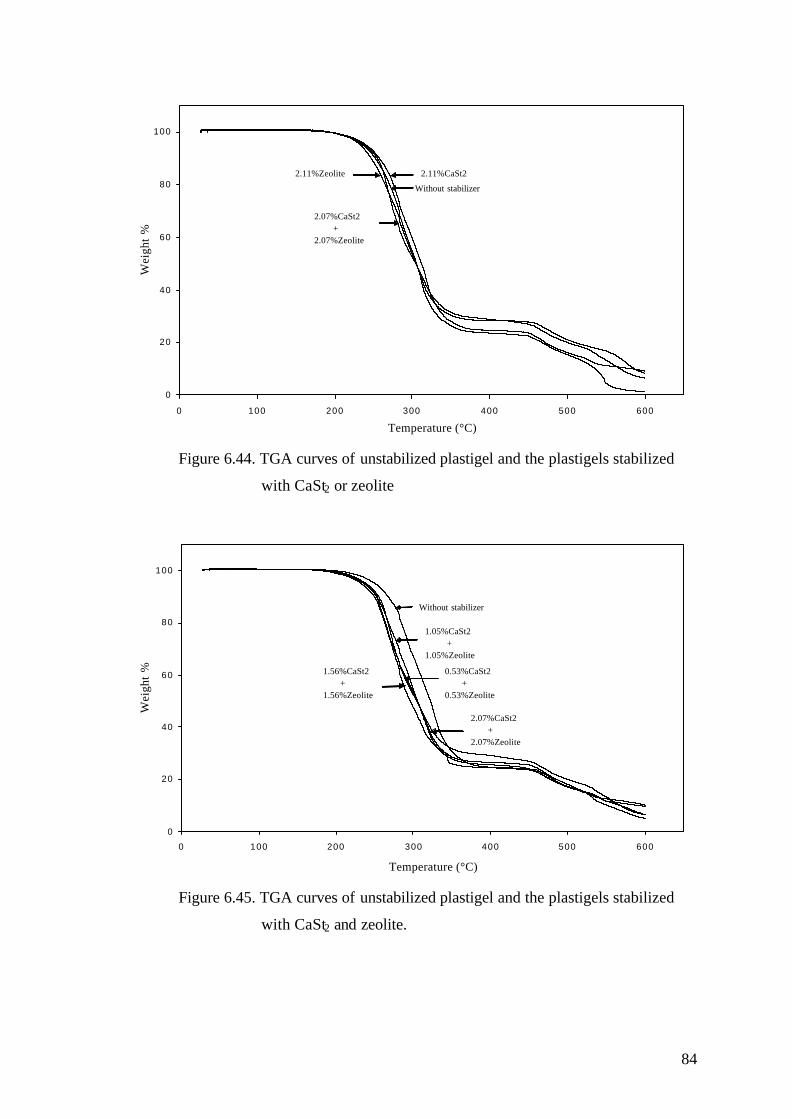
84
0
20
40
60
80
100
0 100 200 300 400 500 600
Temperature (°C)
Wei
ght
%
2.11%CaSt22.11%Zeolite
2.07%CaSt2 +2.07%Zeolite
Without stabilizer
Figure 6.44. TGA curves of unstabilized plastigel and the plastigels stabilized
with CaSt2 or zeolite
0
20
40
60
80
100
0 100 200 300 400 500 600
Temperature (°C)
Wei
ght
%
Without stabilizer
1.05%CaSt2 +1.05%Zeolite
2.07%CaSt2 +2.07%Zeolite
1.56%CaSt2 +1.56%Zeolite
0.53%CaSt2 +0.53%Zeolite
Figure 6.45. TGA curves of unstabilized plastigel and the plastigels stabilized
with CaSt2 and zeolite.
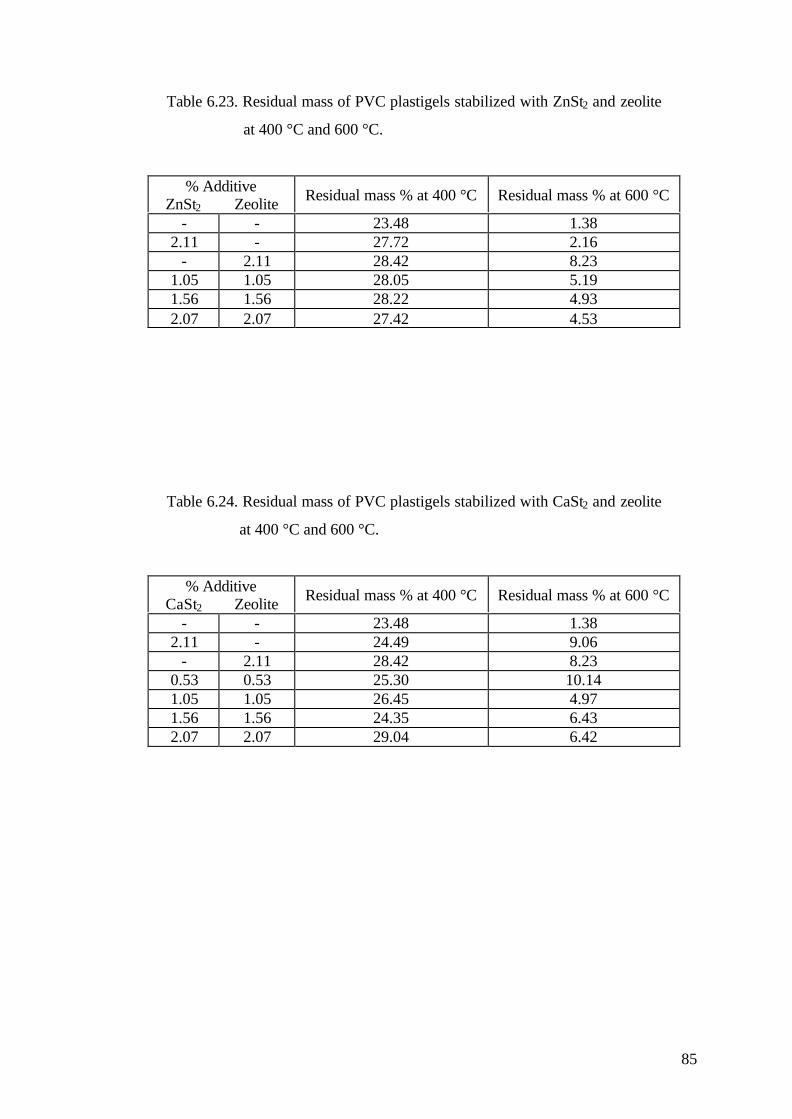
85
Table 6.23. Residual mass of PVC plastigels stabilized with ZnSt2 and zeolite
at 400 °C and 600 °C.
% AdditiveZnSt2 Zeolite Residual mass % at 400 °C Residual mass % at 600 °C
- - 23.48 1.382.11 - 27.72 2.16
- 2.11 28.42 8.231.05 1.05 28.05 5.191.56 1.56 28.22 4.932.07 2.07 27.42 4.53
Table 6.24. Residual mass of PVC plastigels stabilized with CaSt2 and zeolite
at 400 °C and 600 °C.
% AdditiveCaSt2 Zeolite Residual mass % at 400 °C Residual mass % at 600 °C
- - 23.48 1.382.11 - 24.49 9.06
- 2.11 28.42 8.230.53 0.53 25.30 10.141.05 1.05 26.45 4.971.56 1.56 24.35 6.432.07 2.07 29.04 6.42
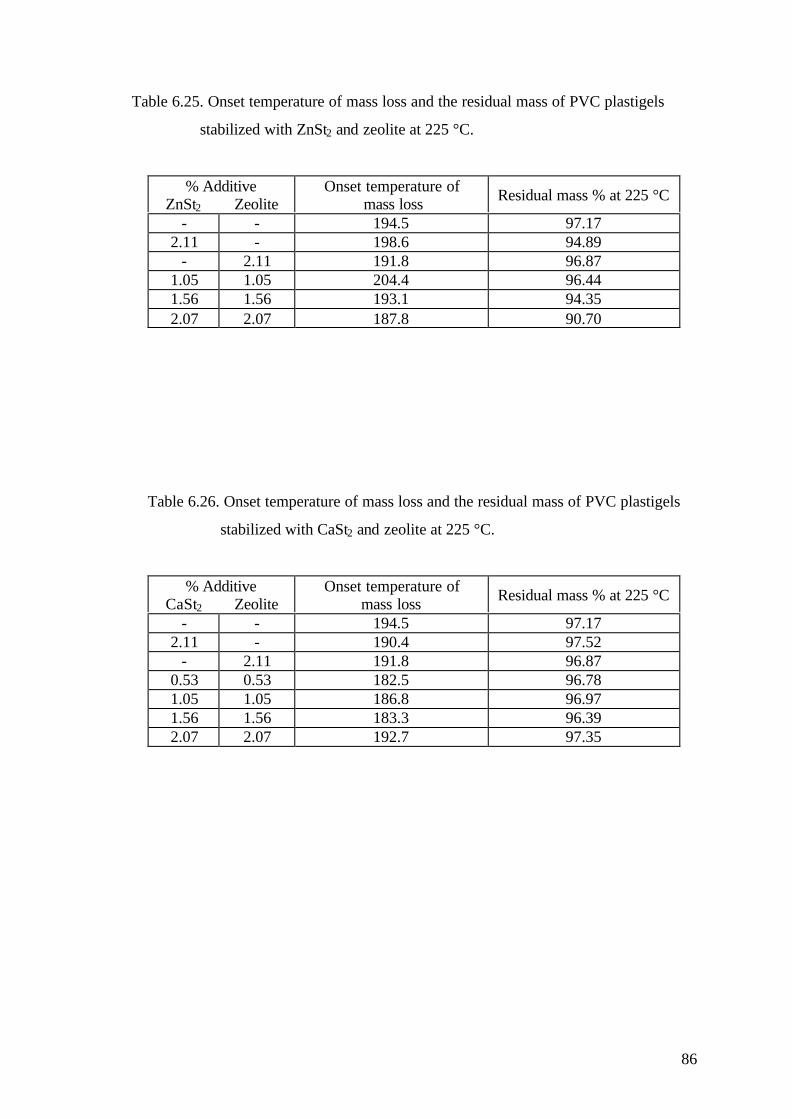
86
Table 6.25. Onset temperature of mass loss and the residual mass of PVC plastigels
stabilized with ZnSt2 and zeolite at 225 °C.
% AdditiveZnSt2 Zeolite
Onset temperature of mass loss Residual mass % at 225 °C
- - 194.5 97.172.11 - 198.6 94.89
- 2.11 191.8 96.871.05 1.05 204.4 96.441.56 1.56 193.1 94.352.07 2.07 187.8 90.70
Table 6.26. Onset temperature of mass loss and the residual mass of PVC plastigels
stabilized with CaSt2 and zeolite at 225 °C.
% AdditiveCaSt2 Zeolite
Onset temperature ofmass loss Residual mass % at 225 °C
- - 194.5 97.172.11 - 190.4 97.52
- 2.11 191.8 96.870.53 0.53 182.5 96.781.05 1.05 186.8 96.971.56 1.56 183.3 96.392.07 2.07 192.7 97.35

87
86
88
90
92
94
96
98
Res
idua
l Mas
s % a
t 225
°C
PVC Plastigel 2.11% zeolite 2.11% ZnSt22.07% ZnSt 2
+2.07% zeolite
Figure 6.46. Residual mass % values of PVC plastigel stabilized with ZnSt2
and zeolite at 225 °C.
86
88
90
92
94
96
98
Res
idua
l Mas
s% a
t 225
°C
PVC Plastigel 1.05% ZnSt 2
+1.05% zeolite
1.56% ZnSt2
+1.56% zeolite
2.07% ZnSt2
+2.07% zeolite
Figure 6.47. Residual mass % values of PVC plastigel stabilized with ZnSt2
and zeolite at 225 °C.
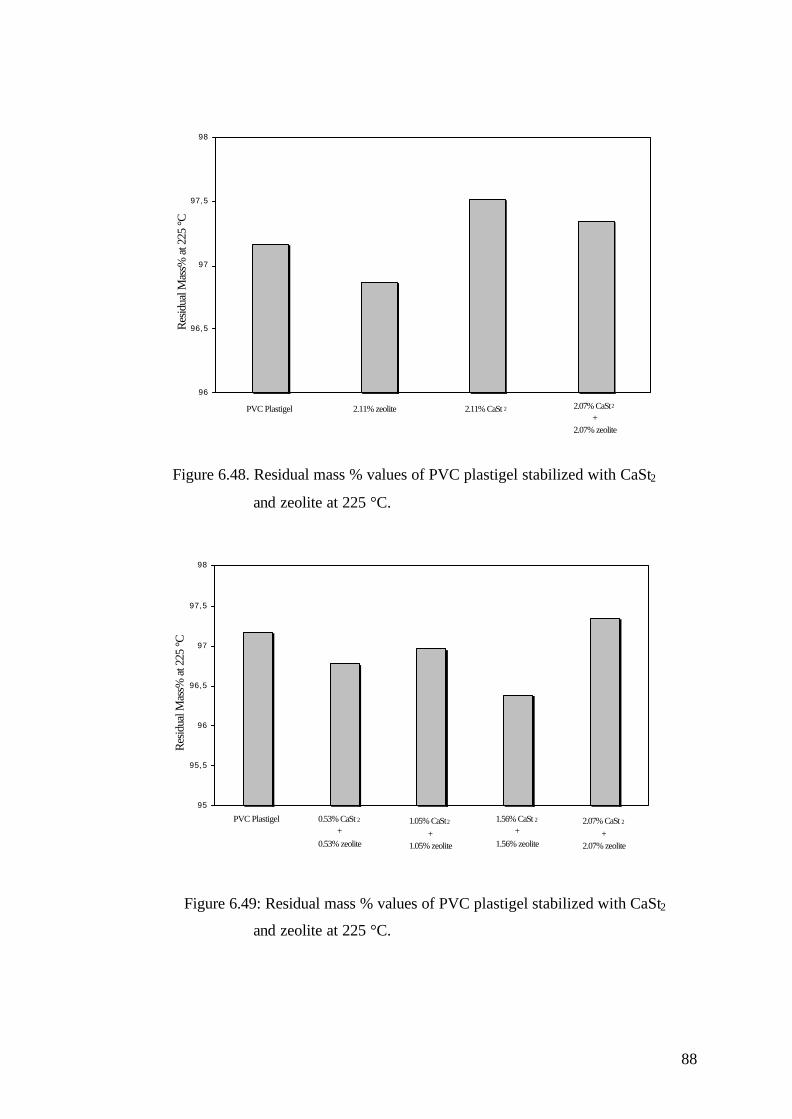
88
96
96,5
97
97,5
98
Res
idua
l Mas
s% a
t 225
°C
PVC Plastigel 2.11% zeolite 2.11% CaSt 2 2.07% CaSt2
+2.07% zeolite
Figure 6.48. Residual mass % values of PVC plastigel stabilized with CaSt2
and zeolite at 225 °C.
95
95,5
96
96,5
97
97,5
98
Res
idua
l Mas
s% a
t 225
°C
PVC Plastigel 1.05% CaSt2
+1.05% zeolite
0.53% CaSt 2
+0.53% zeolite
1.56% CaSt 2
+1.56% zeolite
2.07% CaSt 2
+2.07% zeolite
Figure 6.49: Residual mass % values of PVC plastigel stabilized with CaSt2
and zeolite at 225 °C.

89
6.4. Kinetic Study of Dehydrochlorination of PVC Plastigels
In this part of the study, the kinetic parameters (rate constants and activation energies)
of the thermal degradation of unstabilized and stabilized PVC plastigels were
determined by using 763 PVC Thermomat. Plastigel films and PVC produced by
Petkim in the reaction vessels degraded at 140 and 160 °C in PVC Thermomat. HCl gas
evolved from reaction vessels and transferred into the measuring vessels by a nitrogen
gas stream. In measuring vessels, deionized water absorbed HCl gas and the
conductivity of this solution increased with the increasing amount of HCl gas evolved
from PVC plastigel.
6.3.1. Kinetic Study of PVC and PVC Plastigels
The kinetic study was performed not only to investigate the thermal degradation of PVC
and PVC plastigels but also to expose the effect of plasticizer and its concentration on
dehydrochlorination of PVC at 160 °C. Fig.6.50 shows the change of conductivity of
aqueous solution with respect to time for PVC, DOP, and PVC plastigels prepared by
33 wt. %, 43 wt. % DOP. It was observed that firstly, the conductivity values of all the
samples except DOP were constant, in other words, HCl was not evolved from the PVC
plastigels then dehydrochlorination of PVC occurred and HCl started to evolve and
changed the conductivity of the aqueous solution. So the induction time is the period up
to inflection point of this curve. The induction time values for PVC, PVC plastigels
having 33 wt. % DOP and 43 wt. % DOP were determined as 2.3, 2.98, and 1 h at 160
°C respectively. The results indicated that small amounts of DOP delayed the induction
time of PVC but high amounts of it promoted the dehydrochlorination of PVC. These
results are in good agreement with those obtained by other investigators. Minsker et al.,
1987 tested the addition of small amounts of phthalates, sebacates and adipates to PVC
decreased the rate of dehydrochlorination, due to an inhibition effect on the growing of
polyene sequences. On the other hand, Marcilla et al., 1995 found that the presence of
DOP accelerated the process of decomposition of PVC and observed the destabilizing
effect when polar compounds were added to PVC.

90
0
5
10
15
20
0 1 2 3t i m e ( h )
Con
duct
ivity
(µ
S/cm
)
PVC Plastigel ( 43%DOP) PVC
PVC Plastigel (33%DOP) DOP
Figure 6.50. The change of conductivity of the aqueous solution with respect to
time for PVC, PVC plastigels and DOP at 160 °C.
The curves which show the conductivity change with respect to time were used to
determine the rate constant of dehydrochlorination of any sample. The slopes (a) of
these curves were related with the rate of change of the conductivity (K) change with
respect to time of the solution. The concentrations of the solutions were evaluated by
using the Equation (5). Thus rate of dehydrochlorination of PVC were determined by
using the amount of HCl that transferred into the deionized water.
tK
a∆∆= (31)
The conductivity of an electrolyte solution is the sum of the contributions of all the
ionic species in the electrolyte.
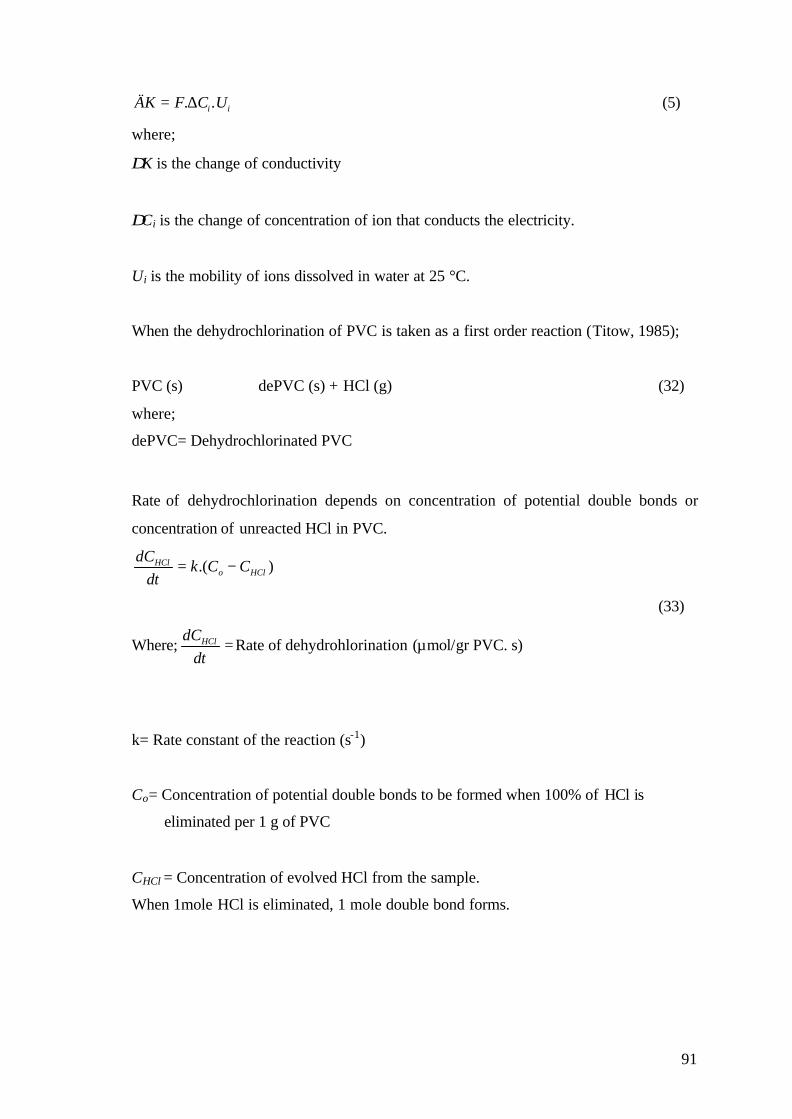
91
ii .UCF.ÄK ∆= (5)
where;
∆K is the change of conductivity
∆Ci is the change of concentration of ion that conducts the electricity.
Ui is the mobility of ions dissolved in water at 25 °C.
When the dehydrochlorination of PVC is taken as a first order reaction (Titow, 1985);
PVC (s) dePVC (s) + HCl (g) (32)
where;
dePVC= Dehydrochlorinated PVC
Rate of dehydrochlorination depends on concentration of potential double bonds or
concentration of unreacted HCl in PVC.
).( HCloHCl CCk
dtdC −=
(33)
Where; =dt
dCHCl Rate of dehydrohlorination (µmol/gr PVC. s)
k= Rate constant of the reaction (s-1)
Co= Concentration of potential double bonds to be formed when 100% of HCl is
eliminated per 1 g of PVC
CHCl = Concentration of evolved HCl from the sample.
When 1mole HCl is eliminated, 1 mole double bond forms.

92
Co=16.5x10³ µmol/g.PVC
Since HClC <<< Co
Co-CHCl can be taken as 16.5x10³ µmol/g.PVC
oHCl Ck
dt
dC.= (34)
dt
dCHCl can be calculated from the slope of conductivity versus time graph by taking the
derivative of Eq.5 with respect to time.
HClwHCl
i Udt
dCZF
dtdK
... ,Σ= (35)
where;
CHCl,w is the concentration of HCl in water.
Assumption; all HCl evolved from PVC was absorbed by water.
dt
dnV
dt
dCHCl
wwHCl =., (36)
nHCl =Moles of evolved HCl gas.
Vw= Volume of water in measuring vessel
Vw= 6x10⁻⁵ m3
CFmdt
dn
dt
dC HClHCl
.1
.= (37)
m=Mass of plastisol in reaction vessel
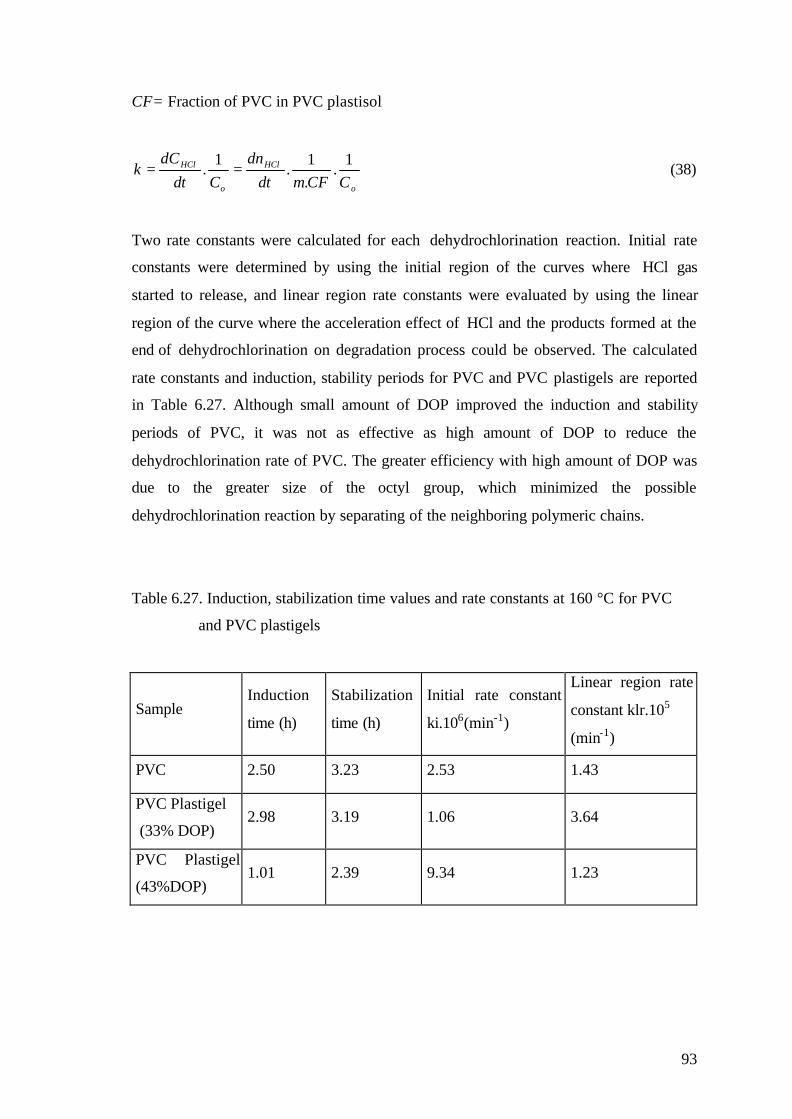
93
CF= Fraction of PVC in PVC plastisol
o
HCl
o
HCl
CCFmdt
dn
Cdt
dCk
1.
.1
.1
. == (38)
Two rate constants were calculated for each dehydrochlorination reaction. Initial rate
constants were determined by using the initial region of the curves where HCl gas
started to release, and linear region rate constants were evaluated by using the linear
region of the curve where the acceleration effect of HCl and the products formed at the
end of dehydrochlorination on degradation process could be observed. The calculated
rate constants and induction, stability periods for PVC and PVC plastigels are reported
in Table 6.27. Although small amount of DOP improved the induction and stability
periods of PVC, it was not as effective as high amount of DOP to reduce the
dehydrochlorination rate of PVC. The greater efficiency with high amount of DOP was
due to the greater size of the octyl group, which minimized the possible
dehydrochlorination reaction by separating of the neighboring polymeric chains.
Table 6.27. Induction, stabilization time values and rate constants at 160 °C for PVC
and PVC plastigels
SampleInduction
time (h)
Stabilization
time (h)
Initial rate constant
ki.106(min-1)
Linear region rate
constant klr.105
(min-1)
PVC 2.50 3.23 2.53 1.43
PVC Plastigel
(33% DOP)2.98 3.19 1.06 3.64
PVC Plastigel
(43%DOP)1.01 2.39 9.34 1.23
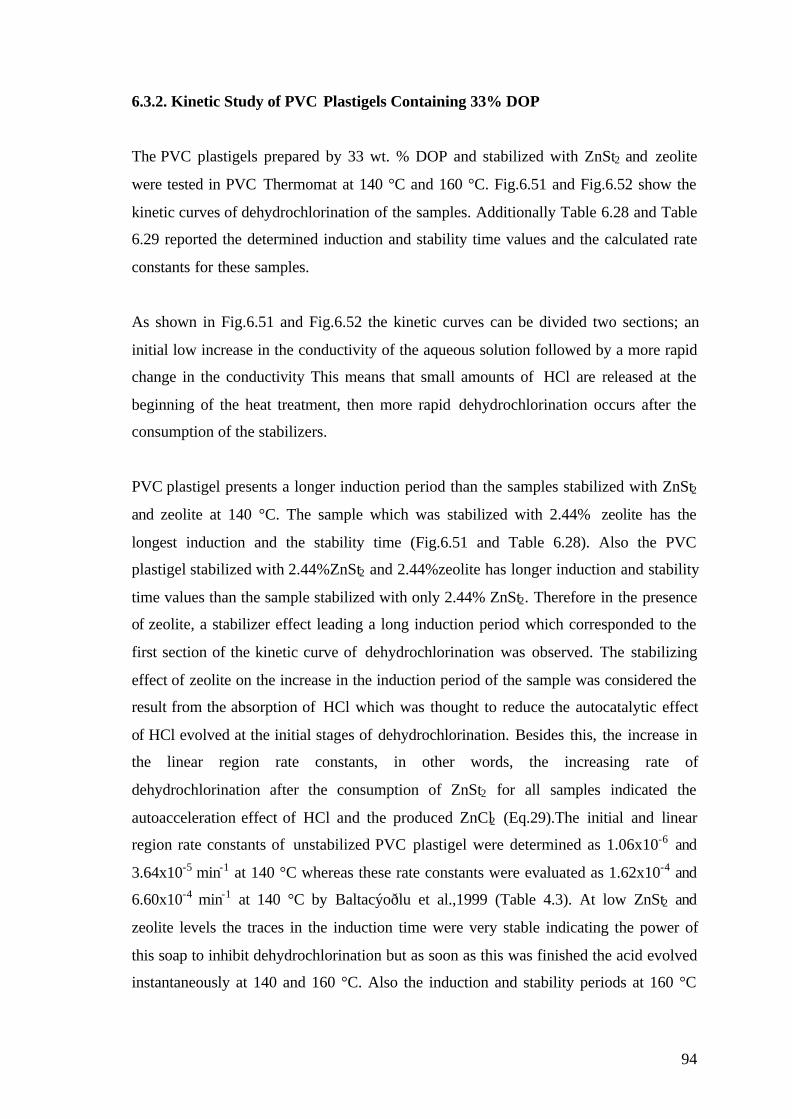
94
6.3.2. Kinetic Study of PVC Plastigels Containing 33% DOP
The PVC plastigels prepared by 33 wt. % DOP and stabilized with ZnSt2 and zeolite
were tested in PVC Thermomat at 140 °C and 160 °C. Fig.6.51 and Fig.6.52 show the
kinetic curves of dehydrochlorination of the samples. Additionally Table 6.28 and Table
6.29 reported the determined induction and stability time values and the calculated rate
constants for these samples.
As shown in Fig.6.51 and Fig.6.52 the kinetic curves can be divided two sections; an
initial low increase in the conductivity of the aqueous solution followed by a more rapid
change in the conductivity This means that small amounts of HCl are released at the
beginning of the heat treatment, then more rapid dehydrochlorination occurs after the
consumption of the stabilizers.
PVC plastigel presents a longer induction period than the samples stabilized with ZnSt2
and zeolite at 140 °C. The sample which was stabilized with 2.44% zeolite has the
longest induction and the stability time (Fig.6.51 and Table 6.28). Also the PVC
plastigel stabilized with 2.44%ZnSt2 and 2.44%zeolite has longer induction and stability
time values than the sample stabilized with only 2.44% ZnSt2. Therefore in the presence
of zeolite, a stabilizer effect leading a long induction period which corresponded to the
first section of the kinetic curve of dehydrochlorination was observed. The stabilizing
effect of zeolite on the increase in the induction period of the sample was considered the
result from the absorption of HCl which was thought to reduce the autocatalytic effect
of HCl evolved at the initial stages of dehydrochlorination. Besides this, the increase in
the linear region rate constants, in other words, the increasing rate of
dehydrochlorination after the consumption of ZnSt2 for all samples indicated the
autoacceleration effect of HCl and the produced ZnCl2 (Eq.29).The initial and linear
region rate constants of unstabilized PVC plastigel were determined as 1.06x10⁻⁶ and
3.64x10⁻⁵ min-1 at 140 °C whereas these rate constants were evaluated as 1.62x10⁻⁴ and
6.60x10⁻⁴ min-1 at 140 °C by Baltacýoðlu et al.,1999 (Table 4.3). At low ZnSt2 and
zeolite levels the traces in the induction time were very stable indicating the power of
this soap to inhibit dehydrochlorination but as soon as this was finished the acid evolved
instantaneously at 140 and 160 °C. Also the induction and stability periods at 160 °C
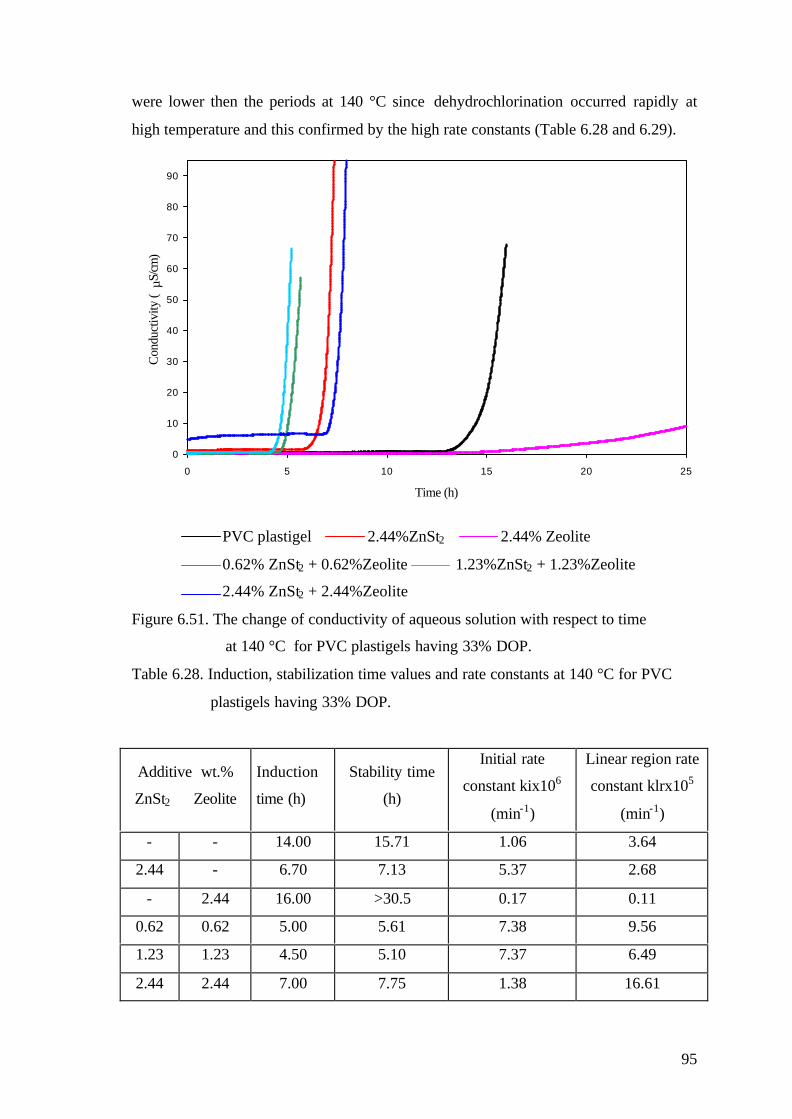
95
were lower then the periods at 140 °C since dehydrochlorination occurred rapidly at
high temperature and this confirmed by the high rate constants (Table 6.28 and 6.29).
0
10
20
30
40
50
60
70
80
90
0 5 10 15 20 25
Time (h)
Con
duct
ivity
(µS
/cm)
PVC plastigel 2.44%ZnSt2 2.44% Zeolite
0.62% ZnSt2 + 0.62%Zeolite 1.23%ZnSt2 + 1.23%Zeolite
2.44% ZnSt2 + 2.44%Zeolite
Figure 6.51. The change of conductivity of aqueous solution with respect to time
at 140 °C for PVC plastigels having 33% DOP.
Table 6.28. Induction, stabilization time values and rate constants at 140 °C for PVC
plastigels having 33% DOP.
Additive wt.%
ZnSt2 Zeolite
Induction
time (h)
Stability time
(h)
Initial rate
constant kix106
(min-1)
Linear region rate
constant klrx105
(min-1)
- - 14.00 15.71 1.06 3.64
2.44 - 6.70 7.13 5.37 2.68
- 2.44 16.00 >30.5 0.17 0.11
0.62 0.62 5.00 5.61 7.38 9.56
1.23 1.23 4.50 5.10 7.37 6.49
2.44 2.44 7.00 7.75 1.38 16.61
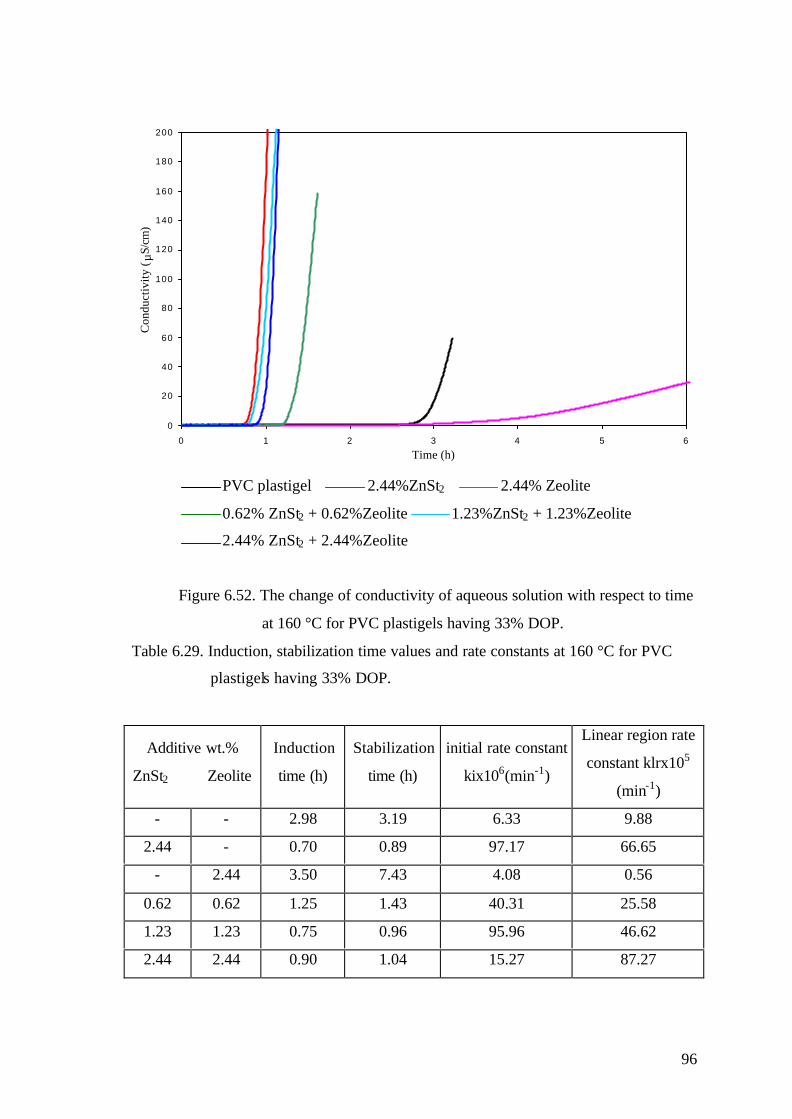
96
0
20
40
60
80
100
120
140
160
180
200
0 1 2 3 4 5 6
Time (h)
Con
duct
ivity
(µS
/cm
)
PVC plastigel 2.44%ZnSt2 2.44% Zeolite
0.62% ZnSt2 + 0.62%Zeolite 1.23%ZnSt2 + 1.23%Zeolite
2.44% ZnSt2 + 2.44%Zeolite
Figure 6.52. The change of conductivity of aqueous solution with respect to time
at 160 °C for PVC plastigels having 33% DOP.
Table 6.29. Induction, stabilization time values and rate constants at 160 °C for PVC
plastigels having 33% DOP.
Additive wt.%
ZnSt2 Zeolite
Induction
time (h)
Stabilization
time (h)
initial rate constant
kix106(min-1)
Linear region rate
constant klrx105
(min-1)
- - 2.98 3.19 6.33 9.88
2.44 - 0.70 0.89 97.17 66.65
- 2.44 3.50 7.43 4.08 0.56
0.62 0.62 1.25 1.43 40.31 25.58
1.23 1.23 0.75 0.96 95.96 46.62
2.44 2.44 0.90 1.04 15.27 87.27
97
6.3.3. Kinetic Study of PVC Plastigels Containing 43% DOP
The PVC plastigels prepared by 43% DOP and 2%viscobyk were tested in PVC
Thermomat at 140 and 160 °C. Fig.6.53 and 6.54 show the change of conductivity of
aqueous solution with respect to time for PVC plastigels stabilized with ZnSt2 and
zeolite at two different temperatures. Also the induction, stability periods and the rate
constants of dehydrochlorination which were computed from the slopes of the kinetic
curves are shown in Table 6.30 and 6.31
The sample stabilized with 2.11% zeolite presents a longer induction time than the
others at 140 °C due to the absorbing the produced HCl. Also it has the highest stability
time as shown in Table 6.30. Ven et al., (2000) described a linear relationship between
HCl-capacity of layered double hydroxides with different counterions and their action
as heat stabilizer in PVC. And the rapid dehydrochlorination after 13 h for the sample
stabilized with zeolite can be explained by the lack of HCl-capacity of zeolite. When
2.11% Znst2 was used to stabilize the PVC plastigel, it neither delayed the induction
time nor decreased the rate of dehydrochlorination. At low ZnSt2 and zeolite levels at
140 °C, the synergism between these heat stabilizers on thermal degradation of PVC
was observed due to the slow dehydrochlorination of PVC, in other words, due to the
low linear region rate constant. As ZnSt2 amount in PVC plastisol was increased, linear
region rate constant increases accordingly.
At 160 °C, all the samples are thermally degraded in 3 hours as shown in Fig.6.54. So
the induction periods of the sample decrease with increasing temperature. Also the
amount of HCl evolved from the samples seems to be higher than previously since it
gets up to more than 295 µS/cm. The sample which was unstabilized had the lowest rate
constants for initial and linear regions. When zeolite was a primary stabilizer at 160 °C,
it showed a stabilizing effect by increasing the induction and stability periods. This
effect was considered to result from the absorption of HCl which catalyzed the
dehydrochlorination of PVC. So zeolite captured catalytic, highly mobile HCl before
elimination of further HCl occurred. But when the HCl-capacity of zeolite was not
sufficient to absorb the evolved HCl, the acid catalyzed the degradation reaction by
releasing from the sample. Therefore zeolite provided long induction and stability
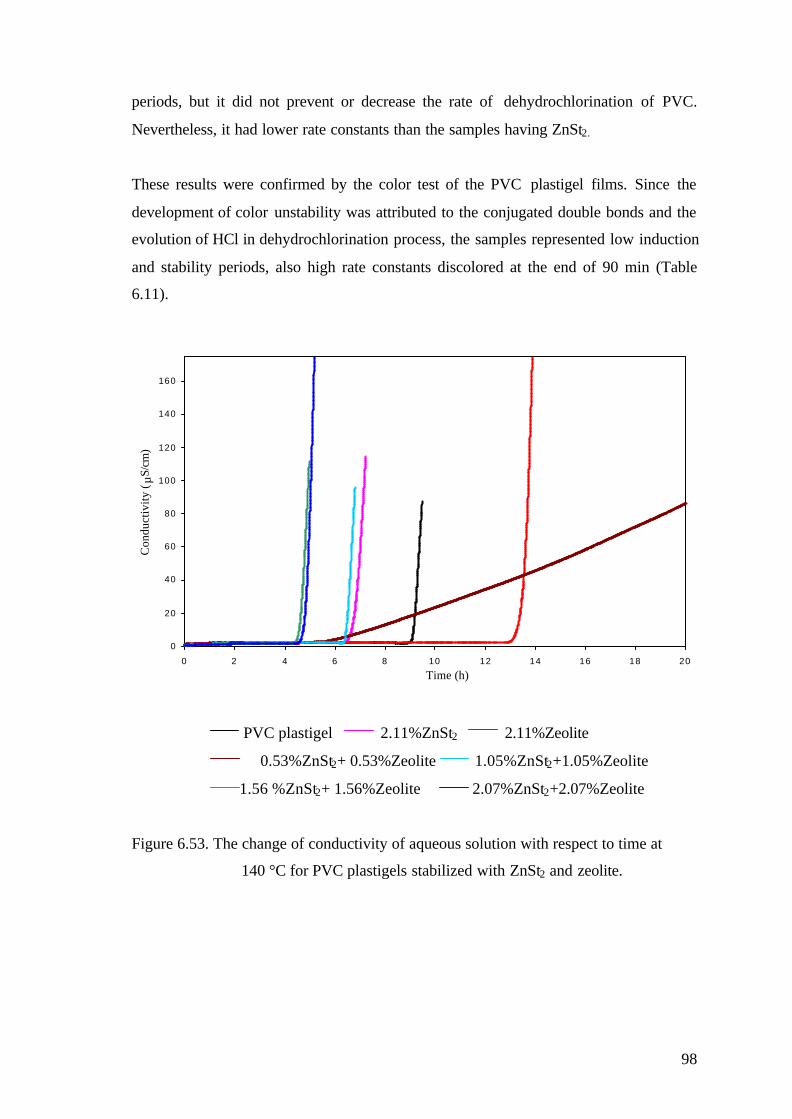
98
periods, but it did not prevent or decrease the rate of dehydrochlorination of PVC.
Nevertheless, it had lower rate constants than the samples having ZnSt2.
These results were confirmed by the color test of the PVC plastigel films. Since the
development of color unstability was attributed to the conjugated double bonds and the
evolution of HCl in dehydrochlorination process, the samples represented low induction
and stability periods, also high rate constants discolored at the end of 90 min (Table
6.11).
0
20
40
60
80
100
120
140
160
0 2 4 6 8 10 12 14 16 18 20
Time (h)
Con
duct
ivity
(µS
/cm
)
PVC plastigel 2.11%ZnSt2 2.11%Zeolite
0.53%ZnSt2+ 0.53%Zeolite 1.05%ZnSt2+1.05%Zeolite
1.56 %ZnSt2+ 1.56%Zeolite 2.07%ZnSt2+2.07%Zeolite
Figure 6.53. The change of conductivity of aqueous solution with respect to time at
140 °C for PVC plastigels stabilized with ZnSt2 and zeolite.
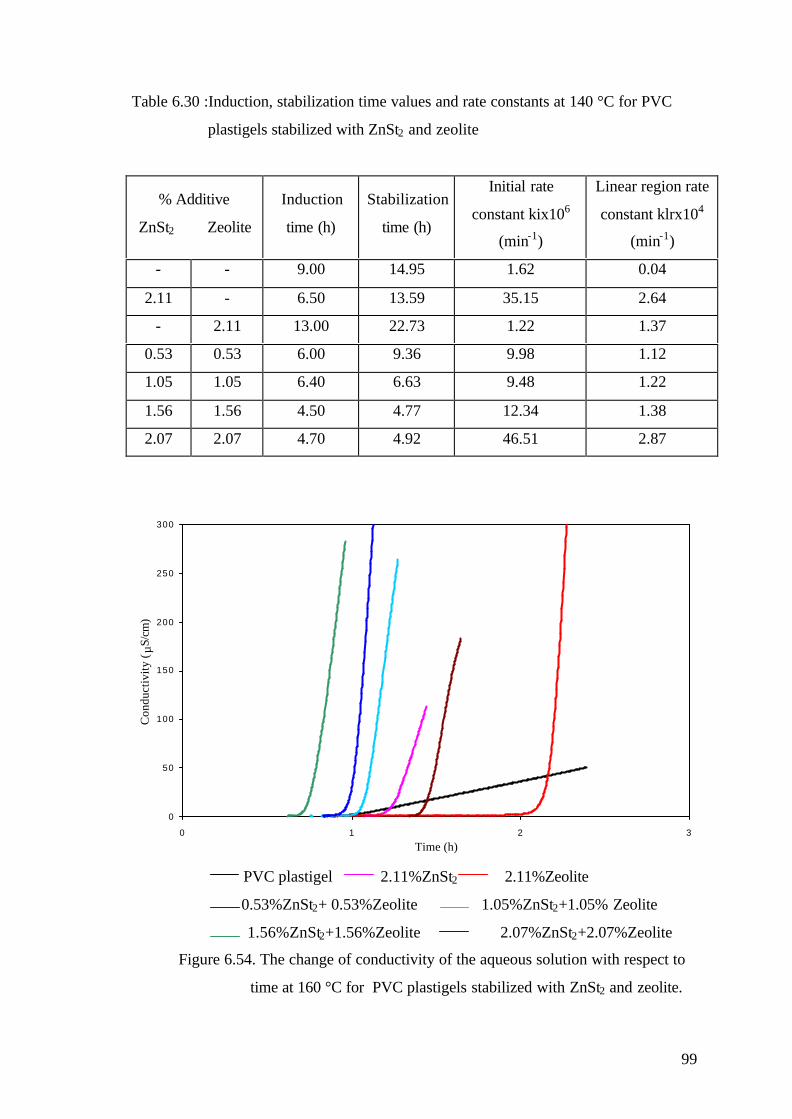
99
Table 6.30 :Induction, stabilization time values and rate constants at 140 °C for PVC
plastigels stabilized with ZnSt2 and zeolite
% Additive
ZnSt2 Zeolite
Induction
time (h)
Stabilization
time (h)
Initial rate
constant kix106
(min-1)
Linear region rate
constant klrx104
(min-1)
- - 9.00 14.95 1.62 0.04
2.11 - 6.50 13.59 35.15 2.64
- 2.11 13.00 22.73 1.22 1.37
0.53 0.53 6.00 9.36 9.98 1.12
1.05 1.05 6.40 6.63 9.48 1.22
1.56 1.56 4.50 4.77 12.34 1.38
2.07 2.07 4.70 4.92 46.51 2.87
0
50
100
150
200
250
300
0 1 2 3
Time (h)
Con
duct
ivity
(µS
/cm
)
PVC plastigel 2.11%ZnSt2 2.11%Zeolite
0.53%ZnSt2+ 0.53%Zeolite 1.05%ZnSt2+1.05% Zeolite
1.56%ZnSt2+1.56%Zeolite 2.07%ZnSt2+2.07%Zeolite
Figure 6.54. The change of conductivity of the aqueous solution with respect to
time at 160 °C for PVC plastigels stabilized with ZnSt2 and zeolite.
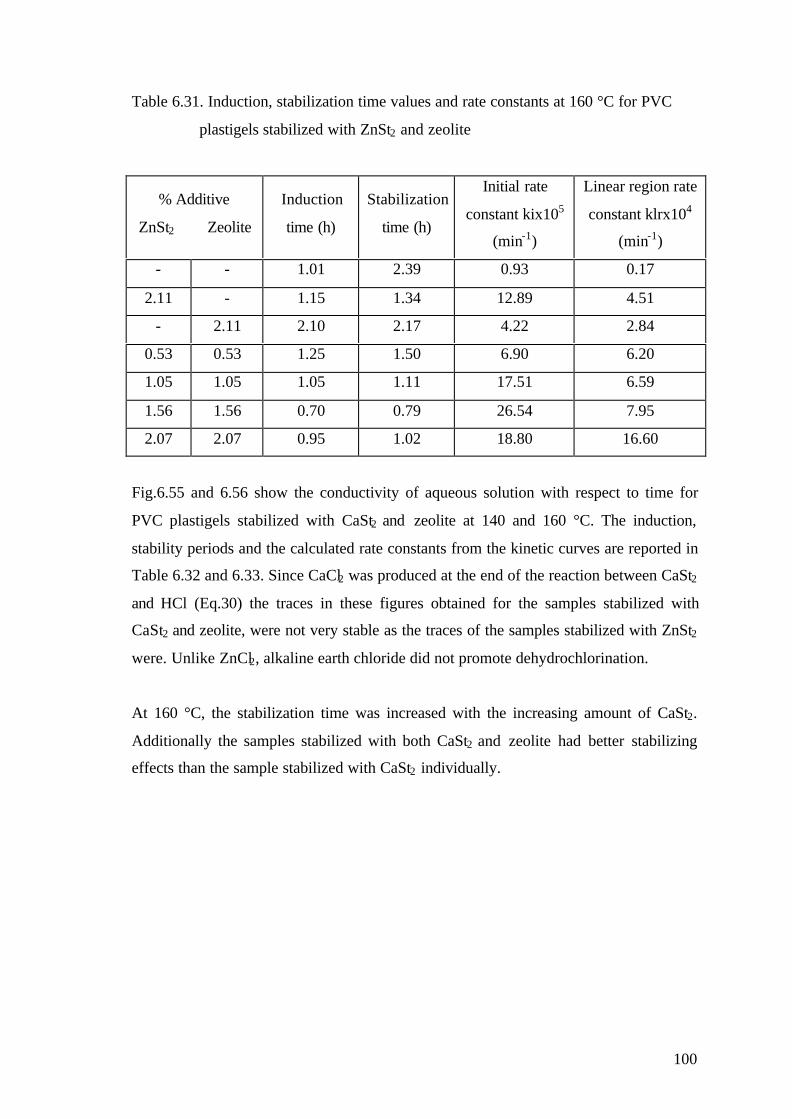
100
Table 6.31. Induction, stabilization time values and rate constants at 160 °C for PVC
plastigels stabilized with ZnSt2 and zeolite
% Additive
ZnSt2 Zeolite
Induction
time (h)
Stabilization
time (h)
Initial rate
constant kix105
(min-1)
Linear region rate
constant klrx104
(min-1)
- - 1.01 2.39 0.93 0.17
2.11 - 1.15 1.34 12.89 4.51
- 2.11 2.10 2.17 4.22 2.84
0.53 0.53 1.25 1.50 6.90 6.20
1.05 1.05 1.05 1.11 17.51 6.59
1.56 1.56 0.70 0.79 26.54 7.95
2.07 2.07 0.95 1.02 18.80 16.60
Fig.6.55 and 6.56 show the conductivity of aqueous solution with respect to time for
PVC plastigels stabilized with CaSt2 and zeolite at 140 and 160 °C. The induction,
stability periods and the calculated rate constants from the kinetic curves are reported in
Table 6.32 and 6.33. Since CaCl2 was produced at the end of the reaction between CaSt2
and HCl (Eq.30) the traces in these figures obtained for the samples stabilized with
CaSt2 and zeolite, were not very stable as the traces of the samples stabilized with ZnSt2
were. Unlike ZnCl2, alkaline earth chloride did not promote dehydrochlorination.
At 160 °C, the stabilization time was increased with the increasing amount of CaSt2.
Additionally the samples stabilized with both CaSt2 and zeolite had better stabilizing
effects than the sample stabilized with CaSt2 individually.
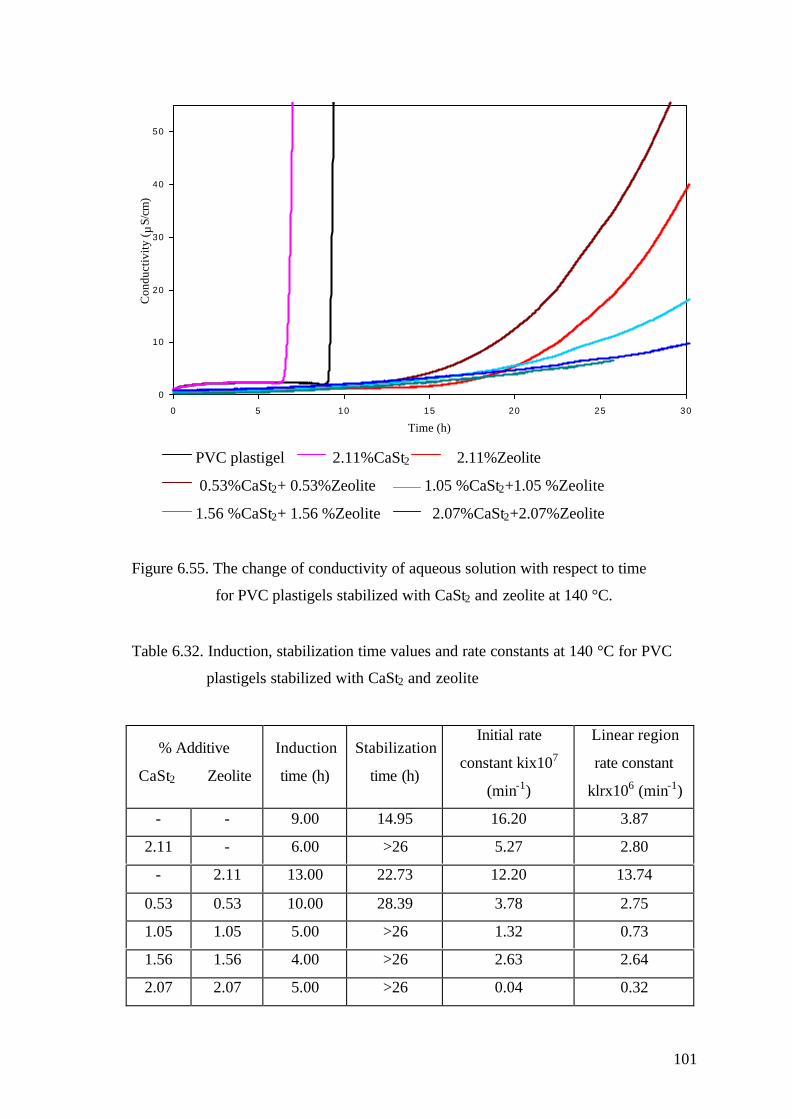
101
0
10
20
30
40
50
0 5 10 15 20 25 30
Time (h)
Con
duct
ivity
( µS/
cm)
PVC plastigel 2.11%CaSt2 2.11%Zeolite
0.53%CaSt2+ 0.53%Zeolite 1.05 %CaSt2+1.05 %Zeolite
1.56 %CaSt2+ 1.56 %Zeolite 2.07%CaSt2+2.07%Zeolite
Figure 6.55. The change of conductivity of aqueous solution with respect to time
for PVC plastigels stabilized with CaSt2 and zeolite at 140 °C.
Table 6.32. Induction, stabilization time values and rate constants at 140 °C for PVC
plastigels stabilized with CaSt2 and zeolite
% Additive
CaSt2 Zeolite
Induction
time (h)
Stabilization
time (h)
Initial rate
constant kix107
(min-1)
Linear region
rate constant
klrx106 (min-1)
- - 9.00 14.95 16.20 3.87
2.11 - 6.00 >26 5.27 2.80
- 2.11 13.00 22.73 12.20 13.74
0.53 0.53 10.00 28.39 3.78 2.75
1.05 1.05 5.00 >26 1.32 0.73
1.56 1.56 4.00 >26 2.63 2.64
2.07 2.07 5.00 >26 0.04 0.32
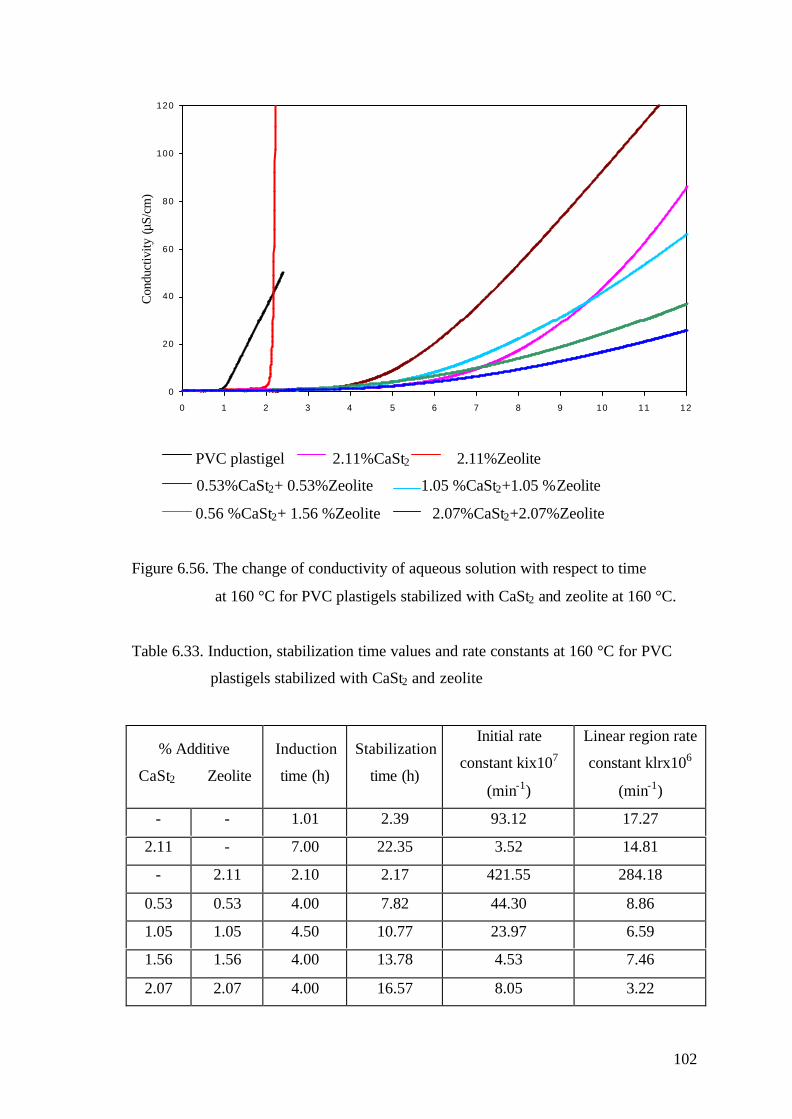
102
0
20
40
60
80
100
120
0 1 2 3 4 5 6 7 8 9 10 11 12
Time (h)
Con
duct
ivity
(µS/
cm)
PVC plastigel 2.11%CaSt2 2.11%Zeolite
0.53%CaSt2+ 0.53%Zeolite 1.05 %CaSt2+1.05 %Zeolite
0.56 %CaSt2+ 1.56 %Zeolite 2.07%CaSt2+2.07%Zeolite
Figure 6.56. The change of conductivity of aqueous solution with respect to time
at 160 °C for PVC plastigels stabilized with CaSt2 and zeolite at 160 °C.
Table 6.33. Induction, stabilization time values and rate constants at 160 °C for PVC
plastigels stabilized with CaSt2 and zeolite
% Additive
CaSt2 Zeolite
Induction
time (h)
Stabilization
time (h)
Initial rate
constant kix107
(min-1)
Linear region rate
constant klrx106
(min-1)
- - 1.01 2.39 93.12 17.27
2.11 - 7.00 22.35 3.52 14.81
- 2.11 2.10 2.17 421.55 284.18
0.53 0.53 4.00 7.82 44.30 8.86
1.05 1.05 4.50 10.77 23.97 6.59
1.56 1.56 4.00 13.78 4.53 7.46
2.07 2.07 4.00 16.57 8.05 3.22
103
Although the results of PVC Thermomat indicated the evolving of HCl from the PVC
plastigels due to the dehydrochlorination of PVC at 140 and 160 °C, any mass loss of
the samples was not detected by thermogravimetric analysis (Fig.6.42 to Fig.6.45). The
onset temperatures where the first mass loss was observed were higher than 160 °C
according to TGA results. It might be concluded that the amount of evolved HCl from
the samples were as low as, thermogravimetric analysis could not detect it. Therefore it
was essential to test PVC plastigel films by PVC Thermomat to determine the kinetic
parameters of dehydrochlorination of PVC at low temperatures since
dehydrochlorination started at 100 °C.
6.3.4. Activation Energies of Dehydrochlorination Reactions
The activation energies of the dehydrochlorination reactions for initial and linear
regions were calculated for the samples having 33%, 43% DOP.
The rate constant can be explained by Arrhenius Equation as;
TRE
eAk ..−
= (35)
where;
k= Rate constant
A=Preexponential factor
E=Activation energy (J/mole)
R=Gas constant (8.314 J/mole.K)
T=Absolute temperature (K)
The activation energy was determined experimentally by carrying out the reaction at
two different temperatures (140 and 160 °C)
)11
.(ln121
2
TTRE
kk −−= (36)
For the dehydrochlorination of unstabilized sample prepared by 43% DOP the
activation energy values were calculated as 129.70 and 111.27 kj/mole for initial and

104
linear region. Beltran et al., 1997 determined the activation energy of the degradation of
PVC plastisol as 87.78 kj/mole, where the overall reaction order was 0.81. In that study,
thermogravimetric analysis was used to calculate the kinetic parameters by integrating
the corresponding differential equations, using the Runge-Kutta algorithm.
As shown in Table 6.34 to 6.36, the activation energy values in linear region are
generally lower than the values in initial region for all the samples due to the high rate
of dehydrochlorination of PVC after the consumption of stabilizers and acceleration
effect of the evolved acid. It was observed that the addition of the stabilizers into the
PVC plastisol prepared by 33% DOP had a stabilizing effect only for linear region by
the increasing the activation energy values for linear region.
When zeolite was used as a primary stabilizer, it not only increased the induction
period, but also increased the activation energy at initial region. Although the sample
stabilized with 2.11% ZnSt2 presented higher activation energy than the sample having
2.11% CaSt2 for initial region, the activation energy of this sample was lower for linear
region due the acceleration effect of the produced ZnCl2 on the second step of
dehydrochlorination of PVC (Table 6.35 and 6.36). The sample stabilized with both
ZnSt2 and zeolite (except 2.07%ZnSt2 and 2.07%zeolite) clearly indicated the high
activation energy values for linear region as compared with unstabilized PVC plastigel
due to the ability of zeolite to absorb HCl, reducing further acid-catalyzed
dehydrochlorination of PVC.
The PVC plastigel stabilized with 2.07% ZnSt2 and 2.07% zeolite presented highest
activation energy values for linear region (Table 6.35). Neither of the samples stabilized
with ZnSt2 nor zeolite individually got up to these values. Therefore the rate of
dehydrochlorination of PVC was reduced by increasing the activation energy of this
reaction.
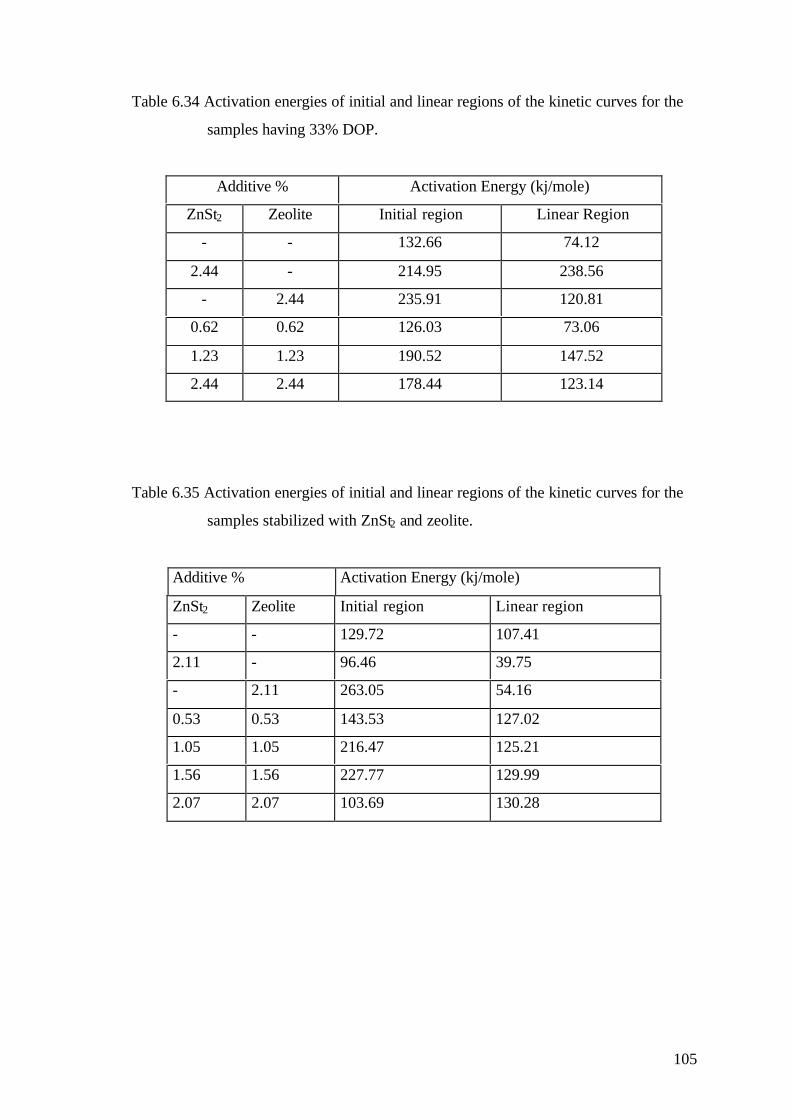
105
Table 6.34 Activation energies of initial and linear regions of the kinetic curves for the
samples having 33% DOP.
Additive % Activation Energy (kj/mole)
ZnSt2 Zeolite Initial region Linear Region
- - 132.66 74.12
2.44 - 214.95 238.56
- 2.44 235.91 120.81
0.62 0.62 126.03 73.06
1.23 1.23 190.52 147.52
2.44 2.44 178.44 123.14
Table 6.35 Activation energies of initial and linear regions of the kinetic curves for the
samples stabilized with ZnSt2 and zeolite.
Additive % Activation Energy (kj/mole)
ZnSt2 Zeolite Initial region Linear region
- - 129.72 107.41
2.11 - 96.46 39.75
- 2.11 263.05 54.16
0.53 0.53 143.53 127.02
1.05 1.05 216.47 125.21
1.56 1.56 227.77 129.99
2.07 2.07 103.69 130.28
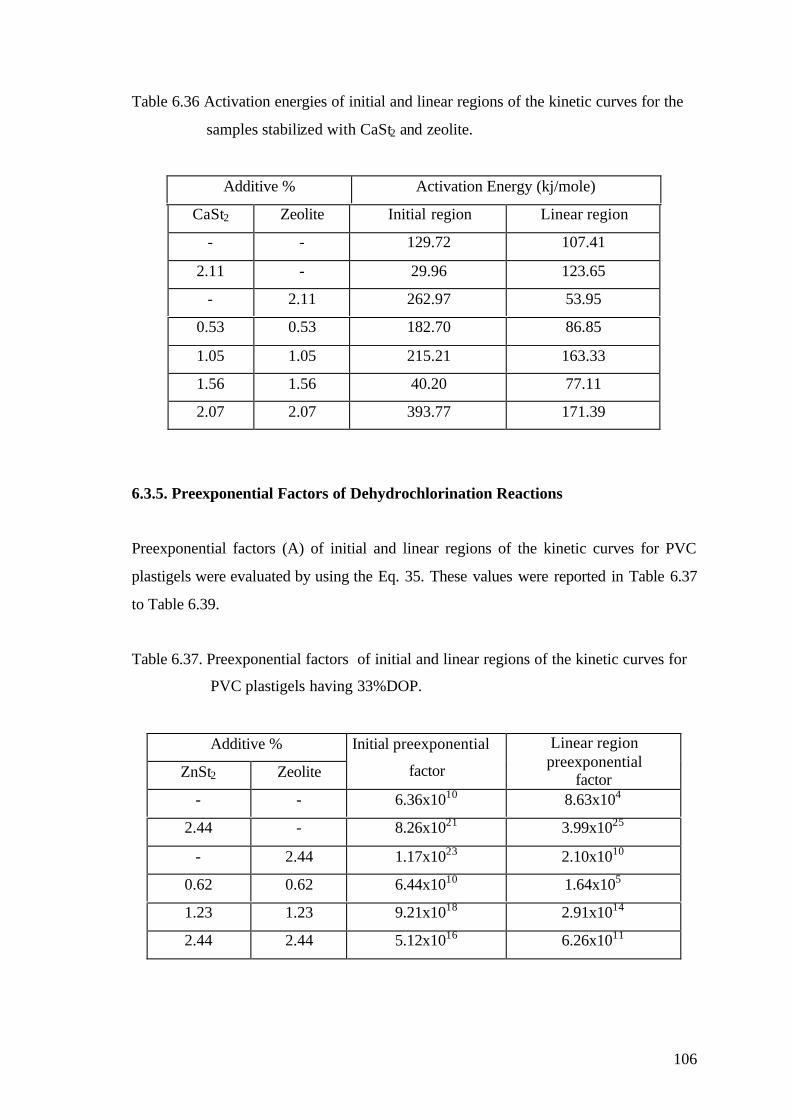
106
Table 6.36 Activation energies of initial and linear regions of the kinetic curves for the
samples stabilized with CaSt2 and zeolite.
Additive % Activation Energy (kj/mole)
CaSt2 Zeolite Initial region Linear region
- - 129.72 107.41
2.11 - 29.96 123.65
- 2.11 262.97 53.95
0.53 0.53 182.70 86.85
1.05 1.05 215.21 163.33
1.56 1.56 40.20 77.11
2.07 2.07 393.77 171.39
6.3.5. Preexponential Factors of Dehydrochlorination Reactions
Preexponential factors (A) of initial and linear regions of the kinetic curves for PVC
plastigels were evaluated by using the Eq. 35. These values were reported in Table 6.37
to Table 6.39.
Table 6.37. Preexponential factors of initial and linear regions of the kinetic curves for
PVC plastigels having 33%DOP.
Additive %
ZnSt2 Zeolite
Initial preexponential
factor
Linear regionpreexponential
factor- - 6.36x10¹⁰ 8.63x10⁴
2.44 - 8.26x10²¹ 3.99x1025
- 2.44 1.17x10²³ 2.10x10¹⁰
0.62 0.62 6.44x10¹⁰ 1.64x10⁵
1.23 1.23 9.21x10¹⁸ 2.91x10¹⁴
2.44 2.44 5.12x10¹⁶ 6.26x10¹¹
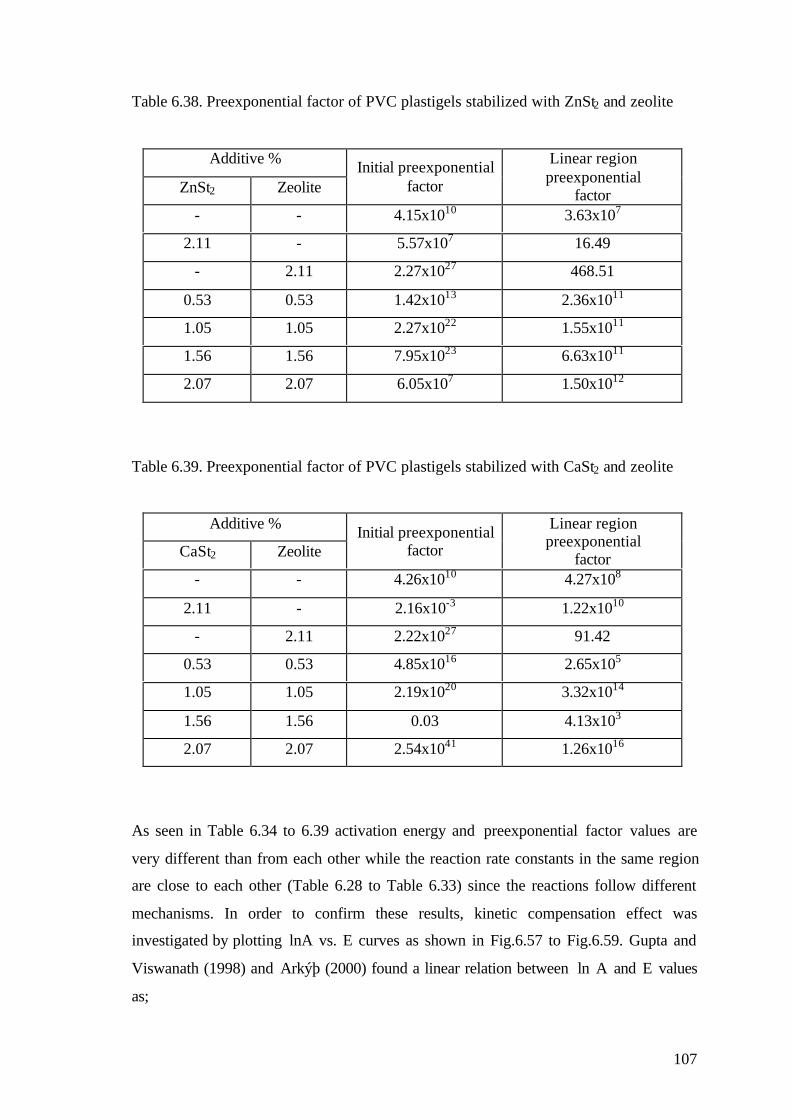
107
Table 6.38. Preexponential factor of PVC plastigels stabilized with ZnSt2 and zeolite
Additive %
ZnSt2 ZeoliteInitial preexponential
factor
Linear regionpreexponential
factor- - 4.15x10¹⁰ 3.63x10⁷
2.11 - 5.57x10⁷ 16.49
- 2.11 2.27x1027 468.51
0.53 0.53 1.42x10¹³ 2.36x10¹¹
1.05 1.05 2.27x10²² 1.55x10¹¹
1.56 1.56 7.95x10²³ 6.63x10¹¹
2.07 2.07 6.05x10⁷ 1.50x10¹²
Table 6.39. Preexponential factor of PVC plastigels stabilized with CaSt2 and zeolite
Additive %
CaSt2 ZeoliteInitial preexponential
factor
Linear regionpreexponential
factor- - 4.26x10¹⁰ 4.27x10⁸
2.11 - 2.16x10⁻³ 1.22x10¹⁰
- 2.11 2.22x1027 91.42
0.53 0.53 4.85x10¹⁶ 2.65x10⁵
1.05 1.05 2.19x10²⁰ 3.32x10¹⁴
1.56 1.56 0.03 4.13x10³
2.07 2.07 2.54x1041 1.26x10¹⁶
As seen in Table 6.34 to 6.39 activation energy and preexponential factor values are
very different than from each other while the reaction rate constants in the same region
are close to each other (Table 6.28 to Table 6.33) since the reactions follow different
mechanisms. In order to confirm these results, kinetic compensation effect was
investigated by plotting lnA vs. E curves as shown in Fig.6.57 to Fig.6.59. Gupta and
Viswanath (1998) and Arkýþ (2000) found a linear relation between ln A and E values
as;
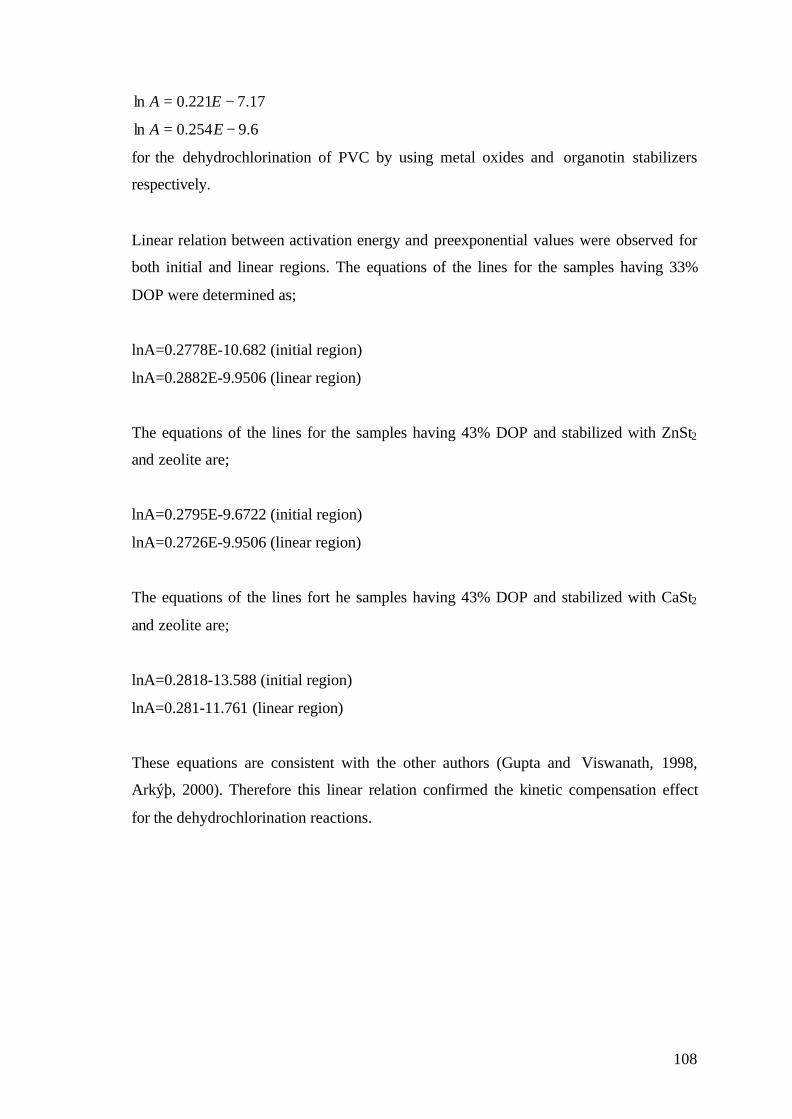
108
17.7221.0ln −= EA
6.9254.0ln −= EA
for the dehydrochlorination of PVC by using metal oxides and organotin stabilizers
respectively.
Linear relation between activation energy and preexponential values were observed for
both initial and linear regions. The equations of the lines for the samples having 33%
DOP were determined as;
lnA=0.2778E-10.682 (initial region)
lnA=0.2882E-9.9506 (linear region)
The equations of the lines for the samples having 43% DOP and stabilized with ZnSt2
and zeolite are;
lnA=0.2795E-9.6722 (initial region)
lnA=0.2726E-9.9506 (linear region)
The equations of the lines fort he samples having 43% DOP and stabilized with CaSt2
and zeolite are;
lnA=0.2818-13.588 (initial region)
lnA=0.281-11.761 (linear region)
These equations are consistent with the other authors (Gupta and Viswanath, 1998,
Arkýþ, 2000). Therefore this linear relation confirmed the kinetic compensation effect
for the dehydrochlorination reactions.
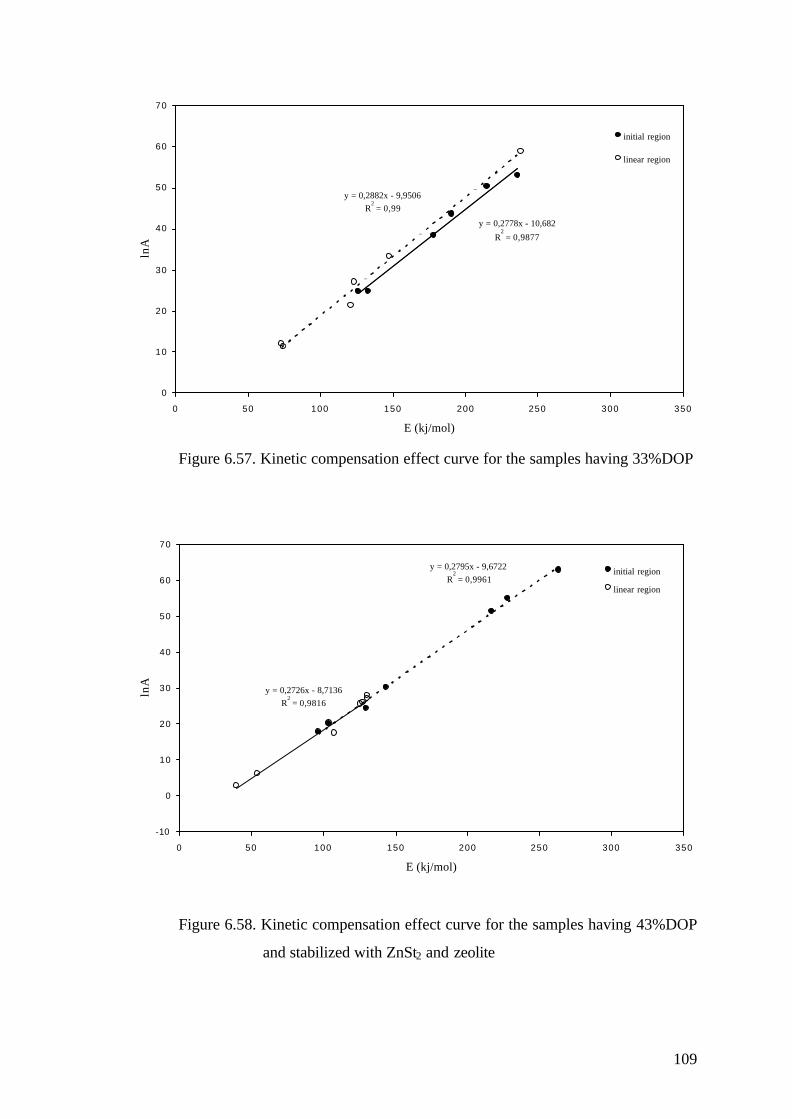
109
y = 0,2778x - 10,682
R2 = 0,9877
y = 0,2882x - 9,9506R
2 = 0,99
0
10
20
30
40
50
60
70
0 50 100 150 200 250 300 350
E (kj/mol)
lnA
initial region
linear region
Figure 6.57. Kinetic compensation effect curve for the samples having 33%DOP
y = 0,2795x - 9,6722R
2 = 0,9961
y = 0,2726x - 8,7136R
2 = 0,9816
-10
0
10
20
30
40
50
60
70
0 50 100 150 200 250 300 350
E (kj/mol)
lnA
initial region
linear region
Figure 6.58. Kinetic compensation effect curve for the samples having 43%DOP
and stabilized with ZnSt2 and zeolite

110
y = 0,2818x - 13,588R
2 = 0,9981
y = 0,281x - 11,761R
2 = 0,9946
-10
10
30
50
70
90
110
0 50 100 150 200 250 300 350 400 450 500
E (kj/mol)
lnA
initail region
linear region
Figure 6.59. Kinetic compensation effect curve for the samples having 43%DOP
and stabilized with CaSt2 and zeolite
In this project, dehydrochlorination of PVC was investigated by spectroscopic and
thermal analysis techniques. Also PVC Thermomat was used in order to obtain the
information about the release of HCl from PVC plastigels and determine the kinetic
parameters of dehydrochlorination reaction of the samples.
When the induction periods of PVC, PVC plastigel having 33% DOP and PVC plastigel
43% DOP were compared; this period was reached to highest value 2.98h for PVC
palstigel having 33% DOP. This result indicated that the small amounts of DOP delayed
the induction time of PVC but higher amounts of it promoted the dehydrochlorination of
PVC. Since the higher the plasticizer content, the more flexible PVC film is, the
evolved HCl could diffuse easier in the film with high plasticizer content. Thus shorter
induction periods are observed for low plasticizer content. These are in good agreement
with those obtained by other investigators. (Minsker et al., 1987, Marcilla et al., 1995).
The initial and linear region rate constants of PVC plastigel having 33% DOP were
calculated as 1.06x10⁻⁶ and 3.64x10⁻⁵ min-1 at 140 °C whereas these rate constants were
evaluated as 1.62x10⁻⁴ and 6.60x10⁻⁴ min-1 at 140 °C by using the concentration of
formed polyene sequences in PVC (Baltacýoðlu et al.,1999). In this study, the rate of
dehydrochlorination and the rate constants were determined by the concentration of
111
evolved HCl gas from the sample but Baltacýoðlu et al., found the rate constants from
the concentration of formed double bonds in PVC. Although the total number of double
bonds of the polyene sequences was practically equal to the HCl molecules split off
(Patel et al., 1992), the rate constants that were calculated in this study and the rate
constants that were calculated by Baltacýoðlu et al., 1999 were not equal to each other.
The rate constants evaluated from the concentration of evolved HCl were lower than the
values calculated by the concentration of double bonds due to the slow diffusion of HCl
gas in PVC. Also all the formed HCl were not evolved from the sample to the
surroundings although double bonds were formed due to the dehydrochlorination of
PVC. Therefore the total number of double bonds of the polyene sequences was
different than the HCl molecules split off and released to the surroundings.

112
CHAPTER 7
CONCLUSIONS
In this project, PVC dehydrochlorination was studied in different respects. The
materials and the prepared PVC plastisols were characterized by spectroscopic and
thermal analysis techniques.
Optical microscopy on dynamic heating allowed the gelation and fusion behaviors also
the morphology of PVC plastisols. While unstabilized PVC plastisol had non porous
structure except the entrapped air bubbles due to the mixing of plastisol in the sample
PVC plastisols stabilized with ZnSt2/CaSt2 and zeolite had porous structure allowing
easy release of the eliminated HCl gas to the surroundings. The complete gelation of
PVC plastisols was observed at 185 °C.
The morphology of PVC plastigel films were studied by scanning electron microscope
(SEM). SEM with energy dispersive X-ray (EDX) analysis was used to obtain elemental
compositions in polymer and particle phases. The porous structure of PVC plastisols
when they were stabilized with metal soaps and zeolite were confirmed by SEM
micrographs. It was observed that for all samples, the weight % values of carbon (C) in
the range 70.06-81.20% at 140 °C were close to the weight % of carbon of the
plasticizer (DOP) 73.81% since DOP was not absorbed by PVC particles and it covered
the surface where EDX analysis was performed. This indicated the incomplete gelation
at low temperature. 1.00-1.76 % Zn and 0.60-1.11 % Ca were present respectively in
ZnSt2 and CaSt2 containing films in polymer phase showed a good dispersion of the
metal soaps were present.
The thermal stability of PVC plastigels in terms of color were obtained by heating them
in a static vacuum oven. It was observed that ZnSt2 was a good heat stabilizer for PVC
plastisol at the beginning of heating, but ZnCl2 formed at further heating times acted as
accelerator on dehydrochlorination reaction causing sudden blackening of the sample.
When zeolite was used as a primary stabilizer it prevented the early blackening of the
film.

113
UV spectroscopy gave information about the formation of the conjugated double bonds
by PVC dehydrochlorination. Concentrations of conjugated 6-n double bonds causing
the discoloration of the PVC were evaluated and the minimum concentration was
determined as 2.84x10⁻⁴ mol/l for the synergistic mixtures of 0.53 wt.% CaSt2 and 0.53
wt.%zeolite.
The evaporation of the plasticizer (DOP) was investigated from the FTIR band at 1600
cm-1 and the formation of organic acid from the reaction between metal soaps and HCl
produced by dehydrochlorination of PVC was investigated from the FTIR band at 1540
cm-1 for the gelled and heated samples. FTIR results indicated ZnSt2 was consumed at a
faster rate than CaSt2. For 90 min heating at 160 °C, the COO- peak of CaSt2 at 1540
cm-1 was higher in intensity than the COO- peak of ZnSt2. This showed that ZnCl2
formed from ZnSt2 accelerated dehydrochlorination of PVC.
Thermogravimetric analysis was studied to investigate the loss of mass caused by
elimination of HCl and the evaporation of the plasticizer. The sample stabilized with
1.05%Znst2 and 1.05%zeolite presented the highest onset temperature (204.4 °C). This
result indicated that these stabilizers prevented early dehydrochlorination when they
were used at low levels.
Measurements in PVC Thermomat gave information about the release of HCl from the
PVC plastigels to the surroundings. The rate of elimination of HCl was determined from
PVC plastigels. The induction and stability periods, and the kinetic parameters were
determined by using the rate of HCl elimination at 140 and 160 °C The induction time
of the sample having 2.11%zeolite was determined as 2.10h, whereas this period for the
unstabilized sample was 1.01h at 160 °C. The stabilizing effect of zeolite on the
increase in the induction period of the sample was considered the result from the
absorption of HCl which was thought to reduce the autocatalytic effect of HCl evolved
at the initial stages of dehydrochlorination. Since the induction time of the sample
having 0.53% ZnSt2 and 0.53% zeolite was 1.25 h the synergistic effect on thermal
stability was observed at low levels of them. The linear relation between the activation
energy and preexponential factor values were confirmed the compensation effect for the
dehydrochlorination reactions. Although the results of PVC Thermomat indicated the
evolving of HCl from the PVC plastigels due to the dehydrochlorination of PVC at 140
114
and 160 °C, any mass loss of the samples was not detected by thermogravimetric
analysis. The onset temperatures where the first mass loss was observed were higher
than 160 °C for the PVC plastigels on dynamic heating at 10 °C/min.
The synergistic effect of metal soaps and zeolite could not be observed at all levels of
stabilizers due to the heterogeneous reaction which involved gas, liquid, and solid
phases. Because PVC and zeolite were solid, metal soaps were liquid at 140 and 160 °C.
Since the metal soaps, zeolite and PVC were not in the same phase, they did not
substitute to labile chlorine atoms so the dehydrochlorination was initiated.
115
REFERENCES
• Alberty R.A., “Physical Chemistry” 7th Edition, John Wiley & Sons Inc., Canada,
1987.
• Arý Þ., Ýçten N. “The effects of thermal stabilizers on polyvinyl chloride”, Diploma
Project , Ege University, Department of Chemical Engineering, 1989.
• Arkýþ E. “Lead free PVC heat stabilizers”, Ph.D. Thesis, Ege University, 2000.
• Balköse D., Gökçel H.Ý., Göktepe S.E., “Synergism of Ca/Zn soaps in poly (vinyl
chloride) thermal stabilty”, European Polymer Journal, 37, 1191-1197, 2001.
• Baltacýoðlu H., “Thermal stabilization of PVC plastisols”, Ph.D. Thesis, Ege
University, Graduate School of Natural Applied Science, 1994 (in Turkish).
• Baltacýoðlu H., Balköse D., “Effect of zinc stearate and/or epoxidized soybean oil
on gelation and thermal stability of PVC-DOP plastigels”, Journal of Applied
Polymer Science, 74, 2488-2498, 1999.
• Braude E.A., Nachod F.C., “Determination of organic structures by physical
methods”, Academic Press, New York, 1955.
• Beltrán M., and Marcilla A., “Kinetic models for the thermal decomposition of PVC
plastisols”, Polymer Degradation and Stability, 55, 73-87, 1997.
• Beltrán M., and Marcilla A., “PVC plastisols decomposition by FT-IR
spectroscopy”, European Polymer Journal, 33, 1271-1280, 1997.
• Beltrán M., Garcia J.C., Marcilla A., “Infrared spectral changes in PVC and
plasticized PVC During Gelation and Fusion”, European Polymer Journal, 33, 453-
462, 1997.
116
• Benaniba M.T., Bensemra N.B., Gelbard G., “Stabilization of PVC by epoxidized
sunflower oil in the presence of zinc and calcium stearates”, Polymer Degradation
and Stability, 82, 245-249, 2002.
• Benaniba M.T., Bensemra N.B., Gelbard G., “Stabilizing effect of epoxidized
sunflower oil on the thermal degradation of poly (vinyl chloride)”, Polymer
Degradation and Stability, 74, 501-505, 2001.
• Benavides R., Castillo B.M., Castañeda A.O, López G.M, Arias G., “Different
thermo-oxidative degradation routes in poly(vinylchloride)”, Polymer Degradation
and Stability, 73, 417-423, 2001.
• Ertan A, Avºar H, Özkan F., “Chemical behaviours of natural zeolite in aqueous
medium”, XI. National Clay Symposium Proceeding Book, 705-712 pp (in
Turkish).
• Garcia J.C., Marcilla A., “Rheological study of the influence of the plasticizer
concentration in the gelation and fusion processes of PVC plastisols”, Polymer 39,
3507-3514, 1998.
• Gökçel H.Ý., Balköse D., Köktürk U., “Effects of mixed metal srearates on thermal
stability of rigid PVC”, European Polymer Journal, 35, 1501-1508, 1999.
• Göktepe S.E. “Increasing Thermal Stability of Poly (vinylchloride)by calcium-zinc
stabilizers”, M.S. Thesis, Ege University, Graduate School of Natural and Applied
Sciences, 1996.
• Gönen M., “Process development for metal soaps”, M.S. Thesis, Ýzmir Institute of
Technology, 2003.
• Grossman R.F., “Acid absorbers as PVC costabilizers”, Journal of Vinyl and
Additive Technology, 6, 4-6, 2000.
117
• Gupta M.C., Viswanath S.G. “Role of metal oxides in the thermal degradation of
polyvinyl chloride, Ind.. Eng. Chem. Res.37, American Chemical Society, 2707-
2712 pp.
• Jiménez A., Torre L.,Kenny J.M., “Thermal degradation of poly (vinyl chloride)
plastisols based on low-migration polymeric plasticizers”, Polymer Degradation and
Stability, 73 447-453, 2001.
• Marcilla A., and Beltrán M., “Effect of the plasticizer concentration and heating rate
on the thermal decomposition behaviour of PVC plastisols. Kinetic analysis”,
Polymer Degradation and Stability”, 60, 1-10, 1998.
• Marcilla A., and Beltrán M., Journal of Vinyl Additive Technology, 1 (1), 15, 1995.
• Metin D. “Interfacial enhancement of polypropylene –zeolite composites”, M.S.
Thesis, Ýzmir Institute of Technology, 2002.
• Minsker K.S., Abdullin M.I., Ableev R.I., Vysokmol, Soedin., Ser. A, 29 (4), 1987.
• Patel K., Velazquez H., Calderon H.S., Brown G.R., Journal of Applied Polymer
Science, 46, 179, 1992.
• Özmýhçý F., Balköse D., Ülkü S., “Natural zeolite polypropylene composite film
preparation and characterization”, Journal of Applied Polymer Science, 82, 2913-
2921.
• Shindo Y., Hirai T., “Dehydrohalogenation of polyvinylchloride in tetrohydrofuran
solution with alcoholic KOH”, Die Macromolekulare Chemie, 155, 1-16, 1972.
• Sondheimer F., Ben-Efraim D.A., Wolovsky R., J. Am. Chem. Soc. 83, 1961.
118
• Ulutan S., “Influence of additional thermal stabilizers on the reprocessing of
postconsumer poly (vinyl chloride) bottles”, Journal of Applied Polymer Science,
90, 3994-3999, 2003.
• Titow W.V., “PVC Technology”, 4th Edition, Elsevier Applied Science Publishers,
London and New York, 1985.
• Ven L.V.D., Gemert V.M.L.M., Batenburg L.F, Keern J.J, Gielgens L.H, Koster
T.P.M, Fischer H.R., “On the action of hydrotalcite-like clay materials as stabilizers
in polyvinychloride”, Applied Clay Science, 17, 25-34, 2000.
• Vrandeèiæ N.S., Klariæ I., Roje U., “Effect of Ca/Zn stabiliser on thermal
degradation of poly(vinyl chloride)/chlorinated polyethylene blends”, Polymer
Degradation and Stability, 74, 203-212, 2001.