syndemics prevention network goal-setting using system dynamics models: an example from adult...
TRANSCRIPT

Syndemics
Prevention Network
Goal-Setting Using System Dynamics Models:An Example from Adult Diabetes
DHHS Office of Disease Prevention and Health PromotionRockville, MD
January 28, 2005
Jack HomerHomer Consulting
Voorhees, New Jersey
Bobby MilsteinCenters for Disease Control and Prevention
Atlanta, Georgia
Syndemics
Prevention Network
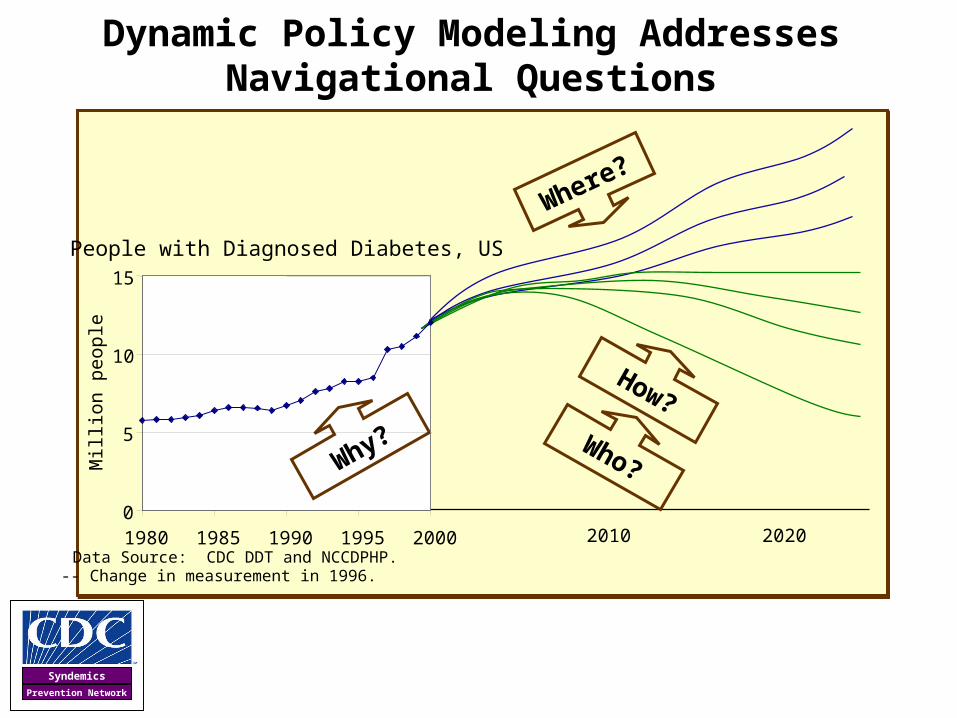
Dynamic Policy Modeling AddressesNavigational Questions
20202010
How?
Why?
Where?
Who?
People with Diagnosed Diabetes, US
0
5
10
15
1980 1985 1990 1995 2000
Mill
ion
peop
le
Data Source: CDC DDT and NCCDPHP. -- Change in measurement in 1996.
Syndemics
Prevention Network
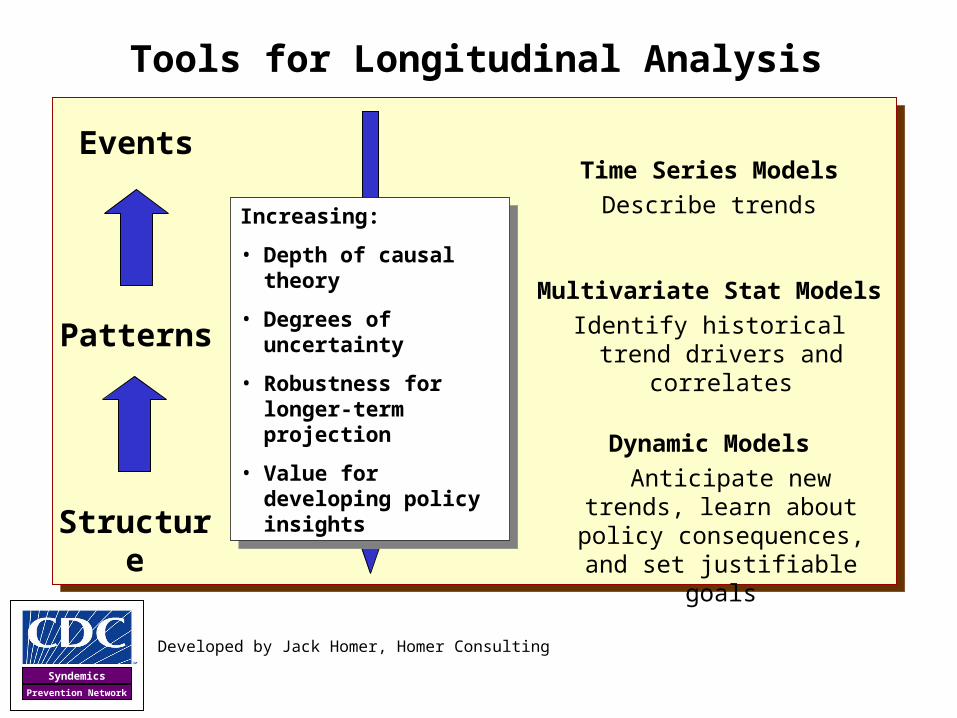
Time Series Models
Describe trends
Multivariate Stat Models
Identify historical trend drivers and correlates
Patterns
Structure
Events
Increasing:
• Depth of causal theory
• Degrees of uncertainty
• Robustness for longer-term projection
• Value for developing policy insights
Increasing:
• Depth of causal theory
• Degrees of uncertainty
• Robustness for longer-term projection
• Value for developing policy insights
Dynamic Models
Anticipate new trends, learn about policy consequences,
and set justifiable goals
Tools for Longitudinal Analysis
Developed by Jack Homer, Homer Consulting

Syndemics
Prevention Network
A Very Particular Distance“{System dynamics studies problems} from ‘a very particular distance',
not so close as to be concerned with the action of a single individual, but not so far away as to be ignorant of the internal pressures in the system.”
-- George Richardson
Richardson GP. Feedback thought in social science and systems theory. Philadelphia, PA: University of Pennsylvania Press, 1991.

Syndemics
Prevention Network
System Dynamics is Well-Suited for Studying Population Health Problems
History• Industrial Dynamics, Jay Forrester, MIT (1961)
• SD Society (1983),
• Health Policy Special Interest Group (2003)
Major Health Studies (since 1975)
• Disease epidemiology (e.g., heart disease, diabetes, HIV/AIDS, cervical cancer, dengue fever)
• Substance abuse epidemiology (e.g., heroin, cocaine, tobacco)
• Health care patient flows (e.g., hospital, extended care)
• Health care capacity and delivery (e.g., resource planning)
• Interactions between health capacity and disease epidemiology (e.g, neighborhood- and national-level analysis)
Current CDC Projects • Syndemics
(i.e., mutually reinforcing epidemics)
• Balancing upstream/downstream effort
• Diabetes in an era of rising obesity
• Fetal and infant health
• Obesity (lifecourse view)
• Adolescent health (lifestage view)

Syndemics
Prevention Network
System Dynamics Focuses on the Connection Between Behavior and Structure
System behavior is determined by feedback structure:including accumulation, delay, and nonlinear response
Problem Situation System Structure
8
6
4
2
00 2 4 6 8 10 12 14 16 18 20
Seconds elapsed
Ou
nc
es
Water Level Over Time
System Behavior Over Time

Syndemics
Prevention Network
Water Glass Model Diagram (Vensim™ software)
Current waterlevel
Water flow
“Stock”“Flow”
Faucet openness
Water flow atfull open
Maximum faucetopenness decision
“Policy Lever”
“Constant”Desired water level
Water level gap
“Delay”Perceived water
level gap
Time to perceivewater level gap

Syndemics
Prevention Network
Diabetes Policy Model - Structure
People withUndiagnosed,Uncomplicated
Diabetes
People withDiagnosed,
UncomplicatedDiabetes
People withDiagnosed,Complicated
Diabetes
People withUndiagnosedPrediabetes
People withDiagnosed
Prediabetes
People withNormal
GlycemicLevels
DiagnosingDiabetes
DiagnosingDiabetes
Dying fromComplications
DevelopingComplications
DiagnosingPreDiabetes
DiabetesOnset
Homer J, Jones A, Seville D, Essien J, Milstein B, Murphy D. The CDC diabetes system modeling project: developing a new tool for chronic disease prevention and control. 22nd International Conference of the System Dynamics Society; Oxford, England; 2004.
PrediabetesOnset
Recovering fromPrediabetes
Recovering fromPrediabetes
DiabetesOnset Developing
Complications Dying fromComplications
People withUndiagnosed,Complicated
Diabetes

Syndemics
Prevention Network
People withUndiagnosed,Uncomplicated
Diabetes
People withDiagnosed,
UncomplicatedDiabetes
People withDiagnosed,Complicated
Diabetes
DiagnosingUncomplicated
Diabetes
People withUndiagnosedPreDiabetes
People withDiagnosedPreDiabetes
DiagnosingPreDiabetes
People with
Undiagnosed,Complicated
Diabetes
DiagnosingComplicated
Diabetes
People withNormal
GlycemicLevels
Caloric Intake PhysicalActivity
MedicationAffordability
Ability to SelfMonitor
Adoption ofHealthy Lifestyle
ClinicalManagement of
PreDiabetes
Clinical Managementof Diagnosed
Diabetes
LivingConditions
PersonalCapacity
PreDiabetesControl
DiabetesControl
DiabetesDetection
PreDiabetesDetection
Access toPreventive Health
ServicesPreDiabetesTesting for Testing for
Diabetes
PreDiabetesOnset
Recovering fromPreDiabetes
Recovering fromPreDiabetes Diabetes
Onset
Dying fromComplications
DevelopingComplications
DiabetesOnset Developing
Complications Dying fromComplications
Obese Fraction ofthe Population
Risk forPreDiabetes
Diabetes Policy Model - StructureWhere is the Leverage for Reducing Disease Burden?
Syndemics
Prevention Network
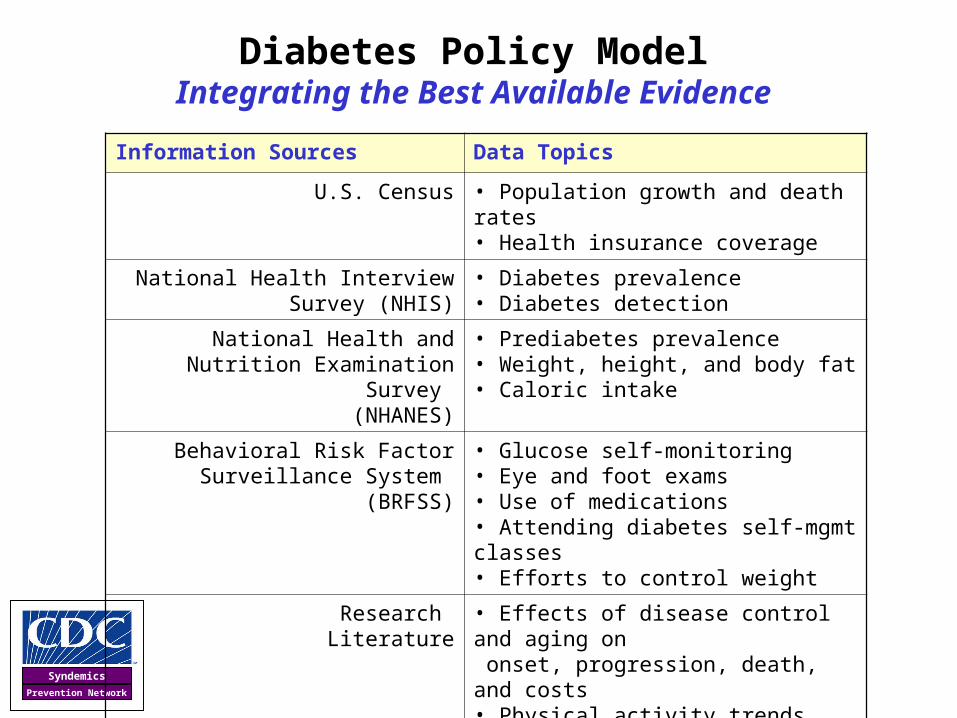
Diabetes Policy ModelIntegrating the Best Available Evidence
Information Sources Data Topics
U.S. Census • Population growth and death rates• Health insurance coverage
National Health Interview Survey (NHIS)
• Diabetes prevalence• Diabetes detection
National Health and Nutrition Examination Survey
(NHANES)
• Prediabetes prevalence• Weight, height, and body fat• Caloric intake
Behavioral Risk FactorSurveillance System
(BRFSS)
• Glucose self-monitoring• Eye and foot exams• Use of medications• Attending diabetes self-mgmt classes• Efforts to control weight
Research Literature
• Effects of disease control and aging on onset, progression, death, and costs• Physical activity trends• Direct and indirect costs of diabetes
Syndemics
Prevention Network
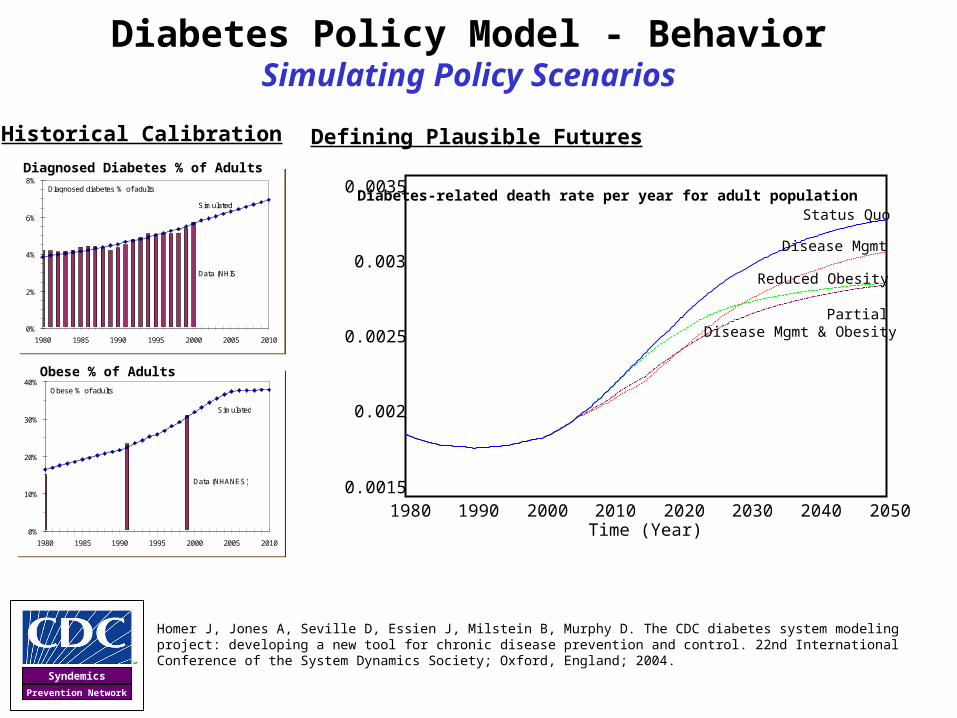
Diabetes Policy Model - BehaviorSimulating Policy Scenarios
Homer J, Jones A, Seville D, Essien J, Milstein B, Murphy D. The CDC diabetes system modeling project: developing a new tool for chronic disease prevention and control. 22nd International Conference of the System Dynamics Society; Oxford, England; 2004.
0%
2%
4%
6%
8%
1980 1985 1990 1995 2000 2005 2010
Diagnosed diabetes % of adults
Data (NHIS)
Simulated
0%
2%
4%
6%
8%
1980 1985 1990 1995 2000 2005 2010
Diagnosed diabetes % of adults
Data (NHIS)
Simulated
0%
10%
20%
30%
40%
1980 1985 1990 1995 2000 2005 2010
Obese % of adults
Data (NHANES)
Simulated
0%
10%
20%
30%
40%
1980 1985 1990 1995 2000 2005 2010
Obese % of adults
Data (NHANES)
Simulated
Historical Calibration
Diagnosed Diabetes % of Adults
Obese % of Adults
Defining Plausible Futures
0.0035
0.003
0.0025
0.002
0.00151980 1990 2000 2010 2020 2030 2040 2050
Time (Year)
Diabetes-related death rate per year for adult population Status Quo
Disease Mgmt
Reduced Obesity
Partial Disease Mgmt & Obesity

Syndemics
Prevention Network
HP 2010 Diabetes Objectives
BaselineHP 2010 Target
Percent Change
Reduce Diabetes–related Deaths Among Diagnosed
(5-6)
8.8 per 1,000
7.8 -11%
Increase Diabetes Diagnosis (5-4)
68% 80% +18%
Reduce New Cases of Diabetes (5-2)
3.5per 1,000
2.5 -29%
Reduce Prevalence of Diagnosed Diabetes
(5-3)
40 per 1,000
25 -38%
U.S. Department of Health and Human Services. Healthy People 2010. Washington DC: Office of Disease Prevention and Health Promotion, U.S. Department of Health and Human Services; 2000. http://www.healthypeople.gov/Document/HTML/Volume1/05Diabetes.htm

Syndemics
Prevention Network
Connecting the Objectives: System Physics
It is impossible for any policy to reduce prevalence
38% by 2010!
People withUndiagnosed
Diabetes
People withDiagnosedDiabetes Dying from Diabetes
Complications
DiagnosedOnset
InitialOnset
People withNormal
GlycemicLevels
As would stepped-up detection effort
Reduced death wouldadd further to prevalence
With a diagnosed onset flow of
1.1 mill/yr
And a death flow of 0.5 mill/yr
(4%/yr rate)
The targeted 29% reduction in diagnosed onset can only
slow the growth in prevalence

Syndemics
Prevention Network
20
30
40
50
60
70
1980 1985 1990 1995 2000 2005 2010People
with
dia
gnosed d
iabete
s p
er
1,0
00 a
dult
popula
tion
Simulated
Status Quo
Meet Detection Objective (5-4)
Meet Onset Objective (5-2)
HP 2010 Objective (5-3)
HP 2000 Objective
Setting Realistic ExpectationsHistory, HP Objectives, and Simulated Futures
Reported
A
B
C
D
E
F
G
H
I

Syndemics
Prevention Network
Possible Roles for SD in Public Health
SD is especially well-suited for studying…
• Individual diseases and risk factorsExamining momentum and setting justifiable goals
• Life course dynamics Following health trajectories across life stages
• Mutually reinforcing afflictions (syndemics)Exploring interactions among related afflictions, adverse living conditions, and the public’s capacity to address them both
• Capacities of the health protection system Understanding how ambitious health ventures may be configured without overwhelming/depleting capacity--perhaps even strengthening it
• Value trade-offs Analyzing phenomena like the imbalance of upstream-downstream effort, growth of the uninsured, rising costs, declining quality, entrenched inequalities
• Organizational management Linking balanced scorecards to a dynamic understanding of processes
• Group model building and scenario planningBringing more structure, evidence, and insight to public dialogue and judgment