symbolic representation of long...
TRANSCRIPT

Symbolic Representation of Long Time-Series
Georges Hebrail1 and Bernard Hugueney1
EDF Research and Developement Division,1 av. du General de Gaulle,
92141 Clamart Cedex [email protected]@edf.fr
Abstract. Huge amounts of data in the form of time-series are availabletoday. Getting useful information from them is hard and visualizationon a chart quickly finds its limits. We try to go a step further, provid-ing the end-user with a symbolic representation of time-series. We firstdefine a general symbolic representation of time-series. It can be muchmore synthetic than the original data if it is possible to find long relevantand frequent episods in series. Clustering is applied to proper subsets ofthe time-series in order to find frequently occuring shapes. Some episodsof the time-series are then connected to a symbol representing a clus-ter. In this process we aim at learning from data simultaneously episodboundaries and frequent patterns appearing in the time series. This is anew approach compared to standard ones where either known patternsare recognized as episods in time series, or specified episods are describedby pre-defined qualifying symbols. As in standard approaches, attributesare also added to enrich the symbolic representation. We illustrate theseconcepts both with a trivial and a real example.
New capabilities of the resulting symbolic representation and their usesare described. In particular, we show that this symbolic representationallows editing to be performed on time series at the symbolic level.

1 Introduction
The ever increasing use of data acquisition systems connected to computers leadsto an overwhelming amount of data. They are useless if we cannot interpretthem. That is why the computer should not only make them available, but alsounderstandable. Knowing that human mind handles abstractions that can berepresented as symbols, we have worked on building a symbolic representationof such numerical data. The resulting representation is much more concise if itis possible to find long relevant and frequent episods in the series and associatethem with symbols. Fig.1 shows a one-year electric power load curve consistingof 8760 hourly ticks. Fig.2 shows the corresponding symbolic representation of26 elements from an alphabet of 3 symbols that was built with our approach.
0
0.5
1
1.5
2
0 1000 2000 3000 4000 5000 6000 7000 8000 9000
"../plot_ima380.txt"
Figure 1: One year of hourly power consumption from an industrial process.
Figure 2: Computed symbolic representation of the previous data.
The idea of extracting meaningful information from a flow of numerical datais related to signal compression and pattern recognition. Previous work suchas [?] has already taken this symbolic approach to help understanding of time-series, but with some a-priori semantics leading to a restricted set of symbols.The main originality of the work presented here is that “data-driven” symbolsare built in order to match as closely as possible the underlying structure, with-out the need for external parameters. As far as data analysis is concerned, [?]explored a way to achieve discovery of rules for sequences in time series. [?] stud-ied similarities between series, based on similarities in their inner sequences. [?]finds such similarities regardless of some distortions. But most of the sequencemining and association rule discovery algorithms have been elaborated for seriesalready in a symbolic form[?]. As an added benefit to our work, these tools canbe used on our resulting symbolic representation.
In section 2, we first define the general symbolic representation of time serieswe consider. In section 3, we describe the construction of such a symbolic rep-

resentation in a real-world applications related to electric power consumption.In section 4, we justify the construction of symbolic representations by givingexamples of their usefulness within the context of our real-world application. Insection 5, we finally show some possible generalizations and improvements weplan to develop in close future work.
2 Definition and Interpretation of a Time SeriesSymbolic Representation
We first define a general framework for symbolic representation. Our definitionhas to be broad enough to be used on a wide range of time series. Contraryto previous numeric to symbolic conversions studies, we do not want to haveany a-priori ’built-in’ into the framework. In the abundant pattern-recognitionlitterature, such as in speech recognition, one knows what symbols to look for(ie. phonems). On the other hand, we want to be able to mine time-series wereno such knowledge is available. The problem will be to guess from raw data boththe episods and the alphabet of symbols used in the symbolic representation.
2.1 Definition and Example
The goal of the processing we do is to derive a more compact and expressiveview of large time series thanks to a symbolic representation preserving as muchinformation as possible. Time being important in such data, we keep chronolog-ical references. The result is a sequence of symbols, where each symbol is relatedto an episod of the original data. The general symbolic representation S is buildfrom time series X using an intermediate set of episods C with the followingdefinitions :
– Time domain where the series take place :T = [t0, tn−1] with t0 and tn−1 first and last instants we consider.
– Variation numerical domain : D– Original data, set of n pairs (time stamp, value) ordered with increasing time
:X = {xi /xi = (ti, yi) , i ∈ [0, n[ , ti ∈ T, yi ∈ D}
– Set of episods :
E ={
episodi = (starti, stopi)/
(starti, stopi) ∈ T 2
starti < stopi
}
– Alphabet of symbols : Λ– Attribute domains : A1, · · · , Ap– Symbolic representation:
S = {si /si = (λi, episodi,ai)}
with:
episodi ∈ Eλi = Symbol(episodi)
ai = Attributes(episodi)

– Symbol is an application: E → Λ that maps an episod to the correspondingsymbol λ from the alphabet Λ.
– Attributes is an application:
E → A = A1 ×A2 × · · · ×Ap
that maps an episod to p relevant attributes values we want to part of thesymbolic representation.
So with previous notations, we can formally define the symbolic representationas :
SR = 〈Symbol, Episods,Attributes〉
This framework is intentionaly defined to have very few restrictions on E.We explicitly allow :
– Episods that do not start or stop on exact ticks from the original time series.– Overlaps between episods.– Gaps between episods.
Such symbolic representations can be very simple, trivially computed, and yetvery useful as shown by the following example.
Consider a large database for monitoring a process that is based on theelectric power consumption of one large device. The underlying interesting modelconsists of two states: high and low activity depending on whether the largedevice is switched on or off. Actually, the large device is not alone and someother smaller ones introduce noise in the time-series.
-2
0
2
4
6
8
10
12
14
0 500 1000 1500 2000 2500
"power consumption"
Figure 3: Simple two-states electric consumption example. One tick everyminute, starting on Monday.
Knowing the two state model, an appropriate drastic tranformation could beto make scalar quantization on the two consumption levels.
A symbolic representation can be built with one symbol for each plateau, withΛ = {>,⊥}. Attributes can describe days of the week during which the episodoccurs (M → Monday, T → Tuesday). For instance, (⊥, (100, 149) , {M}) rep-resents a low level (⊥) occuring between ticks 100 and 149, on Monday (M).
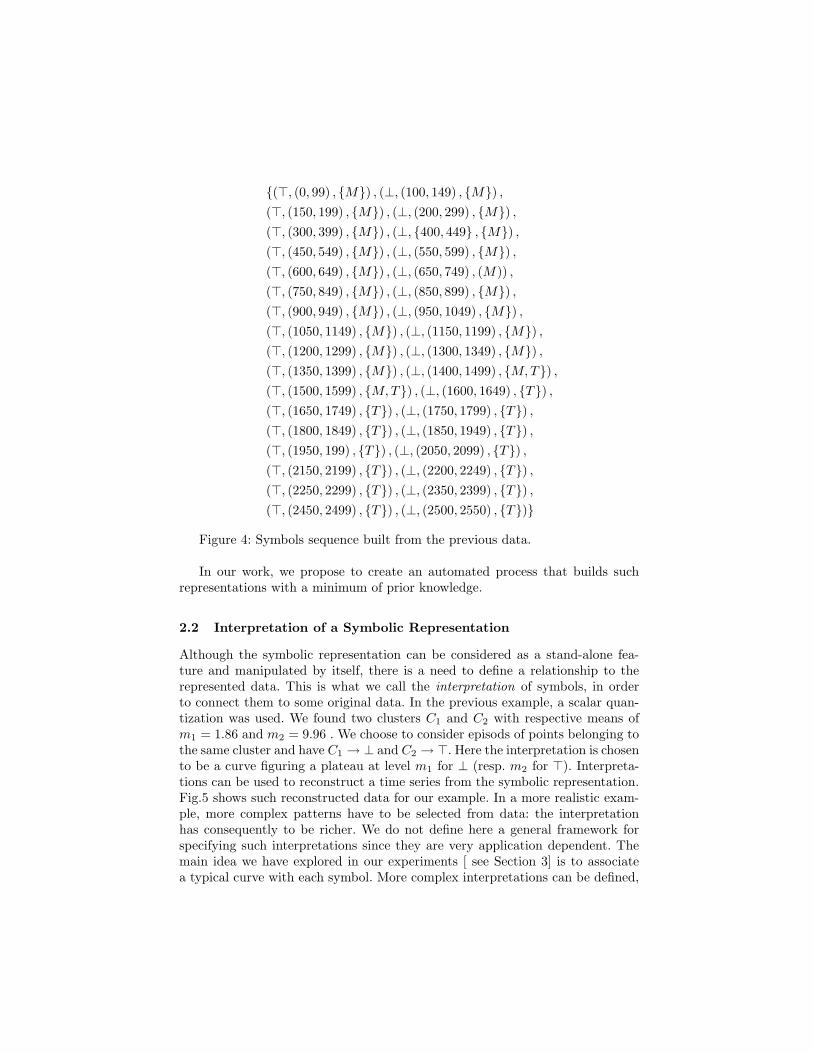
{(>, (0, 99) , {M}) , (⊥, (100, 149) , {M}) ,
(>, (150, 199) , {M}) , (⊥, (200, 299) , {M}) ,
(>, (300, 399) , {M}) , (⊥, {400, 449} , {M}) ,
(>, (450, 549) , {M}) , (⊥, (550, 599) , {M}) ,
(>, (600, 649) , {M}) , (⊥, (650, 749) , (M)) ,
(>, (750, 849) , {M}) , (⊥, (850, 899) , {M}) ,
(>, (900, 949) , {M}) , (⊥, (950, 1049) , {M}) ,(>, (1050, 1149) , {M}) , (⊥, (1150, 1199) , {M}) ,
(>, (1200, 1299) , {M}) , (⊥, (1300, 1349) , {M}) ,
(>, (1350, 1399) , {M}) , (⊥, (1400, 1499) , {M, T}) ,
(>, (1500, 1599) , {M, T}) , (⊥, (1600, 1649) , {T}) ,
(>, (1650, 1749) , {T}) , (⊥, (1750, 1799) , {T}) ,
(>, (1800, 1849) , {T}) , (⊥, (1850, 1949) , {T}) ,(>, (1950, 199) , {T}) , (⊥, (2050, 2099) , {T}) ,(>, (2150, 2199) , {T}) , (⊥, (2200, 2249) , {T}) ,
(>, (2250, 2299) , {T}) , (⊥, (2350, 2399) , {T}) ,
(>, (2450, 2499) , {T}) , (⊥, (2500, 2550) , {T})}
Figure 4: Symbols sequence built from the previous data.
In our work, we propose to create an automated process that builds suchrepresentations with a minimum of prior knowledge.
2.2 Interpretation of a Symbolic Representation
Although the symbolic representation can be considered as a stand-alone fea-ture and manipulated by itself, there is a need to define a relationship to therepresented data. This is what we call the interpretation of symbols, in orderto connect them to some original data. In the previous example, a scalar quan-tization was used. We found two clusters C1 and C2 with respective means ofm1 = 1.86 and m2 = 9.96 . We choose to consider episods of points belonging tothe same cluster and have C1 → ⊥ and C2 → >. Here the interpretation is chosento be a curve figuring a plateau at level m1 for ⊥ (resp. m2 for >). Interpreta-tions can be used to reconstruct a time series from the symbolic representation.Fig.5 shows such reconstructed data for our example. In a more realistic exam-ple, more complex patterns have to be selected from data: the interpretationhas consequently to be richer. We do not define here a general framework forspecifying such interpretations since they are very application dependent. Themain idea we have explored in our experiments [ see Section 3] is to associatea typical curve with each symbol. More complex interpretations can be defined,

like a probability distribution of curves in the case we want to represent somenoise associated with the typical curve.
1
2
3
4
5
6
7
8
9
10
0 500 1000 1500 2000 2500
"interpretation"
Figure 5: The reconstructed data from the two-states example.
3 First Steps with a Real-world Example
We have started to work with a restricted definition of symbolic representations.Symbols are only associated with consecutive non-overlapping episods of
equal length. More formally, what we call regular episods are defined as follows:
– E is an ordered set with the constraints :
episodi < episodj ⇔ starti < startj
– all episods are of same length L :
∀i, (stopi − starti) = L
– episodi+1 begins exactly at the end of episodi :
∀i, starti+1 = stopi
Instead of simply storing a level as in the previous example, interpretationwill here be defined by a reference to a prototype of episods in a codebook ofinteresting shapes. The codebook will be automatically built from a clusteringof the episods. As in [?], we have used Kohonen Self Organizing Maps as anefficient and readable way of clustering.
3.1 Episod Extraction
With regular sequences, only two parameters have to be adjusted: length ofepisods (L), and offset at which to start from the beginning of the available timeseries (start1).
Given that we should match the underlying signal’s period (there was noperiodic noise that we were aware of) we used a simple frequency analysis (FastFourier Tranform) to detect major periods. Maximum was found for a 13.93 daysperiod. Time related a-priori knowledge allows us to round to nearest relevanttime unit ( second, minute, hour, day or week). A 14 days episod length wasselected. Parameter start1 (offset of the first window in the series) is somewhat

tricky to set : resulting symbols heavily depend on it. In one of our applications[see Section 4.2], the symbolic representation of the time-series is edited: wedecided to adjust the offset in order to have episod bounds where the series arethe most stable on average. To do so, we computed the sum of local standarddeviations at episod edges for every offset (start1∈[0...L[) and then chose thestart1 to minimize this sum.
3.2 Episod Clustering
Self Organizing Map (SOM)[?] is a neural network based method that has beensucessfully used for unsupervised clustering of high-dimensional input data. Ithas been applied in many fields, including speech recognition [?]. The net-work makes a non-linear mapping on a low-dimensional array (typically two-dimensional) that allows a better understanding of the clustering result. It isvery helpful when results are to be validated by the end-user.
We decided to use SOM as in [?] knowing that good results are obtainedwith a small computation time, thanks to an appropriate initialization withPrincipal Component Analysis. In our experiments, we have adjusted the numberof clusters by a manual end-user validation based on interactive visualization ofthe map. But standard criteria exist to automate or suggest good choices.
3.3 Adding Attributes
An interesting feature of the symbolic representation is that attributes can beassociated with episods. External data can be added, but even without suchdata, a-priori knowledge concerning time-related information of the series canbe used to enrich the representation. Each clock tick t can be associated withvalues for some temporal attributes (hour, night or day, day of the week, month,season, etc...). An episod can then be given values for thoses attributes: if allpoints in an episod have the same value for an attribute, then the episod isassociated this value, otherwise the attribute is set to invalid. If an episod fitsentirely in a day for example, it is associated with that day.
aij is the value of attribute aj for episodi
aij = aj (episodi)
={
v if ∀t ∈ episodi, aj (t) = vinvalid
aj : attributej∈{day night,day of week,day of year,week weekend,month,season}with:aday−night∈{invalid, day, night}aday−of−week∈{invalid, monday, tuesday, wednesday, thursday, friday, satur-
day, sunday}aday−of−year∈[−1...365], -1: invalid otherwise number of days since 01/01.aweek−weekend∈{invalid, week, week end}
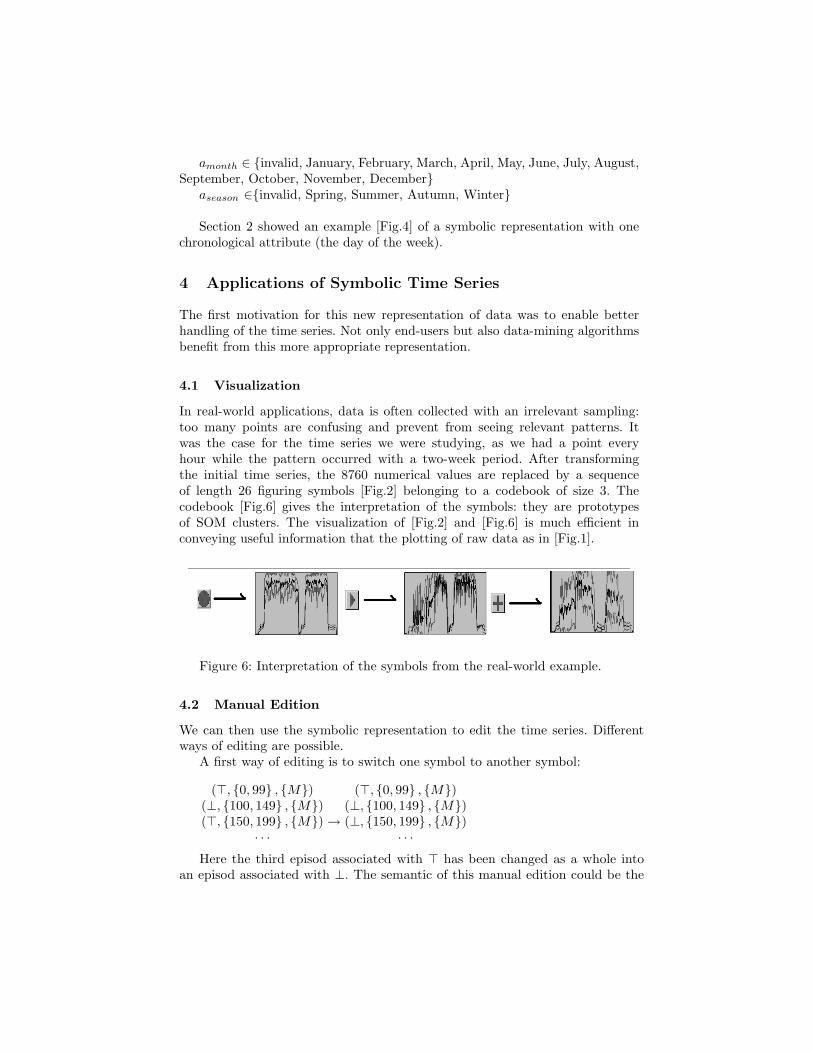
amonth ∈ {invalid, January, February, March, April, May, June, July, August,September, October, November, December}
aseason ∈{invalid, Spring, Summer, Autumn, Winter}
Section 2 showed an example [Fig.4] of a symbolic representation with onechronological attribute (the day of the week).
4 Applications of Symbolic Time Series
The first motivation for this new representation of data was to enable betterhandling of the time series. Not only end-users but also data-mining algorithmsbenefit from this more appropriate representation.
4.1 Visualization
In real-world applications, data is often collected with an irrelevant sampling:too many points are confusing and prevent from seeing relevant patterns. Itwas the case for the time series we were studying, as we had a point everyhour while the pattern occurred with a two-week period. After transformingthe initial time series, the 8760 numerical values are replaced by a sequenceof length 26 figuring symbols [Fig.2] belonging to a codebook of size 3. Thecodebook [Fig.6] gives the interpretation of the symbols: they are prototypesof SOM clusters. The visualization of [Fig.2] and [Fig.6] is much efficient inconveying useful information that the plotting of raw data as in [Fig.1].
Figure 6: Interpretation of the symbols from the real-world example.
4.2 Manual Edition
We can then use the symbolic representation to edit the time series. Differentways of editing are possible.
A first way of editing is to switch one symbol to another symbol:
(>, {0, 99} , {M}) (>, {0, 99} , {M})(⊥, {100, 149} , {M}) (⊥, {100, 149} , {M})(>, {150, 199} , {M}) → (⊥, {150, 199} , {M})
· · · · · ·Here the third episod associated with > has been changed as a whole into
an episod associated with ⊥. The semantic of this manual edition could be the

creation of a new schedule. If we succeeded in having meaningful episods, thenwe can get meaningful edition of a whole set of points. Of course the effectivenessof the edition is closely related to the quality of the symbolic representation.
A second way of editing is to change the interpretation of one or severalsymbols. If a symbol is associated with an interpretation related to a knownfactor, (i.e > is related to the power consumption from a known device) then wecan apply any change (for instance higher or lower consumption of the device)to the whole series at a time.
Once the symbolic representation has been edited, it is then possible to recon-struct a time series from the modified symbolic representation: for each symbol,we use the interpretation to build the series. In the first example [Section 2],we had ⊥ → 1.86 and > → 9.96. If we decide that now > → 15, the wholereconstructed time series will reflect the change of interpretation.
A combination of the two types of editing leads to the reconstructed resultof Fig 7.
0
2
4
6
8
10
12
14
16
0 500 1000 1500 2000 2500
"representation of edited sequence"
Figure 7: Reconstructed data after symbolic editions on the two-state exam-ple.
4.3 Mining for Sequential Patterns
When the number of symbols is large, and the sequence is long, visualizationbecomes ineffective to understand time series, even from a symbolic represen-tation. Many algorithms have been developped by the symbolic AI communityto retrieve more information from symbolic data. Agrawal et al. have developedalgorithms (see [?] and [?]) to detect regular patterns in sequences. Should wedecide for example to use one week long episods in our real-world example, wethen have the following representation.
Figure 8: Symbolic representation of the real-world example with one-weekepisods.
Of course, in this example, one cannot fail to see the two-symbols pattern◦ then., but with numerous series, or a much longer one it would be very helpfulto use automated pattern mining.
5 Conclusion and Further Work
We have proposed a framework for defining symbolic representations of timeseries. In our experiments, we have built symbolic representations which wereproved to be valuable to end-users. They were also eager to use symbolic editionfeatures to help them in their simulations, as the amount of data made standardtools very tedious to use. Ease of use enables them to work on many more timeseries than they can currently afford. This research is real-world data driven,so new areas are considered as the needs arise. We present below two areas ofinvestigation for further work.
5.1 Less Restricted Symbolic Representation
The first thing will be to release the constraint of non-overlapping adjacentepisods. Episods will be data-driven to adjust local information in the data.We can start with a simple codebook constructed as explained above, or usea-priori knowledge to decide some shapes to look for, and adjust episods tobetter match the patterns. For now episods must occur on exact periods, but wecan search for the correct beginning of the episods to match better an intendedinterpretation. For example, applied to fault detection, we can force episods tostart when the signal entering an abnormal pattern : faults are not expectedto occur on a periodic basis. Episods of different length can be defined, andthe symbolic description does not require all symbols to be related to events ofthe same duration. Of course interpretation of overlapping and/or incompletesymbolic representation will be more difficult.
5.2 More than one Time Series
In our applications, we often have to deal with several time series which arerelated. A single codebook can be built for different series: they become compa-rable and multiple time series data mining can be performed. We will have tofind how to search relevant episods in different time series.