symbolic data analysis of complex data: - lri
TRANSCRIPT
Symbolic Data AnalysisOf Complex Data:
Edwin DidayCEREMADE Paris Dauphine University
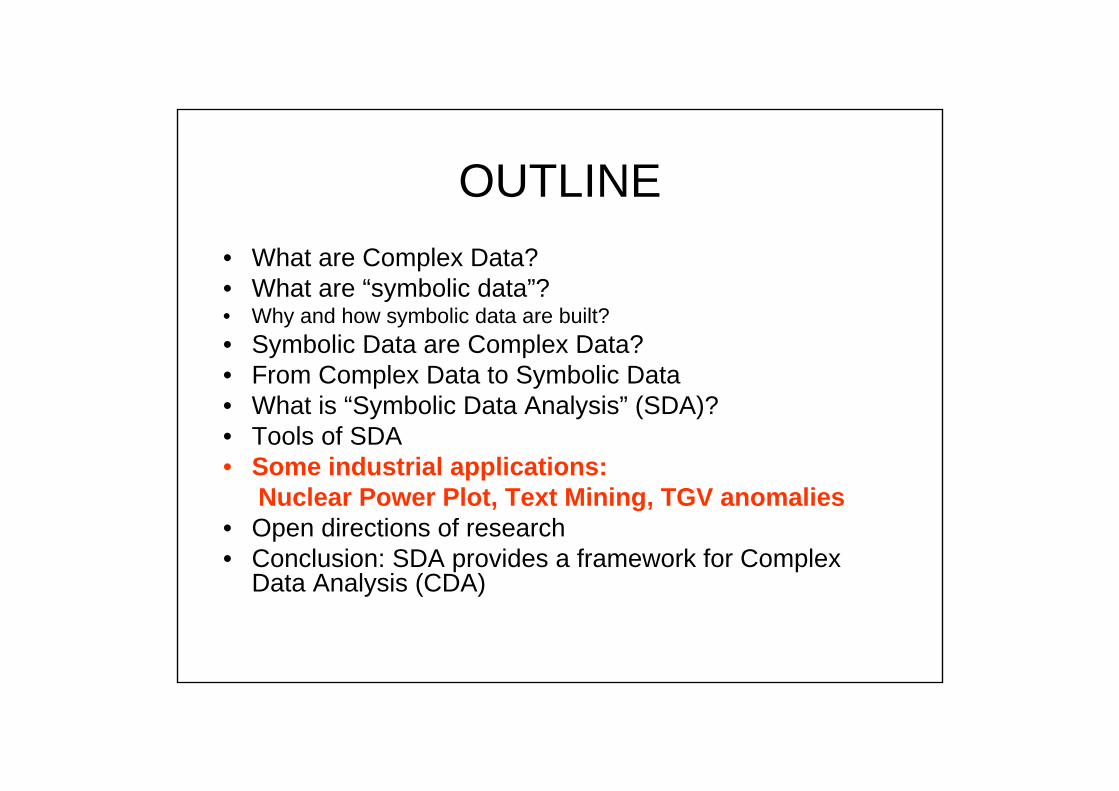
OUTLINE• What are Complex Data?• What are “symbolic data”?• Why and how symbolic data are built?• Symbolic Data are Complex Data? • From Complex Data to Symbolic Data• What is “Symbolic Data Analysis” (SDA)?• Tools of SDA• Some industrial applications:
Nuclear Power Plot, Text Mining, TGV on a bridge, Funds
• Open directions of research• Conclusion: SDA provides a framework for Complex
Data Analysis (CDA)
OUTLINE• What are Complex Data?• What are “symbolic data”?• How “Symbolic Data” are built?• Symbolic Data are Complex Data? • From Complex Data to Symbolic Data• What is “Symbolic Data Analysis” (SDA)?• Open directions of research • SDA gives a framework for Complex Data
Analysis (CDA)
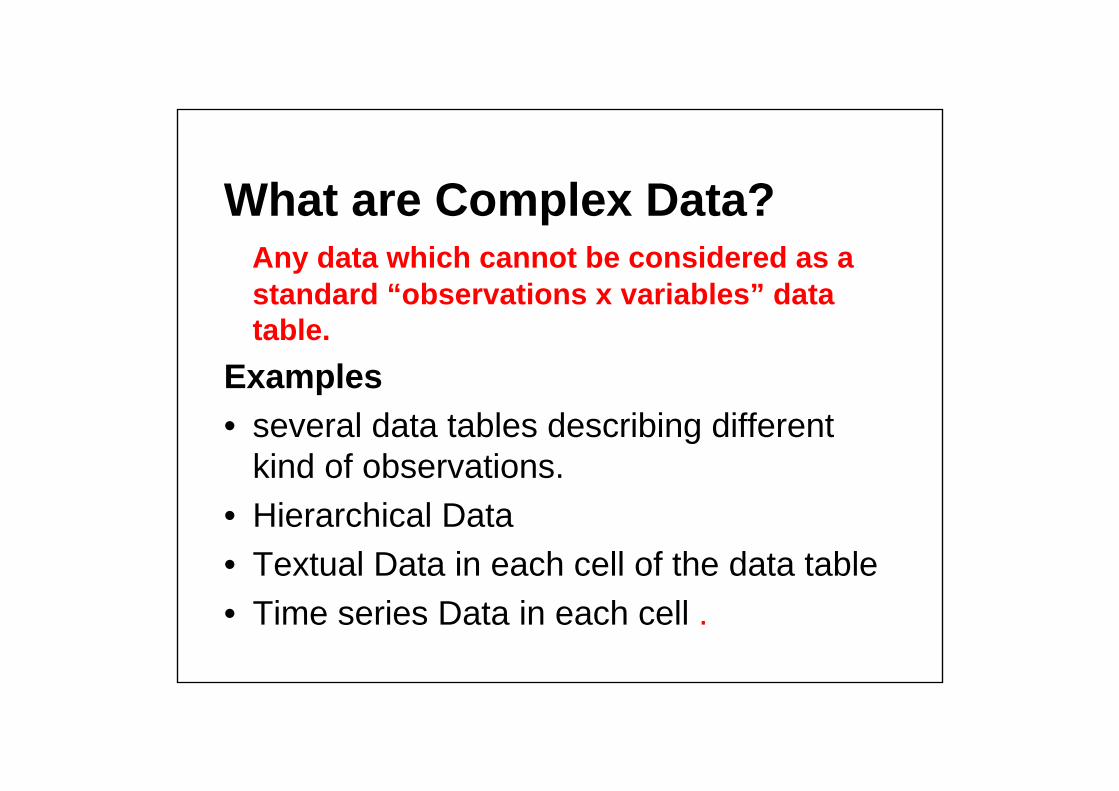
What are Complex Data?Any data which cannot be considered as a standard “observations x variables” data table.
Examples• several data tables describing different
kind of observations.• Hierarchical Data• Textual Data in each cell of the data table• Time series Data in each cell .

OUTLINE• What are Complex Data?• What are “symbolic data”?• How “Symbolic Data” are built?• Symbolic Data are Complex Data? • From Complex Data to Symbolic Data• What is “Symbolic Data Analysis” (SDA)?• Open directions of research • SDA gives a framework for Complex Data
Analysis (CDA)

What are “symbolic data”?Any data taking care on the variationinside classes of standard observation.
• each cell of the data table can contain:• A number, a category, an interval, a
sequence of categorical values, a sequence of weighted values , a Bar Chart, a histogram, a distribution, …
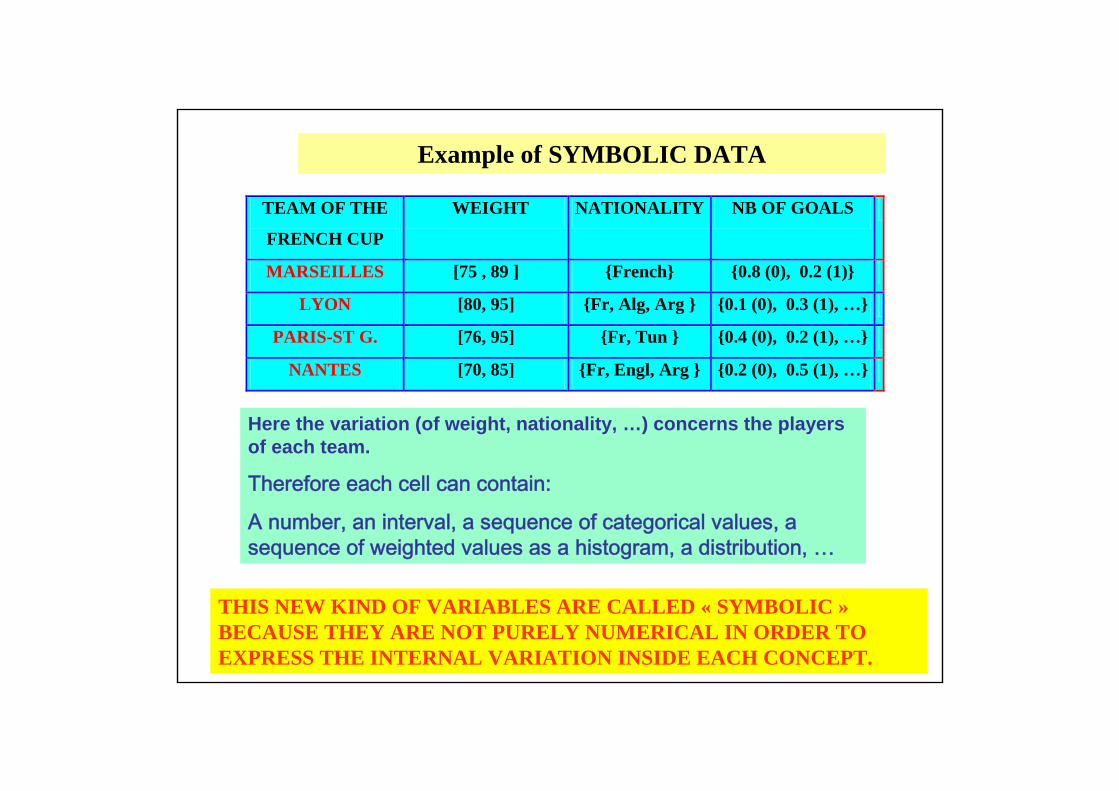
Example of SYMBOLIC DATA
TEAM OF THE
FRENCH CUP
WEIGHT NATIONALITY NB OF GOALS
MARSEILLES [75 , 89 ] {French} {0.8 (0), 0.2 (1)}
LYON [80, 95] {Fr, Alg, Arg } {0.1 (0), 0.3 (1), …}
PARIS-ST G. [76, 95] {Fr, Tun } {0.4 (0), 0.2 (1), …}
NANTES [70, 85] {Fr, Engl, Arg } {0.2 (0), 0.5 (1), …}
Here the variation (of weight, nationality, …) concerns the players of each team.
Therefore each cell can contain:
A number, an interval, a sequence of categorical values, a sequence of weighted values as a histogram, a distribution, …
THIS NEW KIND OF VARIABLES ARE CALLED « SYMBOLIC »BECAUSE THEY ARE NOT PURELY NUMERICAL IN ORDER TO EXPRESS THE INTERNAL VARIATION INSIDE EACH CONCEPT.
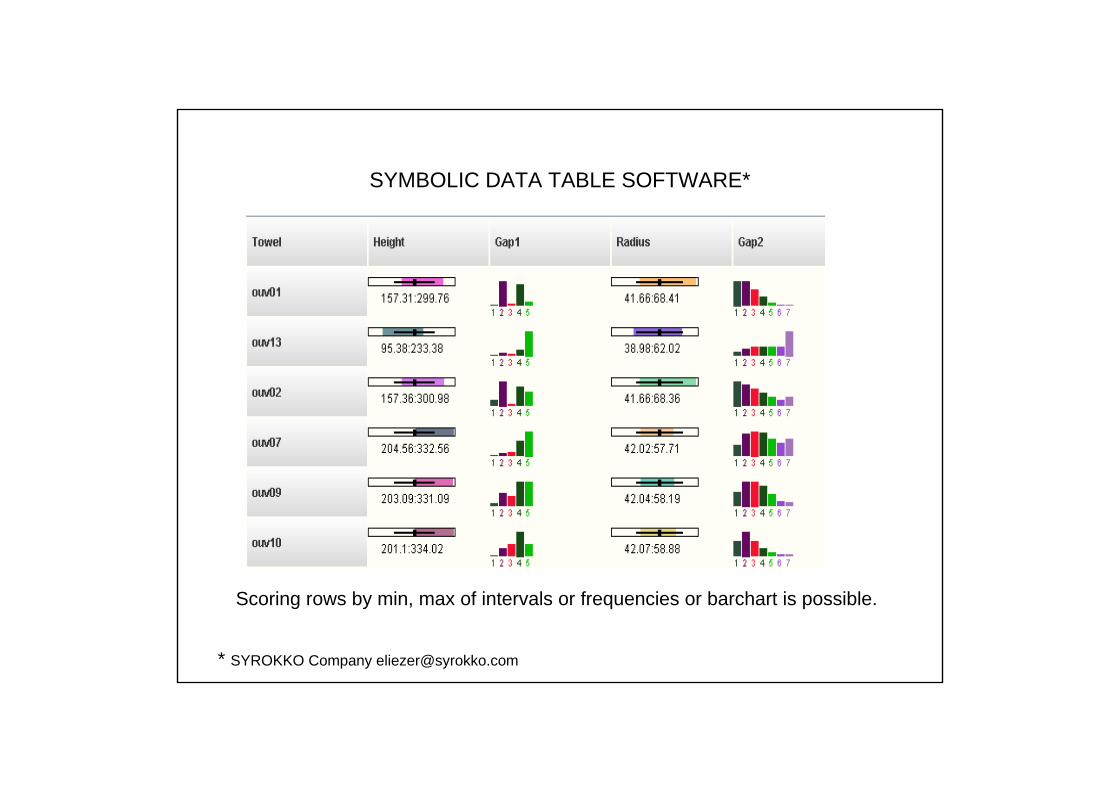
SYMBOLIC DATA TABLE SOFTWARE*
* SYROKKO Company [email protected]
Scoring rows by min, max of intervals or frequencies or barchart is possible.
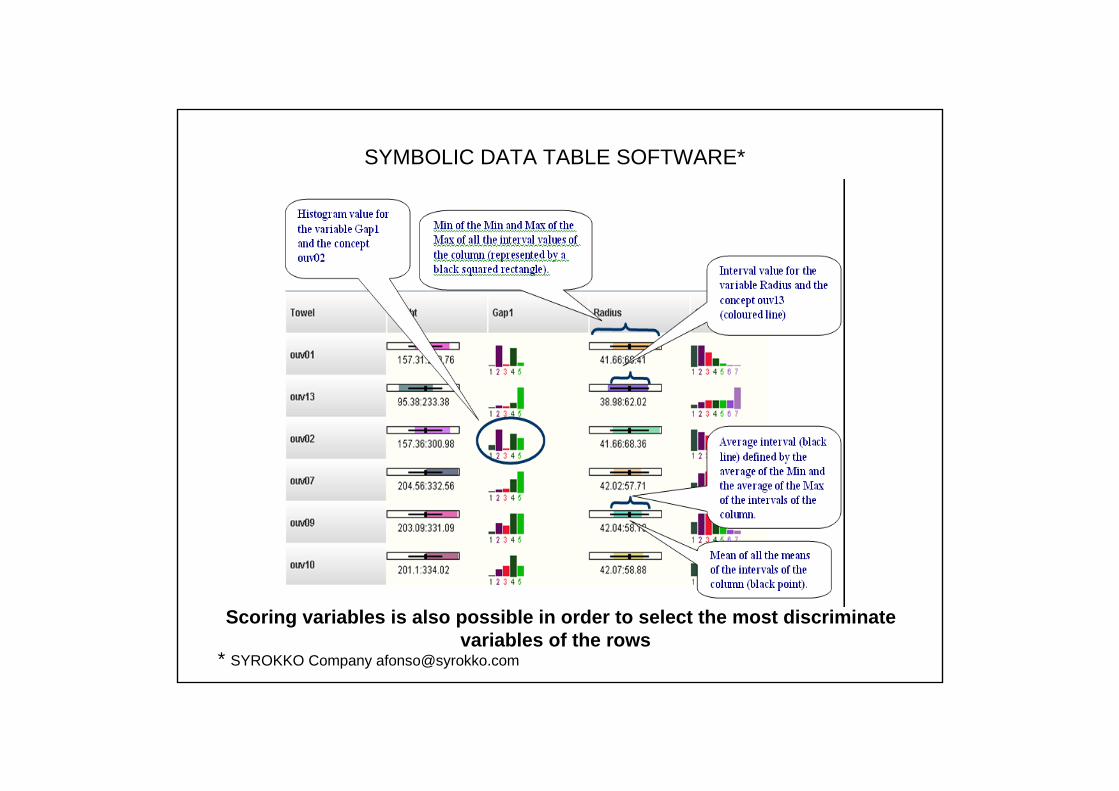
Scoring variables is also possible in order to select the most discriminate variables of the rows
SYMBOLIC DATA TABLE SOFTWARE*
* SYROKKO Company [email protected]

OUTLINE
• What are Complex Data?• What are “symbolic data”?• When and how symbolic data are built?• Symbolic Data are Complex Data?• Complex Data are Symbolic Data after
transformation ?• What is “Symbolic Data Analysis” (SDA)?• SDA gives a framework for Complex Data
Analysis (CDA)?• Open directions of research.
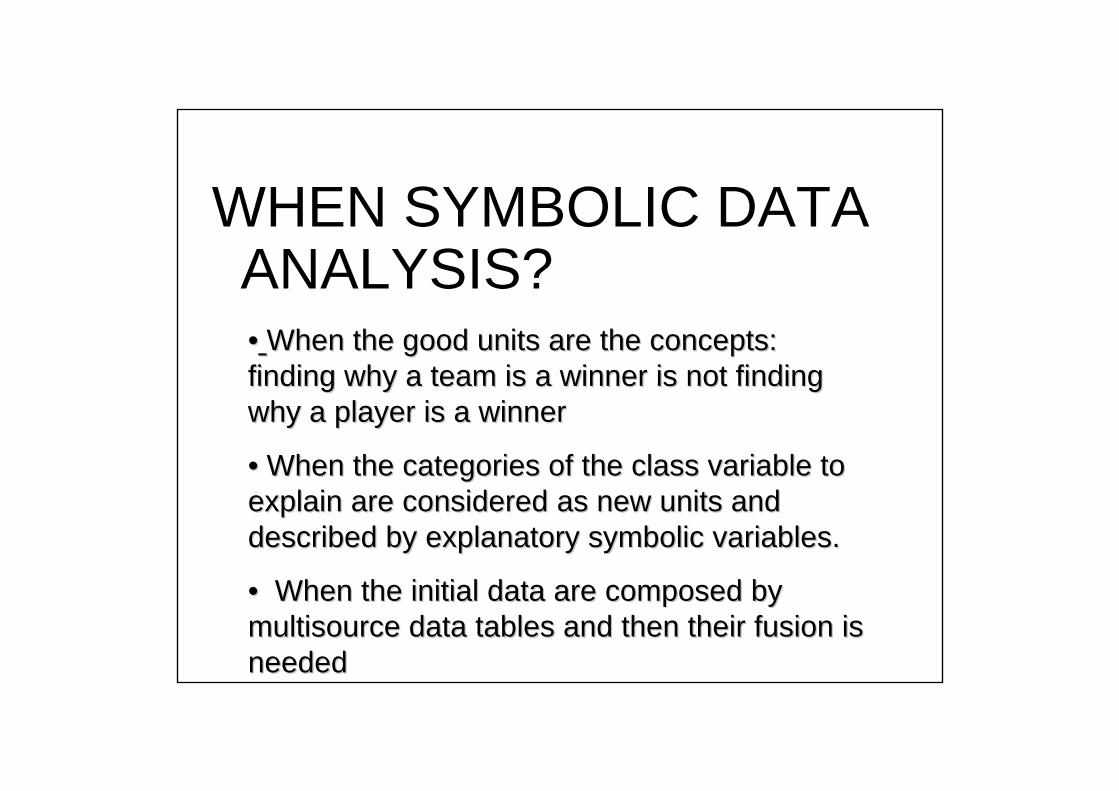
WHEN SYMBOLIC DATA ANALYSIS?•• When the good units are the concepts: When the good units are the concepts: finding why a team is a winner is not finding finding why a team is a winner is not finding why a player is a winnerwhy a player is a winner
•• When the categories of the class variable to When the categories of the class variable to explain are considered as new units and explain are considered as new units and described by explanatory symbolic variables.described by explanatory symbolic variables.
•• When the initial data are composed by When the initial data are composed by multisource data tables and then their fusion is multisource data tables and then their fusion is neededneeded
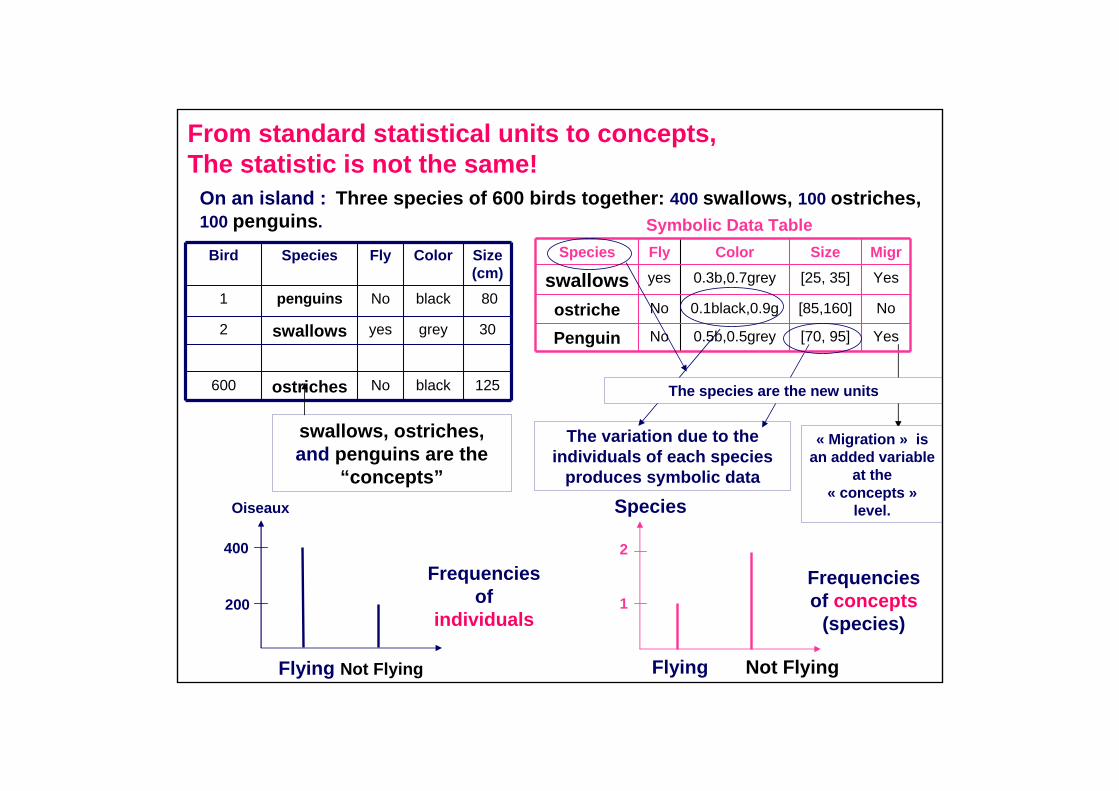
From standard statistical units to concepts, The statistic is not the same!
On an island : Three species of 600 birds together: 400 swallows, 100 ostriches,100 penguins.
Bird Species Fly Color Size (cm)
1 penguins No black 80
2 swallows yes grey 30
600 ostriches No black 125
Species Fly Color Size Migr
swallows yes 0.3b,0.7grey [25, 35] Yes
ostriche No 0.1black,0.9g [85,160] No
Penguin No 0.5b,0.5grey [70, 95] Yes
Symbolic Data Table
The variation due to the individuals of each species
produces symbolic data
« Migration » is an added variable
at the « concepts »
level.
swallows, ostriches,and penguins are the
“concepts”Oiseaux
Flying Not Flying
1
2
Species
Flying Not Flying
400
200
Frequencies of
individuals
Frequencies of concepts
(species)
The species are the new units
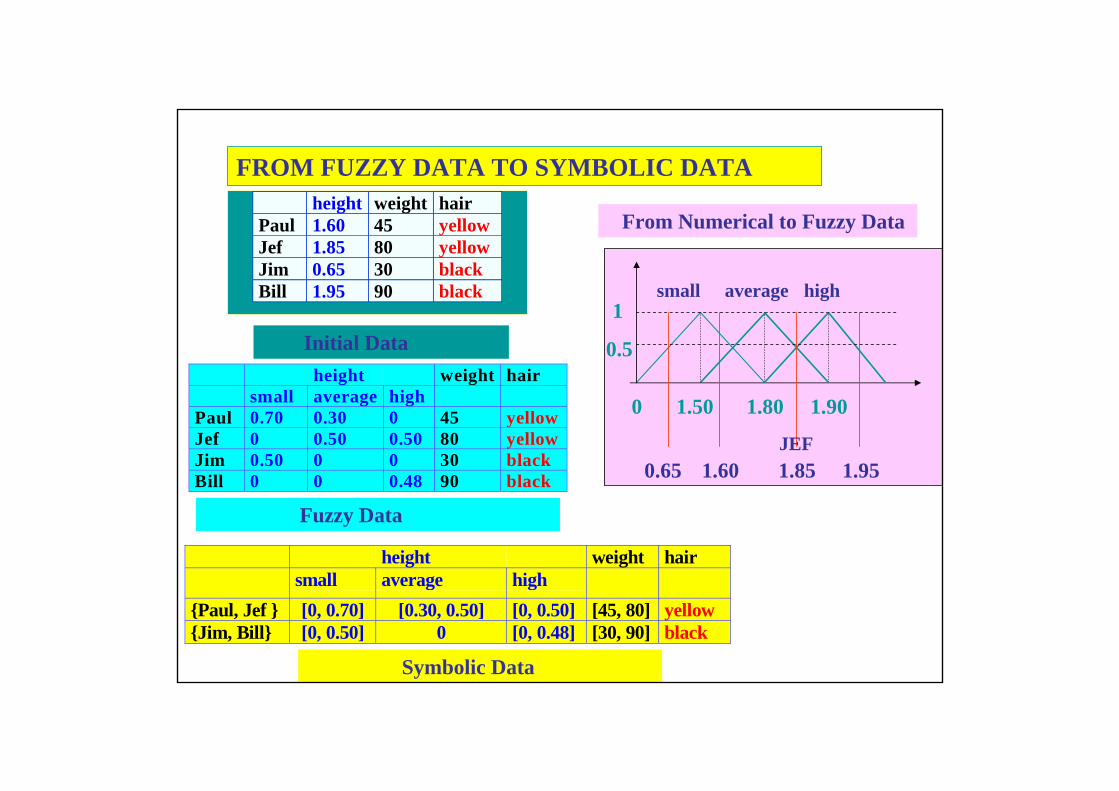
FROM FUZZY DATA TO SYMBOLIC DATAheight weight hair
Paul 1.60 45 yellowJef 1.85 80 yellowJim 0.65 30 blackBill 1.95 90 black
height weight hairsmall average high
Paul 0.70 0.30 0 45 yellowJef 0 0.50 0.50 80 yellowJim 0.50 0 0 30 blackBill 0 0 0.48 90 black
height weight hairsmall average high
{Paul, Jef } [0, 0.70] [0.30, 0.50] [0, 0.50] [45, 80] yellow{Jim, Bill} [0, 0.50] 0 [0, 0.48] [30, 90] black
Symbolic Data
Fuzzy Data
0.5
small average high1
1.500 1.80 1.90
0.65 1.60 1.85 1.95
From Numerical to Fuzzy Data
Initial Data
JEF
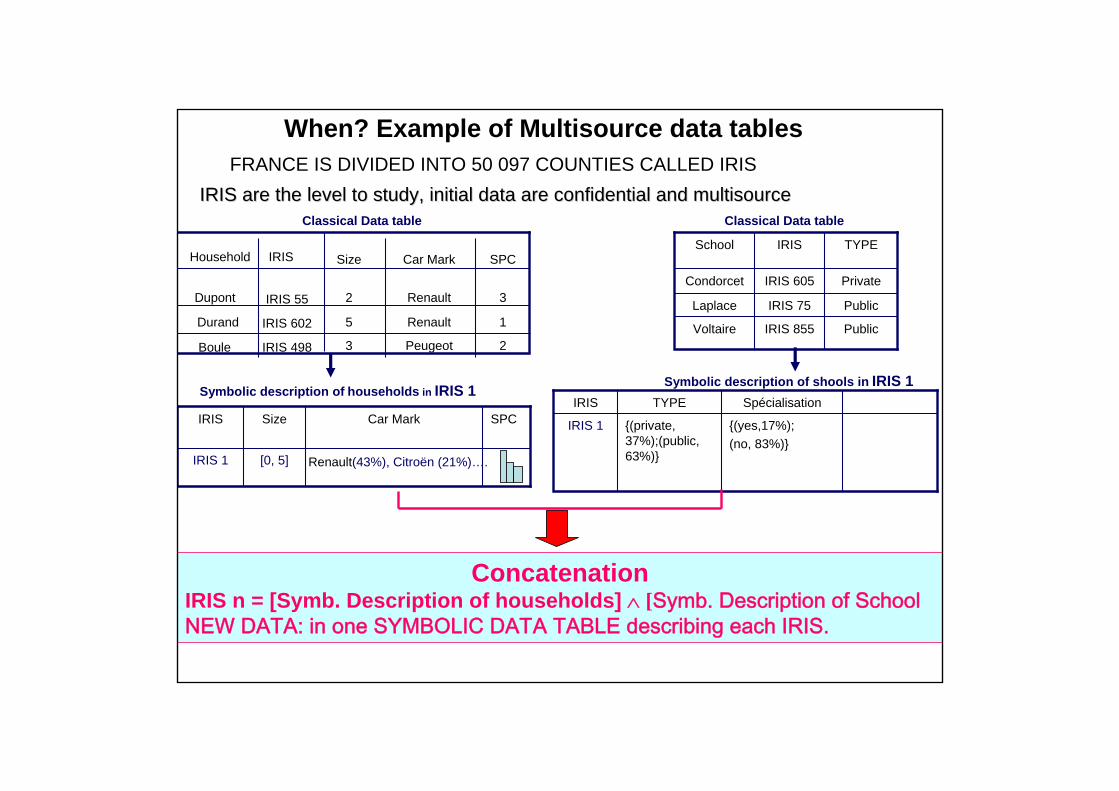
IRIS 1
IRIS
Renault(43%), Citroën (21%)….[0, 5]
SPCCar MarkSize IRIS 1
IRIS
{(yes,17%);(no, 83%)}
{(private, 37%);(public, 63%)}
SpécialisationTYPESymbolic description of households in IRIS 1
ConcatenationIRIS n = [Symb. Description of households] ∧ [Symb. Description of SchoolNEW DATA: in one SYMBOLIC DATA TABLE describing each IRIS.
3
5
2
Size
Peugeot
Renault
Renault
Car Mark
2IRIS 498Boule
1IRIS 602Durand
3IRIS 55Dupont
SPCIRISHousehold
Classical Data table
Public
Public
Private
TYPE
IRIS 855Voltaire
IRIS 75Laplace
IRIS 605Condorcet
IRISSchool
Symbolic description of shools in IRIS 1
Classical Data table
FRANCE IS DIVIDED INTO 50 097 COUNTIES CALLED IRISIRIS are the level to study, initial data are confidential and mIRIS are the level to study, initial data are confidential and multisourceultisource
When? Example of Multisource data tables
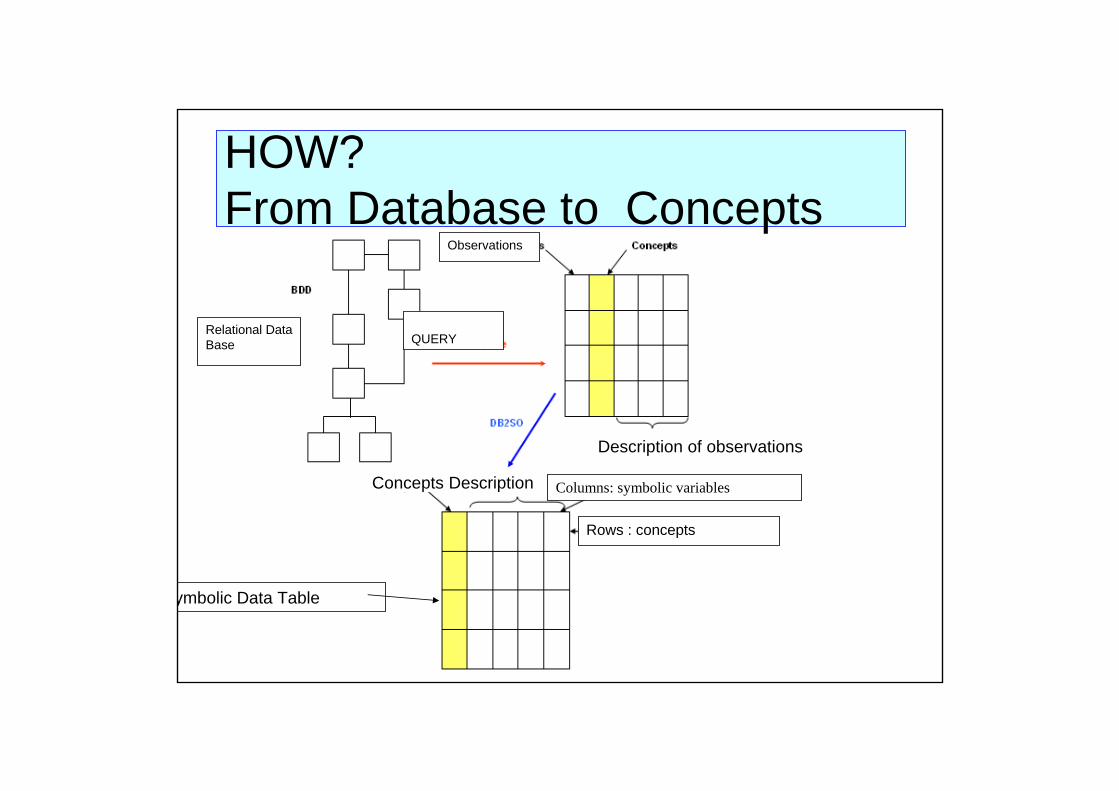
HOW? From Database to Concepts
QUERY
Rows : concepts
Relational Data Base
Observations
Concepts Description
ymbolic Data Table
Description of observations
Columns: symbolic variables
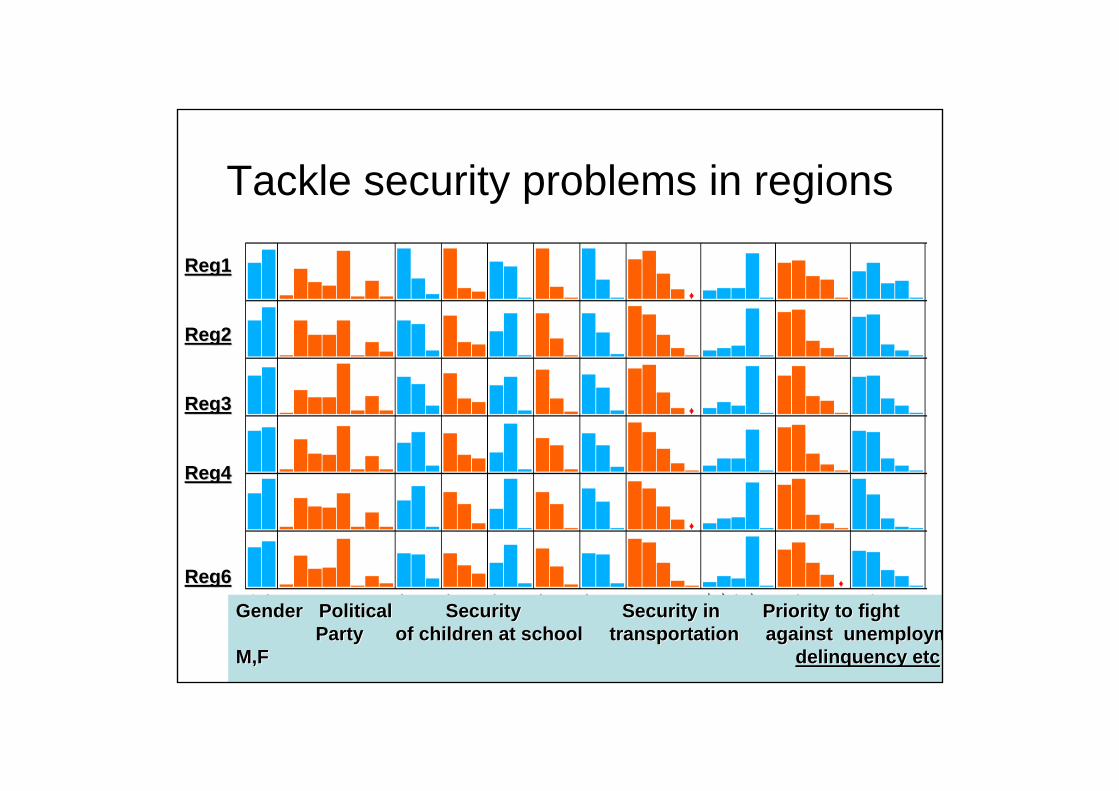
Tackle security problems in regions
Reg1Reg1
Reg2Reg2
Reg3Reg3
Reg4Reg4
Reg6Reg6
Gender Political Security Security Gender Political Security Security in Priority to fightin Priority to fightParty of children at school transportatiParty of children at school transportation against unemploymon against unemploym
M,F M,F delinquency etc delinquency etc
OUTLINE
• What are Complex Data?• What are “symbolic data”?• Why and how symbolic data are built?• Symbolic Data are Complex Data? • From Complex Data to Symbolic Data• What is “Symbolic Data Analysis” (SDA)?• Open directions of research • Conclusion: SDA provides a framework for
Complex Data Analysis (CDA)

WHY SYMBOLIC DATA CANNOT BE REDUCED TO A CLASSICAL DATA TABLE?
Players category Weight Size NationalityVery good [80, 95] [1.70, 1.95] {0.7 Eur, 0.3 Afr}
Players category
Weight Min
Weight Max
Size Min
Size Max
Eur Afr
Very good 80 95 1.70 1.95 0. 7 0.3
Symbolic Data Table
Concern:
The initial variables are lost and the variation is lost!
Transformation in classical data
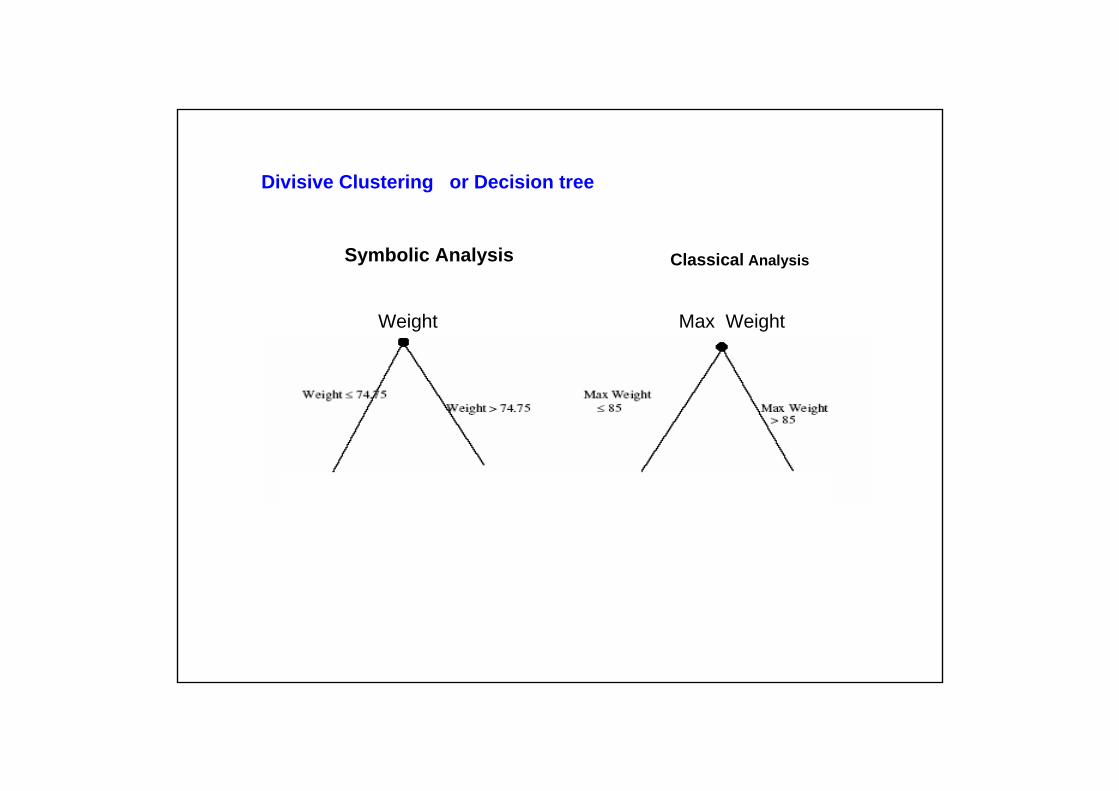
Divisive Clustering or Decision tree
Symbolic Analysis Classical Analysis
Weight Max Weight
xx xxx
x
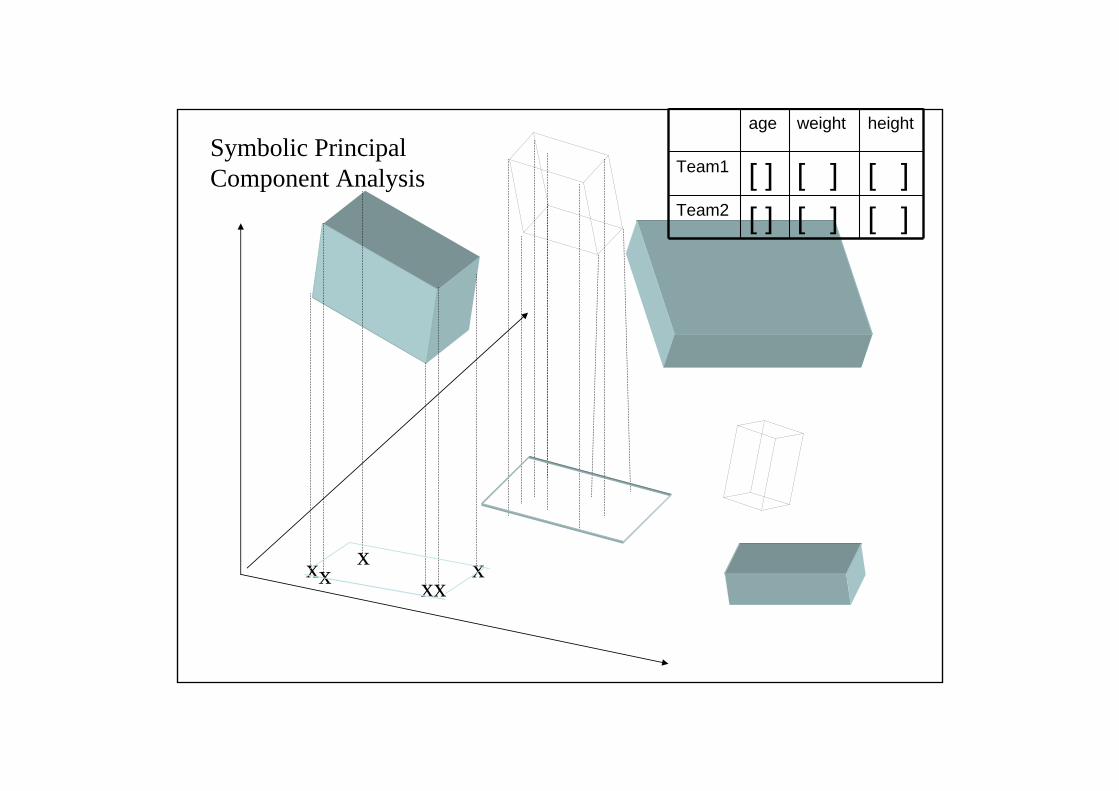
Symbolic Principal Component Analysis
age weight height
Team1 [ ] [ ] [ ]Team2 [ ] [ ] [ ]
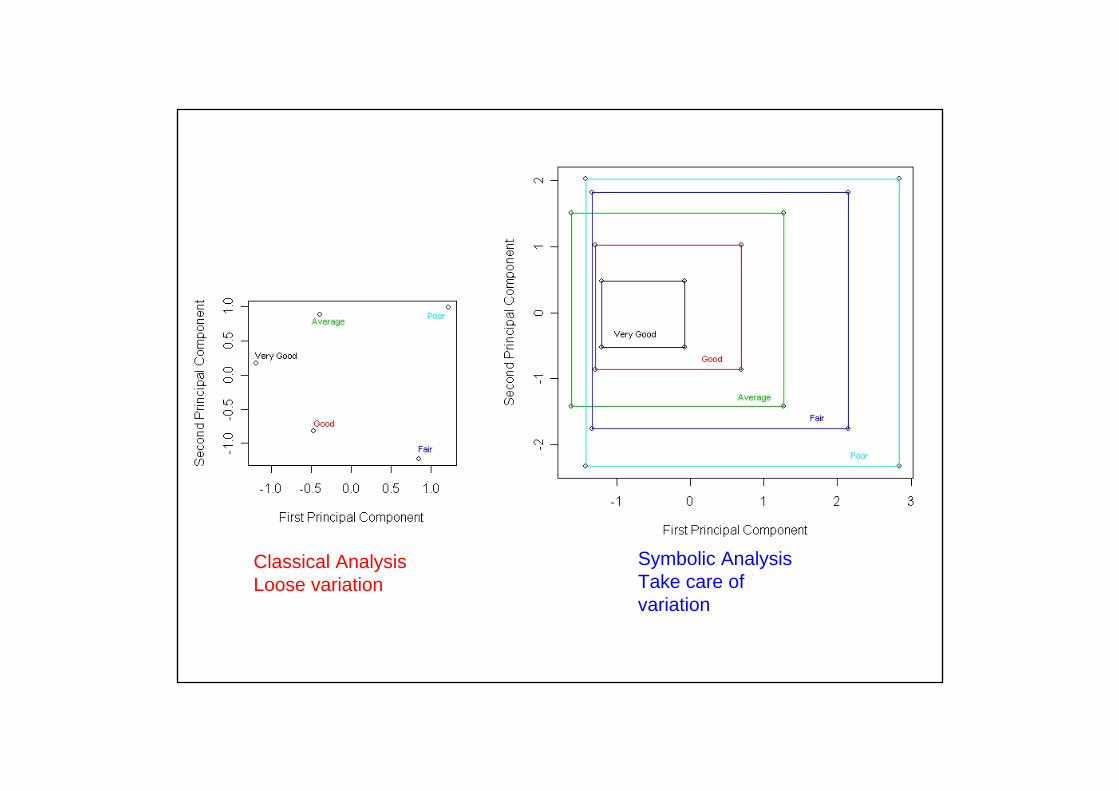
Classical AnalysisLoose variation
Symbolic AnalysisTake care of variation
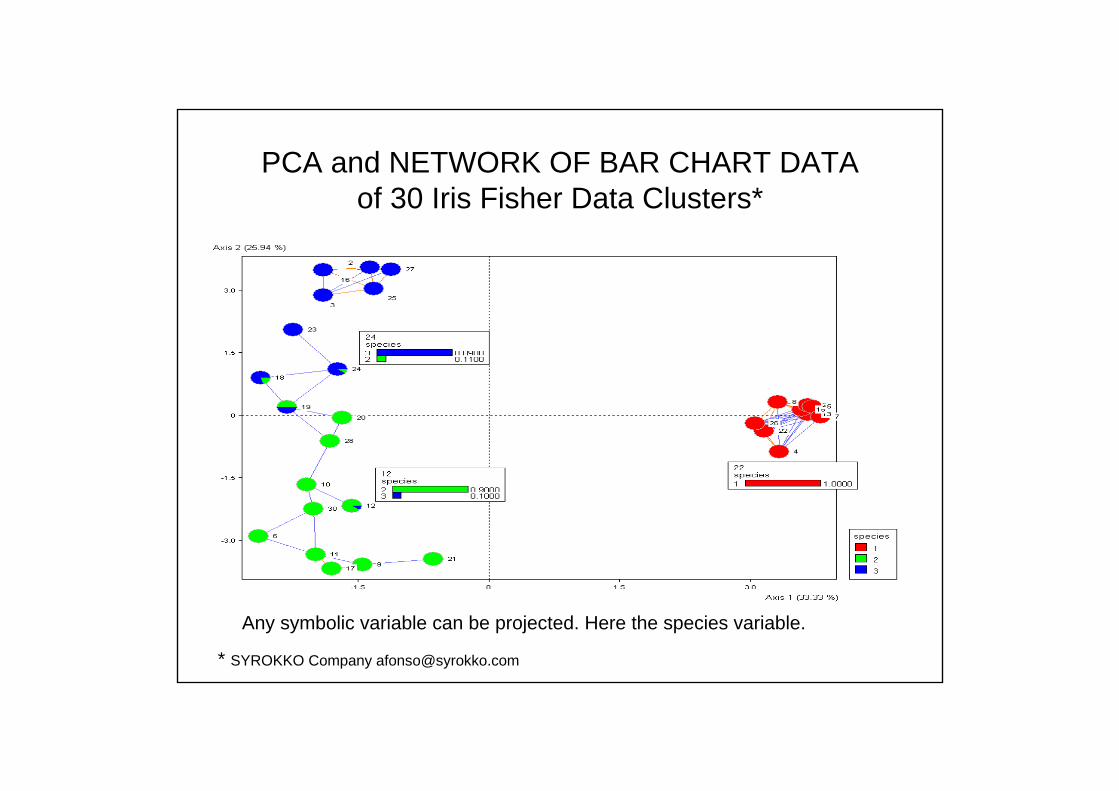
PCA and NETWORK OF BAR CHART DATAof 30 Iris Fisher Data Clusters*
* SYROKKO Company [email protected]
Any symbolic variable can be projected. Here the species variable.
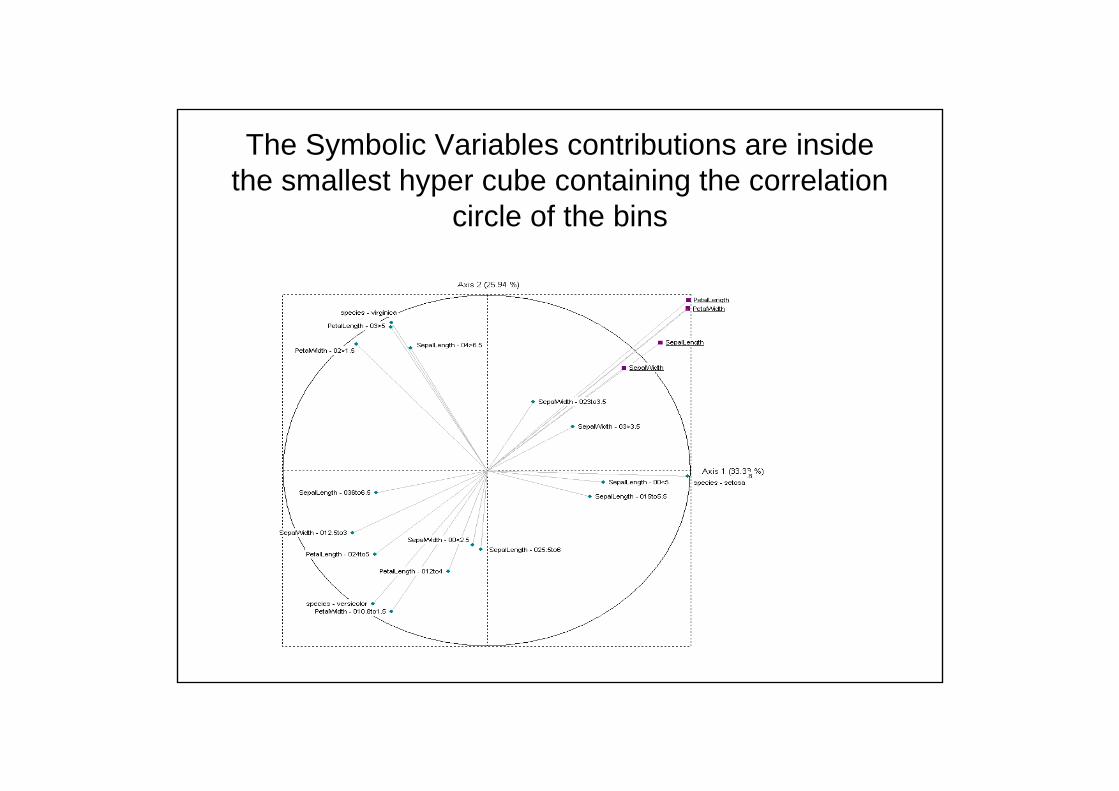
The Symbolic Variables contributions are inside the smallest hyper cube containing the correlation
circle of the bins

Conclusion: Symbolic Data are Complex Data as they cannot be reduced to standard data without loosing much information.
OUTLINE• What are Complex Data?• What are “symbolic data”?• How “Symbolic Data” are built?• Symbolic Data are Complex data?• From Complex data to Symbolic Data • What is “Symbolic Data Analysis” (SDA)?• Open directions of research. • SDA gives a framework for Complex Data
Analysis (CDA)
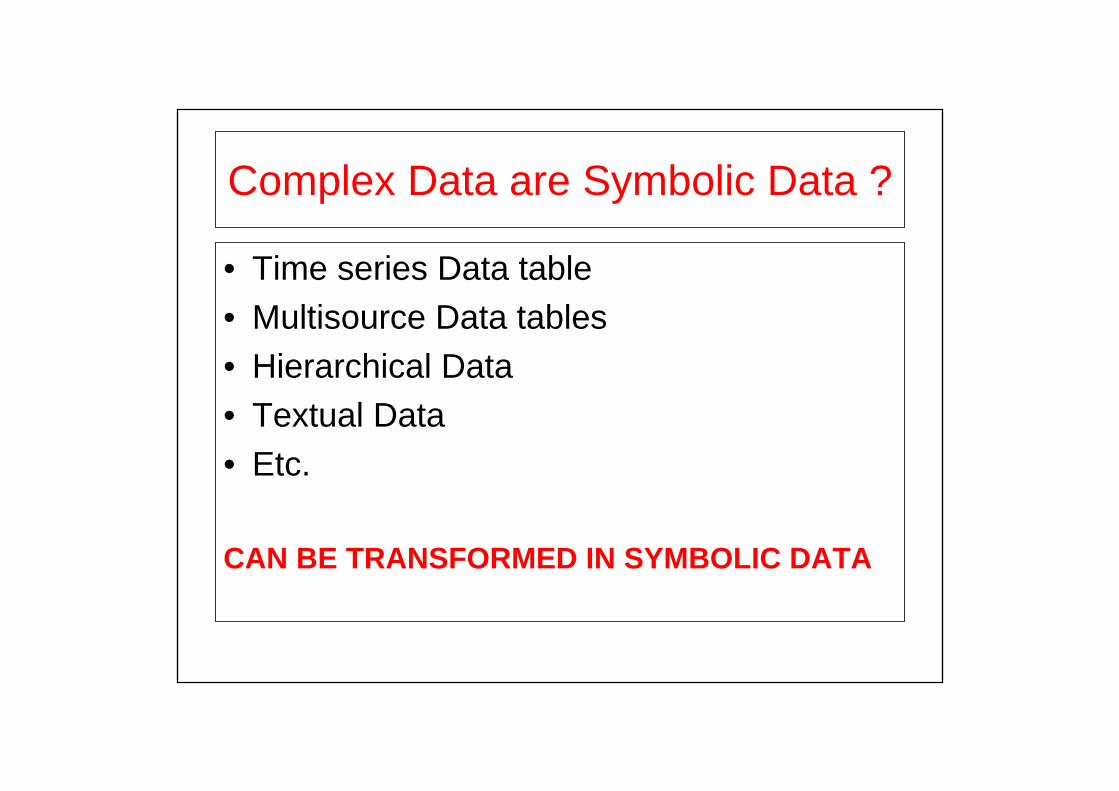
Complex Data are Symbolic Data ?
• Time series Data table• Multisource Data tables• Hierarchical Data• Textual Data• Etc.
CAN BE TRANSFORMED IN SYMBOLIC DATA

INTERVAL TIME SERIES VOLATILITY OF STOCKS

Each row represents a train going on the bridge at a given temperature,
each cell contains until 800.000 values.
Each cell is transformed in HISTOGRAM from a PROJECTION or from WAVELETS
Sensor 1 Sensor 2 Sensor 3 …. Sensor N
Time Series Data table: Anomaly detection on a bridgeLCPC (Laboratoire Central Des Ponts et Chaussées) and SNCF Data
Trains
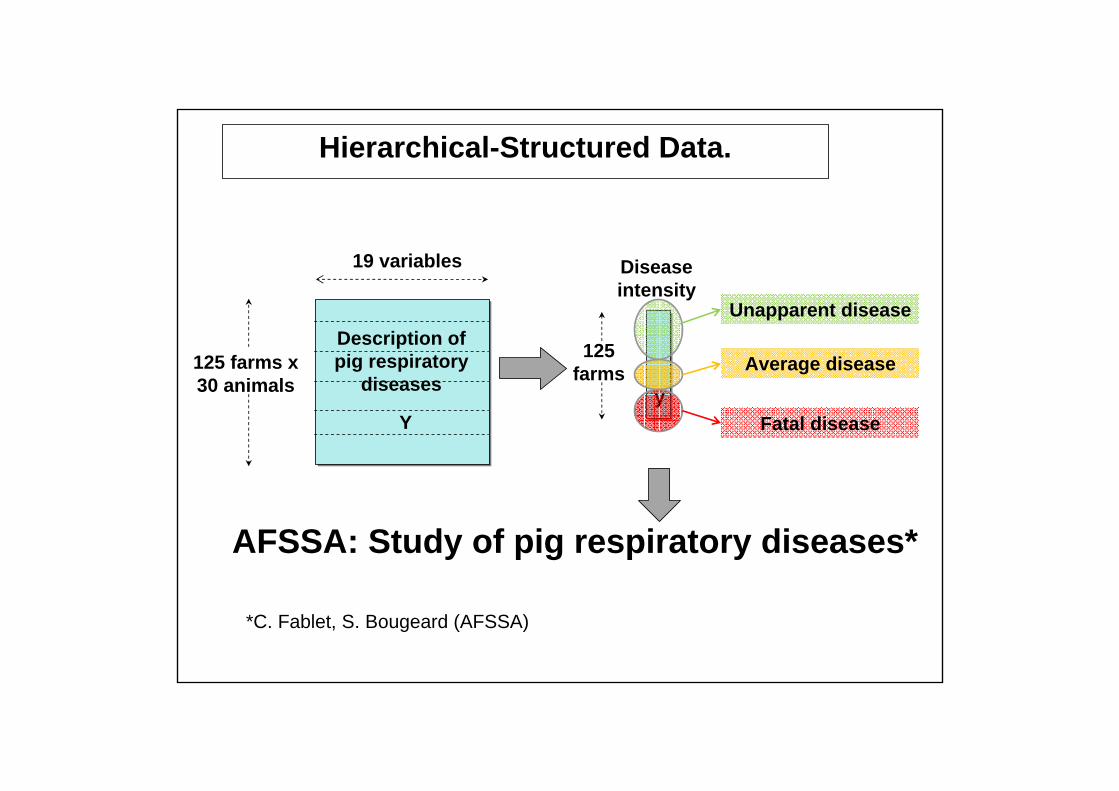
AFSSA: Study of pig respiratory diseases*
Hierarchical-Structured Data.
y
125 farms
Disease intensity
Unapparent disease
Average disease
Fatal disease
125 farms x 30 animals
Description of pig respiratory
diseases
Y
19 variables
*C. Fablet, S. Bougeard (AFSSA)
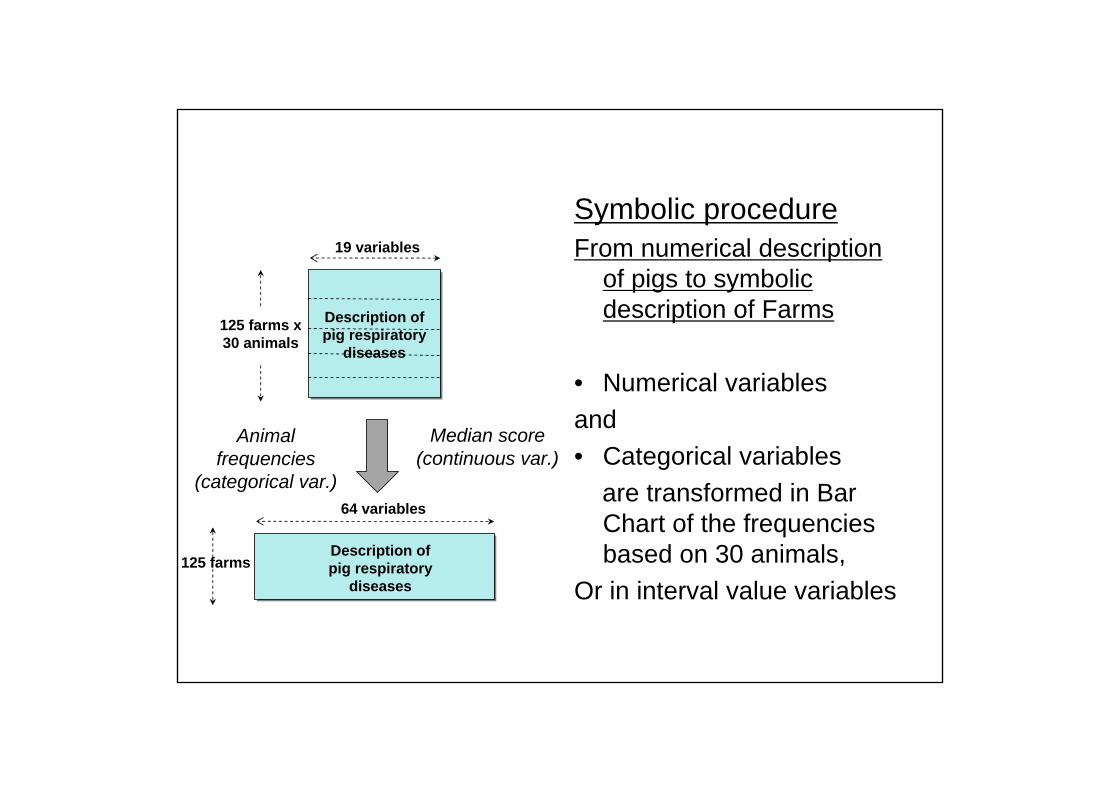
Symbolic procedureFrom numerical description
of pigs to symbolic description of Farms
• Numerical variablesand• Categorical variables
are transformed in Bar Chart of the frequencies based on 30 animals,
Or in interval value variables
125 farms x 30 animals
Description of pig respiratory
diseases
19 variables
125 farms
64 variables
Description of pig respiratory
diseases
Median score (continuous var.)
Animal frequencies
(categorical var.)
OUTLINE• What are Complex Data?• What are “symbolic data”?• Why and how symbolic data are built?• Symbolic Data are Complex Data? • From Complex Data to Symbolic Data• What is “Symbolic Data Analysis” (SDA)?• Tools of SDA• Some industrial applications:
Nuclear Power Plot, Text Mining• Open directions of research • Conclusion: SDA provides a framework for Complex
Data Analysis (CDA)
• The Aim of SYMBOLIC DATA ANALYSIS?
TO
EXTEND STATISTICS AND DATA MINING TO SYMBOLIC DATA TABLES DESCRIBING HIGHER LEVEL UNITS NEEDING VARIATION IN THEIR DESCRIPTION.

Why Symbolic Data Analysis?
1) From standard statistical units to concepts, the statistic is not the same!
2) Symbolic Data cannot be reduced to classical data!
THE TWO STEPS OF A SDA
1) Building the symbolic data from the Data Base
2) Applying SDA methods.

OUTLINE• What are Complex Data?• What are “symbolic data”?• Why and how symbolic data are built?• Symbolic Data are Complex Data? • From Complex Data to Symbolic Data• What is “Symbolic Data Analysis” (SDA)?• Tools of SDA• Open directions of research • Conclusion: SDA provides a framework for
Complex Data Analysis (CDA)
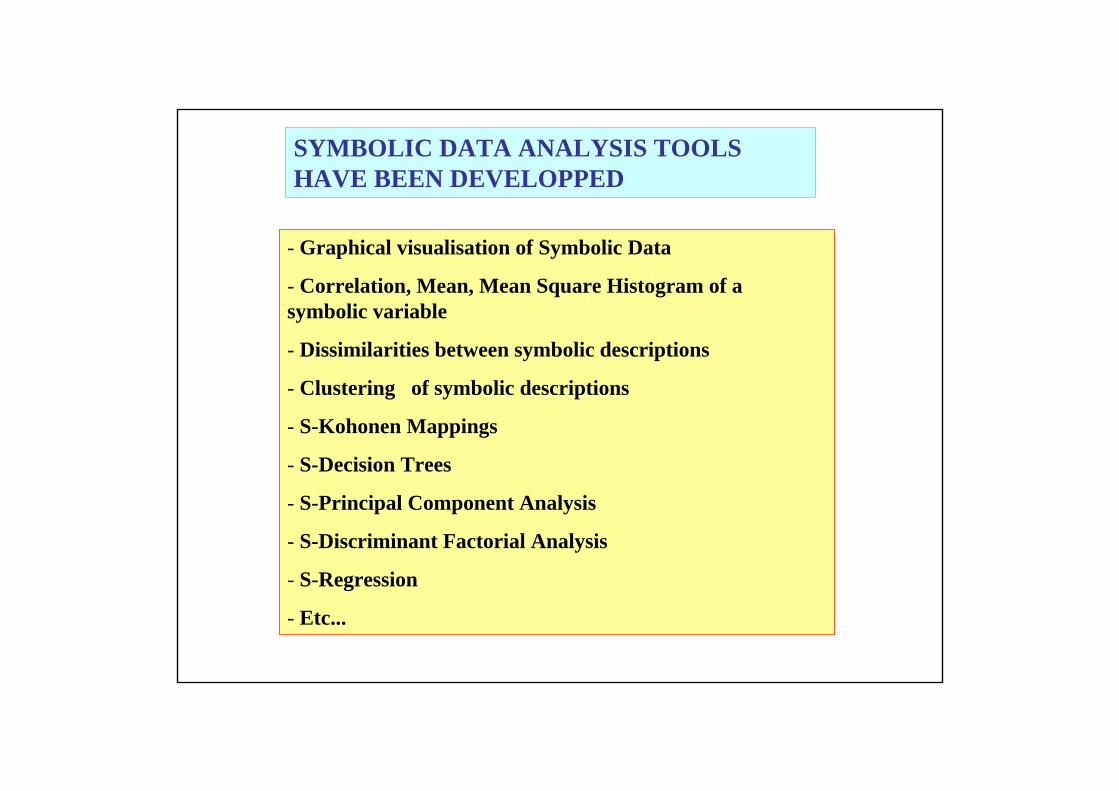
- Graphical visualisation of Symbolic Data
- Correlation, Mean, Mean Square Histogram of a symbolic variable
- Dissimilarities between symbolic descriptions
- Clustering of symbolic descriptions
- S-Kohonen Mappings
- S-Decision Trees
- S-Principal Component Analysis
- S-Discriminant Factorial Analysis
- S-Regression
- Etc...
SYMBOLIC DATA ANALYSIS TOOLS HAVE BEEN DEVELOPPED
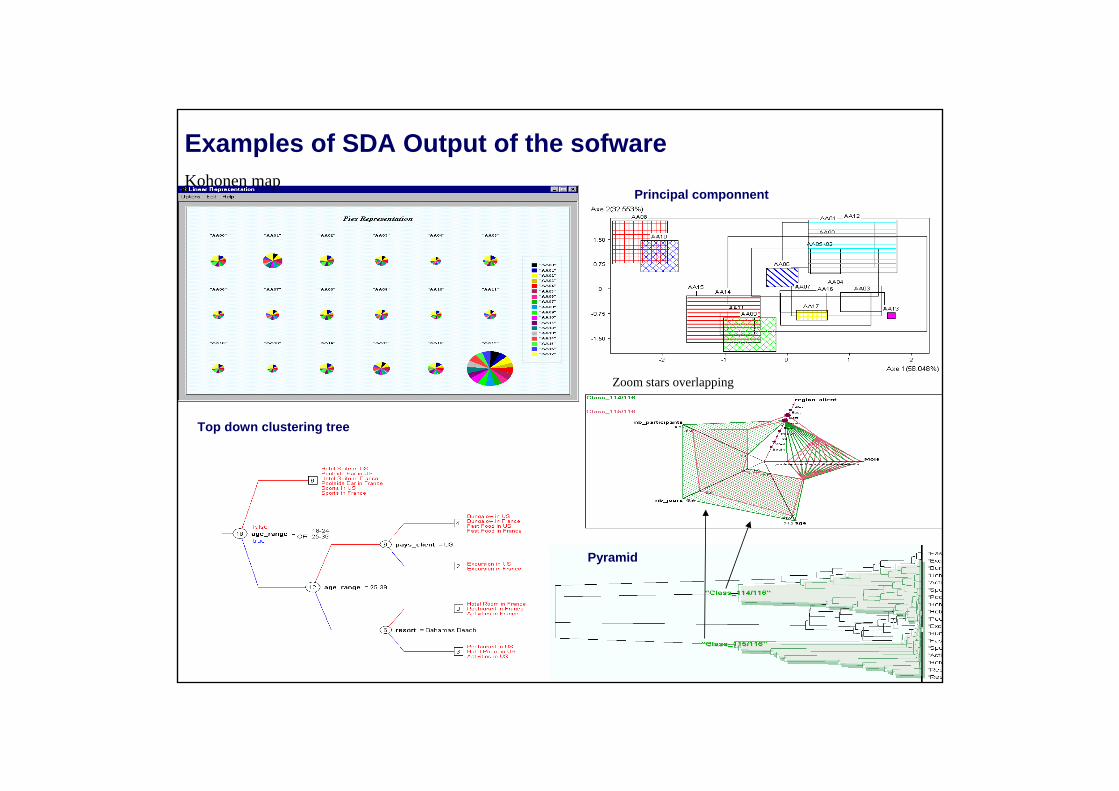
The objective of SCLUST is the clustering of symbolic objects by a dynamic algorithm based on symbolic data tables. The aim is to build a partition of SO´s into a predefined number of classes. Each class has a prototype in the form of a SO. The optimality criterion used is based on the sum of proximities between the individuals and the prototypes of the clusters.
Examples of SDA Output of the sofware
Top down clustering tree
Principal componnent
Pyramid
Kohonen map
Zoom stars overlapping

REAL WORLD
xx
x
MODELED WORLD
INDIVIDUALS
CONCEPTS
DESCRIPTIONS
SYMBOLIC OBJECTS
x dw
xx x
x s = (a, R, dC)
dC
xxxx
xwΩ
Ext(s/Ω)T
R
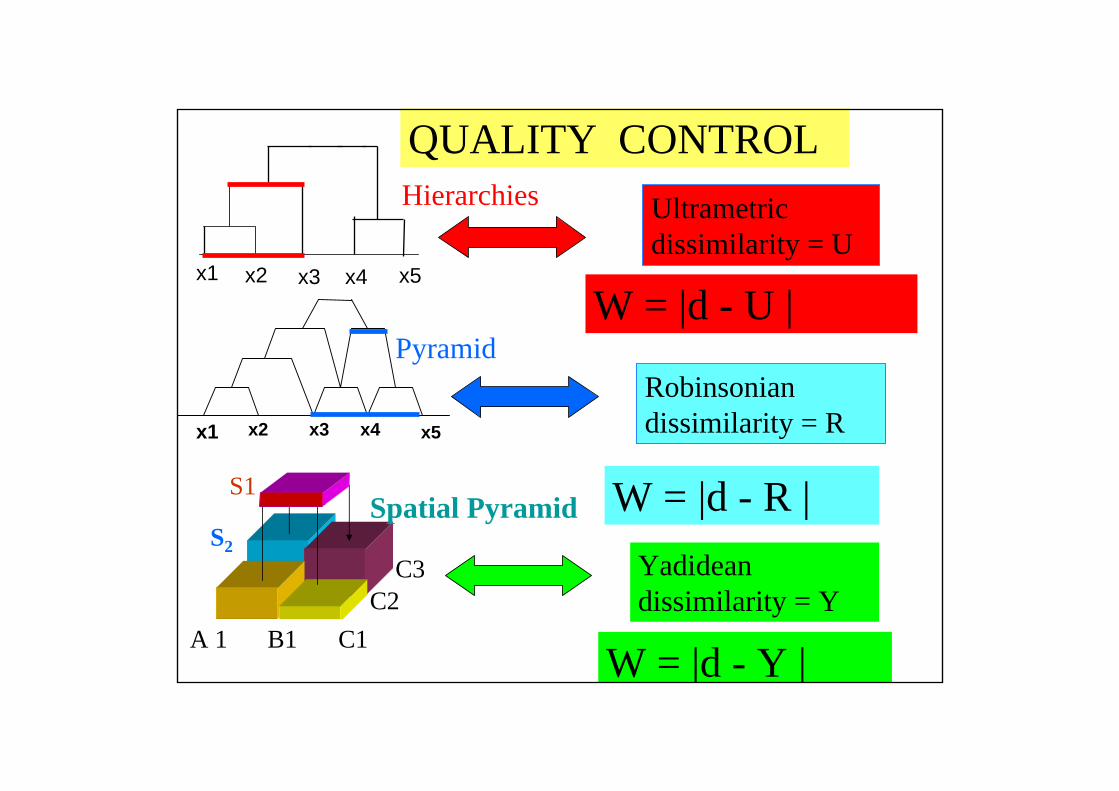
QUALITY CONTROL CONFIRMATORY SDA
C2A 1 B1 C1
C3
Spatial Pyramid
x1 x2 x3 x4 x5
Pyramid
Hierarchies
x1 x2 x3 x4 x5
S2
S1
Ultrametric dissimilarity = U
Robinsonian dissimilarity = R
Yadidean dissimilarity = Y
W = |d - U |
W = |d - R |
W = |d - Y |
QUALITY CONTROL
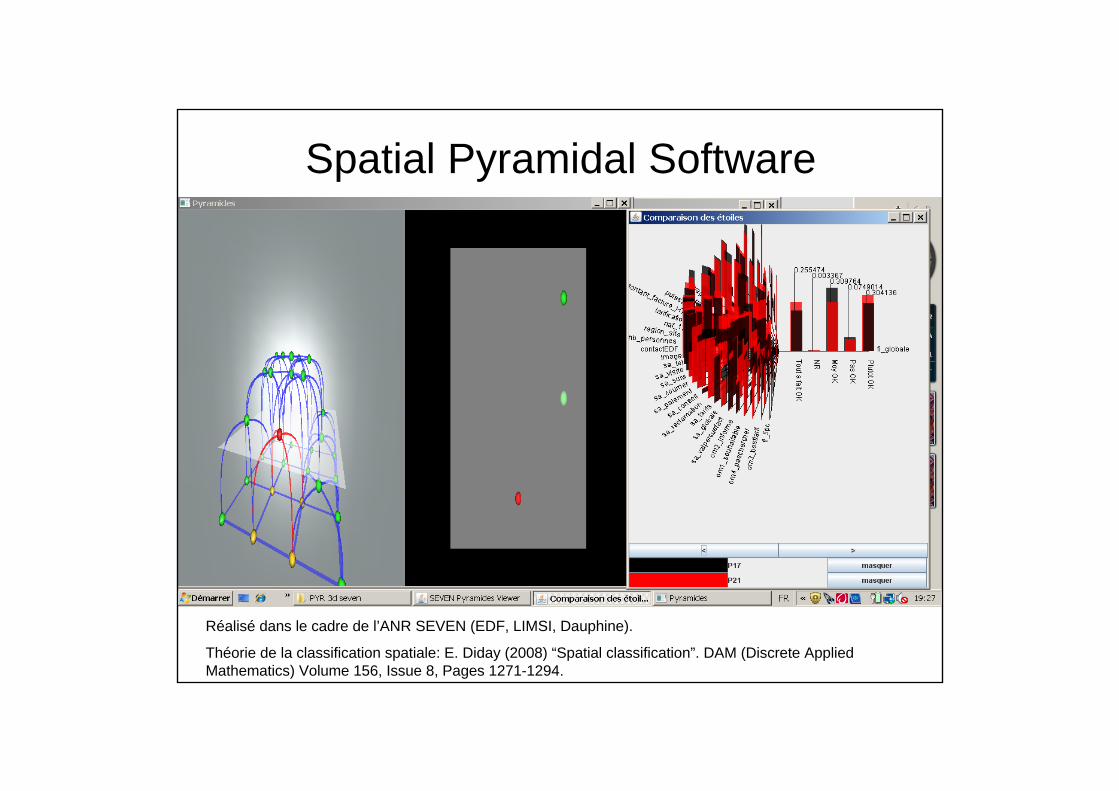
Spatial Pyramidal Software
Réalisé dans le cadre de l’ANR SEVEN (EDF, LIMSI, Dauphine).
Théorie de la classification spatiale: E. Diday (2008) “Spatial classification”. DAM (Discrete Applied Mathematics) Volume 156, Issue 8, Pages 1271-1294.
OUTLINE• What are Complex Data?• What are “symbolic data”?• Why and how symbolic data are built?• Symbolic Data are Complex Data? • From Complex Data to Symbolic Data• What is “Symbolic Data Analysis” (SDA)?• Tools of SDA• Some industrial applications:
Nuclear Power Plot, Text Mining, TGV anomalies• Open directions of research • Conclusion: SDA provides a framework for Complex
Data Analysis (CDA)

Nuclear Power Plant
Find Correlations Between 3 Standard Data Tables of Different
observation units and different Variables

Cartography of the towel by a grid
Inspection :
CraksInspection machine
NUCLEAR POWER PLANTNuclear thermal power station
PB: FIND CORRELATIONS BETWEEN 3 CLASSICAL DATA TABLES OF DIFFERENT UNITS AND VARIABLES:Table 1) Cracks description.Table 2) Gap deviation of vertices of a grid at different periods compared to the initial model position.Table 3) Gap depression from the ground.ARE Transformed in ONE Symbolic Data Table where the concepts are interval of height
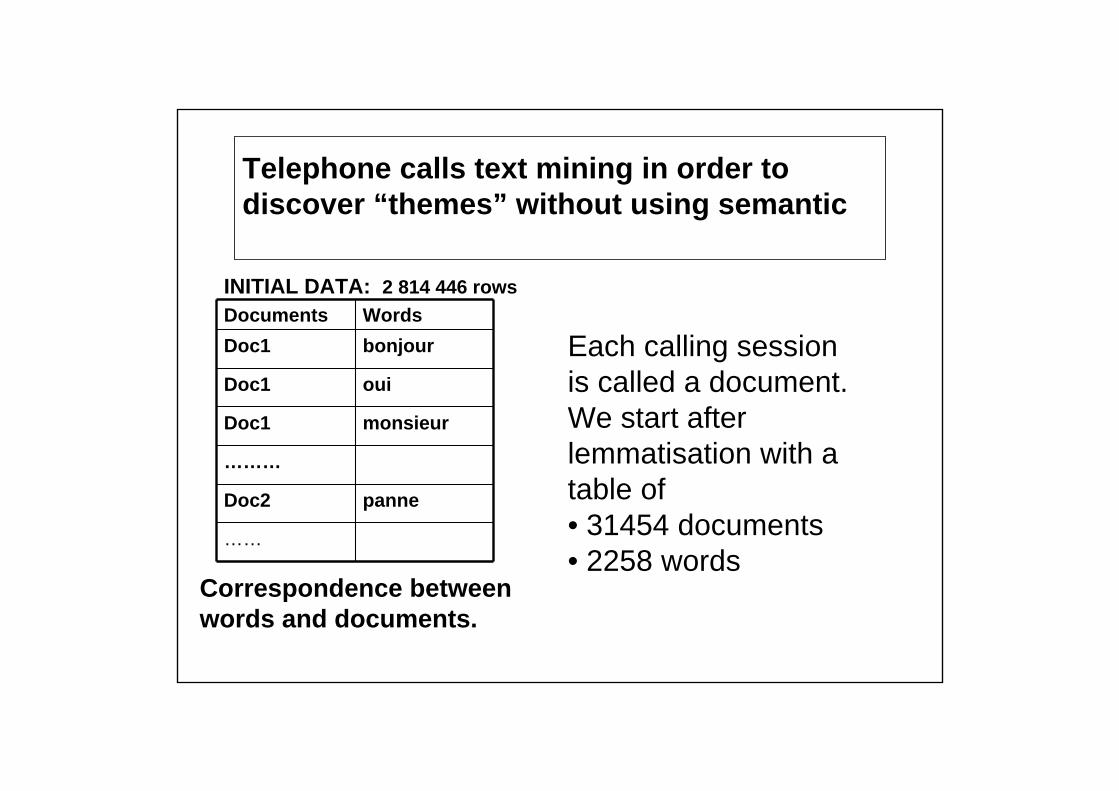
Telephone calls text mining in order to discover “themes” without using semantic
Each calling session is called a document. We start after lemmatisation with a table of • 31454 documents • 2258 words
Documents WordsDoc1 bonjour
Doc1 oui
Doc1 monsieur
………
Doc2 panne
……
Correspondence between words and documents.
INITIAL DATA: 2 814 446 rows
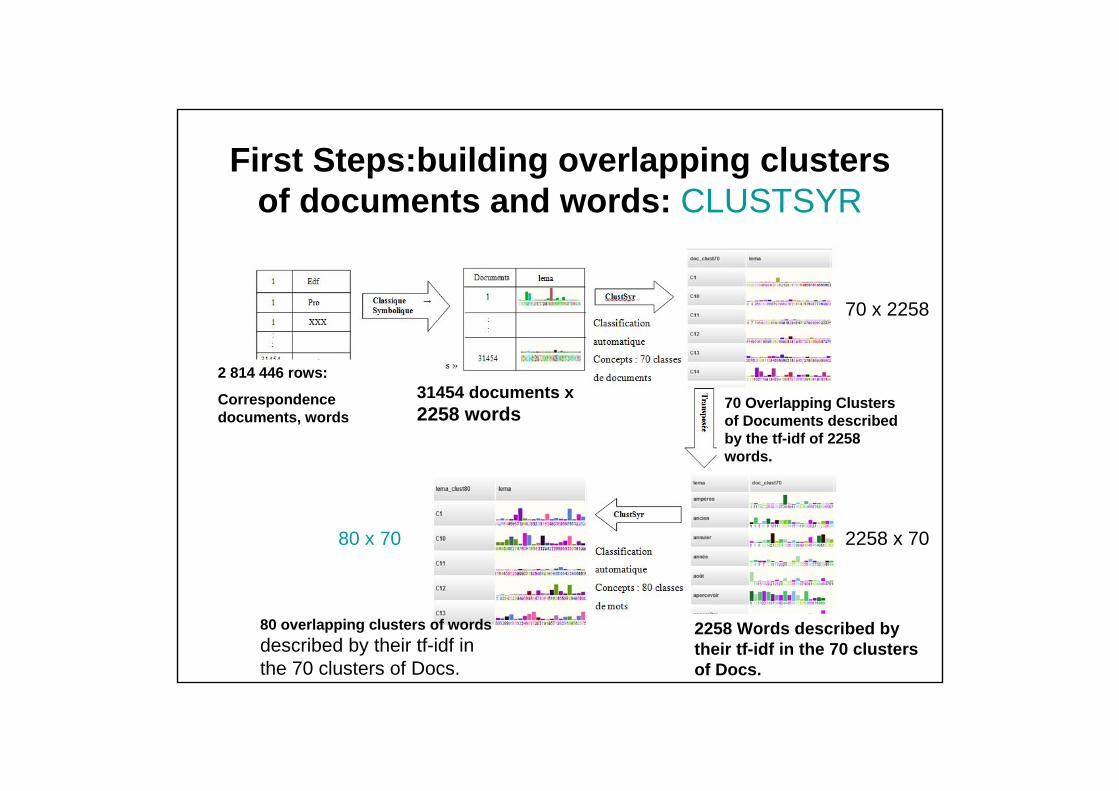
First Steps:building overlapping clusters of documents and words: CLUSTSYR
2 814 446 rows:
Correspondence documents, words
70 Overlapping Clusters of Documents described by the tf-idf of 2258 words.
2258 Words described by their tf-idf in the 70 clusters of Docs.
80 overlapping clusters of words described by their tf-idf in the 70 clusters of Docs.
70 x 2258
2258 x 7080 x 70
31454 documents x2258 words
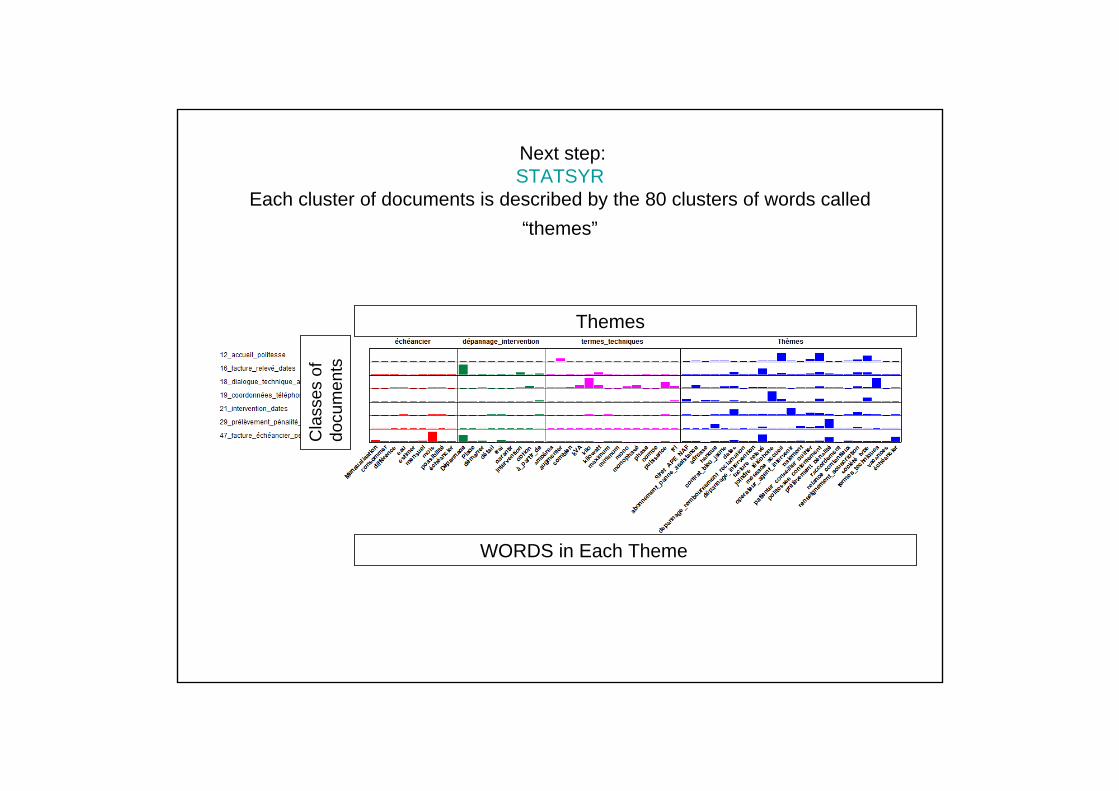
Next step: STATSYR
Each cluster of documents is described by the 80 clusters of words called “themes”
ThemesC
lass
es o
f do
cum
ents
WORDS in Each Theme

NEXT STEPS: SELECTION• BEST WORDS: HISTSYR
• BEST THEMES: TABSYR
• BEST CLASSES OF DOCUMENTS:TABSYR
• GRAPHICAL REPRESENTATION of themes , doc classes, clusters: NETSYR
• SOCIAL NEWORK:NETSYR
• ANNOTATION of Themes and Document classes : NETSYR
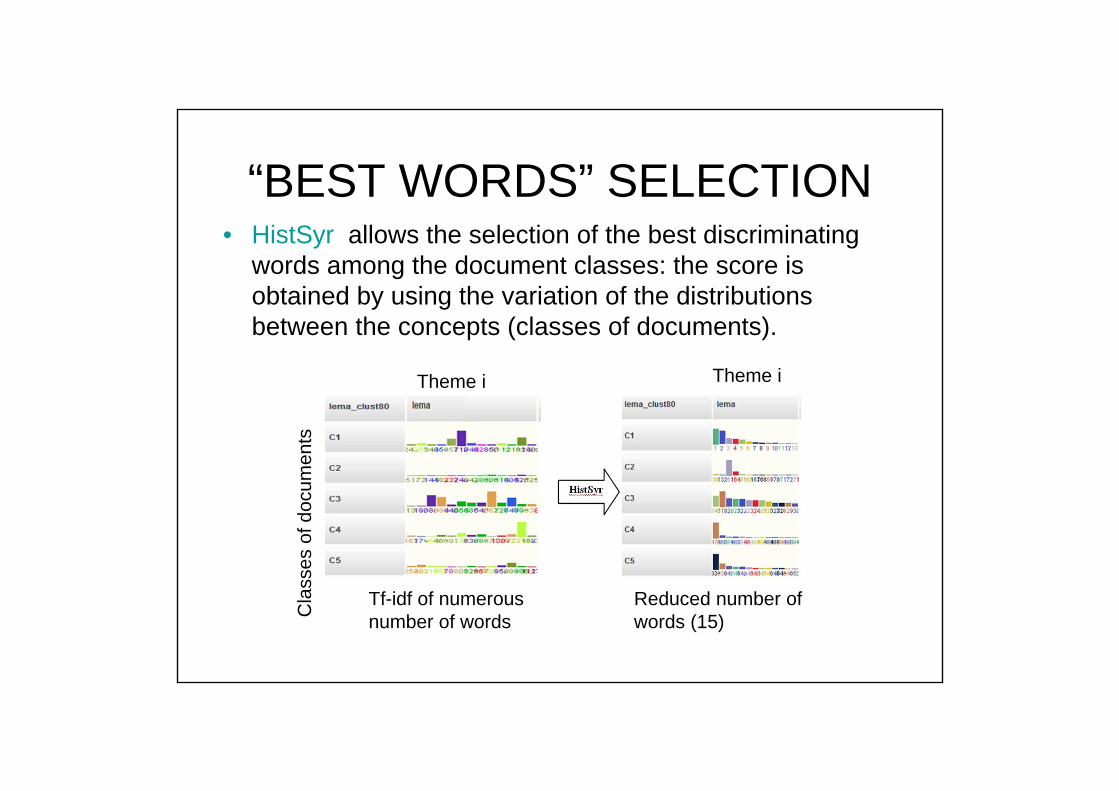
“BEST WORDS” SELECTION• HistSyr allows the selection of the best discriminating
words among the document classes: the score is obtained by using the variation of the distributions between the concepts (classes of documents).
Cla
sses
of d
ocum
ents
Theme i
Tf-idf of numerous number of words
Reduced number of words (15)
Theme i

BEST THEMES :TABSYR BEST DOCUMENT CLASSES :TABSYR
Cla
sses
of d
ocum
ents
Themes
SORTING AND SELECTION of THE “BEST THEMES”: the score is obtained by using the variation of the distributions between the concepts.
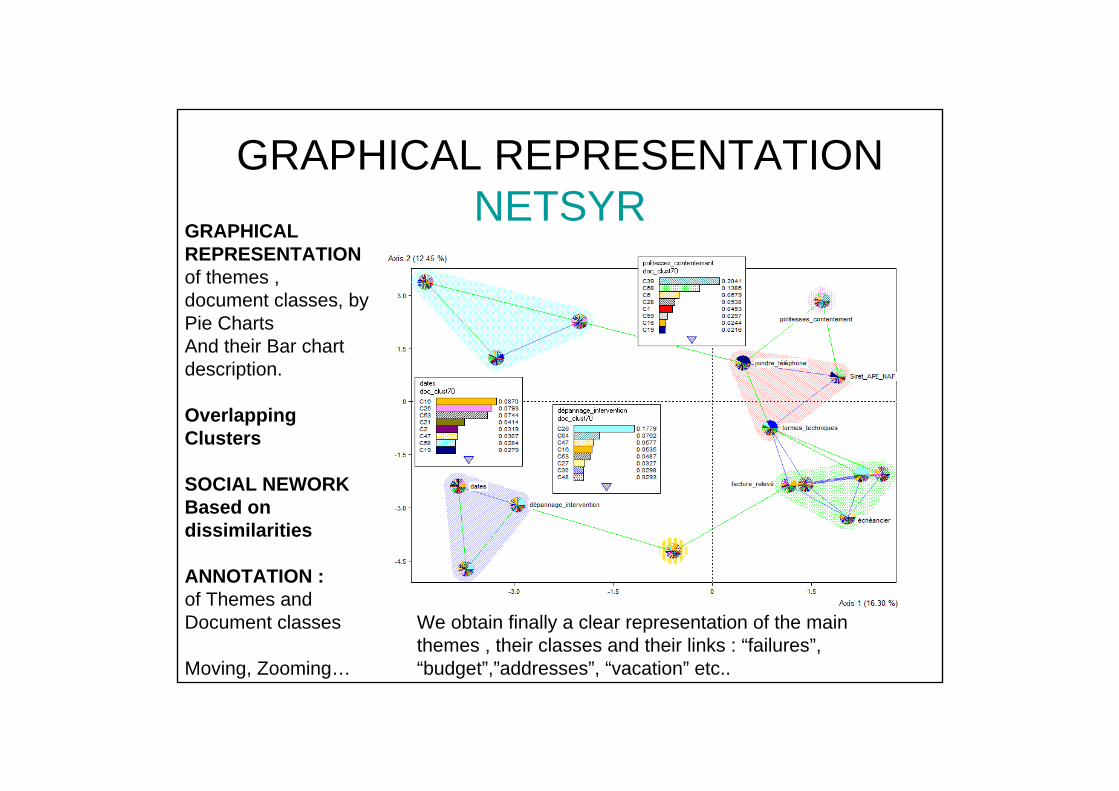
GRAPHICAL REPRESENTATIONNETSYR
GRAPHICAL REPRESENTATIONof themes , document classes, by Pie ChartsAnd their Bar chart description.
OverlappingClusters
SOCIAL NEWORKBased on dissimilarities
ANNOTATION :of Themes and Document classes
Moving, Zooming…
We obtain finally a clear representation of the main themes , their classes and their links : “failures”, “budget”,”addresses”, “vacation” etc..
Anomaly Detection on a Bridge Produced by Trains of Very High Speed
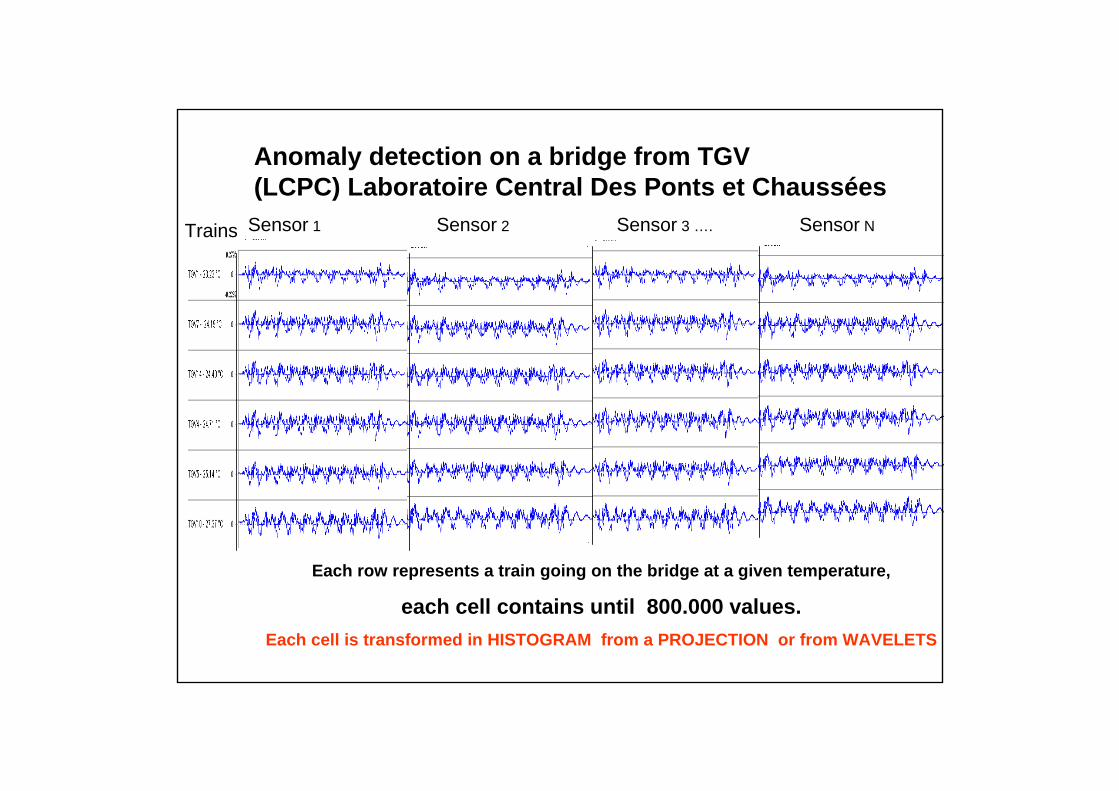
Each row represents a train going on the bridge at a given temperature,
each cell contains until 800.000 values.Each cell is transformed in HISTOGRAM from a PROJECTION or from WAVELETS
Sensor 1 Sensor 2 Sensor 3 …. Sensor N
Anomaly detection on a bridge from TGV(LCPC) Laboratoire Central Des Ponts et Chaussées
Trains

Tableau de données symboliques dont chaque case contient un histogramme à 20 intervalles représentant chaque signal pour chaque capteur.
Construction du Tableau de données symboliques
CAPT 1 CAPT2 CAPT 3 …. CAPT N
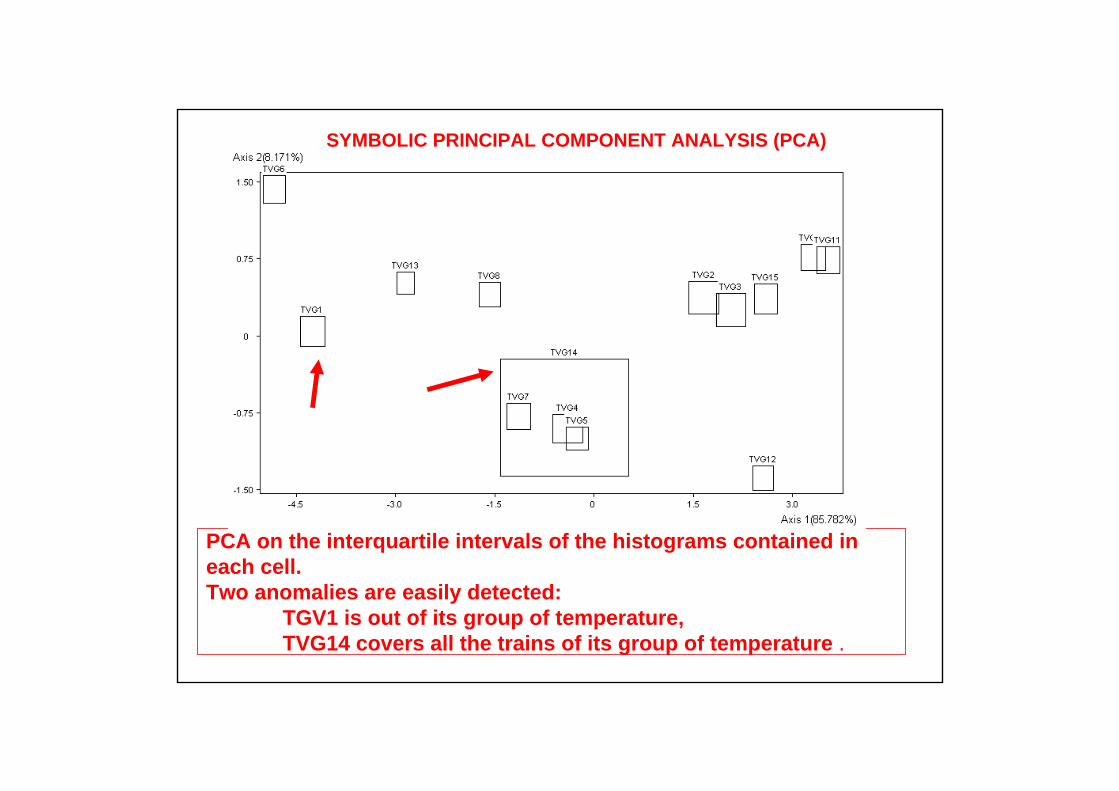
PCA on the interquartile intervals of the histograms contained in each cell. Two anomalies are easily detected:
TGV1 is out of its group of temperature, TVG14 covers all the trains of its group of temperature .
SYMBOLIC PRINCIPAL COMPONENT ANALYSIS (PCA)
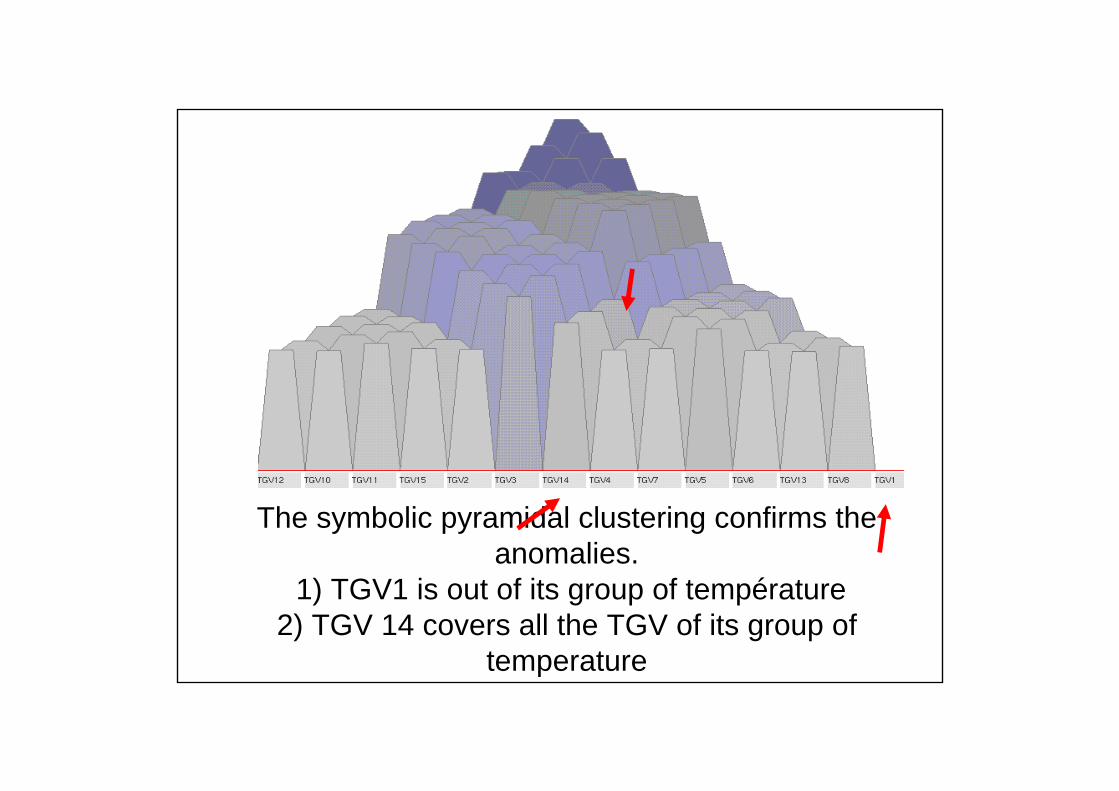
The symbolic pyramidal clustering confirms the anomalies.
1) TGV1 is out of its group of température2) TGV 14 covers all the TGV of its group of
temperature
Open directions of research
Practice • Application to huge or very large data by
symbolic preprocessing taking care of categories.
• Text mining in order to extract themes describing classes of documents by Symbolic Data
Open directions of research
Theory • Galois Lattices are the underlying
structure.• Statistics: parametric or non parametric of
SDA (ex : density of interval data, or histogram data,..)
• Partioning, hierarchies, overlapping clustering (Pyramids), Conceptual or based on dissimilarities between SD.
CONCLUSION
• If you have standard units described by numerical and (or) categorical variables, these variables induce categories which can be considered as new units called “concepts”described by symbolic variables taking care of their internal variation. Then SDA can be applied on these new units in order to get complementary and enhancing results by extending standard analyis to symbolic analysis.
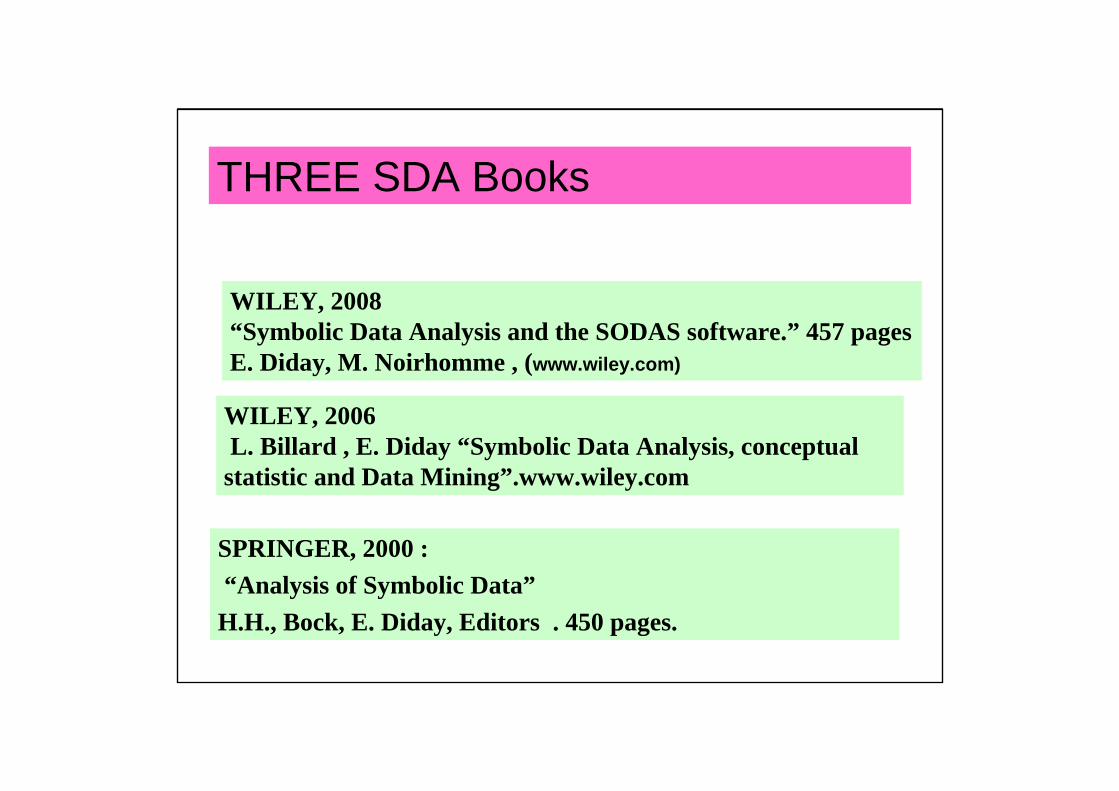
THREE SDA Books
SPRINGER, 2000 : “Analysis of Symbolic Data”
H.H., Bock, E. Diday, Editors . 450 pages.
WILEY, 2008 “Symbolic Data Analysis and the SODAS software.” 457 pagesE. Diday, M. Noirhomme , (www.wiley.com)
WILEY, 2006L. Billard , E. Diday “Symbolic Data Analysis, conceptual
statistic and Data Mining”.www.wiley.com