sweet et al._lter-ver5-2015

1
Shannan K. Sweet 1 , Ashley Asmus 2 , Matthew E. Rich 2 , John Wingfield 3 , Laura Gough 2 , Natalie T. Boelman 1 1 Lamont-Doherty Earth Observatory, Earth and Environmental Sciences, Columbia University, Palisades, NY; 2 Department of Biology, University of Texas at Arlington, Arlington, TX; 3 Department of Neurobiology, Physiology and Behavior, University of California at Davis, Davis, CA NDVI as a predictor of canopy arthropod biomass in the Alaskan arctic tundra * * in press at Ecological Applications: http://dx.doi.org/10.1890/14-0632.1 CONCLUSIONS The normalized difference vegetation index (NDVI) has become a widely adopted tool for detecting and quantifying spatial and temporal dynamics in tundra vegetation cover, productivity, and phenology. To our knowledge, the current study is the first to show that the NDVI has the potential to be similarly applied to consumer biomass in the arctic tundra. In this study, the NDVI was significantly correlated with spatial and temporal variation in canopy arthropod biomass among a variety of tundra vegetation communities (Fig. 3). This strong relationship led to the development of empirical models that accurately predicted arthropod biomass both across and within four distinct vegetation communities (Table 2, Fig. 4). Because our study included a variety of vegetation communities (Table 1) that cover a large percentage of the arctic foothills region of Alaska, as well as the entire arctic tundra biome, the overall model developed herein may be applicable across vast expanses of arctic tundra. To employ the community specific models, researchers should either: (1) make field-based measurements of the NDVI, or; (2) couple high spatial resolution air- or space-borne NDVI datasets with spatially explicit a priori information on vegetation community cover. With this a priori information, high spatial resolution NDVI datasets acquired by satellite sensors may be able to quantify spatial and temporal dynamics in tundra canopy arthropod biomass at landscape and regional scales. It is worth future investments to task airborne and spaceborne sensors with high spatial and temporal resolutions to acquire NDVI data in Arctic regions. This will help (1) validate our model and (2) work towards applying our current relationships at larger spatial scales. These next steps are particularly valuable for vast and remote arctic tundra regions where shifts in seasonality and vegetation characteristics are likely to impact arthropod communities, which in turn, could have cascading effects throughout the food web. ACKOWLEDGEMENTS Thank you TeamBird, the Institute of Arctic Biology, &Toolik Field Station. Funded by NSF Office of Polar Programs grants (ARC 0908444 and ARC 0908602). With the physical and biological responses to arctic warming proving acute, there is a need to monitor, understand, and predict ecological responses over large spatial and temporal scales. The normalized difference vegetation index (NDVI) has been used to addresses this need, as it is a widely adopted tool for detecting and quantifying spatial and temporal dynamics of tundra vegetation cover, productivity, and phenology. Such extensive use of the NDVI to quantify vegetation characteristics suggests that it may be similarly applied to characterizing consumer communities. BACKGROUND METHODS At four sites in arctic Alaska (Fig. 1), both within and across four vegetation commun- ities (Table 1), we established empirical relationships (Eq. 1, Table 2) over four growing seasons (late May to mid- to late July, 2010 - 2013) between: 1. Weekly near- surface, canopy- level NDVI (via surface reflectance of vegetation canopy) 2. Weekly canopy- dwelling arthropod biomass (via sweep net sampling of vegetation) Arthropod biomass (mg/m 2 ) was predicted (Eq. 1) using NDVI and parameters (α and β) specific to each vegetation community (Table 2) Fig. 1. Four field sites north of the Brooks Range, AK used in this study. (Eq. 1) Biomass = α * e (β * NDVI) RESULTS Fig 2. Weekly NDVI (open symbols & dashed lines – y-axes) and canopy arthropod biomass (filled symbols & solid lines – z-axes). Different lines represent different vegetation communities (Table 1): RST = riparian shrub tundra; EST = erect shrub tundra; DST = dwarf deciduous shrub tundra; and MTT = moist tussock tundra. Fig. 3. Exponential regression relationships between NDVI and measured canopy arthropod biomass for (a) all vegetation communities (y = 0.008e 8.835x ; R 2 = 0.76); (b) erect shrub (y = 0.004e 9.129x ; R 2 = 0.89) and riparian shrub tundra (y = 0.009e 10.16x ; R 2 = 0.95); and (c) moist tussock (y = 0.004e 10.37x ; R 2 = 0.79) and dwarf deciduous shrub tundra (y = 0.001e 11.95x ; R 2 = 0.84). Fig. 4. Predicted versus measured canopy arthropod biomass for (a) all vegetation communities (y = 0.75x + 0.87; R 2 = 0.63); (b) erect shrub (y = 1.11x + 0.41; R 2 = 0.82) and riparian shrub tundra (y = 1.11x – 0.12; R 2 = 0.84); and (c) moist tussock (y = 1.54x – 0.16; R 2 = 0.74) and dwarf deciduous shrub tundra (y = 1.05x + 0.06; R 2 = 0.87). Predicted biomass (x-axis) was determined using Eq. 1 and parameters in Table 2. Measured biomass (y-axis) was collected via sweep netting. Table 2. Number of quadrats (n), best-fit exponential regression parameters (α and β), root mean squared errors of prediction (RMSE), and R 2 values for the NDVI- canopy arthropod biomass relationships used to predict canopy arthropod biomass. THIS STUDY We developed empirical models to predict canopy arthropod biomass based on canopy-level measurements of the NDVI. We did this both across and within distinct tundra vegetation communities in the arctic tundra of Alaska. This research is a first step towards assessing the potential for datasets acquired by air and spaceborne sensors to quantify spatial and temporal dynamics in canopy arthropod biomass at landscape and regional scales. When canopy arthropod biomass was predicted with the NDVI across four growing seasons (2010 through 2013), our overall model, which included four distinct vegetation communities, explained 63% of the variance in canopy arthropod biomass. Each of our four vegetation community-specific models explained 74% (moist tussock tundra), 82% (erect shrub tundra), 84% (riparian shrub tundra), and 87% (dwarf shrub tundra) of the observed variation in canopy arthropod biomass. Seasonal Patterns of NDVI and Arthropod Biomass There was variation in both the NDVI and canopy arthropod biomass throughout the growing seasons (P < 0.001) and among vegetation communities (P < 0.001) (Fig. 2) NDVI-Arthropod Biomass Relationships Across all vegetation communities and time periods, 76% of the variance in measured arthropod biomass was explained by the NDVI (Fig. 3) When examining vegetation communities separately, relationships between the NDVI and measured arthropod biomass improved (Fig. 3): RST (R 2 = 0.95); EST (R 2 = 0.89); DST (R 2 = 0.84); and MTT (R 2 = 0.79) Arthropod Biomass Models The overall model was a fairly good predictor of arthropod biomass (R 2 = 0.63) (Table 2) Vegetation community-specific models were better predictors of arthropod biomass, with the best individual models being from DST (R 2 = 0.87) and RST (R 2 = 0.84) communities (Table 2) The largest variance in the predictive models tended to occur at higher arthropod biomasses (Fig. 4), which generally corresponded with NDVI > 0.6 (Fig. 3) Table 1. Descriptions of & aerial percentage cover of plants & surface materials in 1 m 2 quadrats (along pre-established transects) in vegetation communities used in this study

Upload: shannan-sweet

Post on 06-Aug-2015

16 views

Category:

Documents


0 download

TRANSCRIPT

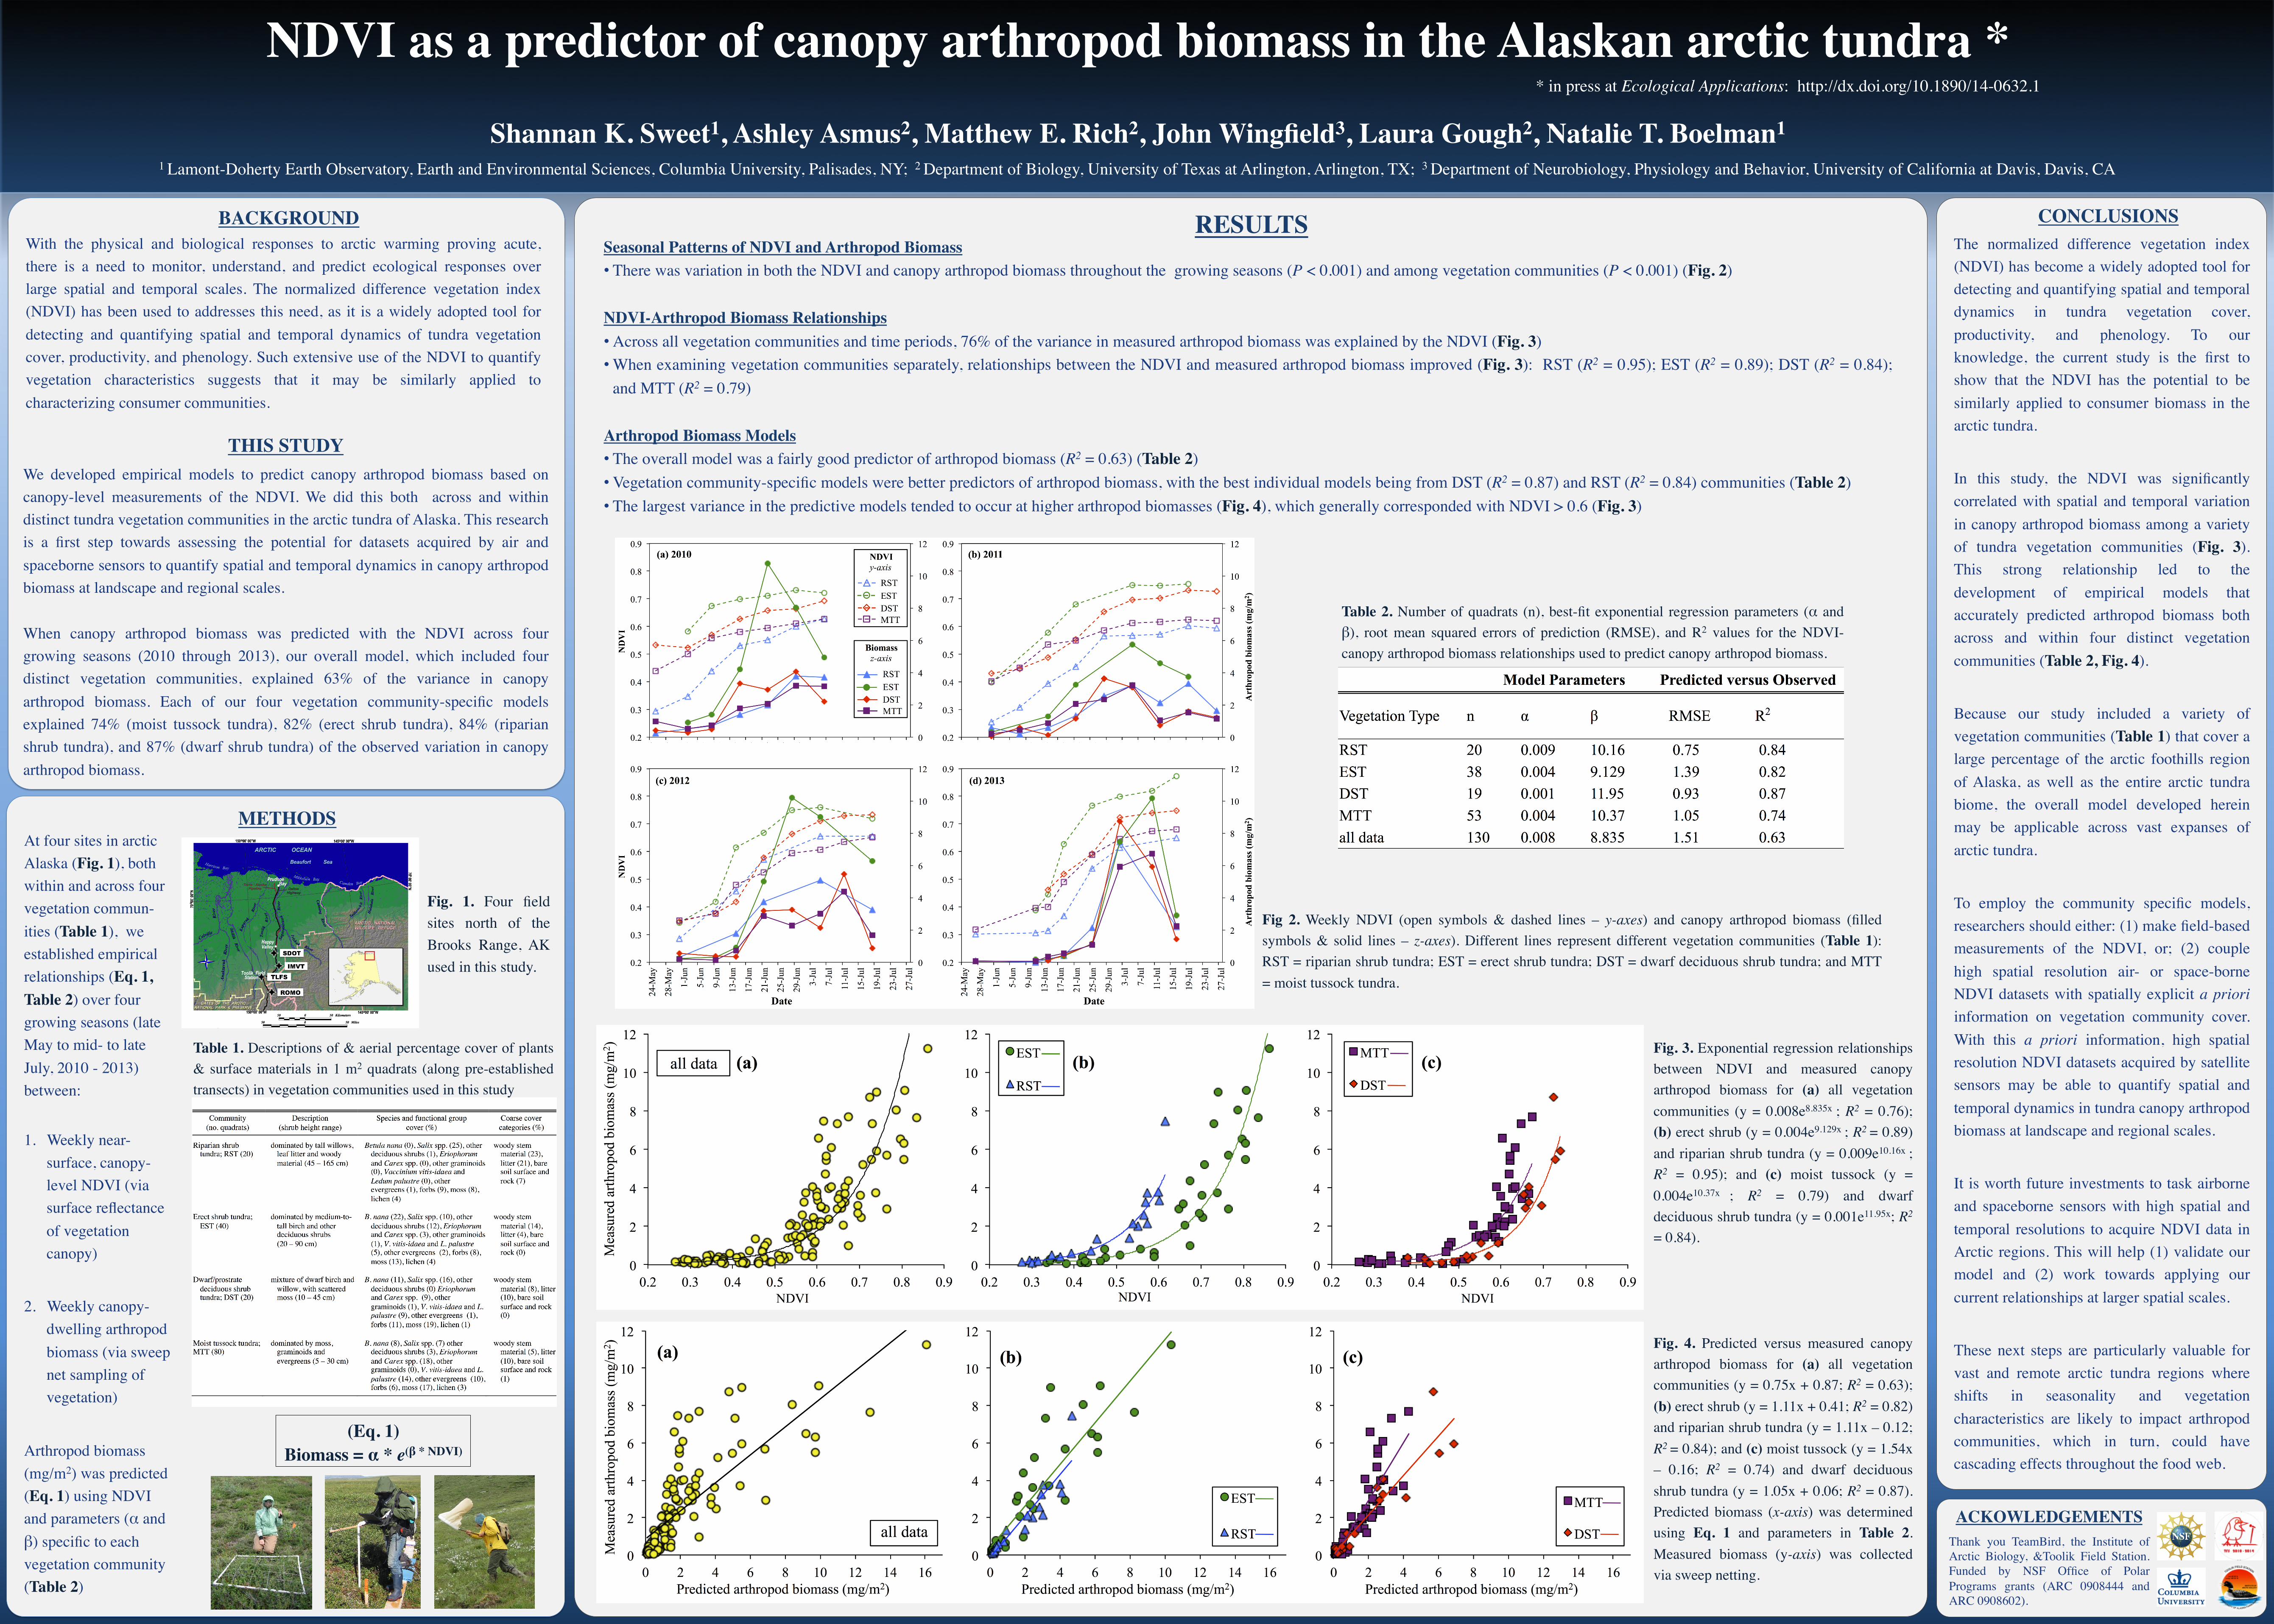
Shannan K. Sweet1, Ashley Asmus2, Matthew E. Rich2, John Wingfield3, Laura Gough2, Natalie T. Boelman1 1 Lamont-Doherty Earth Observatory, Earth and Environmental Sciences, Columbia University, Palisades, NY; 2 Department of Biology, University of Texas at Arlington, Arlington, TX; 3 Department of Neurobiology, Physiology and Behavior, University of California at Davis, Davis, CA

NDVI as a predictor of canopy arthropod biomass in the Alaskan arctic tundra * * in press at Ecological Applications: http://dx.doi.org/10.1890/14-0632.1

CONCLUSIONS The normalized difference vegetation index (NDVI) has become a widely adopted tool for detecting and quantifying spatial and temporal dynamics in tundra vegetation cover, productivity, and phenology. To our knowledge, the current study is the first to show that the NDVI has the potential to be similarly applied to consumer biomass in the arctic tundra. In this study, the NDVI was significantly correlated with spatial and temporal variation in canopy arthropod biomass among a variety of tundra vegetation communities (Fig. 3). This strong relationship led to the development of empirical models that accurately predicted arthropod biomass both across and within four distinct vegetation communities (Table 2, Fig. 4). Because our study included a variety of vegetation communities (Table 1) that cover a large percentage of the arctic foothills region of Alaska, as well as the entire arctic tundra biome, the overall model developed herein may be applicable across vast expanses of arctic tundra. To employ the community specific models, researchers should either: (1) make field-based measurements of the NDVI, or; (2) couple high spatial resolution air- or space-borne NDVI datasets with spatially explicit a priori information on vegetation community cover. With this a priori information, high spatial resolution NDVI datasets acquired by satellite sensors may be able to quantify spatial and temporal dynamics in tundra canopy arthropod biomass at landscape and regional scales. It is worth future investments to task airborne and spaceborne sensors with high spatial and temporal resolutions to acquire NDVI data in Arctic regions. This will help (1) validate our model and (2) work towards applying our current relationships at larger spatial scales. These next steps are particularly valuable for vast and remote arctic tundra regions where shifts in seasonality and vegetation characteristics are likely to impact arthropod communities, which in turn, could have cascading effects throughout the food web.

ACKOWLEDGEMENTS Thank you TeamBird, the Institute of Arctic Biology, &Toolik Field Station. Funded by NSF Office of Polar Programs grants (ARC 0908444 and ARC 0908602).

With the physical and biological responses to arctic warming proving acute, there is a need to monitor, understand, and predict ecological responses over large spatial and temporal scales. The normalized difference vegetation index (NDVI) has been used to addresses this need, as it is a widely adopted tool for detecting and quantifying spatial and temporal dynamics of tundra vegetation cover, productivity, and phenology. Such extensive use of the NDVI to quantify vegetation characteristics suggests that it may be similarly applied to characterizing consumer communities.

BACKGROUND

METHODS At four sites in arctic Alaska (Fig. 1), both within and across four vegetation commun-ities (Table 1), we established empirical relationships (Eq. 1, Table 2) over four growing seasons (late May to mid- to late July, 2010 - 2013) between:

1.  Weekly near-surface, canopy-level NDVI (via surface reflectance of vegetation canopy)

2.  Weekly canopy-dwelling arthropod biomass (via sweep net sampling of vegetation)

Arthropod biomass (mg/m2) was predicted (Eq. 1) using NDVI and parameters (α and β) specific to each vegetation community (Table 2)

Fig. 1. Four field sites north of the Brooks Range, AK used in this study.

(Eq. 1) Biomass = α * e(β * NDVI)

RESULTS

Fig 2. Weekly NDVI (open symbols & dashed lines – y-axes) and canopy arthropod biomass (filled symbols & solid lines – z-axes). Different lines represent different vegetation communities (Table 1): RST = riparian shrub tundra; EST = erect shrub tundra; DST = dwarf deciduous shrub tundra; and MTT = moist tussock tundra.

Fig. 3. Exponential regression relationships between NDVI and measured canopy arthropod biomass for (a) all vegetation communities (y = 0.008e8.835x ; R2 = 0.76); (b) erect shrub (y = 0.004e9.129x ; R2 = 0.89) and riparian shrub tundra (y = 0.009e10.16x ; R2 = 0.95); and (c) moist tussock (y = 0.004e10.37x ; R2 = 0.79) and dwarf deciduous shrub tundra (y = 0.001e11.95x; R2 = 0.84).

Fig. 4. Predicted versus measured canopy arthropod biomass for (a) all vegetation communities (y = 0.75x + 0.87; R2 = 0.63); (b) erect shrub (y = 1.11x + 0.41; R2 = 0.82) and riparian shrub tundra (y = 1.11x – 0.12; R2 = 0.84); and (c) moist tussock (y = 1.54x – 0.16; R2 = 0.74) and dwarf deciduous shrub tundra (y = 1.05x + 0.06; R2 = 0.87). Predicted biomass (x-axis) was determined using Eq. 1 and parameters in Table 2. Measured biomass (y-axis) was collected via sweep netting.

Table 2. Number of quadrats (n), best-fit exponential regression parameters (α and β), root mean squared errors of prediction (RMSE), and R2 values for the NDVI-canopy arthropod biomass relationships used to predict canopy arthropod biomass.

THIS STUDY We developed empirical models to predict canopy arthropod biomass based on canopy-level measurements of the NDVI. We did this both across and within distinct tundra vegetation communities in the arctic tundra of Alaska. This research is a first step towards assessing the potential for datasets acquired by air and spaceborne sensors to quantify spatial and temporal dynamics in canopy arthropod biomass at landscape and regional scales. When canopy arthropod biomass was predicted with the NDVI across four growing seasons (2010 through 2013), our overall model, which included four distinct vegetation communities, explained 63% of the variance in canopy arthropod biomass. Each of our four vegetation community-specific models explained 74% (moist tussock tundra), 82% (erect shrub tundra), 84% (riparian shrub tundra), and 87% (dwarf shrub tundra) of the observed variation in canopy arthropod biomass.

Seasonal Patterns of NDVI and Arthropod Biomass • There was variation in both the NDVI and canopy arthropod biomass throughout the growing seasons (P < 0.001) and among vegetation communities (P < 0.001) (Fig. 2)

NDVI-Arthropod Biomass Relationships • Across all vegetation communities and time periods, 76% of the variance in measured arthropod biomass was explained by the NDVI (Fig. 3) • When examining vegetation communities separately, relationships between the NDVI and measured arthropod biomass improved (Fig. 3): RST (R2 = 0.95); EST (R2 = 0.89); DST (R2 = 0.84);

and MTT (R2 = 0.79)

Arthropod Biomass Models • The overall model was a fairly good predictor of arthropod biomass (R2 = 0.63) (Table 2) • Vegetation community-specific models were better predictors of arthropod biomass, with the best individual models being from DST (R2 = 0.87) and RST (R2 = 0.84) communities (Table 2) • The largest variance in the predictive models tended to occur at higher arthropod biomasses (Fig. 4), which generally corresponded with NDVI > 0.6 (Fig. 3)

Table 1. Descriptions of & aerial percentage cover of plants & surface materials in 1 m2 quadrats (along pre-established transects) in vegetation communities used in this study