swath mode altimetry - esa...
TRANSCRIPT

1ESA CTC16 - Earth Observation, Swath altimetry, N. Gourmelen, September 2016
Swath Mode Altimetry
Noel Gourmelen

2ESA CTC16 - Earth Observation, Swath altimetry, N. Gourmelen, September 2016
Outline
Background
Impact case studies:
Topography Rates of surface elevation change

3ESA CTC16 - Earth Observation, Swath altimetry, N. Gourmelen, September 2016
Products and applications of radar altimetry over Ice Sheet, Ice Caps, Glaciers:
Surface elevation Scattering mechanism Surface roughness Digital elevation models Rates of surface elevation change Ice Sheet mass balance Surface Mass Balance Ice dynamics (e.g. surges) Sub-glacial lakes detection Supra-glacial lakes detection …

4ESA CTC16 - Earth Observation, Swath altimetry, N. Gourmelen, September 2016
POCA

5ESA CTC16 - Earth Observation, Swath altimetry, N. Gourmelen, September 2016
POCA is only a small sample of the data acquiredBeam limited footprint
For CryoSat: h ~ 730 km ϑ =1.08° in along-track ϑ = 1.20° in across-track
• width in along-track ~ 13.8 km • width in across-track ~ 15.3 km

6ESA CTC16 - Earth Observation, Swath altimetry, N. Gourmelen, September 2016
POCA is only a small sample of the data acquired
Pulse-limited footprint
Time
Pow
er
For CryoSat: 2r = 1.65km

7ESA CTC16 - Earth Observation, Swath altimetry, N. Gourmelen, September 2016
POCA is only a small sample of the data acquired
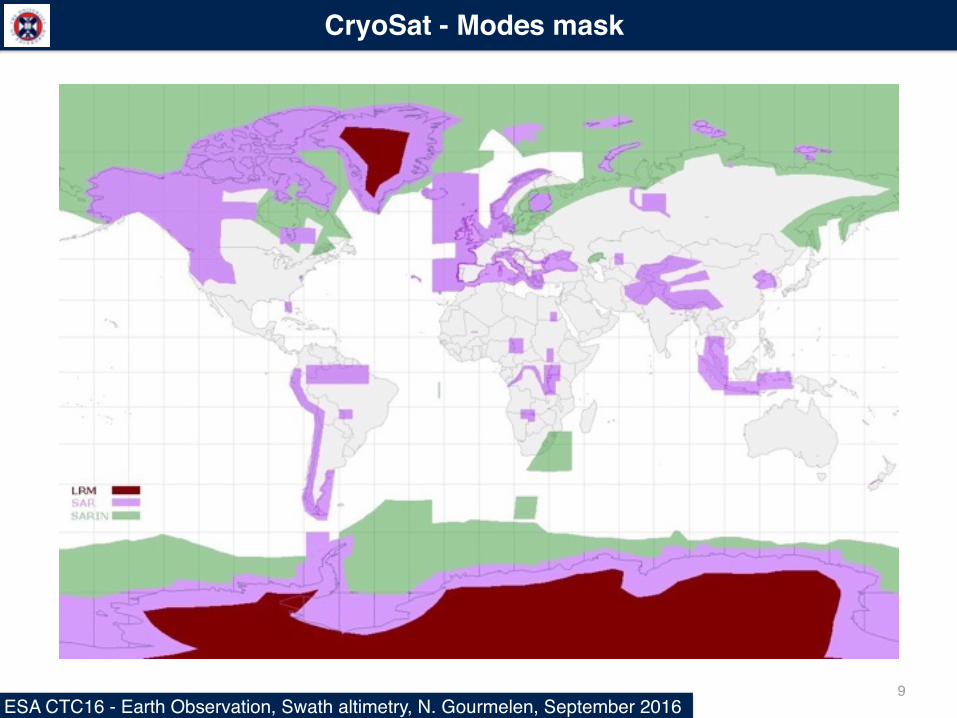
SARLRM
CryoSat - Improved spatial resolution

8ESA CTC16 - Earth Observation, Swath altimetry, N. Gourmelen, September 2016
POCA is only a small sample of the data acquired
Interferometric mode (SARIn)
CryoSat - Improved echo localisation
9ESA CTC16 - Earth Observation, Swath altimetry, N. Gourmelen, September 2016
CryoSat - Modes mask

10ESA CTC16 - Earth Observation, Swath altimetry, N. Gourmelen, September 2016
Wingham et al., 2006
Elevation at POCA Elevation swath along the across track direction
Single measurement vs full waveform,POCA elevation vs Swath elevation
Ice surface
Swath echoes
Cryosat platform
Main
Beam
Θ
R
POCA echo
B
5 km

11ESA CTC16 - Earth Observation, Swath altimetry, N. Gourmelen, September 2016
Strategy
Quality filter (coh, power)
Local phase unwrapping
Global phase correction
Phase smoothing
Final Lon, Lat, Elev
SARIn CSL1b data
L2Swath product
External DEM
Computation ofLon , Lat, Elev

12ESA CTC16 - Earth Observation, Swath altimetry, N. Gourmelen, September 2016
Swath altimetryAustfonna Ice cap, Svalbard
Elev
atio
n (m
)
Swath width of ~5 km 1 to 2 orders of magnitude more elevation than POCA

13ESA CTC16 - Earth Observation, Swath altimetry, N. Gourmelen, September 2016
Ground track spacing
At the equator: ERS: 90 km ; IceSat: 14.5 kmCryoSat: 7.5 km (~4km at 60o of latitude)
Ground tracks
Wingham et al., 2006

14ESA CTC16 - Earth Observation, Swath altimetry, N. Gourmelen, September 2016
Spatial coverage
Vatnajokul ice cap
POCA
Swath

ESA CTC16 - Earth Observation, Swath altimetry, N. Gourmelen, September 2016 15
0 1800Elevation (m)
Spatial coverage
Petermann Glacier

ESA CTC16 - Earth Observation, Swath altimetry, N. Gourmelen, September 2016
Swath allows near continuous spatial coverage

ESA CTC16 - Earth Observation, Swath altimetry, N. Gourmelen, September 2016
Surface topography

18ESA CTC16 - Earth Observation, Swath altimetry, N. Gourmelen, September 2016
Spatial coverage - Gridded product
Amundsen Sea Sector (1 km posting)
Average for L2 at 5km posting: 30 [McMillan et al., 2013]
Deriving rates of surface elevation change and topography 1. Group data in grid cells 2. Solve a model of the type: Z(x,y,t)=ax+by+c+dt , where topography, Z, local terrain slope, (x, y), and rates of surface elevation change, dt, are conjointly resolved

ESA CTC16 - Earth Observation, Swath altimetry, N. Gourmelen, September 2016
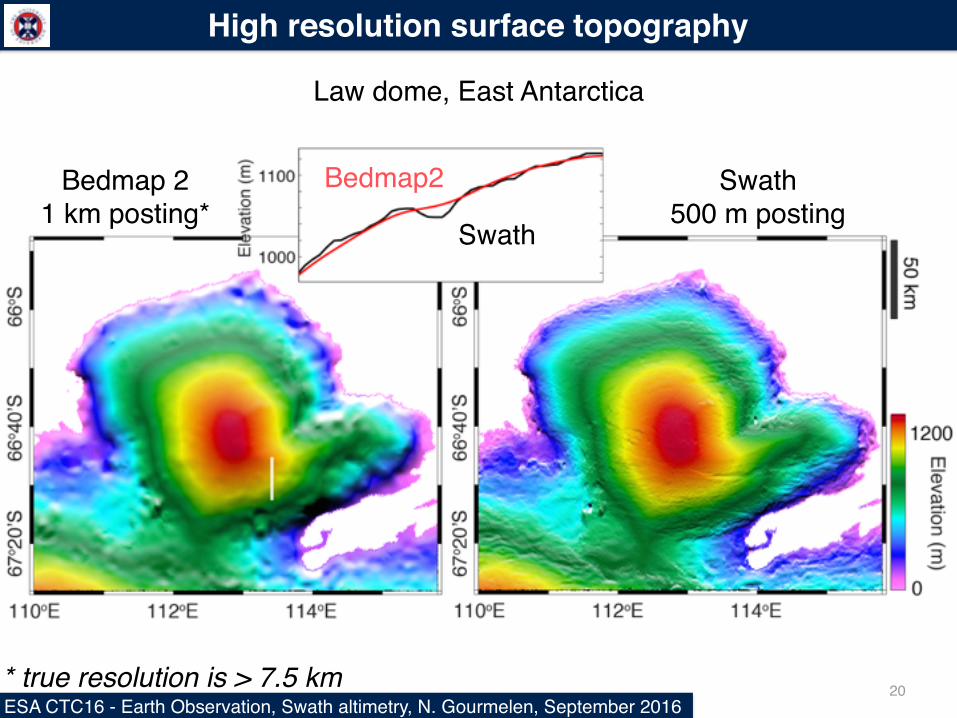
High resolution surface topography
Law dome, East Antarctica
20ESA CTC16 - Earth Observation, Swath altimetry, N. Gourmelen, September 2016
High resolution surface topography
Law dome, East Antarctica
Bedmap 21 km posting*
Swath500 m posting
Swath
Bedmap2
* true resolution is > 7.5 km

21ESA CTC16 - Earth Observation, Swath altimetry, N. Gourmelen, September 2016
High resolution surface topography
Surface topographyBed topography
Law dome, East Antarctica

22ESA CTC16 - Earth Observation, Swath altimetry, N. Gourmelen, September 2016
High resolution surface topography
Elevation difference with Ice Bridge ATM:-1.2 ± 2 m.yr-1

23ESA CTC16 - Earth Observation, Swath altimetry, N. Gourmelen, September 2016
23
Best currently available DEM products
IceSat DEM (Greenland & Antarctica)
- 1km posting (real resolution ~ 7.5 km on average elsewhere)- for slopes <0.1°: mean difference is
1 ±5 m; - for regions 0.1°<slope<1.0° slopes,
the mean difference is -24 ±20 m
GIMPDEM (Greenland)
- 30m posting (only on the margins, ~ 7.5km on average elsewhere)- RMSE with IceSAT DEM, compared on grid of 10km bin size > 100m

24ESA CTC16 - Earth Observation, Swath altimetry, N. Gourmelen, September 2016
Reference Bias (m) Dispersion (m)
(L2) [RD1] Greenland
(below 2200m)
3.95 133.6
(L2) [RD2] Cook Antarctic lake -1.5 0.9
CryoVal RR Jackobshavn -0.15 to +0.41 2.44 to 2.76
Region L2swath/L2
Bias (m)
L2swath/L2
Dispersion (m)
L2swath/L2
Number of measures
(106)
Gain in spatial
resolution
Petermann -1.3/-1.1 1.2/0.8 44.9/1.4 5 folds
Jackobshavn -1.2/-0.6 2.0/1.4 99.9/1.0 10 folds
Amundsen Sea Sector -1.7/-1.1 2.0/1.3 199.3/3.3 8 folds
Measurements accuracy and densityL2swath versus L2 - CryoTop study
L2 - other studies
RD1: Helm, V., Humbert, A. and Miller, H., 2014, Elevation and elevation change of Greenland and Antarctica derived from CryoSat-2, The Cryosphere, 8, 1539–1559, 2014 www.the-cryosphere.net/8/1539/2014/ doi:10.5194/tc-8-1539-2014
RD2: McMillan, M, Shepherd, A, Corr, H, Ridout, A, Laxon, S and Cullen, R., 2013, Three-dimensional mapping by CryoSat-2 of subglacial lake volume changes. Geophysical Research Letters, 40 (16). 4321 – 4327, http://dx.doi.org/10.1002/grl.50689
25ESA CTC16 - Earth Observation, Swath altimetry, N. Gourmelen, September 2016
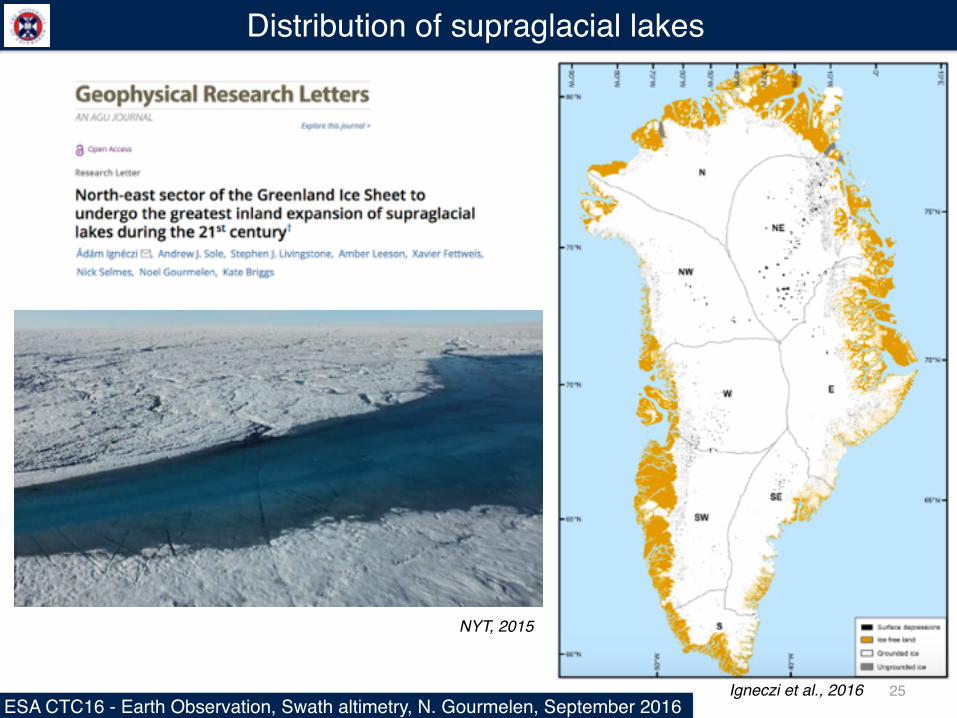
Distribution of supraglacial lakes
Igneczi et al., 2016
NYT, 2015

ESA CTC16 - Earth Observation, Swath altimetry, N. Gourmelen, September 2016
Rates of surface elevation change

27ESA CTC16 - Earth Observation, Swath altimetry, N. Gourmelen, September 2016
Surface elevation change
PIG
Thwaites
Helm et al., 2014
CryoSat, ‘POCA’ solution at 1km posting
Pritchard et al., 2009
Swath - 500 m posting[2010-2014]
Amundsen Sea Sector

28ESA CTC16 - Earth Observation, Swath altimetry, N. Gourmelen, September 2016
Swath: bias: 0.10 m.yr-1 dispersion: 0.93 m.yr-1
POCA: bias: 0.40 m.yr-1 dispersion: 0.76 m.yr-1
Surface elevation change - Amundsen Sea Sector
POCA minus ATMSWATH minus ATM
Rate of elevation change difference (m.yr-1)
Coun
t
120
80
40
-10 100-5 5

29ESA CTC16 - Earth Observation, Swath altimetry, N. Gourmelen, September 2016
Surface elevation change - Vatnajokul Ice Cap, Iceland
Icesat rates of surface elevation change
J. Nilsson et al.: Mass change in Arctic ice caps and glaciers 143
Figure 1. Spatial patterns of elevation changes of the five regions in the form of the satellite ground track coverage.
The least-squares collocation error associated with M1and M2 is estimated by computing the standard deviation ofthe data around every prediction point according to Moritz.(1978). The mean value of these standard deviations is usedas the interpolation error, and the standard error is computedin the same way as in the elevation change procedure:
"int =�intp
N, (5)
where �int is the mean standard deviation from the collo-cation prediction of the data inside the glaciated area.We quantify the parametrization error from the fitting of
the polynomial function used in M2 and M3 by calculatingthe root-mean-square error (RMSE) between the original el-
evation change estimates and the predicted values:
"fit =�fitp
N � D, (6)
where �fit is the RMSE between the origi-nal and predicted data, and
pN � D is the ad-
justment due to the degree of the polynomial.The extrapolation error, "ext, relevant for method M3,is quantified by the same approach as used in Nuth etal. (2010), with the extrapolation error being the root-sum-square (RSS) difference of the fitted error minus theelevation change error:
"ext =q
"2fit� "2dh/dt . (7)
www.the-cryosphere.net/9/139/2015/ The Cryosphere, 9, 139–150, 2015
[Nilsson et al., 2015]

30ESA CTC16 - Earth Observation, Swath altimetry, N. Gourmelen, September 2016
Foresta et al., 2016
Surface elevation change - Vatnajokul Ice Cap, Iceland
CryoSat, ‘POCA’ solution

31ESA CTC16 - Earth Observation, Swath altimetry, N. Gourmelen, September 2016
Foresta et al., 2016
Surface elevation change - Vatnajokul Ice Cap, Iceland
CryoSat, ‘Swath’ solution

32ESA CTC16 - Earth Observation, Swath altimetry, N. Gourmelen, September 2016
Temporal coverage
0 50 100 150 200 250 300 350
5
10
15
20
25
30
35
40
45
Time series interval (days)
N-fo
ld in
crea
se
5 km posting2 km posting1 km posting0.5 km posting
CryoSat repeat cycles: 369 days with 30 day sub-cycle

33ESA CTC16 - Earth Observation, Swath altimetry, N. Gourmelen, September 2016
33
Ice subsides above the caldera
Small scale, rapid, elevation change

34ESA CTC16 - Earth Observation, Swath altimetry, N. Gourmelen, September 2016
34
January April July October January
−40
−30
−20
−10
0
10
Time in 2014 (month)
Dis
plac
emen
t (m
)64.6 64.62 64.64 64.66
−40
−30
−20
−10
0
10
Dis
plac
emen
t (m
)
Latitude
A A’
Elev
atio
n ch
ange
(m)
Elev
atio
n ch
ange
(m)
Small scale, rapid, elevation change

35ESA CTC16 - Earth Observation, Swath altimetry, N. Gourmelen, September 2016
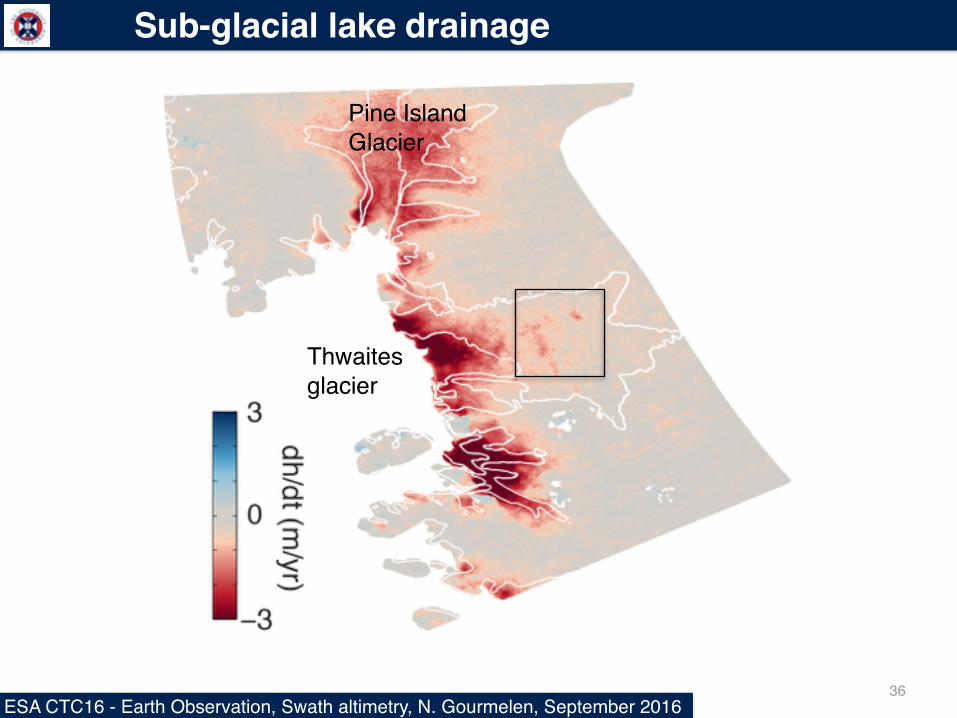
Sub-glacial lake drainage
Zina Deretsky / NSF
36ESA CTC16 - Earth Observation, Swath altimetry, N. Gourmelen, September 2016
Sub-glacial lake drainage
Thwaites glacier
Pine Island Glacier

37ESA CTC16 - Earth Observation, Swath altimetry, N. Gourmelen, September 2016
Subglacial lake drainage at Thwaites glacier
0
-4
-8
-12
20 km77
o S76
o 40’S
76o 20
’S
108o30’W 107o30’W 106o30’W 105o30’W
Smith et al., TCD, 2016

38ESA CTC16 - Earth Observation, Swath altimetry, N. Gourmelen, September 2016
Thwaites glacier - subglacial lakes
POCA Swath
Smith et al., TCD, 2016

39ESA CTC16 - Earth Observation, Swath altimetry, N. Gourmelen, September 2016
Radar altimeters ‘blind spot’
Pulse limited footprint
‘Shadow region’

40ESA CTC16 - Earth Observation, Swath altimetry, N. Gourmelen, September 2016
McMillan et al., 2013
Thwaites glacier - subglacial lakes
POCA Swath
Smith et al., TCD, 2016
POCA underestimate volume change by 30%

ESA CTC16 - Earth Observation, Swath altimetry, N. Gourmelen, September 2016
Cryotop Evolution projecthttp://cryotop-evolution.org/
Products (2017):
• 1. Swath elevation
• 2. DEM (500m resolution)
• 3. DhDT (500m resolution)
• 4. Experimental productsGrounding lineSubglacial lakesCalving front positionIce shelf thickness
0
-4
-8
-12
20 km
77o S
76o 40
’S76
o 20’S
108o30’W 107o30’W 106o30’W 105o30’W
1.
2.
3.
4.

42ESA CTC16 - Earth Observation, Swath altimetry, N. Gourmelen, September 2016