sustainable enrollment management: a dynamic network analysis
TRANSCRIPT

Clemson UniversityTigerPrints
All Dissertations Dissertations
8-2016
Sustainable Enrollment Management: A DynamicNetwork AnalysisForrest Murray StuartClemson University
Follow this and additional works at: https://tigerprints.clemson.edu/all_dissertations
This Dissertation is brought to you for free and open access by the Dissertations at TigerPrints. It has been accepted for inclusion in All Dissertations byan authorized administrator of TigerPrints. For more information, please contact [email protected].
Recommended CitationStuart, Forrest Murray, "Sustainable Enrollment Management: A Dynamic Network Analysis" (2016). All Dissertations. 1697.https://tigerprints.clemson.edu/all_dissertations/1697

SUSTAINABLE ENROLLMENT MANAGEMENT:
A DYNAMIC NETWORK ANALYSIS
A Dissertation
Presented to
the Graduate School of
Clemson University
In Partial Fulfillment
of the Requirements for the Degree
Doctor of Philosophy
Educational Leadership
by
Forrest Murray Stuart
August 2016
Accepted by:
Dr. Russ Marion, Committee Chair
Dr. Jon Christiansen
Dr. Robert Knoeppel
Dr. James Satterfield

ii
ABSTRACT
The primary purpose of this study was to investigate higher education enrollment
management (EM) as a complex adaptive system (CAS) and to provide colleges and
universities a foundational understanding of what a sustainable EM system looks like
from a Dynamic Network Analysis (DNA) perspective. Additionally, I aimed to describe
how formal network structures either promote or inhibit sustainable EM. To this end, the
following research questions guided this study:
1. To what extent is the research site organized to enable effective and efficient
information flow?
2. Which combinations of independent network measures (adaptive leadership,
social capital, and clique structure) produce optimal outcome measures for a
sustainable EM system?
The research design was an exploratory, sequential mixed methods design, and
the research methodologies used for data analysis were DNA and Response Surface
Methods (RSM). Two online surveys were used to collect data about the network
structure of the EM research site (referred to in the study as Midwestern University or
MU), and those data were conditioned and analyzed in order to determine what levels of
independent network measures (adaptive leadership, resource capability, and clique
structure) produced optimal levels of information flow operationalized using the
dependent network measure, average speed.
The results showed that the greatest stability in information flow holds resource
capability at a constant high level (0.781) with clustering and closeness centrality at

iii
average levels (0.255 and 0.396, respectively). Resource capability was the main factor
influencing the average speed of information flow; clustering had no significant impact.
These results suggested that easy access to resources (a high level of social
capital)—regardless of the level of adaptive leadership (closeness centrality) or clique
structure (clustering coefficient)—was extremely important for the EM system to sustain
itself (and ultimately, the institution) regardless of changes and pressures from within and
from outside of the current environment.

iv
DEDICATION
I dedicate this work to my wife, Pam, and to my two daughters, Emily and
Katelyn. I also dedicate this work to Clyde Walker, a dear friend of mine who
encouraged me as I was taking coursework, yet did not live to see me complete what I
had started.
v
ACKNOWLEDGEMENTS
Obtaining a PhD is about perseverance, and that quality does not come without
support from others. The following people were instrumental in this journey.
First and foremost—without question—is my wife, Pam, and my two incredible
daughters, Emily and Katelyn. Your encouragement and support over the five years that
that I have taken classes, gone to the library (especially on Saturday mornings), and, at
times, seemed more concerned about my research than family time, were the pillars for
my success. Thank you, thank you, thank you. I love you all more than you will ever
know.
Second, my eternal gratitude lies with my parents. My mother has always been a
cheerleader for me, and she continues to support me in all that I do. Although my dad did
not live long enough to see me graduate, I know he is proud nonetheless. I love you both
more than I can put into words.
Third, Dr. Russ Marion stepped in to be my major advisor toward the end of my
program, mainly because my research interests had changed. I remember arguing about
how entity-based leadership is the best style of leadership, and all of this bottom-up stuff
that Dr. Marion supported in EDL 905 was just a fad. Well, I was wrong. And, Dr.
Marion’s patience with me as I learned an entirely new branch of research was never
ending. Through this dissertation, I have merged my passion for enrollment management
with a completely new way of understanding what a sustainable enrollment management
system is and how it can be empirically studied.

vi
Fourth, Dr. Jon Christiansen has become not only a mentor, but a colleague and
friend. I look forward to developing a working relationship as we tackle the continually
vexing problems that institutions have with enrollment management and the structures
therein. Though you harass me about my love for, and devotion to, the Crimson Tide, I
will proudly display the Clemson University flag on our house as I am now a product of
this great university.
Fifth, my thanks to Dr. Rob Knoeppel, whom I will fondly refer to as a
“Philiconomist.” I always enjoyed our conversations about the economics and finance of
education in America, and I especially enjoyed the more philosophical questions we
raised and discussed sitting in your office, whether or not those questions dealt directly
with economics.
Sixth, Dr. James Satterfield has been with me since the beginning. Not only have
I enjoyed your classes, but I appreciate the opportunity you allowed for me to “take over”
some classes that focused on private higher education financing, endowments, etc. I hate
that you are leaving Clemson, but I wish you and your family the best in your new city
and institution.
Finally, I would be remiss if I did not thank Furman University for the flexibility
to start and finish my doctorate while also working full time. Perhaps the best advice
came from Dr. Elizabeth Davis, president of Furman University: “Just make sure you are
the last man standing at your defense.”

vii
TABLE OF CONTENTS
Page
TITLE PAGE .................................................................................................................... i
ABSTRACT ..................................................................................................................... ii
DEDICATION ................................................................................................................ iv
ACKNOWLEDGEMENTS ............................................................................................. v
LIST OF TABLES ........................................................................................................... x
LIST OF FIGURES ........................................................................................................ xi
CHAPTER
I. INTRODUCTION ......................................................................................... 1
Background of Study ................................................................... 1
Statement of Problem ................................................................... 2
Purpose of the Study .................................................................... 2
Significance of the Study ............................................................. 5
Definition of Terms...................................................................... 5
Theoretical Framework ................................................................ 6
Research Questions ...................................................................... 8
Limitations ................................................................................... 8
Assumptions ................................................................................. 8
Organization of the Study ............................................................ 9
II. THE REVIEW OF LITERATURE ............................................................. 10
Enrollment Management ............................................................ 11
Sustainability.............................................................................. 19
Collectivism ............................................................................... 20
Theoretical Frameworks ............................................................ 22
Leadership Concepts .................................................................. 30
Clique Structure ......................................................................... 37
Social Capital ............................................................................. 37

viii
Table of Contents (Continued)
Page
Information Flow ....................................................................... 38
Networks .................................................................................... 40
Summary .................................................................................... 42
III. METHODOLOGY ...................................................................................... 43
Research Design......................................................................... 44
Ethical Considerations ............................................................... 46
Role of the Researcher ............................................................... 46
Setting ........................................................................................ 47
Selection of Participants ............................................................ 48
Data Collection .......................................................................... 49
Software ..................................................................................... 51
Data Analysis ............................................................................. 51
Summary .................................................................................... 58
IV. FINDINGS ................................................................................................... 60
Research Method and Site ......................................................... 63
Descriptive Statistics and Network Typology ........................... 64
Network Visualization ............................................................... 75
Determining Sustainable Enrollment Management ................... 81
Response Surface Methodology ................................................ 84
Response Surface Plots .............................................................. 86
Summary .................................................................................... 95
V. SUMMARY, DISCUSSION, AND CONCLUSIONS ................................ 96
Research Question 1 .................................................................. 98
Research Question 2 ................................................................ 100
Discussion ................................................................................ 101
Implications for Practice .......................................................... 106
Implications for Further Research ........................................... 108

ix
Table of Contents (Continued)
Page
APPENDICES ............................................................................................................. 110
A. Informed Consent............................................................................................. 111
B. Survey 1 ........................................................................................................... 114
C. Survey 2 ........................................................................................................... 116
D. IRB Notice of Approval ................................................................................... 143
REFERENCES ............................................................................................................ 144

x
LIST OF TABLES
Table Page
3.1 Sample Categories for the Response Scale for Knowledge ......................... 50
3.2 Meta-Matrix for Organizational Design ...................................................... 53
3.3 Network Measures ....................................................................................... 54
3.4 Agent x Agent Matrix in Binary Form ........................................................ 55
3.5 Optimization Outcomes ............................................................................... 58
4.1 Network Measures ....................................................................................... 61
4.2 Descriptives of Participants ......................................................................... 65
4.3 Meta-Network Statistics............................................................................... 66
4.4 Nodeset Counts per Network ....................................................................... 67
4.5 Key Entities Report for Meta-Network........................................................ 67
4.6 Key Entities Report: Degree Centrality by Node ........................................ 68
4.7 Key Entities Report: Closeness Centrality by EM Agent ............................ 69
4.8 Key Entities Report: Most Knowledge by EM Agent ................................. 70
4.9 Key Entities Report: Most Resource by EM Agent ..................................... 71
4.10 Key Entities Report: Most Agent by Role ................................................... 72
4.11 Key Entities Report: Most Agent by Knowledge ........................................ 74
4.12 Immediate Impact ........................................................................................ 77
4.13 Network Measures: Current State ................................................................ 82
4.14 Optimization Outcomes ............................................................................... 84
4.15 Results of Box-Behnken Analysis ............................................................... 86

xi
LIST OF FIGURES
Figure Page
1.1 Independent Units Within Enrollment Management ..................................... 3
1.2 Interdependent Enrollment Management System .......................................... 4
2.1 Recruitment Funnel ...................................................................................... 14
2.2 Retention Funnel .......................................................................................... 16
2.3 Strategic Enrollment Management Funnel .................................................. 18
2.4 Simple Network ........................................................................................... 40
3.1 Exploratory Sequential Mixed Methods Design .......................................... 46
4.1 Visualization of MU’s Meta-Network ......................................................... 75
4.2 MU’s Enrollment Management Agent x Agent Network ............................ 76
4.3 Community Structure as Calculated by Newman’s Grouping ..................... 78
4.4 Newman’s Grouping by Formal/Informal Leader ....................................... 79
4.5 Clusters by Office ........................................................................................ 80
4.6 Agent Nodes Colored by Closeness Centrality ............................................ 81
4.7 Box-Behnken Surface Plot: Holding Clustering at 0.294 ............................ 87
4.8 Contour Plot: Holding Clustering at 0.294 .................................................. 88
4.9 Box-Behnken Surface Plot: Clustering Coefficient at 0.217 ....................... 89
4.10 Contour Plot: Holding Clustering Coefficient at 0.217 ............................... 90
4.11 Box-Behnken Surface Plot: Holding Resource Capability at 0.361 ............ 91
4.12 Contour Plot: Holding Resource Capability at 0.361 .................................. 92
4.13 Box-Behnken Surface Plot: Resource Capability at 0.781 .......................... 93

xii
List of Figures (continued)
Figure Page
4.14 Contour Plot: Holding Resource Capability at 0.781 .................................. 94
5.1 Box-Behnken Surface Plot: Resouce Capability 0.781 ............................. 103
5.2 Contour Plot: Holding Resource Capability at 0.781 ................................ 104
5.3 Box-Behnken Surface Plot: Resouce Capability 0.361 ............................. 105
5.4 Contour Plot: Holding Resource Capability at 0.361 ................................ 106

1
CHAPTER ONE
INTRODUCTION
Background of Study
Enrollment management (EM) focuses on enrolling and retaining students who,
quite frankly, are the lifeblood of higher education institutions. Without students, the
institution has no purpose. While some view EM as the purview of the Office of
Admission, others suggest a much more expansive role (Huddleston, 2000). Henderson
(2001) stated that EM often resembles offices that act independently and at cross-
purposes. To this point, previous EM literature focused on the organization of formal EM
Departments, such as who reported to whom. According to Kemerer, Baldridge, and
Green (1982), these structures are usually created when a significant problem or crisis
occurs. However, creating the structures in response to problems tends to exacerbate the
problems (Black, 2004). Besides little focus on EM aspects outside of organizational
structure, the theoretical foundation to explain the practice of EM is limited.
Hossler and Hoezee (2001) reported that the two dominant theories historically
applied to explain the activities of EM programs in higher education include resource
dependency theory and systems theory. I propose that complexity theory and network
theory, which are not found in the EM literature, can enable researchers to understand
EM from new, more powerful perspectives.

2
Statement of the Problem
Despite Huddleston’s (2000) call to operationalize EM as an integrated, campus-
wide effort, examining it as an interdependent function—interdependence being the
essence of complex adaptive systems—is non-existent. Further, there are no studies
utilizing the more recent methodology of Dynamic Network Analysis (DNA) or
Response Surface Methods (RSM) to evaluate the extent to which an EM organization is
structured (formally or informally) to enable effective and efficient information flow, a
key factor in the success of EM efforts (Kalsbeek, 2001).
Purpose of the Study
The primary purposes of this study were to investigate EM in higher education
through the framework of a complex adaptive system (CAS), to provide colleges and
universities with a foundational understanding of what a sustainable EM system looks
like from a DNA perspective, and to suggest to EM practitioners one method to model (a)
their institution’s EM system in its current status and (b) what network structures
optimize information flow, thus cultivating a sustainable EM system for their institutions.
Additionally, I aimed to describe how formal network structures either promote or inhibit
a sustainable EM system within the bounds of the university under study. For example, to
what extent are those involved in EM interdependent with, or dependent upon, each
other? Are there bottlenecks to the flow of information? Does information flow freely
throughout the EM system? In this study, I considered an EM system to be sustainable if
the speed at which information flows throughout the system remains stable regardless of
changes to, and pressures from, the internal and external environments.

3
Put another way, does the EM function at the research site resemble offices that
act independently and, at many times, at cross-purposes (Henderson, 2001) as illustrated
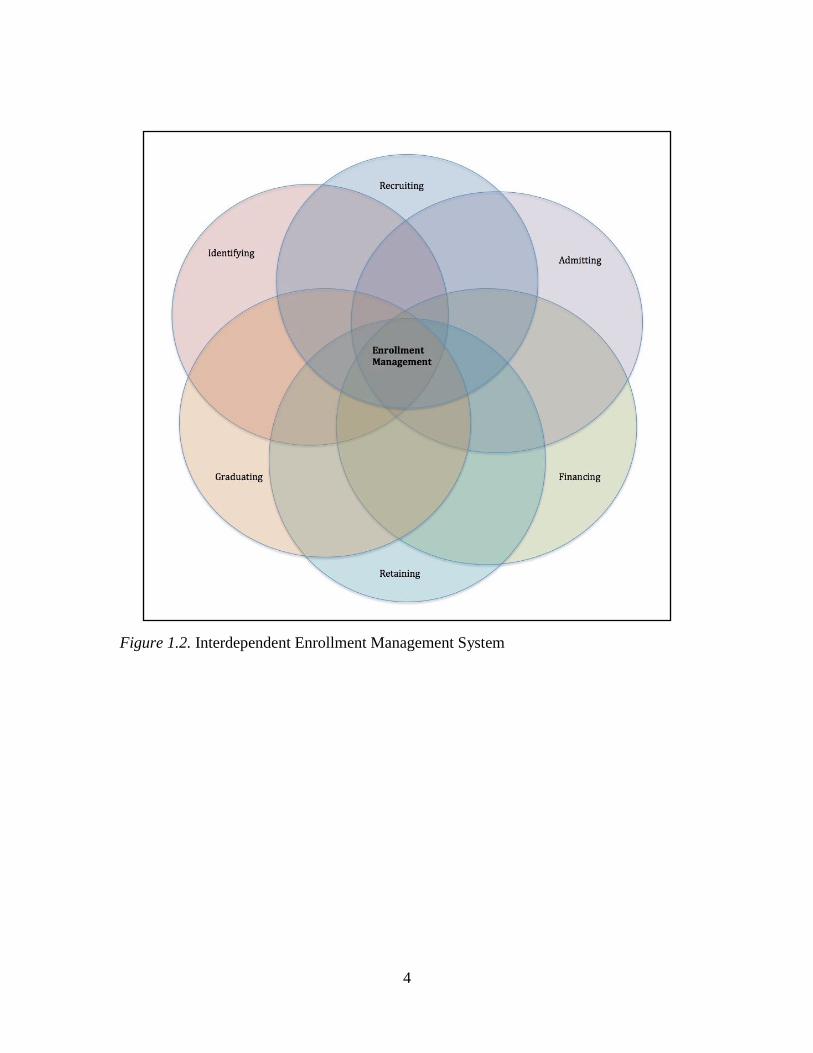
in Figure 1.1? Or does the EM system “bring together often disparate functions of
recruiting, funding, tracking, retaining, and replacing students as they move toward,
within, and away from the university” (Henderson, 2001, p. 7) as illustrated in Figure
1.2?
Figure 1.1. Independent units within Enrollment Management.
4
Figure 1.2. Interdependent Enrollment Management System

5
Significance of the Study
Randall and Coakley (2007) and Walczak and Sincich (1999) contended that EM
focuses on more than just admitting students; it also focuses on retention and graduation.
Enrollment success is crucial to the financial health of colleges and universities. This
study is significant for the formal leaders of EM programs as well as college and
university presidents, as it provides one way to model what network conditions optimize
information flow, thus promoting a sustainable EM system. Further, this study examined
the importance of fostering conditions of interaction and network formation that lead to
sustainable creativity, interdependence, information diffusion, productivity, and
innovation among those not in formal leadership positions in EM systems (Marion &
Uhl-Bien, 2001). In the end, this study’s results will assist institutions of higher education
in the evaluation of their own EM structures and their ability to move information
throughout; in addition, the results will suggest ways to alter the EM system’s network
structure in order to optimize its information flow.
Definition of Terms
The following are definitions of terms used in this study:
Agents: Sometimes called “actors” (van der Hulst, 2011), agents are individual
people, groups, or organizations.
Enrollment Management: Enrollment management is not an insular division or
department, but a living, CAS whose core strategic function (Wilkinson, Taylor,
Peterson, & Machado-Taylor, 2007) is to coordinate people, knowledge, tasks,
and resources for identifying, recruiting, enrolling, retaining, and graduating

6
students (Henderson, 2001) at levels that support the mission (Wilkinson et al.,
2007) of the institution. Its end is to create and maintain dynamic, sustainable
enrollment conditions that allow the institution to survive and persist, regardless
of the forces that push it toward extinction. An effective EM system is
anticipatory (Wilkinson et al., 2007) of internal and external pressures, requires
input from and cooperation of the entire campus (Wilkinson et al., 2007), and
takes into account the physical and instructional capacity of the institution, its
current and potential market positions, the financial requirements of the
institution, the standards of accreditation, and the limits of regulation.
Sustainable System: A system that “survives and persists” (Costanza & Patten,
1995, p. 193).
Theoretical Framework
I utilized complexity theory and network theory to understand the role of
interactions among people, knowledge, tasks, and resources and how those interactions
help the EM system adapt and evolve based on internal and external pressures, thus
creating a sustainable EM system.
Complexity theory attempts to explain the phenomenon that results from the
interactions of individual components, interactions that lead to non-linear outcomes, self-
organization, and evolution—all of which make fully understanding a complex system
impossible (Cilliers, 2000). The common themes found in the complexity theory
literature include interaction, interdependency, emergence, non-linearity, self-
organization, and dynamism. Hasan (2014) expanded these concepts in complexity theory

7
to include “emergence, co-evolution, self-direction, and self-organisation” (p. 51).
Interactions among agents are a key component of complexity theory (Abusidualghoul,
2014; Forsman, Linder, Moll, Fraser, & Andersson, 2012; Hasan, 2014; Kezar, Carducci,
& Contreras-McGavin, 2006; Marion & Uhl-Bien, 2001; McClellan, 2010; McMurtry,
2008; Salem, 2002).
Network theory, rather than being one discreet theory, refers to a number of
frameworks through which to understand the structures and functions of networks.
Borgatti and Halgin (2011) contended that scholars should consider the difference
between network theory and the theory of networks:
Network theory refers to the mechanisms and processes that interact with network
structures to yield certain outcomes for individuals and groups. In the terminology
of Brass (2002), network theory is about the consequences of network variables,
such as having many ties or being centrally located. In contrast, theory of
networks refers to the processes that determine why networks have the structures
they do—the antecedents of network properties, in Brass’s terms. This includes
models of who forms what kind of tie with whom, who becomes central, and what
characteristics (e.g., centralization or small-worldness) the network as a whole
will have. (p. 1)
This study considers both conceptions of network theory mentioned by Borgatti and
Halgin (2011). Not only will examine outcomes of network mechanisms and processes,
but also the types of ties and network measures Borgatti classifies under the theory of
networks. Combining network theory with complexity theory provides a way to model

8
complex social systems and how they evolve based on the types of interaction that occur
among and between agents.
Research Questions
This study is guided by two overarching questions:
1. To what extent is the research site organized to enable effective and efficient
information flow?
2. Which combinations of independent network measures (adaptive leadership,
social capital, and clique structure) produce optimal outcome measures
(information flow) for a sustainable EM system?
Adaptive leadership was operationalized as the network measure, closeness
centrality; social capital was operationalized as resource capability; and clique structure
was operationalized as the clustering coefficient. The dependent measure was average
speed, which measured the level of information diffusion in the system.
Limitations
Limitations of this study include using the EM division of a single university with
its own culture. However, the data analysis will utilize simulations that, in effect, create
15 different networks of EM within the research site, thus neutralizing an apparent
limitation normally attributed to N = 1 (R. Marion, personal communication, January 7,
2016).
Assumptions
The following assumptions for this study included (a) participants would
complete both surveys; (b) participants would answer the survey questions accurately,

9
honestly, and thoroughly; and (c) the resulting analysis would not concentrate on the
individual, but on the network of individuals.
Organization of the Study
This study contains five chapters with the following titles: Introduction, The
Review of Literature, Methodology, Findings, and Summary, Discussion, and
Conclusions. The introduction identifies the study’s background, statement of the
problem, the purpose of the study, the significance of the study, a definition of terms used
in the study, the researcher’s theoretical framework, research questions, limitations of the
study, delimitations selected by the researcher, and assumptions made in conducting the
research.
Chapter Two reviews the literature on topics related to this study. These topics
include an overview of complexity theory, network theory, CASs, adaptive leadership,
administrative leadership, enabling leadership, information diffusion, and the
methodology used to examine an institution’s EM system in its current state, in addition
to how that system can be more adaptive to internal and external forces.
Chapter three details the methodology selected for this study, including the
research design, epistemology, selection of participants, specific method of data
collection and analysis, and ethical concerns.
Chapter four presents the findings of this study.
Chapter five provides a summary, discussion, and conclusions with implications
for formal EM leadership and future research.

10
CHAPTER TWO
THE REVIEW OF LITERATURE
The primary purposes of this study were to investigate enrollment management
(EM) in higher education through the framework of a complex adaptive system (CAS), to
provide colleges and universities with a foundational understanding of what a sustainable
EM system looks like from Dynamic Network Analysis (DNA) perspective, and to
suggest to EM practitioners one method to model (a) their institution’s EM system in its
current status and (b) what network structures optimize information flow, thus cultivating
a sustainable EM system for their institutions. Additionally, the study aimed to describe
how formal network structures either promote or inhibit a sustainable EM system within
the bounds of the university under study. For example, to what extent are those involved
in EM interdependent with, or dependent upon, each other? Are there bottlenecks to the
flow of information? Does information flow freely throughout the EM system? In this
study, considered an EM system to be sustainable if the speed at which information flows
throughout the system remains stable regardless of changes to, and pressures from, the
internal and external environments.
To this end, this study is guided by two overarching questions:
1. To what extent is the research site organized to enable effective and efficient
information flow?
2. Which combinations of independent network measures (adaptive leadership,
social capital, and clique structure) produce optimal outcome measures
(information flow) for a sustainable EM system?

11
This chapter begins with a discussion of EM, including traditional ways of
understanding the flow of students through what are called enrollment funnels, and how
the term sustainability applies to EM. Following this, I move to the theoretical
underpinnings of collectivism, complexity theory, network theory, CASs, collectivist
leadership, information diffusion, and networks.
Enrollment Management
Enrollment management “is both an administrative structure and a set of
accompanying practices…” (Kraatz, Ventresca, & Deng, 2010, p. 1522) and is critical to
the sustainability of higher education institutions. The management of enrollment
provides the tuition revenue necessary to operate the institutions (Randall & Coakley,
2007; Walczak & Sincich, 1999). While some view EM as the purview of the Office of
Admission, others have argued for the expansion of the role of EM to that of the entire
campus (Huddleston, 2000). Quoting Jack Maguire, then dean of EM at Boston College,
Henderson (2001) said, “Enrollment management is a process that brings together often
disparate functions having to do with recruiting, funding, tracking, retaining, and
replacing students as they move toward, within, and away from the university” (p. 7).
Maguire continued that EM emerged in order to create a synergy between offices that
often acted independently and, at many times, at cross-purposes. The writers concur that
EM should function as a set of interdependent activities such as “…marketing, recruiting,
admissions, financial aid, orientation, and retention” (Henderson, 2001, p. 11).
Accordingly, Huddleston (2000) defined EM as “…an institution-wide process that

12
embraces virtually every aspect of an institution’s function and culture” (p. 65). Hossler
(1990) defined EM as,
An organizational concept and a systematic set of activities designed to enable
educational institutions to exert more influence over their student enrollments.
Organized by strategic planning and supported by institutional research,
enrollment management activities concern student college choice, transition to
college, student attrition and retention, and student outcomes. (p. 5)
Such interdependency is at the heart of complexity theory, which views complex systems
as systems “composed of many interacting parts…” (Newman, 2011, p. 1).
Enrollment managers receive a great deal of attention by the boards of trustees
and presidents of American colleges and universities. For example, a recent article in The
Chronicle of Higher Education labeled the enrollment manager’s position as “The
Hottest Seat on Campus,” noting, “Dozens of enrollment and admission leaders have lost
their jobs” (Hoover, 2014). In the Library Journal, Bell (2014) warned that predicted
changes in the demographics of graduating high school seniors and their families present
“serious challenges” for colleges and universities to meet their enrollment goals. Randall
and Coakley (2007) reported, “Colleges and universities compete intensely to attract
students and to generate revenues as operating costs rise and government subsidies
decline” (p. 325). Walczak and Sincich (1999) contended that an institution’s financial
health depended heavily on successful enrollments.
Simply recruiting students to matriculate is no longer sufficient; the entire process
from admitting to graduating has become the focus. Henderson (2001) suggested

13
conceptualizing EM as a “cradle-to-endowment mentality” (p. 35). Huddleston (2000)
argued that a collective approach to managing enrollment is necessary; specifically, “The
shared missions, primary goals, and the integration and interdependence of these key
areas are vital to the successful implementation and operation of enrollment
management” (p. 66). Enrollment management should be a collective effort of the entire
campus and should permeate the institutional “function and culture” (Dolence, 1992;
Huddleston, 2000). Involving the entire campus in EM supports Huddleston’s (2000)
argument for interdependency, a core tenet of complexity theory (Uhl-Bien & Marion,
2008b).
The Enrollment Management Funnel and Pyramid
Traditional ways of understanding the EM processes included a metaphorical
funnel (Figure 2.1) which divided EM into separate purposes: recruitment and retention.

14
Figure 2.1. Strategic Enrollment Management Funnel Recruitment: The recruitment
section of the detailed funnel (Dolence, 2015c). Reprinted with permission.

15
In Figure 2.1, Dolence (2015c) visualized how numerous institutions view EM: as
simply the recruiting and enrolling of students. The image “depicts the flow of learners
through the stages of selecting and enrolling in an academic program” (Dolence, 2015a).
The idea is that colleges and universities identify potential students, try to entice the
students to apply for admission, admit a certain number of those that do apply, work with
the Financial Aid Office to put together an adequate and appropriate financial aid
package, and finally work with the admitted students to convince them to indicate their
intent to enroll by paying an enrollment deposit.
In Figure 2.2, Dolence (2015d) depicted the subsequent purpose of EM—
retaining and graduating the enrolled students. However, this phase is completely
separate from the first phase of recruitment, as if retention begins where recruitment
ends.

16
Figure 2.2. Strategic Enrollment Management Funnel Retention: The retention section of
the detailed funnel (Dolence, 2015d). Reprinted with permission.
17
Presenting these phases as separate and unrelated, independent functions
contradicts the arguments of Henderson (2001), Hossler (1990), and Huddleston (2000)
that called for an integrated and campus-wide approach to EM. Dolence (2015b)
remedied this by connecting the two figures to suggest the entire “cradle to endowment”
(Henderson, 2001, p. 35) flow (Figure 2.3).

18
Figure 2.3. Strategic Enrollment Management Funnel (Detailed): A detailed view of the
Strategic Enrollment Management Funnel (Dolence, 2015b). Reprinted with permission.

19
Not every EM expert agreed with explaining EM using Dolence’s funnel.
Bontrager (2004) warned that a problem with viewing EM as a funnel, “…gives the false
impression that students flow automatically through the funnel as if drawn downward by
gravity” (p. 10). Bontrager (2004) argued that recruiting and retaining students required
“careful planning, effective execution, and technical skill” (p. 10). Such requirements
demand the expansion of the role of EM to the entire campus (Huddleston, 2000).
This necessity for an expanded sphere of influence for EM in higher education
institutions began in private colleges and universities; however, it has spread to public
institutions as well (Huddleston, 2000). Given the arguments for collaborative,
interdependent roles in higher education EM, this study moved beyond the formal
organizational structure of an EM Department and analyzed the informal interactions and
network structures that influence information diffusion, which Kalsbeek (2001)
contended is the “most important material driving strategic enrollment management” (p.
189).
Sustainability
Sustainability may seem a strange concept to describe an optimal EM system, yet
sustainability aptly captures the significance of effective EM for an institution. Costanza
and Patten (1995) defined a sustainable system as one that “survives and persists” (p.
193), and Holbeche (2005) suggested, “sustainable organizations integrate structures,
systems, and processes that have clarity and flexibility built in” (p. 21). As stated earlier,
students are the lifeblood of the institution, and EM is the mechanism that recruits and

20
retains students. For colleges and universities to “persist and survive” (i.e. be
sustainable), the EM system itself must be sustainable.
This study utilizes the term Sustainable Enrollment Management to describe
optimal network structures that enable regular and efficient information flow and that
create capacity to adapt robustly to the many internal and external pressures experienced
by EM professionals. Much of the EM literature suggested the term, Strategic Enrollment
Management, places EM within the strategic plan of the institution (Wilkinson et al.,
2007). use of sustainable in place of strategic is not to suggest that something is wrong
with the latter. For this study, however, sustainable offers a different perspective for
understanding an effective EM system, and the word also captures the importance of EM
to an institution’s survival and persistence despite pressures forced upon it by internal
and external influences.
Collectivism
One of the theoretical frameworks guiding this study is complexity theory. The
context within which complexity theory lies is collectivism. Those in the collectivist
camp emphasize group dynamics over individual characteristics; more specifically,
collectivists emphasize group goals and interests rather than individual goals and
interests (Randall, Resick, & DeChurch, 2011; Walumbwa & Lawler, 2003). According
to Walumbwa and Lawler (2003), “Collectivists see the self as totally part of the group
and interdependent with other members of the group, who are viewed as equal and the
same” (p. 1087).

21
Concern for group achievement is one of the reasons a collectivist perspective
enhances interdependent work groups (Randall et al., 2011). Interdependence and
survival of the group are key characteristics of collectivism (Carson, 2009). When
pressures threaten group identities and/or success, those in collective groups rally around
the common goals of the group members and ensure that their responsibilities are met
(Carson, 2009). Additionally, collectivist organizations encourage common values and
efforts to achieve goals (Luczak, Mohan-Neill, & Hills, 2014). As stated earlier,
Huddleston (2000) argued, “The shared missions, primary goals, and the integration and
interdependence of these key areas are vital to the successful implementation and
operation of enrollment management” (p. 66).
One specific form of collectivism espoused by Marion (2015) is social
collectivism, which purports “that agents in a social system are interdependent and that
influence is a complex dance involving numerous, networked sources of influence” (R.
Marion, personal communication, April 24, 2015). Interdependency and influence of
others are additional aspects commonly found in both collectivist and complexity
literature. Collectivist approaches to change start with intense environmental pressures
that are often overwhelming for organizations that subscribe to traditional, top-down, or
centralized, leadership structures. Environmental pressures are common in EM, whether
they emanate from inside the institution (e.g. student body size and composition, net
revenue, curricular changes) or are introduced by exogenous factors such as regulatory
changes, accreditation requirements, economic factors, etc.

22
Collectivists contend that leaders are agents who take initiatives within the
context of networked relationships (i.e. emergent leaders) and that more formal leaders
have the ability to enable the formation and development of change initiatives that start in
the networked relationships (Marion & Gonzales, 2014; Yammarino, Salas, Serban,
Shirreffs, & Shuffler, 2012). Collective leadership thrives in systems where interactions
are frequent and exhibit a high degree of interdependency (Yammarino et al., 2012).
Leadership influenced by collectivist ideals (collectivistic leadership) also minimizes the
individual as a central leader (Yammarino et al., 2012). Collectivistic leadership is:
not constrained by formal power and authority structure and relationships, not
limited to leader-to-follower interactions in small groups and teams, involve more
than typical leader behaviors or team skills, incorporate a variety of formal and
informal organizational and extra-organizational arrangements, tend to be
dynamic and non-linear in nature, and strive to be responsive to complex, rapidly
changing and uncertain problems and environments. (Yammarino et al., 2012, p.
395)
Theoretical Frameworks
Complexity Theory
The common themes found in the complexity theory literature include interaction,
interdependency, emergence, non-linearity, self-organization, and dynamism. Hasan
(2014) expounded that dominant concepts in complexity theory include “emergence, co-
evolution, self-direction, and self-organisation” (p. 51). Interactions among agents are a
key component of complexity theory (Abusidualghoul, 2014; Forsman et al., 2012;

23
Hasan, 2014; Kezar et al., 2006; Marion & Uhl-Bien, 2001; McClellan, 2010; McMurtry,
2008; Salem, 2002).
Complexity theory, quite logically, is rooted in the science of complexity, defined
by Coveney (2003) as “the study of the behaviour of large collections of such simple,
interacting units, endowed with the potential to evolve with time” (p. 1058). The
interaction of these units result in self-organization, which Coveney (2003) defined as
“the spontaneous emergence of non-equilibrium structural organization on a macroscopic
level, due to the collective interactions between a large number of (usually simple)
microscopic objects” (p. 1058). This self-organization leads to emergence (Coveney,
2003).
Colchester (2015b) defined complexity theory as theoretical frameworks that
researchers use for creating models of and analyzing complex systems. There are four
related theories that aid in understanding complex systems:
Systems theory that covers topics including self-organization, adaptation, and
complexity (Colchester, 2015b); systems theory is the “mother of complexity
theory” (Colchester, 2015b).
Nonlinear systems theory and chaos theory that have their origins in mathematics
and physics. In nonlinear systems, feedback loops are important for adaptation
and growth; nonlinear systems do not achieve equilibrium and are better
described as “far-from-equilibrium systems” (Prigogine, 1997, p. 64).
Network theory, which has origins in graph theory and can help one visualize and
analytically describe complex systems.

24
Complex adaptive systems, defined later under a separate section of this chapter.
Complexity theory is appropriate for studying the operations of organizations
(Abusidualghoul, 2014) because organizations develop and change as a result of
interacting agents; such change is referred to as evolution (Salem, 2002). Since change
and growth are characteristics of organizations, complexity theory offers insight into the
elements that “accelerate or amplify change” (Salem, 2002, p. 448). An important point
regarding the relationship between complexity and organizational change is that
complexity theory does not attempt to evaluate whether a particular change is typically
positive or negative; it simply illustrates how and why change occurs (Salem, 2002).
Many formal leaders believe that organizational change is simply cause and effect
(i.e. linear) (Hanson, 2009) and is predictable based on patterns of past behavior.
However, Regine and Lewin (2000) reasoned that complexity theory moves one away
from this linear perspective towards non-linear perspectives where change is organic,
unpredictable, and results in outcomes that are uncertain. This perspective flies in the
face of classical scientists who argue the world is predictable and stable (Marion & Uhl-
Bien, 2001; Prigogine, 1997), perhaps making this a reason that some organizational
science researchers have steered away from studies involving complexity theory and its
recognition of human interdependency.
Marion and Uhl-Bien (2001) offered this summary of complexity theory:
Organizational structure and behavior are, on the one hand, products of random
surprise and nonlinearity, and, on the other hand, products of the unifying effect
of correlation. It is inaccurate to define these forces as polar opposites, although it

25
is accurate to say that they create tension within a system. Rather, like two people
who bring different skills to a task, these seemingly opposing dynamics work
together to create emergence. Random behavior and nonlinearity provide creative
surprises, they apply pressure that creates conflicting constraints, and they are
actors in the dynamic that enables different pieces of order to accumulate,
interact, and collapse together. Correlation, in turn, provides the structure against
which conflicting constraints are arbitrated and organization is built. (p. 402)
Network Theory
Rather than being one discreet theory, network theory refers to a number of
frameworks from which to understand the structures and functions of networks.
Examples include Granovetter’s strength of weak ties theory (Borgatti & Halgin, 2011),
and Burt’s structural holes theory (Borgatti & Lopez-Kidwell, 2011). Borgatti and Halgin
(2011) contended that scholars should consider the difference between network theory
and the theory of networks:
Network theory refers to the mechanisms and processes that interact with network
structures to yield certain outcomes for individuals and groups. In the terminology
of Brass (2002), network theory is about the consequences of network variables,
such as having many ties or being centrally located. In contrast, theory of
networks refers to the processes that determine why networks have the structures
they do—the antecedents of network properties, in Brass’s terms. This includes
models of who forms what kind of tie with whom, who becomes central, and what

26
characteristics (e.g., centralization or small-worldness) the network as a whole
will have. (p. 1)
This study considers both conceptions of network theory mentioned by Borgatti and
Halgin (2011). Not only will this study examine outcomes of network mechanisms and
processes, but also the types of ties and network measures Borgatti classifies under the
theory of networks. Combining network theory with complexity theory provides a way to
model complex social systems and how they evolve based on the types of interactions
that occur among and between agents.
Complex Adaptive Systems
This study presents sustainable EM as a complex adaptive system (CAS), a
concept appropriately applied to the context of EM. Henderson (2001) stated “effective
enrollment management…begins at home with concerned and knowledgeable
administrators and faculty who realize that they possess the capacity to respond creatively
to environmental pressures in the interest of long-term institutional health” (p. 11).
Newman (2011) stated that a complex system is “a system composed of many interacting
parts, often called agents, which displays collective behavior that does not follow trivially
from the behaviors of the individual parts” (p. 1). A complex system is one that exhibits a
“high degree of systemic interdependence, which, among other things, leads to non-
linearity, emergent order creation, and other surprising dynamics” (Hazy, Goldstein, &
Lichtenstein, 2007, p. 4). Complex systems constantly change due interactions among
internal agents of a network as well as that network’s interactions with the external
environment occur (Fraser, Moll, Linder, & Forsman, 2011). Complex systems exhibit

27
three characteristics: (1) interaction, (2) dynamic, and (3) adaptation (Uhl-Bien &
Marion, 2008a).
Colchester (2015a) stated that there are four properties to complex systems:
Interaction of many different elements or parts;
Nonlinearity where a system’s inputs and outputs are not proportional to each
other. In other words, the traditional linear equation is not applicable. A one-unit
change in X does not always result in a predictable change in Y. Additionally, the
whole system may be greater than or less than the sum of its parts. Nonlinear
systems may grow or die due to the feedback mechanisms (i.e. feedback loops).
Connectivity between the components of a complex system is usually high or
dense. Rather than the properties of the parts of the system, the structures of the
connections do more to define a system. At some point, the connectivity level
causes increases to a point where a system is no longer understood by looking at
the individual parts, but understood by viewing the system as a network of
connections. It is at this point that the significance of a system is in the flow
throughout a network.
Autonomy and adaptation indicate the lack of top-down centralized control for
coordinating the entire system. Within complex systems, the components (or
elements) have a certain degree of autonomy through their ability to adapt to their
local environments and according to sets of individual rules. Without the
centralized control and with autonomy come the capacity of components to self-
organize.

28
Perony (2014) stated, “Complex systems have many interacting parts which behave
according to simple individual rules and result in emergent properties. The behavior of
the system as a whole cannot be predicted by looking only at the simple rules.”
Interactions among agents (people, resources) bring about change and evolution
(Shakouri, Teimourtash, & Teimourtash, 2014). Complex systems are also dynamic in
that they constantly change, evolve, and are often unpredictable (Uhl-Bien & Marion,
2008a). Complex systems adapt, “or make strategic changes that adjust individual or
systemic responses to pressures” (Uhl-Bien & Marion, 2008a, p. 6). Buckley (1967) was
the first to use CAS “to refer to a class of systems that have a capacity for adapting to a
changing environment” (Hazy et al., 2007, p. 4). Further, the Santa Fe Institute aligns
with the definition of Buckley (1967) but describes how adaptation to an altered
environment occurs (Hazy et al., 2007).
Complex systems’ network structures are decentralized, meaning some
components of the network (i.e. nodes) are more connected than others (Forsman et al.,
2012). Nodes can also be nested into complex systems themselves. Forsman et al. (2012)
stated:
Components within a complex system can be considered to be complex systems
themselves, thus complex systems are nested. Each level of such nested complex
systems exhibits similar structures and dynamics but operates within different
time-scales and/or at different levels of analysis (such as the level of an
individual, or of a group of individuals, or of a particular culture, or of all human
beings). (p. 72)

29
Salem (2002), citing Holland (1995) and Kauffman (1993), wrote that complexity theory
focused on interactions agents have within CAS. Uhl-Bien, Marion, and McKelvey
(2007) defined CAS as “a basic unit of analysis in complexity science” (p. 299). CAS
consist of individuals who interact regularly, thus forming networks of agents with
common goals, needs, etc. (Uhl-Bien et al., 2007). Complexity Learning stated that a
CAS occurs when many parts act and react to each other, is highly dynamic, and tends to
self-organize with no formal top-down instruction or coercion. A CAS “places a strong
emphasis on an organization's ability to enact successful creative problem solving as
matter of routine” (Colchester, 2015b).
Coordination is another special capability of a CAS (Guastello, 2007, p. 364).
Salem (2002) argued that “Change is the norm, not the exception” (p. 445) in complexity
theory. Though counterintuitive, constant change creates order in complex systems
through agent by agent interaction (Plowman et al., 2007). To explain this further,
Bulutlar and Kamasak (2012) listed three characteristics of complex systems:
1. The whole is greater than the sum of the parts, therefore dividing the whole
does not ease understanding it (Peters, 1992).
2. Understanding all of the inputs does not necessarily predict outputs generated
by complex systems.
3. Behavior of complex organizations, which are placed at the edge of chaos, is
neither predictable nor unpredictable. In other words, order and chaos exist
together. (p. 61)
30
Though these characteristics of complexity theory trouble those who prefer order and
predictability, Hasan (2014) stated, “The message of Complexity Theory is that
complexity is not something to fear, but a part of life that needs to be treated in ways that
are different to the ways non-complex matters are dealt with” (p. 53). In fact, the
connection between CAS theory and knowledge management was acknowledged around
1997 (McElroy, 2003) when the Knowledge Management Consortium International
participants agreed “to treat human organizations as living systems—consistent with CAS
theory’s definition of CASs; all of the theory’s insights on how knowledge happens in
such systems were suddenly seen as entirely applicable to business and industry”
(McElroy, 2003, p. 28). Given that the arguments for institutions to consider EM an
interdependent and campus-wide effort, viewing EM as a CAS is appropriate. With
complexity and network theories established as the framework for this study, now
explores the topic of leadership within a CAS.
Leadership Concepts
Complexity Leadership
Given that complex systems are characterized by interactions, emergence,
unpredictability, non-linearity, etc., what are the implications to leadership? In particular,
what is the role of a leader in such a system? These questions move scholars to view
leadership as more of a process than a characteristic or skill of an individual (DeRue,
2011; Lichtenstein et al., 2007; Marion & Uhl-Bien, 2007a), and, consequently, to seek
leadership in the activities of individuals and groups regardless of formal position. This
perspective has been labeled complexity leadership; it is grounded in complexity science,

31
but it strays from traditional leadership models that focus on human relations (Marion &
Uhl-Bien, 2007b). A knowledge economy demands that we shift from traditional, top-
down bureaucratic models of leadership—prevalent in the industrial age and economy—
to leadership “as an emergent, interactive dynamic—a complex interplay from which a
collective impetus for action and change emerges when heterogeneous agents interact in
networks in ways that produce new patterns of behavior or new modes of operating”
(Uhl-Bien et al., 2007, p. 299). Though our economies have shifted, EM—and some
would argue, higher education in general—still reflects the authority and leadership
structure appropriate for the industrial age.
Leadership is a social process characterized by bidirectional mutuality, or
reciprocal ties (i.e. agent A is connected to agent B, and agent B is also connected to
agent A) (DeRue, 2011; Yukl & Falbe, 1990). This premise derives from sociological
theories which view hierarchies in leadership as the result of ongoing social interactions
(DeRue, 2011). This does produce leader-follower structures but at informal levels of
leadership. Ongoing social interactions result in social structure survival (DeRue, 2011).
Whereas traditional leadership roles are seen as formal, top-down organizational
structures, leadership that is informal and interactive allows organizations to change and
adapt as various environmental pressures arise, both internal and external to the group
(DeRue, 2011). The product of this adaptability is organizational resiliency. When
various people assume informal leadership roles based on social processes, leadership
changes depending on the needs of the group (Uhl-Bien et al., 2007). Top-down
hierarchical leadership inhibits adaptability because those not in formal leadership roles

32
have no authority to use their knowledge and creativity to react to pressures with
appropriate changes (DeRue, 2011), thus stifling organizational change and learning.
In complex leadership, “the role of leaders is not to ‘step outside [the system] to
operate on it or use it,’” but to foster interaction “which is itself a process of intending,
choosing, and acting” (Griffin, 2002, p. 187). In other words, complex leadership is not
passive. On the contrary, complex leaders actively foster interaction and networks. Kezar
et al. (2006) argued that one of the most important functions of complex leaders is the
creation of networks. “Leaders are called on to operate at a systems level, focusing on the
connections between organizational roles and tasks as well as fostering interdependent
relationships inside and outside the organization” (p. 44). Kezar et al. (2006) wrote, “As a
leader, one is encouraged to support grassroots efforts, set up feedback loops for
problems, and exert minimal direct control because such efforts are likely to be met with
resistance or redirected in the system” (p. 111).
Top-down leadership is not the focus in complexity leadership; rather, the focus is
on leadership dynamics that encourage creativity and organizational learning. DeRue
(2011) argued that “individualistic and person-centric perspectives emphasize the person
as the source of leadership (or followership), and therefore does not fully account for the
social and dynamic processes by which patterns of leadership and following develop and
evolve” (p. 130). Marion and Uhl-Bien (2001) argued that complexity theorists believe
“the greatest creativity, productivity, and innovation comes out of people who are
provided opportunities to innovate and network” (p. 401). Encouraging creativity in
organizations forces one to allow ideas to “bubble up” (McKelvey, 2001). Some see this

33
as leaders relinquishing control, and, to some degree, the literature supports that. Marion
and Uhl-Bien (2001) stated “Complex leaders understand that the best innovations,
structures, and solutions to problems are not necessarily those that they, with their limited
wisdom, ordain, but those that emerge when interacting aggregates work through issues”
(p. 394).
A significant difference between traditional bureaucratic leadership models and
complexity leadership lies in control. Top-down leadership structures encourage the
manager to retain control; complexity places control in the adaptive leadership structure
(Marion & Uhl-Bien, 2007b). Marion and Uhl-Bien (2007b) argued, “Control lies within
an array of subtle and complex coordinating tools, such as tension, interdependency
among agent preferences and work productivity, conflicting constraints, simple rules, and
need” (p. 156). In other words, control is built into the processes of an adaptive system
rather than dictated from the top-down (Marion & Uhl-Bien, 2007b). This promotes
creativity and freedom to think outside the box, so to speak, yet places appropriate
constraints that keep the outcomes in line with the goals and mission of the organization.
Complex leaders build or promote the emergence of networks (Gnyawali &
Madhavan, 2001). Marion and Bacon (1999) suggested that the leader can encourage
network formation by providing resources for attending professional development
conferences, leaving networks alone as they form, etc. Manz (1984) stated that allowing
staff members to make decisions outside of the formal leader and expecting them to use
that discretion is another way to foster network construction and creativity in problem

34
solving. Further, Marion and Uhl-Bien (2001) suggested that even the physical work
environments could encourage interaction (e.g. open spaces rather than cubicles).
Marion and Uhl-Bien (2001) summarized complexity leadership as a mode that:
should be viewed as creating conditions that enable the interactions through
which the behaviors and direction of organizational systems emerge. Leaders
provide control by influencing organizational behavior through managing
networks and interactions. They do not delude themselves with the notion that
they can determine or direct exactly what will happen within the organization.
The dynamics of interaction, guided by complex leaders, help the organization
develop appropriate structure, innovation, and fitness. (p. 406)
Complexity leadership provides the conditions for an EM system to be sustainable. More
granular leadership styles that complexity leadership offers are adaptive leadership,
administrative leadership, and enabling leadership.
Adaptive Leadership
Adaptive leadership is a construct that refers to dynamic behaviors that promote
information flow, ability to change based on internal and external pressures, and
interaction among agents (Uhl-Bien et al., 2007). Yammarino et al. (2012) defined
adaptive leadership as “an informal process that emerges out of the interaction of agents
with different knowledge, goals, values, beliefs, and perceptions” (p. 392). DeRue (2011)
referred to leadership as “a socially complex and adaptive process…[or a] social
interactive process” (p.126), views he complained were lacking in most leadership theory

35
literature. As these interactions evolve, leader-follower identities evolve and change, and
the informal leaders change.
Adaptive leadership encourages the flow of ideas and information throughout an
organization, allowing the organization to adapt to internal and external pressures for
change, to learn and grow as an organization, and to be the most creative it can be
(Yammarino et al., 2012). Lichtenstein et al. (2007) defined adaptive leadership as “an
interactive event in which knowledge, action preferences, and behaviors change, thereby
provoking an organization to become more adaptive” (p. 134). This definition highlights
a difference between leadership as a process and individual leaders who influence the
process. Leadership is not focused on prodding people to follow; leadership occurs when
people interact and generate change for an organization (Lichtenstein et al., 2007).
DeRue (2011) emphasized that, “Over time through repeated interaction, these leader-
follower identities and relationships emerge to form group-level leadership structures” (p.
126). Over time, and as the needs of the group alter, leader-follower structures change
and adapt due to external pressures. This adaptability allows the organization to remain
relevant and strong (DeRue, 2011), a key concept in the definition of sustainable EM as
presented in this study.
Administrative Leadership
Administrative leadership is the more traditional, formal type of leadership
(Yammarino et al., 2012). Marion and Uhl-Bien (2007b) defined administrative
leadership as “managerial leadership that occurs in formal, hierarchical roles and is
responsible for such things as organizational strategy, resource acquisition and allocation,
36
policy making, and general management” (p. 153). Though related to traditional
leadership models, administrative leadership in a complex leadership setting does
recognize the importance of emergence, creativity, interdependence, and other
characteristics of CAS (Marion & Uhl-Bien, 2007b). In higher education, examples of
administrative leadership include compliance offices, the Boards of Trustees, structural
heads of institutional departments, and external accreditation agencies. Administrative
leaders, however, do provide appropriate constraints that keep an institution from
straying too far from its goals and mission and/or conducting business in ways that are
contrary to compliance standards.
Enabling Leadership
Enabling leadership fosters the interaction of agents (i.e. people) to increase
coordination and interdependence between agents with knowledge relevant and
appropriate to the situation (Yammarino et al., 2012). Enabling leaders act as mediators
between the wildly creative adaptive leaders and the rule-bound administrative leaders
(Uhl-Bien et al., 2007). In other words, enabling leadership provides balance between the
policy and regulatory constraints of an organization and the need for creative problem
solving. As written by Yammarino et al. (2012), “Enabling leadership is proposed to
serve as moderator between administrative and adaptive leadership by modifying some of
the authoritative ‘‘top-down’’ control to allow for the more organic flow of information
and interaction that gives rise to adaptive leadership” (p. 392).
Marion and Uhl-Bien (2007b) wrote that there are two roles which enabling
leadership plays in organizations: (1) fosters conditions that promote emergence, and (2)

37
mediates the tension between administrative leadership and adaptive leadership. This
function promotes conditions that encourage adaptive, complex leadership, yet also
recognizes that the outcomes of the adaptive leadership process must fit within the
mission and goals of the organization (the purpose of administrative leadership) (Marion
& Uhl-Bien, 2007b). Enabling leadership, the researcher argues, is the appropriate
leadership style for fostering a sustainable EM system.
Clique Structure
In network structures, cliques are cohesive groups of highly interconnected
people, often with similar interests, skills, backgrounds, etc. (Haythornthwaite, 1996).
Newman (2004) defined a clique as a group of completely connected nodes; Carley,
Pfeffer, Reminga, Storrick, and Columbus (2013) concurred with Newman by defining a
clique as “…a set of nodes where every node is connected to every other node” (p. 3).
Cliques are important for information diffusion because cliques can process large
amounts of information about environmental conditions, can communicate to a great
extent with other cliques, and are interactive (Marion, Christiansen, Klar, Schreiber, &
Erdener, 2016). Whereas societal concepts of cliques are exclusionary and negative,
clique structure in networks promotes information diffusion (Cowan & Jonard, 2004).
Social Capital
Bolivar and Chrispeels (2010) stated that social capital “consistently refers to the
resources (power and information) present in a bounded community’s social relationships
that can be used to leverage additional resources” (p. 9). Coleman (1988) compared
social capital to “the concepts of financial capital, physical capital, and human capital—

38
but embodied in the relations among persons” (p. S118). As a proxy for social capital,
Kadushin (2004) preferred the term “networked resources” (p. 88). Access to resources
(i.e. social capital) via network interactions encourages information flow since people are
the “containers” information. Burt (2000) argued that one mechanism for the flow of
information is a network.
For this study, social capital is operationalized as resource capability. Since
“access to information channels” (Bolivar & Chrispeels, 2011, p. 10) is a key requirement
for building social capital, resource capability is the optimal network measure to assess
an EM system’s ability to provide access to the resources necessary to perform its role
and functions for the benefit of the college or university.
Information Flow
As previously referenced, Kalsbeek (2001) contended that strategic EM leaders of
today realize that, in knowledge management (i.e. information management and
diffusion), “information is the most important material driving strategic enrollment
management” (p 189). Haythornthwaite (1996) argued, “By gaining awareness of
existing information exchange routes, information providers can act on information
opportunities and make changes to information routes to improve the delivery of
information services” (p. 323). Henderson (2001) reinforced the argument for
interdependency by stating, “Enrollment management was perceived as including eight
‘interdependent’ activities: ‘clarification of institutional mission, program development,
marketing, recruiting, admissions, financial aid, orientation, and retention’” (p. 11).

39
The information flow argument is important to EM because, as Huddleston (2000)
argued, “The shared missions, primary goals, and the integration and interdependence of
these key areas are vital to the successful implementation and operation of enrollment
management” (p. 66). Information about those shared missions needs to move throughout
the organization, and social networks are extremely important for information flow.
Haythornthwaite (1996) viewed information as a resource and stated that information
exchange is prominent in social networks. Further, “Just as roads structure the flow of
resources among cities, information exchange relationships structure the flow of
information among actors” (p. 323). These structures are relevant to investigations such
as determining who controls the flow of information. Therefore, studying a network’s
structure, such as cohesiveness, sense of community, and/or cliques is helpful when
trying to evaluate an organization’s capacity to move information freely
(Haythornthwaite, 1996). Network patterns show who interacts with whom in order to
receive or forward information as well as what access the individual has to information,
new ideas, and opportunities (Haythornthwaite, 1996).
How tightly knit a network is also impacts the flow of information. Also known
as tie strength (Haythornthwaite, 1996), the connectedness of a group has often indicated
how efficiently information flows throughout a network or a group of networks. Weng,
Menczer, and Ahn (2013) reported that network structure can greatly affect the spread of
information, with strongly connected communities running the risk of trapping
information. Too much homophily (interaction among agents with similar characteristics
40
or experiences) for example, can degrade the speed at which information moves between
networks (McPherson, Smith-Lovin, & Cook, 2001).
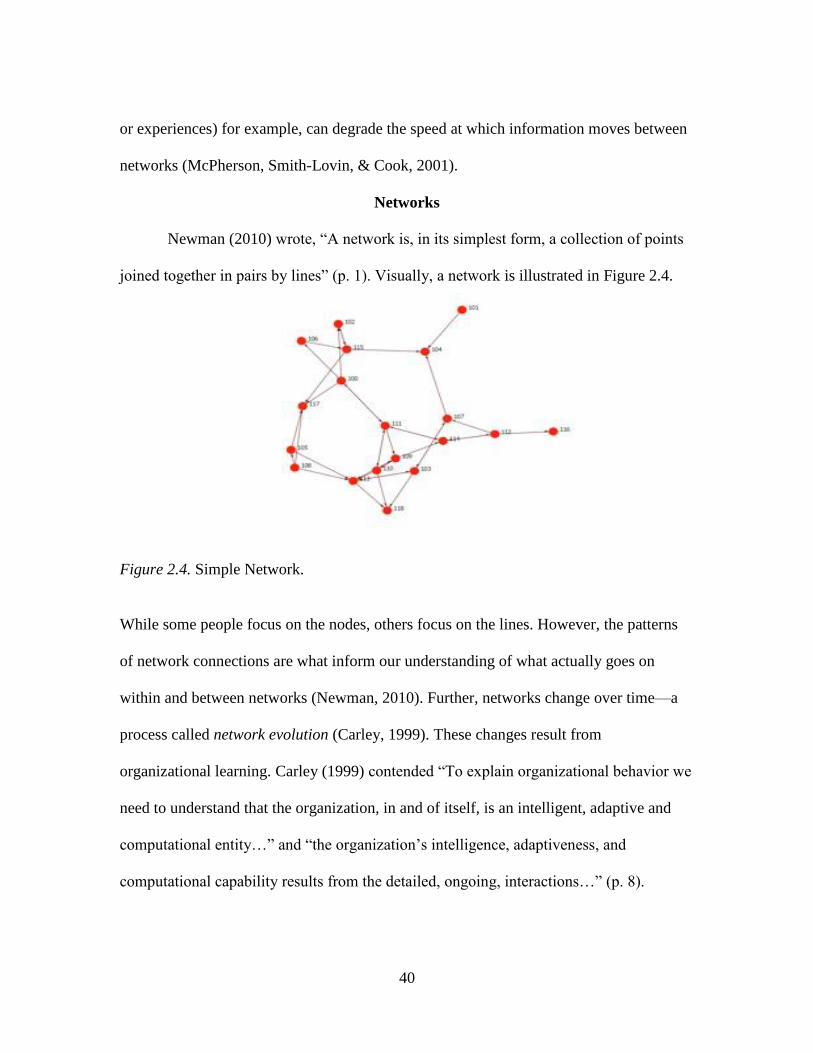
Networks
Newman (2010) wrote, “A network is, in its simplest form, a collection of points
joined together in pairs by lines” (p. 1). Visually, a network is illustrated in Figure 2.4.
Figure 2.4. Simple Network.
While some people focus on the nodes, others focus on the lines. However, the patterns
of network connections are what inform our understanding of what actually goes on
within and between networks (Newman, 2010). Further, networks change over time—a
process called network evolution (Carley, 1999). These changes result from
organizational learning. Carley (1999) contended “To explain organizational behavior we
need to understand that the organization, in and of itself, is an intelligent, adaptive and
computational entity…” and “the organization’s intelligence, adaptiveness, and
computational capability results from the detailed, ongoing, interactions…” (p. 8).
41
Various types of networks with which people may be familiar are computer networks,
neural networks, the internet, and social networks, including Facebook, Twitter, and Yik
Yak. Social scientists have studied and analyzed social networks for years, but additional
disciplines found this type of work helpful as well; examples include computer science,
physics, and biology (Newman, 2010). According to Carley (1999), networks can
influence many functions of organizations, including “the rate of information diffusion
among individuals and within organizations, the ability of individuals to acquire and use
information, and the speed, quality, and accuracy of organizational decisions” (p. 3).
Understanding how these networks function requires a familiarity with network
measures.
Newman (2010) wrote, “If we know the structure of a network, we can calculate
from it a variety of useful quantities or measures that capture particular features of the
network typology” (p. 168). Carley (1999) inferred that, in addition to understanding the
structures of networks, scientists could also predict the behavior of networks. If one looks
at the structure of a computer network, he/she can understand how the connections
between computers affect the efficiency with which data are moved between computers.
This concept is applicable to social networks as well. The connections of a social network
affect how people learn (Carley, 1999), how they gather news, form opinions, etc.
(Newman, 2010). Epidemiologists use social networks to predict the spread of disease
(Newman, 2010). Newman (2010) summarized that, “Networks are thus a general yet
powerful means of representing patterns of connections or interactions between parts of
the system” (p. 3).

42
Summary
The purpose of this chapter was to present the theoretical frameworks guiding the
study of EM as a CAS. The theoretical frameworks for this study are complexity theory
and network theory, both of which are collectivist perspectives. This chapter, thus, began
with an overview of collectivism and then moved to complexity theory, network theory,
CASs, collectivist leadership concepts, information diffusion, EM, networks, and the
methods of DNA and response surface methods.
Given that the common themes across the complexity theory literature include,
among other concepts, interaction and interdependency, complexity theory presents a
way to examine EM as a CAS, one that cannot be found in the EM literature. The use of
DNA and RSM provide the necessary tools to explore an EM system in its current state
and then simulate varying levels of network measures to determine which combinations
provide for efficient information flow.

43
CHAPTER THREE
METHODOLOGY
The primary purposes of this study were to investigate enrollment management
(EM) in higher education through the framework of a complex adaptive system (CAS), to
provide colleges and universities with a foundational understanding of what a sustainable
EM system looks like from Dynamic Network Analysis (DNA) perspective, and to
suggest to EM practitioners one method to model (a) their institution’s EM system in its
current status and (b) what network structures optimize information flow, thus cultivating
a sustainable EM system for their institutions. Additionally, I aimed to describe how
formal network structures either promote or inhibit a sustainable EM system within the
bounds of the university under study. For example, to what extent are those involved in
EM interdependent with, or dependent upon, each other? Are there bottlenecks to the
flow of information? Does information flow freely throughout the EM system? In this
study, I considered an EM system to be sustainable if the speed at which information
flows throughout the system remains stable regardless of changes to, and pressures from,
the internal and external environments.
To this end, this study is guided by two overarching questions:
1. To what extent is the research site organized to enable effective and efficient
information flow?
44
2. Which combinations of independent network measures (adaptive leadership,
social capital, and clique structure) produce optimal outcome measures
(information flow) for a sustainable EM system?
The methodologies used to explore the research questions are presented in this
chapter, and the chapter is organized into the following seven sections: (a) research
design, (b) ethical considerations, (c) role of the researcher, (d) setting, (e) selection of
participants, (f) data collection, and (g) data analysis.
Research Design
Because there is no published research on the topic of EM as a CAS, this study
followed similar research designs of other dynamic organizations (Bennett, 2011;
Christiansen, 2011; Hanson, 2009; Marion & Uhl-Bien, 2003; Mcfarland, 2012). The
epistemological perspective for this study is pragmatism which is appropriate in this case
because of the focus on “outcomes of the research” and “solutions to problems”
(Creswell, 2013, p. 29; 2014, p. 10). While methods are important in pragmatism, the
chief aim is to fully understand the problem at hand through appropriate questions
(Creswell, 2013, 2014). An excellent summary of pragmatism as stated by Creswell
(2013) is, “In practice, the individual using this worldview will use multiple methods of
data collection to best answer the research question[s], will employ multiple sources of
data collection, will focus on the practical implications of the research, and will
emphasize the importance of conducting research that best addresses the research
program” (p. 28-29).
45
Given this study’s epistemological perspective, I selected a mixed-methods
research design—specifically, an exploratory sequential mixed methods design that
combines both qualitative and quantitative methods (Creswell, 2013, 2014; Plano Cark &
Creswell, 2008; Tashakkori & Teddlie, 2003; Teddlie & Tashakkori, 2009). In social
science research, mixed methods is considered a strong research design because it
bolsters studies by providing multiple data collection methods (Plano Cark & Creswell,
2008). One weakness found in single method research is that of certain limitations.
Multiple methods (mixed methods) research “can neutralize or cancel out some of the
disadvantages of certain methods (e.g., the detail of qualitative data can provide insights
not available through general quantitative surveys)” (Plano Cark & Creswell, 2008, p.
164).
As shown in Figure 3.1, an exploratory sequential mixed methods research design
starts with a qualitative phase and follows up with a quantitative phase (Creswell, 2014).
The qualitative method helps to develop quantitative measures and instruments (Plano
Cark & Creswell, 2008), which is precisely why the exploratory sequential design was
appropriate for this study. This design also assists in the generalizability of the findings
from the qualitative survey.

46
Figure 3.1. Exploratory Sequential Mixed Methods Research Design. Adapted from
Creswell (2014).
Ethical Considerations
Prior to collecting data, I obtained approval by Clemson University’s Institutional
Review Board (IRB) under an expedited review process. Since the research setting was
an authentic university where I surveyed employees, I used informed consent, and the
participants were able to opt out of the study per IRB standards. I ensured strict
confidentiality of the participants by anonymizing the data and providing no identifiable
information in this dissertation or subsequent publications stemming from this study
(Onwuegbuzie & Collins, 2007). Further, I recoded the names and titles into numerical
values to provide anonymity. The data are stored on a password-protected laptop with a
backup of the data on an encrypted external drive.
Role of the Researcher
Having worked in higher education for 27 years, both in admission and financial
aid, I bring a vast amount of experience to this study. However, all of that experience has
been in small, private liberal arts colleges and universities. Such experience can be
limiting if I approach this study from a myopic viewpoint, failing to remember that public

47
higher education is structured differently and that the pressures of public universities will
differ from private. I must also avoid the temptation to assume that my private college
and university experiences are generalizable to publics as well as to other privates.
Further, I am accustomed to working in very distinct admission and financial aid
departments with little interaction among and between other offices. I must remember
what I wrote in Chapters 1 and 2: Henderson (2001) quoted Jack Maguire, “Enrollment
management is a process that brings together often disparate functions having to do with
recruiting, funding, tracking, retaining, and replacing students as they move toward,
within, and away from the university” (p. 7). Maguire continued that EM was brought
about in order to create a synergy between offices that often acted independently and, at
many times, at cross-purposes (Henderson, 2001). Keeping this in mind will prevent me
from trying to force my own view of higher education institutions into the findings from
this exploratory study.
Setting
The research setting for this study was a small, four-year private, not-for-profit
university, which I called Midwest University (MU), located in a large suburban area
(Statistics) in the Midwest. The official Carnegie Classification for MU is Baccalaureate
Colleges—Arts and Sciences (Statistics). MU is a religiously affiliated institution with
142 full-time faculty and 74 part-time faculty. The 2014-15 enrollment was 1,734
undergraduate students, 99% of whom are full-time, defined as enrolling for at least 12
semester hours per term (Statistics).

48
MU is accredited by the North Central Association of Colleges and Schools
Higher Learning Commission, and its music and education programs are accredited by
the National Association of Schools of Music (NASM) and the National Council for
Accreditation of Teacher Education (NCATE), respectively. According to the MU
website, the student body exhibits the following demographics:
53% female; 47% male
72% are White; 7% are Black or African American; 7% are non-resident aliens;
5% claim two or more races; 4% Hispanic/Latino; 3% unknown; 2% Asian
47% are in-state students and 46% are out-of-state students; 7% come from
foreign countries
MU received 3,981 applications for admission, admitted 74% of those applicants, and
yielded 15% in Fall 2014. The freshman-to-sophomore retention rate (Fall 2013 to Fall
2014) was 79%, and the six-year graduation rate was 66%. MU’s endowment value, as of
FY 2014, was $211,723,000 (National Association of College University Business
Officers, 2015).
Selection of Participants
The selection of one research site allowed for purposive sampling which involves
“selecting certain units or cases ‘based on a specific purpose rather than randomly’”
(Tashakkori & Teddlie, 2003, p. 713; Teddlie & Tashakkori, 2009, p. 173). This study
was the first that applied complexity theory, network theory, and the methodologies of
DNA and response surface techniques to EM. For this reason, purposive sampling was
appropriate given that “Purposive sampling addresses specific purposes related to

49
research questions; therefore, the researcher selects cases that are information rich in
regard to those questions” (Teddlie & Tashakkori, 2009, p. 173).
Network analysis typically requires that participants be bounded by role and
function. Specifically, I solicited the participation of every full-time employee in the
offices that the institution deemed part of their EM model. These were the people who
interacted regularly and were part of the network. Purposive sampling involves “selecting
units (e.g., individuals, groups of individuals, institutions) based on specific purposes
associated with answering a research study’s questions” (Plano Cark & Creswell, 2008,
pp. 200-201). Important to note is that the definition of EM used for this study suggested
that the agents and resources outside of the institutionally-defined EM division may have
become participants as well. However, no one outside of the formal EM structure
participated.
Data Collection
To gather the data necessary for this study, I utilized two survey instruments (see
Figure 3.1). The qualitative survey for this study was designed to identify (1) what
interactions between people occurred within the formal EM structure of the research site
as well as outside of the formal EM structure, (2) the knowledge and skills required to
perform the various roles within the EM system, and (3) the resources required to
perform the roles of those in the system. For example, the survey consisted of questions
such as, “What do you most need to know or understand to perform your job
effectively?” and “What skills do you most need to perform your job effectively?” Using
NVivo ("NVivo for Mac," 2015), I categorized the responses using open coding as

50
described by Corbin and Straus (1990). Examples of coding results for the question
asking about first aforementioned question are in Table 3.1. Using these categorized
responses from the qualitative survey, I built a subsequent quantitative survey with closed
ended, multiple and single choice answers (Creswell, 2014). The categories helped build
the response scale for the quantitative survey (see Appendix C).
Table 3.1
Sample Categories for the Response Scale for Knowledge in the Quantitative Survey
Question Categories Assigned from Open Coding
What do you most need to
know or understand to
perform your job
effectively?
Academic Majors; Accounting procedures, Residence
life procedures, Marketing trends
Additionally, I asked for general demographic information, including gender,
alumnus[a] status, and length that the participants worked in the EM division of MU.
After both surveys were drafted, I submitted the study proposal to Clemson’s Institutional
Review Board (IRB) for approval, which was given (see Appendix D).
The software I used to design, distribute, and collect the survey data was Qualtrics
("Qualtrics," 2015). I collected the names, titles, and email addresses of MU’s EM
Department and solicited their participation via the email functionality built into
Qualtrics. I waited one week before sending a reminder email to those who had not
completed each survey. After two weeks, I closed the surveys and downloaded the
responses into Microsoft Excel.

51
Software
Data analysis for this study included two software packages: ORA (2015b) and
Minitab ("Minitab," 2016). As described by Kathleen Carley (2014), “ORA is a network
analytic tool developed by CMU and Netanomics, that allows the user to fuse, analyze,
visualize, and forecast behavior given network data” (p. 2). Further,
ORA is a network analysis tool that detects risks or vulnerabilities of an
organization’s design structure. The design structure of an organization is the
relationship among its personnel, knowledge, resources, and tasks entities. These
entities and relationships are represented by the Meta-Matrix. Measures that take
as input a Meta-Matrix are used to analyze the structural properties of an
organization for potential risk. (Carley et al., 2013, p. iii)
Since researchers previously used ORA to visualize the interactions within and between
networks as well as perform “what-if scenarios” (Christiansen, 2011, p. 52), ORA was
the appropriate tool for exploring EM as a CAS where effects of changes in the network
structures at MU could provide useful information about the efficiency of information
flow throughout the EM system.
Minitab ("Minitab," 2016) is a statistical software package useful for design of
experiments methodologies such as RSM.
Data Analysis
Dynamic Network Analysis
Dynamic Network Analysis (DNA) was the primary method for analyzing the
network data supplied by the two surveys. Because I studied EM as a CAS, DNA

52
provided the appropriate method for my research in that DNA provides for “modeling
and analyzing organizations as complex adaptive systems” (Schreiber & Carley, 2006, p.
61). DNA allows one to study the structure of organizations and how that structure
inhibits or promotes learning, adapting, information processing, and communication. In
fact, “…information processing, communication, and knowledge management are keys to
effective organizational performance and adaptability” (Carley & Kamneva, 2004, p. 1).
Through DNA, we can learn how networks will evolve, change, and adapt
(Carley, Martin, & Hancock, n.d.). DNA can serve as a risk analyzer for organizations,
looking at various levels of the organization including departments, divisions, teams, etc.
(Schreiber & Carley, 2005). Traditionally, examining social networks resulted in static,
unchanging snapshots of interactions. These serve little purpose when trying to
understand an organization that is dynamic (Berger-Wolf & Saia, 2006). Thus, DNA
provides a method of examining networks of people that change, learn, adapt, etc. As
Carley (forthcoming) argued, using a method that just “connects the dots” (p. 2) to try to
understand a setting in which those dots may change, move, leave, or reappear is
extremely limiting. Further, “social network analysis (SNA) has focused on small,
bounded networks, with 2-3 types of links (such as friendship and advice) among one
type of node (such as people), at one point in time, with close to perfect information”
(Carley, forthcoming, p. 2). DNA can analyze very large networks, different types of
nodes (e.g. knowledge, tasks, advice) as well as simulate the effects of changes within a
network (Carley, forthcoming) or between networks. DNA investigates the meta-matrix,

53
defined as the depiction of the relationships between people, knowledge, tasks, and
resources (Carley, forthcoming).
Carley and Kamneva (2004, p. 2) presented the information in Table 3.2 to reflect
a meta-matrix:
Table 3.2
Meta-Matrix for Organizational Design
People Knowledge Resources Tasks
People Interaction
Network
Knowledge
Network
Resource
Network
Assignment
Network
Knowledge Information
Network
Resource Skill
Needs Network
Task Skill
Needs Network
Resources Substitutes and
Coordinated
Resources
Network
Task Resource
Needs Network
Tasks Task
Precedence
Network
Note. Adapted from Carley and Kamneva (2004)
In Table 3.2, the first row represents that part of the organization that can be changed
rather quickly: interaction, knowledge, resources, and tasks. The contents of the other
rows are more constrained because of capital and other requirements necessary to change
those aspects (Carley & Kamneva, 2004).

54
Network Measures
The network measures, both independent and dependent, are specified in Table
3.3.
Table 3.3
Network Measures
Network
Structure Measure Definition
Adaptive
Leadership
Closeness
Centrality
Indicates a “node that is closest to all other
nodes and has rapid access to all information”
(Carley et al., 2013, p. 3).
Clique
Structure
Clustering
Coefficient
A measure indicating clique structure in
organizations. Cliques are information
processing network structures with the
characteristic of agents interacting within cliques
rather than outside of cliques (Marion et al.,
2016). The clustering coefficient “Measures the
degree of clustering in a network by averaging
the clustering coefficient of each node, which is
defined as the density of the node's ego network”
(Carley, 2015b)(Carley, 2015).
Social
Capital
Resource
Capability
Direct and indirect access to resources (Briley,
Stuart, & Marion, forthcoming)
Before I could run the network analyses, I had to code the multiple choice
responses into a binary format where “1” would indicate a relationship between agents
(who interacted with whom), the knowledge required to perform their tasks (who selected
which categories of knowledge), etc. A “0” would indicate no relationship. Once this
coding was complete, I built matrices that would allow ORA to identify links between

55
nodes (agent x agent; agent x resource; etc.). An example of a partial agent-by-agent
matrix used in this study is in Table 3.4.
Table 3.4
Agent x Agent Matrix in Binary Form
Enrollment
MGMT
Staff_1
Enrollment
MGMT
Staff_2
Enrollment
MGMT
Staff_3
Enrollment
MGMT
Staff_4
Enrollment
MGMT
Staff_5
Enrollment
MGMT
Staff_6
Enrollment
MGMT
Staff_1 0 0 0 1 0 1
Enrollment
MGMT
Staff_2 1 0 1 1 1 0
Enrollment
MGMT
Staff_3 0 0 0 0 0 1
Enrollment
MGMT
Staff_4 0 0 0 0 0 1
Enrollment
MGMT
Staff_5 0 1 1 1 0 0
Enrollment
MGMT
Staff_6 1 0 0 1 0 0
After all the matrix data were appropriately entered into ORA, I ran network
measures for this study to get a sense of the network structures that existed in MU’s EM
Department and between individuals in the EM Department and other individuals outside
of EM. The specific independent measures for this study were closeness centrality
(adaptive leadership), resource capability (social capital), and clustering coefficient
(clique structure); the dependent measure was average speed (information flow). I also
visualized the networks using ORA’s visualization tools. These images provided another
perspective of the network typology.

56
Response Surface Methods
Response Surface Methods (RSM) is a design of experiments (DOE)
methodology. Researchers utilize DOE “for studying any response that varies as a
function of one or more independent variables” (Mathews, 2005, p. xii); Mathews
contended it is essential for studying complex systems. The purpose for using RSM is to
predict responses (outcomes) as a function of multiple controllable factors (Anderson &
Whitcomb, 2005). Carley, Kamneva, and Reminga (2004) defined RSM as “a collection
of statistical and mathematical techniques useful for developing, improving, and
optimizing processes” (p. 1). Kenett, Steinberg, and Yoskovich (2015) indicated that
RSM “can be a great tool in experimentally optimizing conditions” (p.1). Originally,
chemists developed RSM when they sought to determine the optimal conditions for
chemical reactions (Box & Wilson, 1951). Carley and Kamneva (2004) applied
optimization methods like RSM to network structures in corporate and other
organizations, structures such as interaction networks, knowledge networks, resource
networks, and assignment networks. According to Anderson and Whitcomb (2005),
Response surface methods offer statistical design of experiment tools that lead to
peak processing performance. RSM produces precise maps based on
mathematical models. It can put all your responses together via sophisticated
optimization approaches, which ultimately lead to the discovery of sweet spots
where you meet all specifications at a minimal cost. (p. 1)
This lends credence to the purpose of my use of RSM in this study of EM as a CAS: I
wanted to determine optimum levels of the adaptive leadership, social capital, and clique

57
structure—independent network measures—that will most effectively promote
information diffusion, my dependent network measure.
To conduct the Response Surface Methodology (RSM) analysis, I used Minitab
Version 17.3.1 for Mac ("Minitab," 2016). Minitab facilitates Design of Experiments
analyses such as RSM. To prepare the data necessary for RSM, I utilized ORA’s
optimizer. In short, the optimizer added and removed links until the network reached the
target levels of closeness centrality, resource capability, and clustering coefficient (the
independent measures). For example, I set one optimization run for a high level of
closeness centrality, and average level of clustering coefficient, and a minimum level of
resource capability. For another variation, I set an average level of closeness centrality,
an average level of clustering coefficient, and a maximum level of resource capability.
All of the combinations of independent measures I selected are listed in Table 3.4.

58
Table 3.4
Optimization Outcomes
Clustering Centrality
Resource
Capability
Minimum Average Minimum
Average Maximum Minimum
Maximum Average Minimum
Maximum Minimum Average
Average Minimum Maximum
Average Average Average
Minimum Average Maximum
Average Average Average
Average Maximum Maximum
Maximum Maximum Average
Maximum Average Maximum
Average Minimum Minimum
Minimum Maximum Average
Minimum Minimum Average
Average Average Average
After the optimizer finished, each of the independent and dependent measures resulting
from the 15 optimization runs were entered into an Excel spreadsheet and then uploaded
into Minitab. The RSM results were plotted, and the combinations of independent
measures that produced the most stable flow of information were selected.
Summary
The primary purposes of this study were to investigate EM in higher education
through the framework of a CAS, to provide colleges and universities with a foundational
understanding of what a sustainable EM system looks like from a DNA perspective, to
suggest to EM practitioners one method to model (a) their institution’s EM system in its
current status and (b) what network structures optimize information flow, thus cultivating

59
a sustainable EM system for their institutions. Additionally, I aimed to describe how
formal network structures either promote or inhibit a sustainable EM system within the
bounds of the university under study. To this end, this study is guided by two overarching
questions:
1. To what extent is the research site organized to enable effective and efficient
information flow?
2. Which combinations the independent network measures (adaptive leadership,
social capital, and clique structure) produce optimal outcome measures
(information flow) for a sustainable EM system?
The participants in this study were bound by role.
Using purposive sampling, I solicited the participation of every full-time
employee in the offices that the institution deemed part of their EM Department. These
are the people who interact regularly and are part of the network. I presented the
arguments supporting the research design for this study (exploratory sequential mixed-
methods), the software used for data collection (Qualtrics), and the software used to
analyze the data (ORA and Minitab).

60
CHAPTER FOUR
FINDINGS
The primary purposes of this study were to investigate Enrollment Management
(EM) in higher education through the framework of a complex adaptive system (CAS), to
provide colleges and universities with a foundational understanding of what a sustainable
EM system looks like from Dynamic Network Analysis (DNA) perspective, and to
suggest to EM practitioners one method to model (a) their institution’s EM system in its
current status and (b) what network structures optimize information flow, thus cultivating
a sustainable EM system for their institutions. Additionally, aimed to describe how
formal network structures either promote or inhibit a sustainable EM system within the
bounds of the university under study. For example, to what extent are those involved in
EM interdependent with, or dependent upon, each other? Are there bottlenecks to the
flow of information? Does information flow freely throughout the EM system? This
study considered an EM system to be sustainable if the speed at which information flows
throughout the system remains stable regardless of changes to, and pressures from, the
internal and external environments.
To this end, this study is guided by two overarching questions:
1. To what extent is the research site organized to enable effective and efficient
information flow?

61
2. Which combinations of independent network measures (adaptive leadership,
social capital, and clique structure) produce optimal outcome measures
(information flow) for a sustainable EM system?
Adaptive leadership was operationalized as closeness centrality; social capital, as
resource capability; and clique structure as clustering. Table 4.1 details the definitions of
these measures.
Table 4.1
Network Measures
Network
Structure Measure Definition
Adaptive
Leadership
Closeness
Centrality
Indicates a “node that is closest to all other
nodes and has rapid access to all information
(Carley et al., 2013, p. 3).
Clique
Structure
Clustering
Coefficient
A measure indicating clique structure in
organizations. Cliques are information
processing network structures with the
characteristic of agents interacting within cliques
rather than outside of cliques (Marion et al.,
2016). The clustering coefficient “Measures the
degree of clustering in a network by averaging
the clustering coefficient of each node, which is
defined as the density of the node's ego network”
(Carley, 2015b).
Social
Capital
Resource
Capability
Direct and indirect access to resources (Briley,
Stuart, & Marion, forthcoming)

62
Before discussing the findings of this research, a reminder of the guiding
definition of EM is appropriate:
Enrollment management is not an insular division or department, but a living,
complex adaptive system whose core strategic function (Wilkinson et al., 2007) is
to coordinate people, knowledge, tasks, and resources for identifying, recruiting,
enrolling, retaining, and graduating students (Henderson, 2001) at levels that
support the mission (Wilkinson et al., 2007) of the institution. Its end is to create
and maintain dynamic, sustainable enrollment conditions that allow the institution
to survive and persist, regardless of the forces that push it toward extinction. An
effective EM system is anticipatory (Wilkinson et al., 2007) of internal and
external pressures, requires input from and cooperation of the entire campus
(Wilkinson et al., 2007), and takes into account the physical and instructional
capacity of the institution, its current and potential market positions, the financial
requirements of the institution, the standards of accreditation, and the limits of
regulation.
A CAS relies on interactions of agents to sustain its existence. In network
analysis, agents may be individual groups, people, or organizations. The system must be
nimble to both internal and external changes and pressures. As such, this study moved
beyond the formal organizational structure of an EM Department and focused on the
informal interactions and network structures that influence information diffusion, which
Kalsbeek (2001) contended is the “most important material driving strategic enrollment
management” (p. 189).

63
Since human agents contain information in a social network, our understanding
of an agent’s position in the network as well that agent’s connectivity to other agents is
vital. The higher an agent’s (or, in network terminology, node’s) connectivity, the more
likely that agent (node) is to receive information. Additionally, with network analysis, we
can see what happens if any particular node is removed. If that node is critical to the flow
of information throughout the network, we need to see what will happen to the network
structure when that node is removed. Later in the chapter, we will see later why this is
important specifically to MU. This study examined the network structure of an EM
system at a small, private university in the Midwest (named, for the purposes of this
research, Midwestern University, abbreviated as MU). This chapter begins with a
reminder of the research method and the research site. Descriptive statistics and typology
of the network follows, and the chapter concludes with the findings of both the network
analysis and the response surface methodology.
Research Method and Site
Two survey instruments were used to gather the network data necessary for this
study. The first survey was qualitative; its purpose was to identify (1) what interactions
between people occurred within and outside of the formal EM structure of the research
site, (2) the knowledge required to perform the various roles within the EM system, and
(3) the resources required to perform the roles of those in the system as well as the
agents’ access to those resources. See Appendices A and B for the surveys used for this
study.

64
Using NVivo ("NVivo for Mac," 2015), the responses were categorized using
open coding as described by Corbin and Straus (1990). Using the categorized responses
from the qualitative survey, a subsequent quantitative survey was built with multiple and
single choice answers (Creswell, 2014). Further, respondents were asked for general
demographic information such as gender, alumnus[a] status, and how long the
participants worked in the EM division of MU. The intention of gathering demographic
data was to see if a certain demographic was more central to information flow throughout
the network.
Qualtrics ("Qualtrics," 2015) software was used to design, distribute, and collect
the survey data. The participants’ responses were exported to the quantitative survey
from Qualtrics into Microsoft Excel to process those data for import into a DNA software
named ORA (2015b). To conduct the response surface analysis, including producing the
response surface plots, I utilized Minitab ("Minitab," 2016).
Descriptive Statistics and Network Typology
Twenty out of 21 invited participants completed both surveys for a response rate
of 95.2%. Table 4.2 shows the descriptive statistics of the participants.

65
Table 4.2
Descriptives of Participants
Male 5 (25%)
Female 15 (75%)
Alumnus(a) 2 (10%)
Non-Alumnus(a) 18 (90%)
Worked at MU Less than one year 4 (20%)
1 – 3 years 7 (35%)
4 – 6 years 3 (15%)
7 – 10 years 3 (15%)
10+ years 3 (15%)
Surprisingly, few employees of the MU EM Department were alumni. Experience would
lead one to think that close to 50% of the enrollment staff would be alumni of MU, given
their knowledge of the institution and their emotional ties to their alma mater. Fifty-five
percent of the staff have three or fewer years’ experience at MU.
I distinguished formal leaders from and informal leaders based on title. Those
with the titles of director or vice-president are formal leaders for the purposes of
reporting demographics. Two formal leaders have less than one year of tenure at MU;
two have one to three years of tenure at MU; two have four to six years of tenure at MU.
As shown in Table 4.3, there are 285 nodes in the MU EM meta-network, and those
nodes were classified into five networks. Though there were 20 respondents, 285 total
nodes existed in the meta-network, as shown in Table 4.3.

66
Table 4.3
Meta-Network Statistics
Nodeset Count 5
Node Count 285
Network Count 5
Total Density 0.170
The density of the meta-network reveals the ratio of the number of ties divided by the
total number of possible ties. Put another way, density is a measure of connectivity, or
“how easy or how difficult it is for any two nodes to form a connection” (Colchester,
2015c). As barriers to interactions diminish, the network becomes denser. The denser a
network, the faster information can flow through it. When solely examining the network
consisting of the EM staff (agent x agent), the density increases to 0.249 (see social
density in Table 4.4). This makes sense as the EM staff network consists of 21 people.
When examining the whole meta-network, all of the resources (who are agents outside of
EM) dilute the density as there is an inverse relationship between network size and
density (Carley, 2015a). Finally, the average communication speed of 0.433 demonstrates
that interaction within the meta-network is fairly high (see Table 4.5).
Table 4.4 displays the nodeset counts within the meta-network. Resources are
people to whom members of the EM Department go to when they need specific
information to perform their roles at MU. Knowledge represents what people need to
know in order to do their jobs. Role classifies the many people outside EM by the office

67
in which they work (e.g. Provost, Communications, etc.). Finally, Task refers to skills
that the enrollment staff need to perform their roles.
Table 4.4
Nodeset Counts per Network
Resources 186
Enrollment Management Staff 21
Knowledge 53
Role 9
Task 16
ORA’s Key Entity Report “Identifies key entities and groups who by virtue of
their position in the network are critical to its operation” (Carley, 2015b). Table 4.4
presents some of the performance indicators of the EM network, as calculated by the Key
Entities Report.
Table 4.5
Key Entities Report
Measure Value Definition
Overall Complexity 0.170 The overall density of the network
(Wasserman & Faust, 1994).
Social Density 0.249 Density of the agent x agent
networks (Wasserman & Faust,
1994).
Social Fragmentation 0.000 Amount of disconnectivity of
nodes (Borgatti, 2003; Breiger,
Carley, & Pattison, 2003).
Average Communication
Speed
0.433 The average speed with which any
two (reachable) nodes can interact
(Carley, 2002).
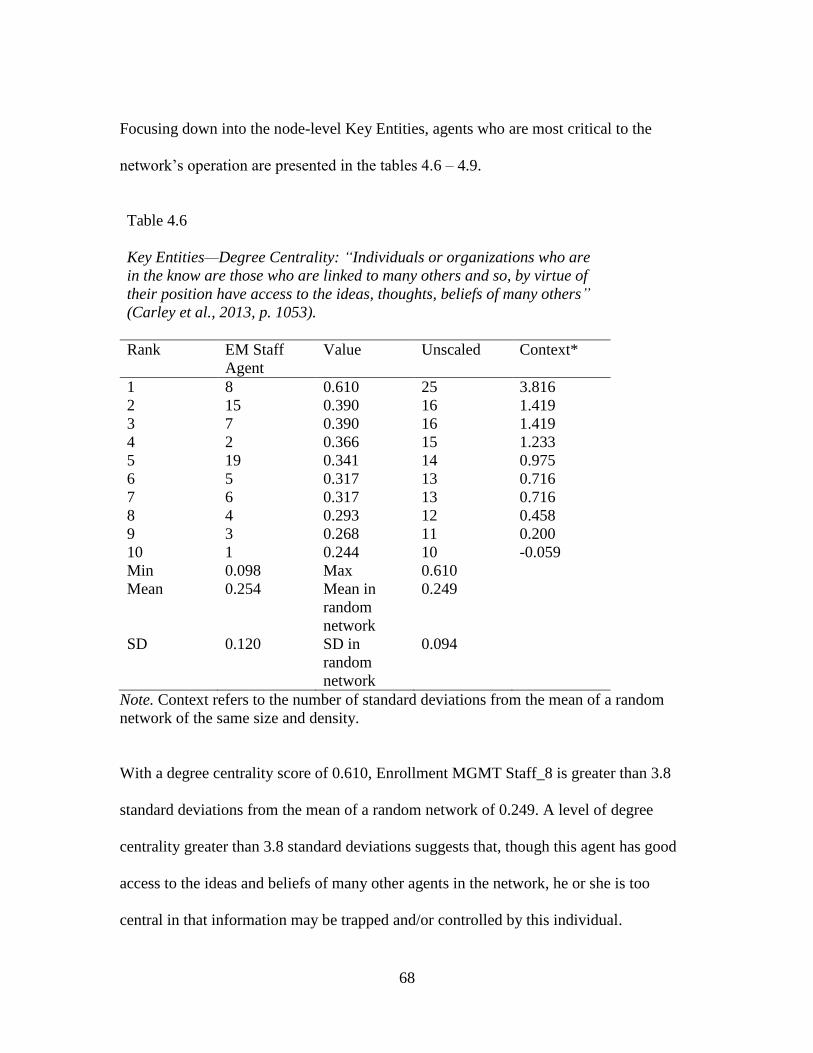
68
Focusing down into the node-level Key Entities, agents who are most critical to the
network’s operation are presented in the tables 4.6 – 4.9.
Table 4.6
Key Entities—Degree Centrality: “Individuals or organizations who are
in the know are those who are linked to many others and so, by virtue of
their position have access to the ideas, thoughts, beliefs of many others”
(Carley et al., 2013, p. 1053).
Rank EM Staff
Agent
Value Unscaled Context*
1 8 0.610 25 3.816
2 15 0.390 16 1.419
3 7 0.390 16 1.419
4 2 0.366 15 1.233
5 19 0.341 14 0.975
6 5 0.317 13 0.716
7 6 0.317 13 0.716
8 4 0.293 12 0.458
9 3 0.268 11 0.200
10 1 0.244 10 -0.059
Min 0.098 Max 0.610
Mean 0.254 Mean in
random
network
0.249
SD 0.120 SD in
random
network
0.094
Note. Context refers to the number of standard deviations from the mean of a random
network of the same size and density.
With a degree centrality score of 0.610, Enrollment MGMT Staff_8 is greater than 3.8
standard deviations from the mean of a random network of 0.249. A level of degree
centrality greater than 3.8 standard deviations suggests that, though this agent has good
access to the ideas and beliefs of many other agents in the network, he or she is too
central in that information may be trapped and/or controlled by this individual.

69
Table 4.7
Key Entities—Closeness Centrality: Indicates a “node that is closest to all
other nodes and has rapid access to all information (Carley et al., 2013,
p. 3).
Rank EM Staff
Agent
Value Unscaled Context*
1 21 0.526 0.026 0.252
2 8 0.488 0.024 -0.416
3 15 0.426 0.021 -1.495
4 2 0.417 0.021 -1.649
5 5 0.392 0.020 -2.073
6 7 0.392 0.020 -2.073
7 14 0.385 0.019 -2.204
8 3 0.377 0.019 -2.330
9 19 0.351 0.018 -2.789
10 16 0.339 0.017 -2.995
Min 0.048 Max 0.526
Mean 0.310 Mean in
random
network
0.512
SD 0.121 SD in
random
network
0.058
Note. Context refers to the number of standard deviations from the mean of a random
network of the same size and density.
In closeness centrality, Enrollment MGMT Agent_21 has the highest value, indicating
that he/she has rapid access to information because of this person’s closeness to all other
nodes in the network. (Carley et al., 2013). Although Enrollment MGMT Agent_8 has
the highest number of connections throughout the network, Enrollment MGMT Agent_21
is actually closest to all other agents in the sense of the number of paths it takes for
Agent_21 to reach all other agents and vice-versa. The scores of agents at the lower end
of the closeness centrality are of interest. The bottom eight are all greater than 1 standard
deviation below the mean, which indicates that these agents are peripheral to the

70
information exchange network—and the remaining, unranked agents are even more
distant from the information network. It appears that agents in this network may not be
well linked, but further information is needed.
Table 4.8
Key Entities—Most Knowledge: “Individuals or organizations who are
high in out-degree for knowledge have more expertise or are associated
with more types of knowledge than are others” (Carley et al., 2013, p.
967).
Rank EM Staff
Agent
Value Unscaled
1 8 0.811 43
2 21 0.660 35
3 7 0.547 29
4 4 0.528 28
5 11 0.509 27
6 9 0.434 23
7 5 0.415 22
8 14 0.377 20
9 1 0.358 19
10 12 0.358 19
Min 0 Max 0.811
Mean 0.346
SD 0.189
Enrollment MGMT Agent_8 has the highest access to knowledge in the network, and
Enrollment MGMT Agent_21 is in second place. Both of these agents’ knowledge
measures are > 1 standard deviation above the mean of all agents in the network,
indicating again that they have much higher access to knowledge than any other person.
For anyone to access information, this finding suggests that people must interact with
these two agents; this may indicate that knowledge is hard to access for the rest of the
staff.

71
Table 4.9
Key Entities—Most Resource: “Individuals or organizations who are high
in out-degree for resources have more resources or are associated with
more types of resources than are others” (Carley et al., 2013, pp. 967-
968).
Rank EM Staff
Agent
Value Unscaled
1 17 0.199 37
2 18 0.177 33
3 12 0.172 32
4 8 0.167 31
5 3 0.156 29
6 21 0.145 27
7 1 0.113 21
8 4 0.113 21
9 15 0.091 17
10 7 0.091 17
Min 0 Max 0.199
Mean 0.102 SD 0.049
Enrollment MGMT Staff_17 has the greatest access to resources in the network. As a
reminder, resources for this study are individuals in departments outside of MU’s EM
Department. An agent’s interaction with the resources is a key indicator of resource
capability. Interestingly, Enrollment MGMT Staff_8 and Enrollment MGMT Staff_21
are in the middle of the ranking despite their high levels of degree and closeness
centralities displayed in the previous tables.
Moving the focus of our analysis from specific agents to that of offices or
departments who serve as resources (Table 4.10), the Key Entities Report shows the
offices whose personnel were, themselves, key resources in the network.

72
Table 4.10
Key Entities—Most Agent: “For any node, e.g. an individual or a resource, the
out-links are the connections that the node of interest has to other nodes. For
example, imagine an agent by knowledge network where the number of out-links an
agent would have is the number of pieces of knowledge it is connected to” (Carley,
2015b).
Rank Office Value Unscaled
1 Communications
Agent_82
0.810 17
2 Information Services
Agent_28
0.619 13
3 Information Services
Agent_19
0.476 10
4 Communications
Agent_85
0.476 10
5 Athletics Agent_103 0.429 9
6 Athletics Agent_106 0.429 9
7 Advancement/Alumni
Agent_75
0.381 9
8 Athletics Agent_104 0.381 8
9 Academic Affairs
Agent_11
0.381 8
10 Finance and
Administration
Agent_161
0.091 8
Min 0 Max 0.810
Mean 0.102 SD 0.137
All of the top ten resources were more than one standard deviation above the mean.
Expanding the report to the top 50 resources revealed that resource agents 11 –26 were
also more than one standard deviation above the mean, and resource agents 27 – 103
were within one standard deviation of the mean. This indicates that personnel in many
offices provide information necessary for EM to perform its roles at MU; this is a
positive finding. The more important consideration is how many of the EM staff have
direct access to these resources?

73
The Student Affairs office was not represented in the top sources of resources.
Since EM does not stop when an incoming student matriculates, it is surprising that no
personnel in the Student Affairs division served as an important resource for EM staff.
This means that few EM staff identified residence life, Greek life, student involvement
for leadership, career services, or public safety personnel as resources. (Note that this
does not indicate that such functions are unimportant, only that they are not considered
resources by respondents). Given the importance of these offices to parents of
prospective students, this is puzzling.
The Key Entities Report also ranks the top ten knowledge sets that the
participants identified as important to performing their roles in EM. Table 4.11 presents
those data.

74
Table 4.11
Key Entities—Most Agent: “For any node, e.g. an individual or a resource, the
out-links are the connections that the node of interest has to other nodes. For
example, imagine an agent by knowledge network where the number of out-links an
agent would have is the number of pieces of knowledge it is connected to” (Carley,
2015b).
Rank Knowledge Set Value Unscaled
1 Interpersonal
communication
0.810 17
2 Customer service
skills
0.714 13
3 Admission policies
and procedures
0.619 10
4 Electronic
communication
0.619 10
5 Telephone etiquette 0.619 9
6 Ability to explain to
parents and students
the “value equation”
of MU
0.571 9
7 How students and
parents choose a
college
0.571 9
8 Academic majors 0.524 8
9 How the University
can be differentiated
0.524 8
10 Working knowledge
of Slate software
0.524 8
Min 0.095 Max 0.810
Mean 0.346 SD 0.164
All of the top 10 knowledge sets were more than one standard deviation above the mean.
Expanding the report to the top 50 knowledge sets revealed that knowledge sets 11 – 46
were within one standard deviation of the mean, and 47 – 50 were more than one
standard deviation below the mean. One may notice that a key knowledge set that EM
staff must possess in order to perform their roles for MU involve communication of some

75
kind; actual oral or written communication skills are ranked 1, 2, 4, and 5, while
knowledge such as admission policies and procedures and academic majors (ranked 3 and
8, respectively) are key to information flow as well. Being able to communicate inside
and outside of the EM Department, is well recognized by the EM staff.
Network Visualization
Looking at the statistics is one way to understand how the network is structured,
but network graphs help to visualize network structures. Figure 4.1 provides a view of the
meta-network that includes not only the EM staff, but resource networks and knowledge
networks.
Figure 4.1. Visualization of MU’s Meta-Network.
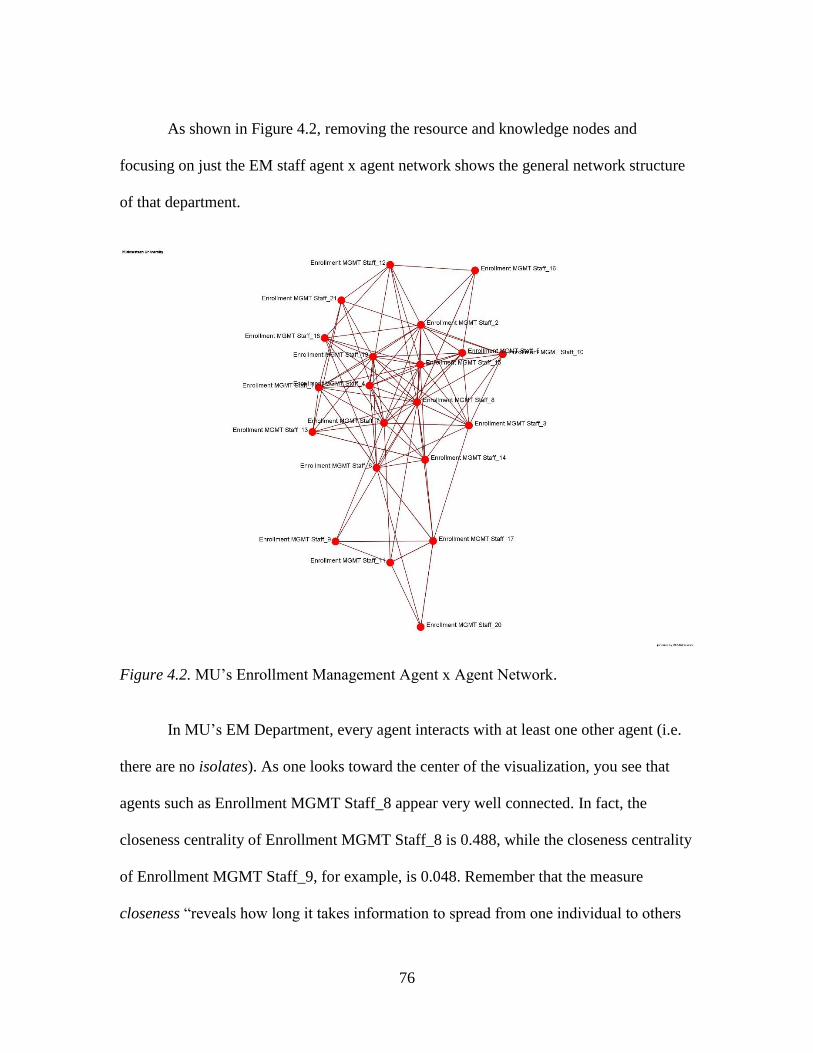
76
As shown in Figure 4.2, removing the resource and knowledge nodes and
focusing on just the EM staff agent x agent network shows the general network structure
of that department.
Figure 4.2. MU’s Enrollment Management Agent x Agent Network.
In MU’s EM Department, every agent interacts with at least one other agent (i.e.
there are no isolates). As one looks toward the center of the visualization, you see that
agents such as Enrollment MGMT Staff_8 appear very well connected. In fact, the
closeness centrality of Enrollment MGMT Staff_8 is 0.488, while the closeness centrality
of Enrollment MGMT Staff_9, for example, is 0.048. Remember that the measure
closeness “reveals how long it takes information to spread from one individual to others
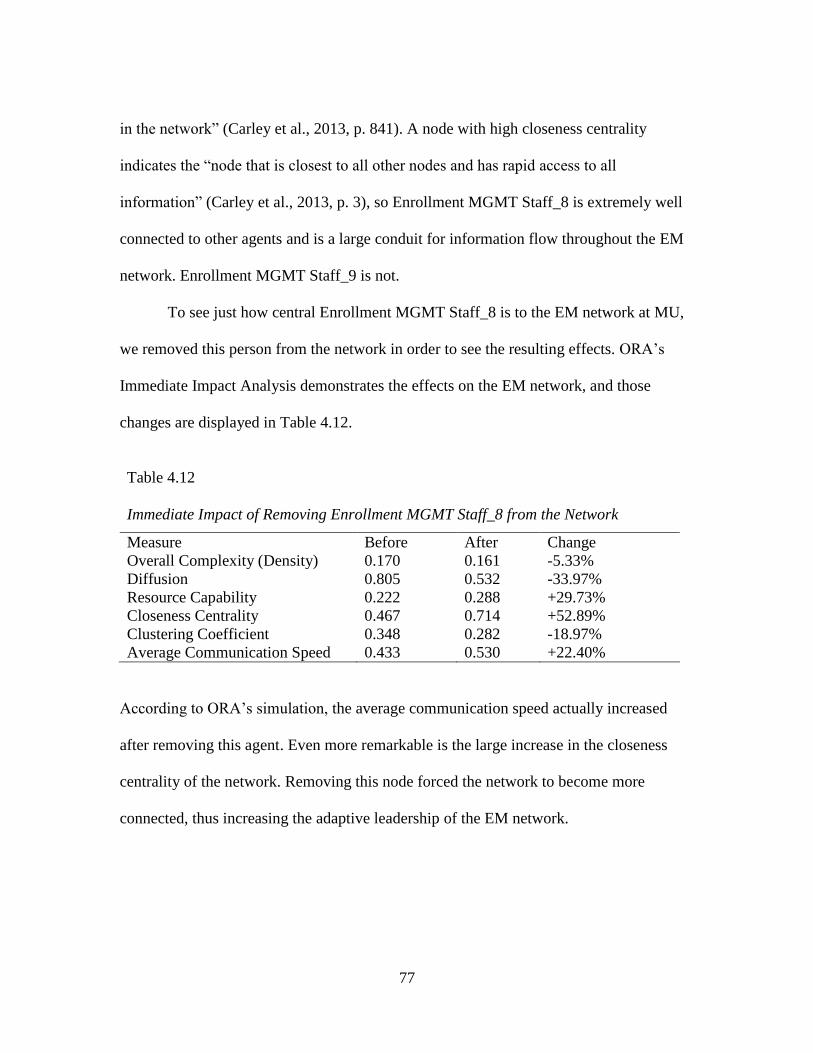
77
in the network” (Carley et al., 2013, p. 841). A node with high closeness centrality
indicates the “node that is closest to all other nodes and has rapid access to all
information” (Carley et al., 2013, p. 3), so Enrollment MGMT Staff_8 is extremely well
connected to other agents and is a large conduit for information flow throughout the EM
network. Enrollment MGMT Staff_9 is not.
To see just how central Enrollment MGMT Staff_8 is to the EM network at MU,
we removed this person from the network in order to see the resulting effects. ORA’s
Immediate Impact Analysis demonstrates the effects on the EM network, and those
changes are displayed in Table 4.12.
Table 4.12
Immediate Impact of Removing Enrollment MGMT Staff_8 from the Network
Measure Before After Change
Overall Complexity (Density) 0.170 0.161 -5.33%
Diffusion 0.805 0.532 -33.97%
Resource Capability 0.222 0.288 +29.73%
Closeness Centrality 0.467 0.714 +52.89%
Clustering Coefficient 0.348 0.282 -18.97%
Average Communication Speed 0.433 0.530 +22.40%
According to ORA’s simulation, the average communication speed actually increased
after removing this agent. Even more remarkable is the large increase in the closeness
centrality of the network. Removing this node forced the network to become more
connected, thus increasing the adaptive leadership of the EM network.

78
Newman Grouping
Another characteristic of networks that describes the topology is Newman
Grouping which identifies clusters of communities in the network. To discover where
clusters may exist in the EM network, a method of coloring nodes by Newman Grouping
was utilized. In this context, a community “consists of a subset of nodes within which the
node to node connections are dense, and the edges [links or ties] to nodes in other
communities are less dense” (Carley, 2015a).
Figure 4.3. Community Structure as Calculated by Newman’s Grouping Algorithm.
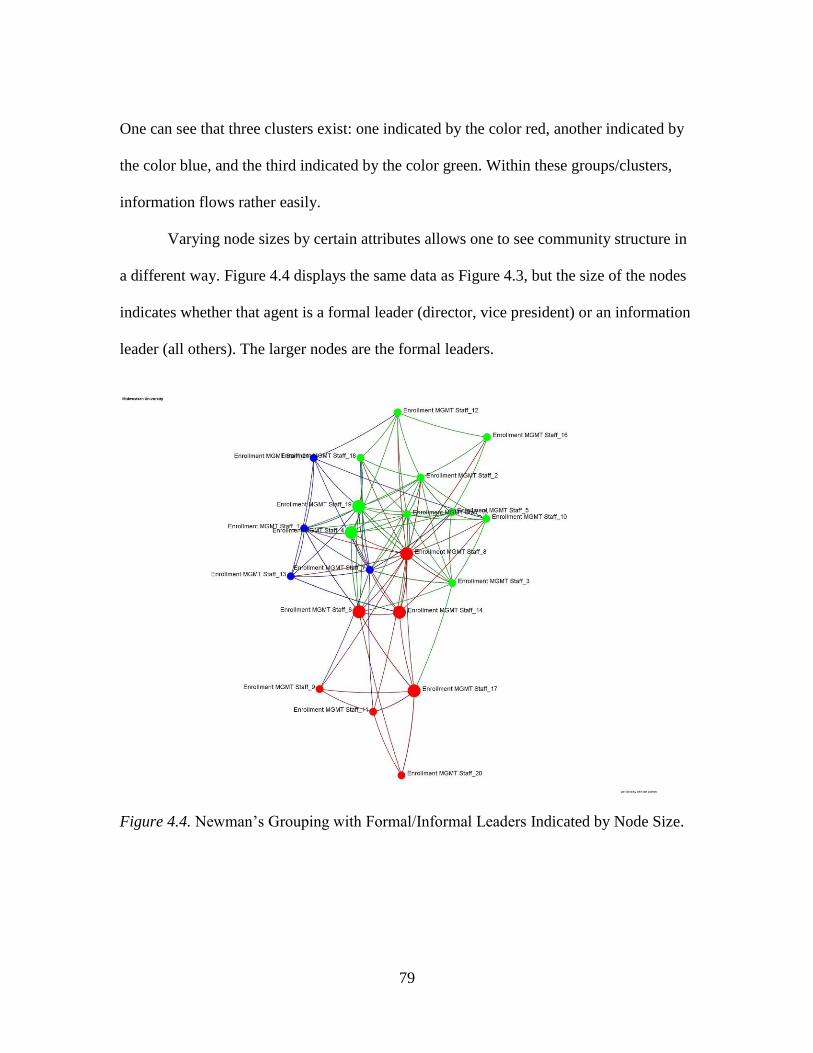
79
One can see that three clusters exist: one indicated by the color red, another indicated by
the color blue, and the third indicated by the color green. Within these groups/clusters,
information flows rather easily.
Varying node sizes by certain attributes allows one to see community structure in
a different way. Figure 4.4 displays the same data as Figure 4.3, but the size of the nodes
indicates whether that agent is a formal leader (director, vice president) or an information
leader (all others). The larger nodes are the formal leaders.
Figure 4.4. Newman’s Grouping with Formal/Informal Leaders Indicated by Node Size.

80
The attribute that may explain the clustering results is office. Figure 4.5 colors
nodes by the office in which that person works. The formal EM Department is divided
into four discreet functions: (a) enrollment (the red nodes), (b) admission (the blue
nodes), (c) financial aid (the green nodes), and (d) data support (the yellow nodes).
Figure 4.5. Clusters by office.
One can easily see that each function clusters together, and this is not surprising
given that cliques are cohesive groups of highly interconnected people, often with similar
interests, skills, backgrounds, etc. (Haythornthwaite, 1996). Clique structure in networks
promotes information diffusion (Cowan & Jonard, 2004).
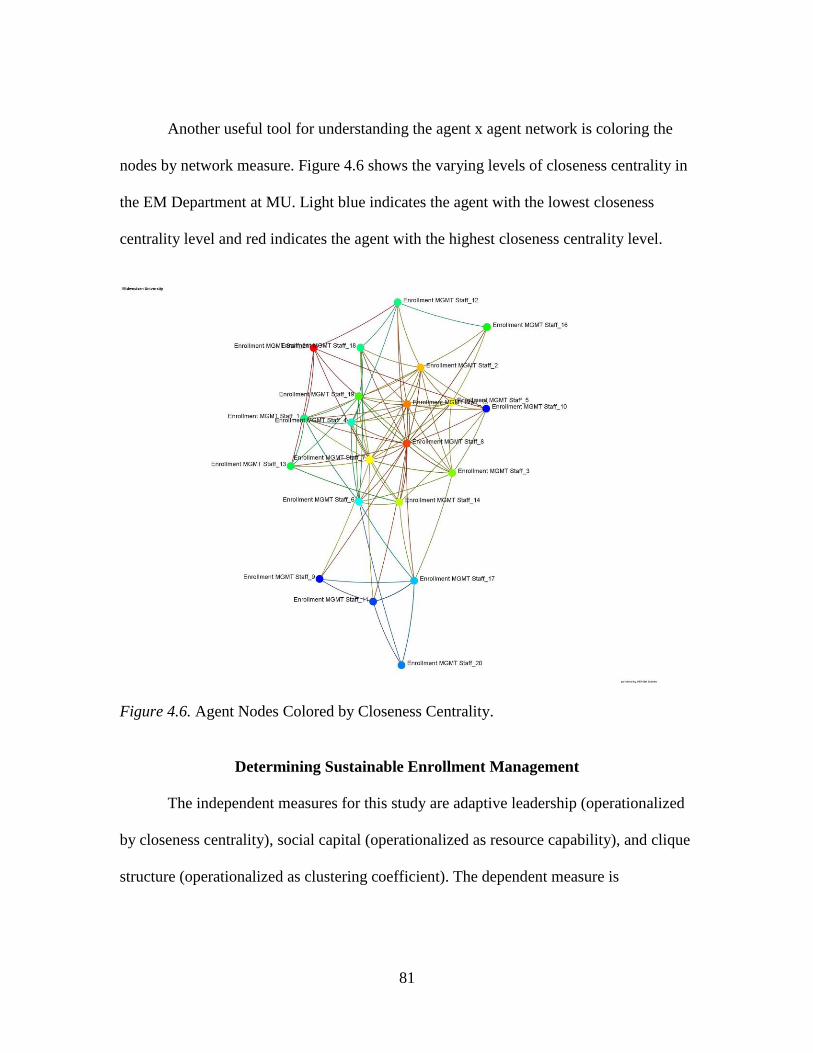
81
Another useful tool for understanding the agent x agent network is coloring the
nodes by network measure. Figure 4.6 shows the varying levels of closeness centrality in
the EM Department at MU. Light blue indicates the agent with the lowest closeness
centrality level and red indicates the agent with the highest closeness centrality level.
Figure 4.6. Agent Nodes Colored by Closeness Centrality.
Determining Sustainable Enrollment Management
The independent measures for this study are adaptive leadership (operationalized
by closeness centrality), social capital (operationalized as resource capability), and clique
structure (operationalized as clustering coefficient). The dependent measure is

82
information flow (operationalized as average speed). Table 4.13 presents those measures
in the MU enrollment management system’s current state.
Table 4.13
Network Measures—Current State
Independent Measures
Closeness Centrality 0.467
Resource Capability 0.222
Clustering Coefficient 0.348
Dependent Measure
Average Speed 0.433
Following a design by Marion et al. (2016), 15 variants of the meta-network were
simulated using ORA’s optimizer routine. In short, the optimizer added and removed
links until the network reached the target levels of closeness centrality, resource
capability, and clustering coefficient (the independent measures). For example, I set one
optimization run for a high level of closeness centrality, an average level of clustering
coefficient, and a minimum level of resource capability. For another variation, I set an
average level of closeness centrality, an average level of clustering coefficient, and a
maximum level of resource capability.
ORA offers two optimization methods: Monte Carlo and simulated annealing.
Marion et al. (2016) stated,
In the Monte Carlo approach, ORA generates multiple version of the desired
network (default, 1000 trials) by slightly varying the initial values for each
version based on a probability distribution. ORA then reports the average values

83
of the resultant independent measures across the trials and produces a simulated
network for these average values. (p. 249)
Carley et al. (2004) found that simulated annealing typically produced more accurate
results than Monte Carlo, so both methods were used in order to determine which fit
these data better. The simulated annealing process in ORA produced closeness centrality
values at levels greater than one when the closeness centrality measure should fall within
a zero to one range. Because of a now-identified defect in the simulated annealing
algorithm in ORA (per Carnegie Mellon University), and since the Monte Carlo method
resulted in such a strong adjusted R2 measure of .9345 (the independent measures account
for 93.45% of the variance in average speed), I decided to use Monte Carlo. The results
of the 15 optimization routines are in Table 4.14.
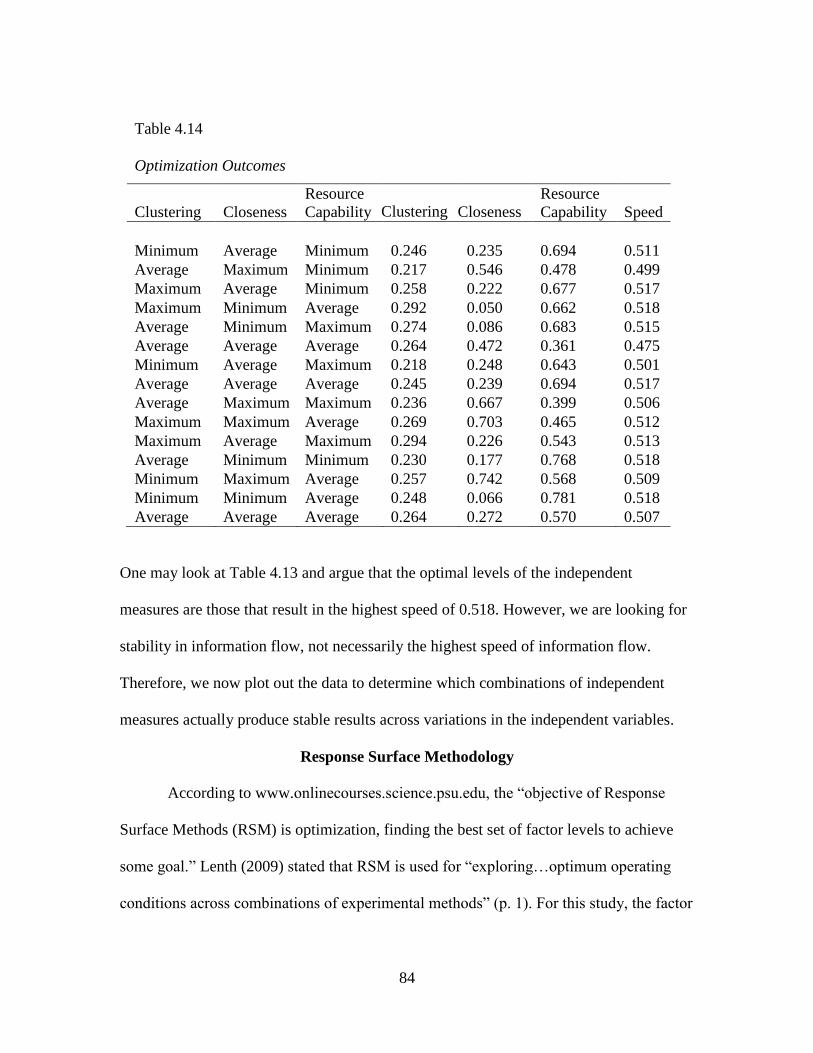
84
Table 4.14
Optimization Outcomes
Clustering Closeness
Resource
Capability
Resource
Capability Speed
Minimum Average Minimum 0.246 0.235 0.694 0.511
Average Maximum Minimum 0.217 0.546 0.478 0.499
Maximum Average Minimum 0.258 0.222 0.677 0.517
Maximum Minimum Average 0.292 0.050 0.662 0.518
Average Minimum Maximum 0.274 0.086 0.683 0.515
Average Average Average 0.264 0.472 0.361 0.475
Minimum Average Maximum 0.218 0.248 0.643 0.501
Average Average Average 0.245 0.239 0.694 0.517
Average Maximum Maximum 0.236 0.667 0.399 0.506
Maximum Maximum Average 0.269 0.703 0.465 0.512
Maximum Average Maximum 0.294 0.226 0.543 0.513
Average Minimum Minimum 0.230 0.177 0.768 0.518
Minimum Maximum Average 0.257 0.742 0.568 0.509
Minimum Minimum Average 0.248 0.066 0.781 0.518
Average Average Average 0.264 0.272 0.570 0.507
One may look at Table 4.13 and argue that the optimal levels of the independent
measures are those that result in the highest speed of 0.518. However, we are looking for
stability in information flow, not necessarily the highest speed of information flow.
Therefore, we now plot out the data to determine which combinations of independent
measures actually produce stable results across variations in the independent variables.
Response Surface Methodology
According to www.onlinecourses.science.psu.edu, the “objective of Response
Surface Methods (RSM) is optimization, finding the best set of factor levels to achieve
some goal.” Lenth (2009) stated that RSM is used for “exploring…optimum operating
conditions across combinations of experimental methods” (p. 1). For this study, the factor
Closeness Clustering
85
levels are closeness centrality (closeness), resource capability (capability), and clustering
coefficient (clustering), while the goal is the highest average speed of information flow
(speed) that is also at a stable state. After importing the optimized data from ORA into
Minitab, a Box-Behnken response surface method analysis was completed to look at the
regression of the independent measures (closeness centrality, resource capability, and
clustering) on speed, the dependent measure.
The results showed a R2 of .9777, with an adjusted R2 of .9375. The adjusted R2
accounts for the potential of overfitting that can happen as one adds more independent
measures. According to Kirby (2004), an R2 of 0.90 or above indicates a good fit. The
standard error of residuals (S) was .0028, a desired low value. With the exception of
Clustering (a linear relationship) and Clustering2 (curvilinear), all independent measures
were significant at the P < .10 level, as were the interactions.

86
Table 4.15
Results of Box-Behnken analysis
S = 0.0028; R2 = 97.77%; R2 (adj) = 93.75%
Estimated Regression Coefficients for Average Speed
Term Coef SE Coef T P
Constant 0.512 0.002 254.18 0.000
Clustering 0.002 0.006 0.31 0.770
Closeness 0.017 0.005 3.63 0.015
Capability 0.020 0.006 3.31 0.021
Cluster2 -0.008 0.006 -1.33 0.242
Closeness2 -0.020 0.006 -3.23 0.023
Capability2 -0.040 0.009 -4.34 0.007
Cluster*Closeness -0.041 0.014 -2.97 0.031
Cluster*Capability -0.043 0.018 -2.45 0.058
Closeness*Capability -0.061 0.009 -6.51 0.001
Response Surface Plots
Response surface analysis creates visualizations of the data in Table 4.14 and
identifies combinations of independent variable measures that allow optimal, stable flow
of information. The RSM term for the stable zone (notated in Figure 4.12 as light green)
is “saddle.” The broad area (plateau) over the saddle “represent regions in which systems
have significant latitude to change without compromising [sustainability]” (Marion et al.,
2016, p. 255).
For example, Figure 4.7 shows the resulting plot when holding clustering constant
at a high level (0.294) with closeness centrality and resource capability at average levels.

87
Figure 4.7. Box-Behnken surface plot: closeness centrality by resource capability with
clustering coefficient held at a high value (0.294).
This “Batman” plot in Figure 4.7 reveals that speed is optimized when either closeness
centrality is high and resource capability is low, or closeness centrality is low and
resource capability is high. If both measures are either low or high, speed drops off
drastically. The contour plot in Figure 4.8 makes this even more pronounced, with the
darker green areas indicating the region information flow (speed) is most stable to
changes in the environment.
Clustering0.294
Hold Values
.0 40
44.0
840.
0.00.2
0 4..0
8.0
6.0
.406.
250.
deepS
ytilibapaC ecruoseR
ssenesolC
loseness and Capability - AVG; Clustering HighC
P oject: Monte Carlo.MPJ; Worksheet: Worksheet 1r

88
Figure 4.8. Box-Behnken contour plot: resource capability by closeness centrality with
clustering coefficient held at a high value (0.294).
In the next example, clustering is held constant at a low level. Figures 4.9 and
4.10 display the resulting plots.
Clustering 0.294
Hold Values
Closeness
Reso
urc
e C
ap
ab
ilit
y
0.70.60.50.40.30.20.1
0.75
0.70
0.65
0.60
0.55
0.50
0.45
0.40
>
– –
–
– –
< 0.42
0.42 0.440.44 0.46
0.46 0.48
0.48 0.500.50 0.52
0.52
Speed
Closeness and Capability - AVG; Clustering High
Project: Monte Carlo.MPJ; Worksheet: Worksheet 1

89
Figure 4.9. Box-Behnken surface plot: closeness centrality by resource capability with
clustering coefficient held at a low value (0.217).
Clustering0.217
Hold Values
0.0.20
4.0.0
0.3
4.0
8.0
6.0
4.06.
5.0
deepS
ytilibapaC ecruoseR
ssenesolC
loseness and Capability - AVG; Clustering Low
Project: Monte Carlo.MPJ; Worksheet: Worksheet 1
C

90
Figure 4.10. Box-Behnken contour plot: closeness centrality by resource capability with
clustering coefficient held at a low value (0.217).
As shown in Figures 4.10 and 4.11, speed is much more volatile when clustering is low.
To achieve maximum speed, both closeness and capability must be high and cannot vary
without a substantial drop speed.
Resource Capability as a Constant
When resource capability is held at a low level, closeness centrality becomes
much more important for stability (Figures 4.11 and 4.12). With low resource capability,
speed is highest (> 0.50) when closeness centrality is high at a level of about 0.60,
regardless of the clustering coefficient. As shown in Figure 4.13, the stable bands (the
Clustering 0.217
Hold Values
Closeness
Reso
urc
e C
ap
ab
ilit
y
0.70.60.50.40.30.20.1
0.75
0.70
0.65
0.60
0.55
0.50
0.45
0.40
> –
–
– –
< 0.30
0.30 0.350.35 0.40
0.40 0.45
0.45 0.500.50
Speed
Closeness and Capability - AVG; Clustering Low
Project: Monte Carlo.MPJ; Worksheet: Worksheet 1

91
lightest green bands) are not particularly broad. Decreases in closeness centrality beyond
this band will cause rapid deterioration of speed.
Figure 4.11. Box-Behnken surface plot: closeness centrality by clustering coefficient
with resource capability held at a minimum value (0.361).
R
seulaV dloH
163.0ytilibapaC ecruose
0 3.
0 22.
4.0
5.0
0 42.
0 62.0 0.
82.0 0 2.0 4.
0 6.
S deep
C gniretsul
C ssenesol
C
1 teehskroW :teehskroW ;JPM.olraC etnoM :tcejorP
woL ytilibapaC ;GVA - gniretsulC dna ssenesol
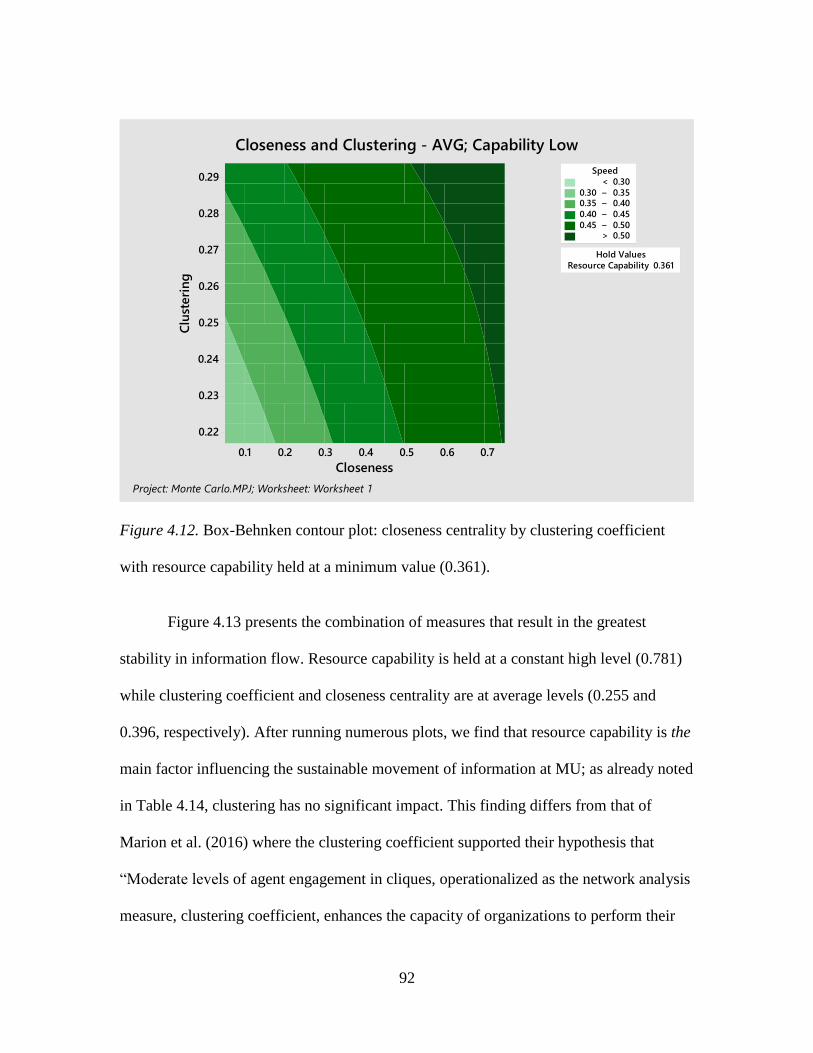
92
Figure 4.12. Box-Behnken contour plot: closeness centrality by clustering coefficient
with resource capability held at a minimum value (0.361).
Figure 4.13 presents the combination of measures that result in the greatest
stability in information flow. Resource capability is held at a constant high level (0.781)
while clustering coefficient and closeness centrality are at average levels (0.255 and
0.396, respectively). After running numerous plots, we find that resource capability is the
main factor influencing the sustainable movement of information at MU; as already noted
in Table 4.14, clustering has no significant impact. This finding differs from that of
Marion et al. (2016) where the clustering coefficient supported their hypothesis that
“Moderate levels of agent engagement in cliques, operationalized as the network analysis
measure, clustering coefficient, enhances the capacity of organizations to perform their
Resource Capability 0.361
Hold Values
Closeness
Clu
steri
ng
0.70.60.50.40.30.20.1
0.29
0.28
0.27
0.26
0.25
0.24
0.23
0.22
> –
–
– –
< 0.30
0.30 0.350.35 0.40
0.40 0.45
0.45 0.500.50
Speed
Closeness and Clustering - AVG; Capability Low
Project: Monte Carlo.MPJ; Worksheet: Worksheet 1

93
tasks” (p. 248). In the Marion et al. (2016) study, the moderate clustering value was
0.272. One explanation of this difference is that the clustering coefficient of the EM
network at MU had little variation (Table 4.6), and clustering was significant only when
it interacted with resource capability and closeness centrality. Additionally, the dependent
measure for Marion et al. (2016)’s research was task accuracy and not average speed. In
this study, speed was the dependent measure, which forced the network to align in ways
that maximized that outcome. In other words, speed in Marion et al. (2016)’s study was
the influencer, not the responder. Maximum impact occurs when agents have high
resource capability most any variance in clustering and closeness.
Figure 4.13. Box-Behnken surface plot: clustering coefficient by closeness centrality
with resource capability held at a high value (0.781).
R
seulaV dloH
187.0ytilibapaC ecruose
0 04.
0 44.
0 22.
84.0
25.0
0 42.
0 62.
0 82. 6.04.0
2.00.0
S deep
C gniretsul
ssenesolC
C
1 teehskroW :teehskroW ;JPM.olraC etnoM :tcejorP
hgiH ytilibapaC ;GVA - gniretsulC dna ssenesol
Spine area indicating optimal stability in
information flow regardless of environmental
pressures and/or changes.
Areas unable to adapt to
environmental pressures and/or
changes without rapid change in
speed.

94
Figure 4.14 displays a Box-Behnken contour map, which supports the findings in
the surface plot above (Figure 4.11), but it also shows areas that one cannot see in the 3-
D plot (Figure 4.12). The darker green shades indicate the areas of greatest sustainability,
while the blue-shaded area (high clustering and high closeness centrality) marks a sharp
drop off in speed. The blue areas represent network conditions that are not able to sustain
adequate information flow needed to adjust to changes.
Figure 4.14. Box-Behnken contour map: clustering coefficient by closeness centrality
with resource capability held at a high value (0.781).
Resource Capability 0.781
Hold Values
Closeness
Clu
steri
ng
0.70.60.50.40.30.20.1
0.29
0.28
0.27
0.26
0.25
0.24
0.23
0.22
>
– –
–
– –
< 0.42
0.42 0.440.44 0.46
0.46 0.48
0.48 0.500.50 0.52
0.52
Speed
Closeness and Clustering - AVG; Capability High
Project: Monte Carlo.MPJ; Worksheet: Worksheet 1
Diagonal white lines indicate area
of greatest sustainability.
95
Summary
This chapter presented the descriptive statistics of the MU meta-network and then
proceeded with network-level and node-level measures, offering some context of their
meanings. Finally, the results of the RSM which plots a 3-D graph of the effects of
various levels of independent network measures on a dependent measure were shown.
For this study, the independent measures were adaptive leadership (operationalized as
closeness centrality), social capital (operationalized as resource capability), and clique
structure (operationalized as clustering coefficient). The dependent measure, information
flow, was operationalized as average speed.
The density of meta-network and the social (agent x agent) network were 0.17 and
0.249, respectively, resulting in an average speed of 0.433. It was found that removing
the most connected node, Enrollment MGMT Agent_8, resulted in an increase in average
speed of information flow from 0.433 to 0.530. Such an increase indicates that many
people interact more with Enrollment MGMT Agent_8 than others which impedes
information flow throughout the rest of the network. The response surface plots indicated
that holding resource capability at a high level (0.781 in this case) provided the widest
area of the plot’s spine as indicated in Figures 4.12 and 4.13.

96
CHAPTER FIVE
SUMMARY, DISCUSSION, AND CONCLUSIONS
The primary purposes of this study were to investigate Enrollment Management
(EM) in higher education through the framework of a complex adaptive system (CAS), to
provide colleges and universities with a foundational understanding of what a sustainable
EM system looks like from Dynamic Network Analysis (DNA) perspective, and to
suggest to EM practitioners one method to model (a) their institution’s EM system in its
current status and (b) what network structures optimize information flow, thus cultivating
a sustainable EM system for their institutions. Additionally, this study aimed to describe
how formal network structures either promote or inhibit a EM system within the bounds
of the university under study. For example, to what extent are those involved in EM
interdependent with, or dependent upon, each other? Are there bottlenecks to the flow of
information? Does information flow freely throughout the EM system? This study
considered an EM system to be sustainable if the speed at which information flows
throughout the system remains stable regardless of changes to, and pressures from, the
internal and external environments.
To this end, this study is guided by two overarching questions:
1. To what extent is the research site organized to enable effective and efficient
information flow?
2. Which combinations of independent network measures (adaptive leadership,
social capital, and clique structure) produce optimal outcome measures
(information flow) for a sustainable EM system?

97
Before discussing the findings of this research, a reminder of the premises undergirding
this study is helpful.
First, EM is not an insular division or department, but a living, CAS whose core
strategic function (Wilkinson et al., 2007) is to coordinate people, knowledge, tasks, and
resources for identifying, recruiting, enrolling, retaining, and graduating students
(Henderson, 2001) at levels that support the mission (Wilkinson et al., 2007) of the
institution. Its end is to create and maintain dynamic, sustainable enrollment conditions
that allow the institution to survive and persist, regardless of forces that push it toward
extinction. An effective EM system is anticipatory (Wilkinson et al., 2007) of internal
and external pressures, requires input from and cooperation of the entire campus
(Wilkinson et al., 2007), and takes into account the physical and instructional capacity of
the institution, its current and potential market positions, the financial requirements of the
institution, the standards of accreditation, and the limits of regulation.
Second, a CAS relies on interactions of agents to sustain its capacity to adapt
robustly with its environment. In network analysis, agents are individual groups, people,
or organizations. The system must be nimble to both internal and external changes and
pressures. As such, this study moved beyond the formal organizational structure of an
EM Department and focused on the informal interactions and network structures that
influence information diffusion, which Kalsbeek (2001) contended is the “most important
material driving strategic enrollment management” (p. 189). Since human agents possess
information in a social network, our understanding of an agent’s network position and
that agent’s connectivity to other agents is vital. The higher an agent’s (node’s)

98
connectivity, the more likely that agent (node) will receive information. Additionally, we
can see what happens if any particular node, particularly a critical node, is removed.
This study examined the network structure of an EM system at a small, private
university in the Midwest (named, for the purposes of this research, Midwestern
University, abbreviated as MU). This chapter synthesizes the findings in relation to the
research questions and offers implications of the research on both the EM system at
Midwestern University (MU) and EM across higher education. Finally, suggestions for
further research are offered.
Research Question 1:
To What Extent is the Research Site Organized to Enable Effective and Efficient
Information Flow?
Complex systems survive and thrive on information flow. The total network
density, a measure of the potential for such flow, at the EM research site was 0.170; the
system displayed an average communication speed of 0.433. Several studies of K-12
schools consistently find densities of 0.04 to 0.10 (Marion et al., 2016), while data from
public health organizations in Canada show densities of 0.35 (Carley, 2011). I found no
comparison data for network-level speed. These measures suggest adequate
communication flow in the system.
Interactions among agents are a key component of complexity theory
(Abusidualghoul, 2014; Forsman et al., 2012; Hasan, 2014; Kezar et al., 2006; Marion &
Uhl-Bien, 2001; McClellan, 2010; McMurtry, 2008; Salem, 2002). At MU, one of the
most central actors is Enrollment MGMT Staff_8. When this agent was removed from the

99
EM network, the immediate impact was an increase in the network closeness centrality
from 0.467 to 0.714, and average speed of information flow increased from 0.433 to
0.530. Such findings are important in understanding information flow. Haythornthwaite
(1996) argued, “By gaining awareness of existing information exchange routes,
information providers can act on information opportunities and make changes to
information routes to improve the delivery of information services (p. 323). Network
patterns show who interacts with whom in order to receive or forward information as well
as what access the individual has to information, to new ideas, and to opportunities
(Haythornthwaite, 1996). Enrollment MGMT Staff_8 may have such effect on the
average speed of information flow because he or she traps information as suggested by
Weng et al. (2013). There is insufficient interaction among other agents within EM due to
the presence of Enrollment MGMT Staff_8.
In order to determine if other agents had similar effects on average speed, other
highly central agents were removed, and the resulting impact was calculated. For
example, removing Enrollment MGMT Staff_1 resulted in an average speed of 0.430,
and removing Enrollment MGMT Staff_21 resulted in an average speed of 0.429, both of
which are no different than the original average speed. Clearly, Enrollment MGMT
Staff_8 is the dominant agent affecting information flow throughout the EM network.
In summary, MU’s EM Department has a structure that suggests an adequate
level of information flow. However, the network is far from optimized to sustain its
capacity to adapt robustly with its environment.

100
Research Question 2:
Which Combinations of Independent Network Measures (adaptive leadership, social
capital, and clique structure) Produce Optimal Outcome Measures for a Sustainable
Enrollment Management System?
In this study, sustainability is presented as a state of information flow (speed) that
is robust or stable against changes in its environment, specifically in adaptive leadership
(closeness centrality), social capital (resource capability), and/or clique structure,
(clustering coefficient). Based on the response surface plots, the greatest stability occurs
when resource capability is at its maximum value regardless of closeness and clustering.
In other words, resource capability seems to be the main factor influencing information
flow. This is a significant finding for MU. Regardless of how much clique activity exists
within the formal EM Department, access to resources outside of EM is vital for a stable
information flow. This supports the argument provided by McPherson et al. (2001) that
too much homophily (interaction among agents with similar characteristics or
experiences) can degrade the speed at which information moves between networks.
The finding that clustering has no independent impact on information flow differs
from that of Marion et al. (2016) where the clustering coefficient supported their
hypothesis that “Moderate levels of agent engagement in cliques, operationalized as the
network analysis measure, clustering coefficient, enhances the capacity of organizations
to perform their tasks” (p. 248). In the Marion et al. (2016) study, the moderate clustering
value was 0.272. Clustering did interact significantly with closeness (p < 0.05) but, as
Figure 4.11 shows, that interaction showed no saddle and plateau effects attributable to

101
clustering. One explanation of this difference is that the clustering coefficient of the EM
network at MU had little variation (Table 4.14), and clustering was significant only when
it interacted with resource capability and closeness centrality. Additionally, the dependent
measure for Marion et al.’s (2016) research was task accuracy and not average speed. In
this study, average speed was the dependent measure, which forced the network to align
in ways that maximized that outcome. In other words, speed in the Marion et al. (2016)
study was the influencer, not the responder.
Discussion
Kalsbeek (2001) contended that information is the “most important material
driving strategic enrollment management” (p. 189). At MU, an average speed of 0.433
suggests an adequate level of information flow throughout the EM system. However, one
purpose of this study was to determine if MU is organized in such a way to enable
effective and nimble information flow. ORA’s Immediate Impact Report referenced in
Chapter IV (Table 4.11) provided evidence that the removal of Enrollment MGMT
Staff_8 would increase average speed of information flow by 22.4%. Such an increase
suggests that Enrollment MGMT Staff_8 is capturing or centralizing knowledge in the
network; this may hinder the nimbleness of information flow and access to resources
(social capital) by other agents. Complexity leadership theory provides a perspective that
might remedy this.
I argued that studying EM as a CAS is revealing. As such, a new perspective of
leadership is necessary—Complexity Leadership. DeRue (2011), Lichtenstein et al.
(2007), and Marion and Uhl-Bien (2007a) contended that leadership is more of a process

102
than a characteristic or skill of any one individual, and leadership is grounded in the
activities of individuals and groups regardless of formal position in the organization.
Whereas traditional leadership roles are seen as formal, top-down organizational
structures, leadership that is informal and interactive allows organizations to change and
adapt as various environmental pressures arise, both internal and external to the group
(DeRue, 2011). In this study, information leadership and adaptive leadership are the
same. Top-down hierarchical leadership inhibits adaptability because it inhibits
information flow among agents, and those not in formal leadership roles have no
authority to use their knowledge and creativity to react to pressures with appropriate
changes (DeRue, 2011). This stifles organizational change and learning, and the
centrality of Enrollment MGMT Staff_8 may contribute to a static EM system.
A second purpose of this study was to determine Which combinations of adaptive
leadership, social capital, and clique structure produce optimal outcome measures for a
sustainable EM system. Based on the results of the response surface plot (Figure 5.1),
social capital (resource capability) is the key component of a sustainable EM system for
MU. When access to resources is strong, adaptive leadership (closeness centrality) and
clique structure (clustering coefficient) can vary quite a bit without dramatic and risky
reduction in the speed of information. This finding is supported by the contour plot
(Figure 5.2) as well. In contrast, the effects of low access to resources are displayed in
Figures 5.3 and 5.4.

103
Figure 5.1. Box-Behnken surface plot: clustering coefficient by closeness centrality with
resource capability held at a high value (0.781).
R
seulaV dloH
187.0ytilibapaC ecruose
0 04.
0 44.
0 22.
84.0
25.0
0 42.
0 62.
0 82. 6.04.0
2.00.0
S deep
C gniretsul
ssenesolC
C
1 teehskroW :teehskroW ;JPM.olraC etnoM :tcejorP
hgiH ytilibapaC ;GVA - gniretsulC dna ssenesol
Spine area indicating optimal stability in
information flow regardless of environmental
pressures and/or changes.
Areas not able to adapt to
environmental pressures and/or
changes.

104
Figure 5.2. Box-Behnken contour map: clustering coefficient by closeness centrality with
resource capability held at a high value (0.781).
Resource Capability 0.781
Hold Values
Closeness
Clu
steri
ng
0.70.60.50.40.30.20.1
0.29
0.28
0.27
0.26
0.25
0.24
0.23
0.22
>
– –
–
– –
< 0.42
0.42 0.440.44 0.46
0.46 0.48
0.48 0.500.50 0.52
0.52
Speed
Closeness and Clustering - AVG; Capability High
Project: Monte Carlo.MPJ; Worksheet: Worksheet 1
Area of greatest stability
during times of change or
pressures

105
Figure 5.3. Box-Behnken surface plot: clustering coefficient by closeness centrality with
resource capability held at a minimum value (0.361).
R
seulaV dloH
163.0ytilibapaC ecruose
0 3.
0 22.
4.0
5.0
0 42.
0 62.0 0.
82.0 0 2.0 4.
0 6.
S deep
C gniretsul
C ssenesol
C
1 teehskroW :teehskroW ;JPM.olraC etnoM :tcejorP
woL ytilibapaC ;GVA - gniretsulC dna ssenesol

106
Figure 5.4. Box-Behnken surface plot: clustering coefficient by closeness centrality with
resource capability held at a minimum value (0.361).
Implications for Practice
High social capital (resource capability) is the key to MU creating and
maintaining a sustainable EM system. At MU, social capital is provided by access to
agents in departments outside of the formal EM Department, such as Student Affairs,
Finance, Registrar, and Bursar (see Appendix C). Currently, resource capability measures
an average 0.222, much lower than the optimal suggested by the RSM calculations.
The researcher suggests that positional leaders deliberately encourage others to
interact with personnel in other departments and that they even facilitate those
Resource Capability 0.361
Hold Values
Closeness
Clu
steri
ng
0.70.60.50.40.30.20.1
0.29
0.28
0.27
0.26
0.25
0.24
0.23
0.22
> –
–
– –
< 0.30
0.30 0.350.35 0.40
0.40 0.45
0.45 0.500.50
Speed
Closeness and Clustering - AVG; Capability Low
Project: Monte Carlo.MPJ; Worksheet: Worksheet 1

107
interactions. This does not mean that formal leaders’ access to resources are not
important. However, as Marion et al. (2016) argued, formal leaders,
use their access to resources and to organizational authority to enable interaction
among diverse agents and groups. They organize workflow, interdependencies,
and formal relationships (e.g., committee work) to generate interactions and
information flow across agents and groups…They are able to identify individuals
with little access to the system’s information flow, and find ways to integrate
them. (p. 257)
This shifting of leadership characteristics to an Enabling Leadership perspective would
assist the formal (positional) leaders (Enrollment MGMT Staff 6, 8, 14, 17, and 20) to
foster the interaction of agents (i.e. people) outside of EM to increase coordination and
interdependence between all agents with knowledge relevant and appropriate
(Yammarino et al., 2012) to the EM functions of MU. As stated by Yammarino et al.
(2012), “Enabling leadership is proposed to serve as a moderator between administrative
and adaptive leadership by modifying some of the authoritative ‘top-down’ control to
allow for the more organic flow of information and interaction that gives rise to adaptive
leadership” (p. 392). These interactions need not be social in nature, but they should be
purposeful to engaging the rest of campus in the EM efforts as Huddleston (2000),
Henderson (2001), Hossler (1990), and Hossler and Hoezee (2001) argued.
Hiring practices are another way to address less-than-optimal information flow in
the EM system. For example, recruiting staff who are not only competent in the skills and
backgrounds necessary for the job, but also display the ability and mentality to engage in

108
the broader EM system at MU, would be strategic. As stated by Marion et al. (2016),
“Networks of informal leaders who can readily access and move information in a
network are crucial to the level of productivity that complex systems can achieve” (p.
257). Jack Maguire (as cited by Henderson, 2001), argued that EM emerged in order to
create a synergy between offices that often acted independently and, many times, at
cross-purposes. Henderson (2001) furthered this by suggesting that EM should function
as a set of interdependent activities such as “…marketing, recruiting, admissions,
financial aid, orientation, and retention” (p. 11). By hiring the right staff that can work
with others outside of their immediate positions, and by encouraging interacting networks
both inside and outside of the formal EM Department, positional leaders can become
enabling leaders that support sustainable enrollment management at MU.
Implications for Further Research
One limitation of this study is the inclusion of an EM division of a single
university. However, the data analysis utilized simulations that, in effect, created 15
different networks of EM within the research site (R. Marion, personal communication,
January 7, 2016). This reduces the concern of a DNA at single research site. However,
subsequent research should utilize the EM system at a larger university in order to
support, elaborate, or add to the findings of this study.
Further, I would suggest using semi-structured interviews for the qualitative data
collection. Interviews would allow for gleaning more precise categories, as the
interviewer can follow-up with the participants as the interviews progress in order to

109
clarify answers that may be too ambiguous. It would also provide valuable insights into
the organization that may aid data interpretation.
Finally, a subsequent analysis of the same EM system would allow the testing of
changes to the network suggested by the first study. Replications of DNAs after
interventions are non-existent. Without doing follow-up research, this type of study stays
at a theoretical level and is useless to the practitioner.

110
APPENDICES

111
Appendix A
Informed Consent
Information about Being in a Research Study
Clemson University
Sustainable Enrollment Management: A Dynamic Network Analysis
Description of the Study and Your Part in It
Russ Marion, PhD and Forrest Stuart, both from Clemson University, invite you to take
part in a research study. Russ Marion, the principal investigator, is a professor at
Clemson University, and Forrest Stuart is a PhD candidate. The purpose of this research
is to investigate higher education enrollment management as a complex adaptive system
and provide colleges and universities a foundational understanding of what a sustainable
enrollment management system looks like from network and complex adaptive system
perspectives.
Your part in the study will be to complete two online surveys about with whom you
interact and the knowledge, resources, and tasks required in performing your role at
Midwestern University. The survey questions will help the researchers understand the
interactions that occur within and outside of the enrollment management division and
how information flows throughout those areas. Information flow is essential for an
enrollment management system to adapt to the internal and external pressures
experienced by the institution.
The first survey will take you about 15 minutes to complete and the second survey will
take about 20 minutes to complete.
Risks and Discomforts
We do not know of any risks or discomforts to you in this research study, other than your
providing your name and title. As noted below under Protections, we have implemented
measures to avoid this risk. Your answers are no longer available on your computer once
the survey has been completed and sent. If you do not complete the survey, the program
will time-out and responses will no longer be on your computer. While we necessarily
request your names, they will be deleted as soon as the data are prepared for analysis.
These measures are intended to protect the confidentiality of your responses.

112
Possible Benefits
Information flow is essential for an enrollment management system to adapt to the
internal and external pressures experienced by the institution. This study will help these
researchers understand the interactions that occur within and outside of the enrollment
management division and how information flows throughout those areas. In the end, the
researchers will suggest alternative structures that will enable efficient information
diffusion throughout the enrollment management division.
Protection of Privacy and Confidentiality
We will do everything we can to protect your privacy and confidentiality. While we must
request your name and title when the data are collected in order to prepare the data for
analysis, no one other than the research team will have access to your name and title. All
response data will be anonymized after exporting the responses from Qualtrics into
Microsoft Excel; no participants will leave data on their computers due to Qualtrics being
an online survey instrument; any personally identifiable information will be anonymized
so that readers cannot identify the participants nor the institution at which the participants
work; no personally identifiable information will be revealed during the study, in the
write up, during the dissertation defense, or in subsequent presentations. The data
exported from the online surveys will be stored on a password-protected computer until
the dissertation is finished. After that, the data will be stored on an encrypted external
hard drive used for such purposes. The data will remain on the hard drive for 5 years, per
APA requirement.
We might be required to share the information we collect from you with the Clemson
University Office of Research Compliance and the federal Office for Human Research
Protections. If this happens, the information would only be used to find out if we ran this
study properly and protected your rights in the study.
Choosing to Be in the Study
You do not have to be in this study. You may choose not to take part and you may choose
to stop taking part at any time. You will not be punished in any way if you decide not to
be in the study or to stop taking part in the study. If you choose to stop taking part in this
study, the information you have already provided will be used in a confidential manner.
Incentive
Participants who complete both this survey and the second survey will receive a ten
dollar ($10.00) gift card.

113
Contact Information
If you have any questions or concerns about this study or if any problems arise, please
contact Russ Marion at Clemson University at [email protected].
If you have any questions or concerns about your rights in this research study, please
contact the Clemson University Office of Research Compliance (ORC) at 864-656-0636
or [email protected]. If you are outside of the Upstate South Carolina area, please use the
ORC’s toll-free number, 866-297-3071.
Clicking on the "agree" button indicates that:
• You have read the above information
• You voluntarily agree to participate
• You are at least 18 years of age
You may print a copy of this informational letter for your files.

114
Appendix B
Survey 1
This short survey will provide insight into the specific knowledge and resources you need
to perform your role at Midwestern University. Please answer each question as honestly
and as detailed as you can. Your answers are confidential and only will be used to design
a subsequent network analysis survey.
1. From the list below, please select your name. NOTE: As stated above, your
name and title are only for data analysis, and they will be anonymized after
exporting the data from this survey into Excel. No one but the researchers will
see your name. Additionally, this will ensure we have the correct names for
the gift cards that we will send to participants who complete both surveys.
Names removed
2. What specialized knowledge is needed to perform your work in enrollment
management? Your answer can list more than one knowledge set.
3. What specific skills are necessary to perform your work in enrollment
management (e.g. public speaking, research, spreadsheets, time management,
etc.)? List as many as appropriate.
4. Inside your enrollment management department, what major resources
(specific people, tools, and/or materials) are readily available to help you
perform your work? List as many as appropriate. If you list people, please
include their departments (e.g. student life, housing, billing, etc.)
5. Outside your enrollment management department, what major resources
(specific people, tools, and/or materials) are readily available to help you

115
perform your work? If you list people, please include their departments (e.g.
student life, housing, billing, etc.)
6. If you were to write up a job description for your job, what specific tasks
would you include? NOTE: Please do not copy your current job description,
as it may or may not reflect your actual responsibilities.
7. Enrollment management scholar, Dr. David Kalsbeek, stated, "Information is
the most important material driving strategic enrollment management." What
does Dr. Kalsbeek's statement mean to you, and in your role in enrollment
management at OWU, what specific experiences have you had that relate to
Dr. Kalsbeek's claim?
Thank you for participating in this survey. Please look for a follow-up survey within two
weeks.

116
Appendix C
Survey 2
Please take the time necessary to answer all survey questions thoughtfully and honestly.
Each one is important to the validity of our research.
1. What is your gender?
Male
Female
2. Did you graduate with a degree from Midwestern University?
Yes
No
3. How many years have you worked in enrollment management at Midwestern
University?
Less than 1 year (1)
1 - 3 Years (2)
4 - 6 Years (3)
7 - 10 Years (4)
10+ Years (5)

117
The following questions focus on interactions within the Enrollment Management
Division at Midwestern University University. Please note: We are not analyzing
individual behaviors, but rather we are looking at the network as a whole. Knowing the
collective of all relationships is imperative to understanding what is important for
effective and sustainable enrollment management in general. By understanding this, we
hope to show how enrollment management efforts can be optimized.
118
4. Who do you regularly seek or reach out to for information or knowledge relating
to your job? Please select all individuals that apply.
Names removed
5. Who regularly seeks or reaches out to you for information or knowledge relating
to his/her job? Please select all that apply.
Names removed
6. Who do you regularly share problems or issues with that you encounter in your
job? Please select all individuals that apply.
Names removed
7. Who comes to you regularly to share problems that he/she encounters in his/her
job? Please select all individuals that apply.
Names removed
8. Who do you regularly seek out for confidential work advice? Please select all
individuals that apply.
Names removed
9. Who regularly reaches out to you for confidential work advice? Please select all
individuals that apply.
Names removed
10. With whom do you regularly socialize? Please select all individuals that apply.
Names removed
11. Who do you regularly seek out for creative ideas or solutions to problems or
issues that you encounter in your job? Please select all that apply.
Names removed

119
12. Who regularly seeks you out for creative ideas or solutions to problems or issues
that he/she encounters in his/her job?
Names removed

120
The following questions ask you about the specific knowledge and skills you most need
to perform your role at Midwestern University.

121
13. What do you most need to know or understand to perform your job effectively?
Please select all items below that apply.
Academic majors
Accounting procedures
Analyze and understand data
How to complete surveys
Use of internet for research purposes
An understanding of demographic data
Trends in higher education
How to do a SWOT analysis
Residence Life procedures
Athletics
Ability to explain to the "value equation" and return on investment to
parents and students
Higher education market trends
Design and copy editing
e-marketing for "Generation Z"
How students and their parents choose a college
Knowledge of different parts of the country
Socioeconomic and cultural factors that might affect what a person is
looking for in a college
Interpersonal communication
Telephone etiquette
Electronic communication
Competitor colleges and universities
University facilities
Experiential learning opportunities
How the university can be differentiated from other institutions
Recruitment territory high schools
Recruitment territory enrollment history
University admission statistics
Geomarkets
Microsoft Office Suite
Google Mail features
Adobe products
Working knowledge of the Slate software
Customer service skills

122
PowerFaids
Which students are admitted
Awards given by Admission Office
Planning an effective visit for a prospective student
Event planning
Federal financial aid regulations
State financial aid regulations
Specific financial aid programs (e.g. student loans, Pell Grant, state
scholarships/grants
Financial aid policies and procedures
Financial aid strategy
Packaging student financial aid awards
Awarding of endowed scholarships
Awarding of external scholarships
Admission policies and procedures
International education for each country around the world
Intercultural sensitivity in conducting the admission process
Marketing trends
Social media interactions
SAT and ACT testing processes and scoring
Financial Aid Appeals
123
14. What skills do you most need to perform your job effectively? Please select all
items below that apply.
Working with spreadsheets
Problem solving
Time management
Creativity
Listening skills
Customer service
Learn new processes
Multi-tasking
Organization
Public speaking
Data management
Research skills
Social media
Strategic planning
Student worker supervision
Calendar management

124
The following questions focus on interactions between Enrollment Management and the
Provost/Academic Affairs Office. As you answer, please think about your interactions
with the choices presented, not Enrollment Management's interactions.

125
15. Who do you regularly seek or reach out to for information or knowledge relating
to your job? Please select all individuals that apply.
Names removed
16. Who regularly seeks or reaches out to you for information or knowledge relating
to his/her job? Please select all individuals that apply.
Names removed

126
The following questions focus on interactions between Enrollment Management and the
Information Services Office. As you answer, please think about your interactions with the
choices presented, not Enrollment Management's interactions.

127
17. Who do you regularly seek or reach out to for information or knowledge relating
to your job? Please select all individuals that apply.
Names removed
18. Who regularly seeks or reaches out to you for information or knowledge relating
to his/her job? Please select all individuals that apply.
Names removed

128
The following questions focus on interactions between Enrollment Management and the
President's Office. As you answer, please think about your interactions with the choices
presented, not Enrollment Management's interactions.

129
19. Who do you regularly seek or reach out to for information or knowledge relating
to your job? Please select all individuals that apply.
Names removed
20. Who regularly seeks or reaches out to you for information or knowledge relating
to his/her job? Please select all individuals that apply.
Names removed

130
The following questions focus on interactions between Enrollment Management and the
Advancement/Alumni Office. As you answer, please think about your interactions with
the choices presented, not Enrollment Management's interactions.
131
21. Who do you regularly seek or reach out to for information or knowledge relating
to your job? Please select all individuals that apply.
Names removed
22. Who regularly seeks or reaches out to you for information or knowledge relating
to his/her job? Please select all individuals that apply.
Names removed

132
The following questions focus on interactions between Enrollment Management and the
Registrar's Office. As you answer, please think about your interactions with the choices
presented, not Enrollment Management's interactions.
133
23. Who do you regularly seek or reach out to for information or knowledge relating
to your job? Please select all individuals that apply.
Names removed
24. Who regularly seeks or reaches out to you for information or knowledge relating
to his/her job? Please select all individuals that apply.
Names removed

134
The following questions focus on interactions between Enrollment Management and the
University Communication's Office. As you answer, please think about your
interactions with the choices presented, not Enrollment Management's interactions.

135
25. Who do you regularly seek or reach out to for information or knowledge relating
to your job? Please select all individuals that apply.
Names removed
26. Who regularly seeks or reaches out to you for information or knowledge relating
to his/her job? Please select all individuals that apply.
Names removed

136
The following questions focus on interactions between Enrollment Management and
Athletics. As you answer, please think about your interactions with the choices presented,
not Enrollment Management's interactions.
137
27. Which coaches of the following sports do you regularly seek or reach out to for
information or knowledge relating to your job? Please select all sports that apply.
Baseball
Men's Basketball
Women's Basketball
Men's Cross Country
Women's Cross Country
Football
Men's Golf
Men's Lacrosse
Women's Golf
Women's Lacrosse
Men's Soccer
Women's Soccer
Men's Swimming & Diving
Women's Swimming & Diving
Men's Tennis
Women's Tennis
Men's Track & Field
Women's Track & Field
Women's Field Hockey
Women's Volleyball
Softball

138
28. Which coaches of the following sports regularly seek or reach out to you for
information or knowledge relating to their jobs? Please select all individuals that
apply.
Baseball
Men's Basketball
Women's Basketball
Men's Cross Country
Women's Cross Country
Football
Men's Golf
Men's Lacrosse
Women's Golf
Women's Lacrosse
Men's Soccer
Women's Soccer
Men's Swimming & Diving
Women's Swimming & Diving
Men's Tennis
Women's Tennis
Men's Track & Field
Women's Track & Field
Women's Field Hockey
Women's Volleyball
Softball

139
The following questions focus on interactions between Enrollment Management and the
Student Affairs Office. As you answer, please think about your interactions with the
choices presented, not Enrollment Management's interactions.

140
29. Who do you regularly seek or reach out to for information or knowledge relating
to your job? Please select all individuals that apply.
Names removed
30. Who regularly seeks or reaches out to you for information or knowledge relating
to his/her job? Please select all individuals that apply.
Names removed

141
The following questions focus on interactions between Enrollment Management and the
Finance and Administration Office. As you answer, please think about your
interactions with the choices presented, not Enrollment Management's interactions.

142
31. Who do you regularly seek or reach out to for information or knowledge relating
to your job? Please select all individuals that apply.
Names removed
32. Who regularly seeks or reaches out to you for information or knowledge relating
to his/her job? Please select all individuals that apply.
Names removed

143
Appendix D
IRB Notice of Approval
Dear Dr. Marion, The Clemson University Institutional Review Board (IRB) reviewed the protocol identified
above using expedited review procedures and has recommended approval. The approval is
for all sites with a research site letter on file. Your approval period is February 29, 2016 to
February 28, 2017. Your continuing review is scheduled for January 2017. Please contact the office if your study
has terminated or been completed before the identified review date. No change in this approved research protocol can be initiated without the IRB’s approval.
This includes any proposed revisions or amendments to the protocol or consent form. Any
unanticipated problems involving risk to subjects, any complications, and/or any adverse
events must be reported to the Office of Research Compliance immediately. All team
members are required to review the IRB policies on "Responsibilities of Principal
Investigators" and the "Responsibilities of Research Team Members" available
at http://www.clemson.edu/research/compliance/irb/regulations.html. The Clemson University IRB is committed to facilitating ethical research and protecting the
rights of human subjects. Please contact us if you have any questions and use the IRB
number and title in all communications regarding this study. Sincerely,
Elizabeth B. Elizabeth Chapman '03, MA, CACII
IRB Coordinator
Clemson University
Office of Research Compliance
Institutional Review Board (IRB)
223 Brackett Hall
Voice: (864) 656-6460
Fax: (864) 656-4475
E-mail: [email protected]
144
REFERENCES
Abusidualghoul, V. J. (2014). Complexity theory & the measure of organisations. School
of Management.
Anderson, M. J., & Whitcomb, P. J. (2005). RSM Simplified. Optimizing processes using
response surface methods for design of experiments. Boca Raton, FL: Taylor &
Francis, LLC.
Bell, S. (2014). Higher Ed's Enrollment Blues. Library Journal. Retrieved from
http://lj.libraryjournal.com/2014/10/opinion/steven-bell/higher-eds-enrollment-
blues-from-the-bell-tower/
Bennett, D. (2011). Complex organizations: A cultural analysis of a Christian college.
Berger-Wolf, T. Y., & Saia, J. (2006). A framework for analysis of dynamic social
networks. Paper presented at the Proceedings of the 12th ACM SIGKDD
international conference on Knowledge discovery and data mining, Philadelphia,
PA, USA. http://dl.acm.org/citation.cfm?doid=1150402.1150462
Black, J. (2004). Defining enrollment management: The structural frame. College and
University, 79(4), 37-39.
Bolivar, J. M., & Chrispeels, J. H. (2010). Enhancing Parent Leadership Through
Building Social and Intellectual Capital. American Educational Research Journal,
48(1), 4-38. doi:10.3102/0002831210366466
Bontrager, B. (2004). Strategic enrollment management: Core strategies and best
practices. College and University, 79(4), 9.

145
Borgatti, S. (2003). The key player problem. Paper presented at the Dynamic Social
Network Modeling and Analysis Workshop.
Borgatti, S., & Halgin, D. (2011). On Network Theory. Organization Science, 22(5),
1168-1181. doi:10.1287/orsc.1110.0641
Borgatti, S. P., & Lopez-Kidwell, V. (2011). Network Theory. In J. Scott & P. J.
Carrington (Eds.), (pp. 40-54). Thousand Oaks, CA: SAGE Publications, Inc.
Box, G. E. P., & Wilson, K. B. (1951). On the experimental attainment of optimum
conditions. Journal of the Royal Statistical Society, 13(1), 1-45.
Breiger, R., Carley, K. M., & Pattison, P. (2003). Dynamic Network Analysis. Dynamic
social network modeling and analysis Workshop summary and papers, 133-145.
Buckley, W. F. (1967). Sociology and modern systems theory: Prentice-Hall.
Bulutlar, F., & Kamasak, R. (2012). Complex adaptive leadership for perfromance: A
theoretcial framework. Paper presented at the Springer Proceedings in
Complexity.
Carley, K. M. (1999). On the Evolution of Social and Organizational Networks. Research
in the Sociology of Organizations, 16, 3-30.
Carley, K. M. (2001). Summary of Key Network Measures for Characterizing
Organizational Architectures. Retrieved from
http://casos.cs.cmu.edu/publications/papers/MeasuresInfo.pdf
Carley, K. M. (2011). Database for dynamic network analysis of public health
organizations.

146
Carley, K. M. (2015a). Groups and Typology. Carnegie Mellon University. Pittsburgh,
PA.
Carley, K. M. (2015b) ORA. Pittsburgh, PA:
http://www.casos.cs.cmu.edu/projects/ora/download.php.
Carley, K. M. (forthcoming). Dynamic Network Analysis. Paper presented at the NRC
Workshop on Social Network Modeling and Analysis.
Carley, K. M., & Kamneva, N. Y. (2004). A Network Optimization Approach for
Improving Organizational Design. Retrieved from Pittsburgh, PA: Carnegie
Mellon University.
Carley, K. M., Kamneva, N. Y., & Reminga, J. (2004). Response Surface Methodology:
CASOS Technical Report. Retrieved from Pittsburgh, PA: Carnegie Mellon
University.
Carley, K. M., Martin, M. K., & Hancock, J. P. (n.d.). Advanced Decision Architectures
for the Warfighter: Foundations and Technology (P. McDermott & L. Allender
Eds.): Partners of the Army Research Laboratory Advanced Decision
Architectures Collaborative Technology Alliance.
Carley, K. M., Pfeffer, J., Reminga, J., Storrick, J., & Columbus, D. (2013). ORA User's
Guide 2013. Pittsburgh, PA: Carnegie Mellon University.
Carson, L. R. (2009). “I am because we are:” collectivism as a foundational characteristic
of African American college student identity and academic achievement. Social
Psychology of Education, 12(3), 327-344. doi:10.1007/s11218-009-9090-6

147
Christiansen, J. (2011). A Dynamic Network Analysis of vision in complex organizations.
(3454913), Clemson University. Retrieved from
http://ezproxy.net.ucf.edu/login?url=http://search.proquest.com/docview/8711093
19?accountid=10003nhttp://sfx.fcla.edu/ucf?url_ver=Z39.88-
2004&rft_val_fmt=info:ofi/fmt:kev:mtx:dissertation&genre=dissertations+&+the
ses&sid=ProQ:ProQuest+Dissertations+&+The
Cilliers, P. (2000). What can we learn from a theory of complexity? Emergence:
Complexity and Organization, 2(1), 23-33.
Colchester, J. (Producer). (2015a). Complex Adaptive Systems: Complex Systems.
Complex Adaptive Systems. Retrieved from
https://www.youtube.com/watch?v=jBgq9eS6t_I&list=PLsJWgOB5mIMCiKZu6
1rKFT_-TncWzylN8&index=3
Colchester, J. (Producer). (2015b). Complex Adaptive Systems: Complexity Theory.
Retrieved from
https://www.youtube.com/watch?v=7art8jsjlOI&index=2&list=PLsJWgOB5mIM
CiKZu61rKFT_-TncWzylN8
Colchester, J. (Producer). (2015c). Network Theory: Network Typology. Retrieved from
https://www.youtube.com/watch?v=bWaCB8IEgEY
Coleman, J. S. (1988). Social Capital in the Creation of Human Capital. American
Journal of Sociology, 94, S95-S120. doi:10.1086/228943
Corbin, J., & Straus, A. (1990). Grounded theory research: Procedures, Canons and
Evaluation. Qualitative Sociology, 13(1), 3-12.

148
Costanza, R., & Patten, B. C. (1995). Defining and predicting sustainability. Ecological
Economics, 15(3), 193-196. doi:10.1016/0921-8009(95)00048-8
Coveney, P. V. (2003). Self-organization and complexity: a new age for theory,
computation and experiment. Philos Trans A Math Phys Eng Sci, 361(1807),
1057-1079. doi:10.1098/rsta.2003.1191
Cowan, R., & Jonard, N. (2004). Network structure and the diffusion of knowledge.
Journal of Economic Dynamics and Control, 28(8), 1557-1575.
doi:10.1016/j.jedc.2003.04.002
Creswell, J. W. (2013). Qualitative Inquiry and Research Design: Choosing Among Five
Approaches (3 ed.). Thousand Oaks, CA: Sage.
Creswell, J. W. (2014). Research design: Qualitative, Quantitative, and Mixed Methods
Approaches (4 ed.). Thousand Oaks, CA: SAGE.
DeRue, D. S. (2011). Adaptive leadership theory: Leading and following as a complex
adaptive process. Research in Organizational Behavior, 31, 125-150.
doi:10.1016/j.riob.2011.09.007
Dolence, M. G. (1992). Strategic Enrollment Management: A Primer for Campus
Administrators.
Dolence, M. G. (2015a). SEM Funnel Graphic Suite (Version 4: Final). Retrieved from
https://mgdolence.com/2015/01/05/sem-funnel-graphic-suite-version-4-final/

149
Dolence, M. G. (2015b). Strategic Enrollment Management Funnel (Detailed): A detailed
view of the Strategic Enrollment Management Funnel. In semfunneldetailed-
final.png (Ed.), (Vol. 242 x 1024). Claremont, CA: Michael G. Dolence and
Associates.
Dolence, M. G. (2015c). Strategic Enrollment Management Funnel Recruitment. In
semfunneldetailed-recruitment-final.png (Ed.), (Vol. 475 x 1024). Claremont,
CA: Michael G. Dolence and Associates.
Dolence, M. G. (2015d). Strategic Enrollment Management Funnel: Retention. In
semfunneldetailed-retention-final.png (Ed.), (Vol. 483 x 1024). Claremont, CA:
Michael G. Dolence and Associates.
Forsman, J., Linder, C., Moll, R., Fraser, D., & Andersson, S. (2012). A new approach to
modelling student retention through an application of complexity thinking.
Studies in Higher Education, 39(1), 68-86. doi:10.1080/03075079.2011.643298
Fraser, D., Moll, R., Linder, C., & Forsman, J. (2011, October 4 - 7). Using Complexity
Theory to Develop a New Model of Student Retention. Paper presented at the
Research in Engineering Education Symposium, Madrid, Spain.
Gnyawali, D. R., & Madhavan, R. (2001). Cooperative Networks and Competitive
Dynamics: A Structural Embeddedness Persective. Academy of Management
Review, 26(3), 431-445. doi:10.5465/AMR.2001.4845820
Guastello, S. J. (2007). Non-linear dynamics and leadership emergence. The Leadership
Quarterly, 18(4), 357-369. doi:10.1016/j.leaqua.2007.04.005

150
Hanson, W. R. (2009). Ethical leadership in higher education: Evolution of institutional
ethics logic. (PhD), Clemson University, Clemson, SC.
Hasan, H. (2014). Complexity theory. In H. Hasan (Ed.), Being Practical with Theory: A
Window into Business Research (pp. 49-54). Wollongong, Australia: THEORI.
Retrieved from http://eurekaconnection.files.wordpress.com/2014/02/p-49-54-
complexity-theory-theori-ebook_finaljan2014-v3.pdf.
Haythornthwaite, C. (1996). Social network analysis: An approach and technique for the
study of information exchange. Library & Information Science Research, 18(4),
323-342. doi:10.1016/s0740-8188(96)90003-1
Hazy, J. K., Goldstein, J., & Lichtenstein, B. B. (Eds.). (2007). Complex systems
leadership theory: New perspectives from complexity science on social and
organizational effectiveness (Vol. 1). Mansfield, MA: ISCE Publishing.
Henderson, S. E. (2001). On the brink of a profession. In J. Black (Ed.), (pp. 3-36).
Washington, D.C.: American Association of Collegiate Registrars and
Admissions Officers.
Holbeche, L. (2005). The High Performance Organization: Creating Dynamic Stability
and Sustainable Success. London, England: Routledge.
Holland, J. (1995). Hidden order: How adaptation builds complexity. New York, NY:
Free Press.
Hoover, E. (2014). The Hottest Seat on Campus. The Chronicle of Higher Education.
Retrieved from http://chronicle.com/article/The-Hottest-Seat-on-Campus/148777

151
Hossler, D. (1990). The Strategic Management of College Enrollments. San Francisco,
CA: Jossey-Bass Inc.
Hossler, D., & Hoezee, L. (2001). Conceptual and theoretical thinking about enrollment
management. In J. Black (Ed.), (pp. 57-72). Washington, D.C.: American
Association of Collegiate Registrars and Admissions Officers.
Huddleston, T., Jr. (2000). Enrollment Management. New Directions for Higher
Education, 111(Fall), 65-73.
Kalsbeek, D. H. (2001). Tomorrow's SEM organization: New perspectives and priorities
for a changing workforce. In J. Black (Ed.), (pp. 298-298). Washington, D.C.:
American Association of Collegiate Registrars and Admissions Officers.
Kauffman, S. (1993). Self-Organization and Adaptation in Complex Systems (Vol. 29).
New York, NY: Oxford University Press.
Kemerer, F. R., Baldridge, J. V., & Green, K. C. (1982). Strategies for effective
enrollment management: Amer Assn of State Colleges & Universities.
Kenett, R., Steinberg, D., & Yoskovich, B. (2015). [The QbD Column: Response surface
methods and sequential exploration - JMP Blog].
Kezar, A. J., Carducci, R., & Contreras-McGavin, M. (2006). Rethinking the "L" Word in
Higher Education. ASHE Higher Education Report, Volume 31, Number 6 (1551-
6970). Retrieved from
http://libproxy.clemson.edu/login?url=http://search.ebscohost.com/login.aspx?dir
ect=true&db=eric&AN=EJ791616
http://dx.doi.org/10.1002/aehe.3106

152
Kirby, M. (2004). An overview of response surface methodology. Retrieved from
http://www.asdi.gatech.edu/people/mkirby/Class/RSM_Background_Lecture_08_
25_04.pdf
Kraatz, M. S., Ventresca, M. J., & Deng, L. (2010). Precarious values and mundane
innovations: Enrollment management in American liberal arts colleges. Academy
of Management Journal, 53(6), 1521-1545.
Lenth, R. V. (2009). Response-surface methods in R: Using RSM. Journal of Statistical
Software, 32(7), 1-17.
Lichtenstein, B. B., Uhl-Bien, M., Marion, R., Seers, A., Orton, J. D., & Schreiber, C.
(2007). Complexity Leadership Theory: An Interactive Perspective on Leading in
Complex Adaptive Systems. In J. K. Hazy, J. Goldstein, & B. B. Lichtenstein
(Eds.), Complex Systems Leadership Theory: New Perspectives form Complexity
Science on Social and Organizational Effectiveness (Vol. 1, pp. 132-141).
Mansfield, MA: ISCE Publishing.
Luczak, C., Mohan-Neill, S., & Hills, G. (2014). A Quantitative Study of Business
Owners and Perceived Network Benefits: Collectivist vs. Individualist Based
Cultures. Academy of Entrepreneurship Journal, 20(2), 1-18.
Marion, R., & Bacon, J. (1999). Organizational Extinction and Complex Systems.
Emergence, 1(4), 71-96.
Marion, R., Christiansen, J., Klar, H. W., Schreiber, C., & Erdener, M. A. (2016).
Informal leadership, interaction, cliques and productive capacity in organizations:
A collective analysis. The Leadership Quarterly, 27, 242-260.
153
Marion, R., & Gonzales, L. D. (2014). Leadership in Education: Organizational Theory
for the Practitioner (Second ed.). Long Grove, IL: Waveland Press, Inc.
Marion, R., & Uhl-Bien, M. (2001). Leadership in Complex Organizations. The
Leadership Quarterly, 12(4), 389-418. doi:10.1016/S1048-9843(01)00092-3
Marion, R., & Uhl-Bien, M. (2003). Complexity Theory and Al-Qaeda: Examining
Complex Leadership. Emergence, 5(1), 54-76.
Marion, R., & Uhl-Bien, M. (2007a). Paradigmatic Influence and Leadership: The
perspectives of complexity theory and bureaucracy theory (Vol. 1, pp. 143-159).
Masnfield, MA 02048: ISCE Publishing.
Marion, R., & Uhl-Bien, M. (2007b). Paradigmatic Influence and Leadership: The
perspectives of complexity theory and bureaucracy theory Complex Systems
Leadership Theory: New Perspectives from Complexity Science on SOcial and
Organizational Effectiveness (Vol. 1, pp. 143-159). Masnfield, MA 02048: ISCE
Publishing.
Mathews, P. G. (2005). Design of Experiments with MINITAB. Milwaukee, WI: ASQ
Quality Press.
McClellan, J. L. (2010). Leadership and Complexity: Implications for Practice within the
Advisement Leadership Bodies at Colleges and Universities. Complicity: An
International Journal of Complexity & Education, 7(2), 32-51.
Mcfarland, M. (2012). A Dynamic Network Analysis of Innovation and Leadership in
Two-Year Colleges. (PhD), Clemson University, Clemson, SC. (1035)

154
McKelvey, B. (2001). MicroStrategy from MacroLeadership: Distributed intelligence via
new science. In A. Y. Lewin & H. Volberda (Eds.), Mobilizing the self-renewing
organization: The coevolution advantage. New York: ME Sharp.
McMurtry, A. (2008). Complexity Theory 101 for Educators: A Fictional Account of a
Graduate Seminar. McGill Journal of Education, 43(3), 265-281.
McPherson, M., Smith-Lovin, L., & Cook, J. M. (2001). Birds of a Feather: Homophily
in Social Networks. Annual Review of Sociology, 27(1), 415-444.
doi:10.1146/annurev.soc.27.1.415
Minitab (Version 17.3.1). (2016). State College, PA.
National Association of College University Business Officers. (2015). NACUBO-
Commonfund Study of Endowments. Retrieved from
http://www.nacubo.org/Research/NACUBO-
Commonfund_Study_of_Endowments.html
Newman, M. E. J. (2004). Detecting Community Structure in Networks. The European
Physical Journal, 38, 321-330. doi:10.1140/epjb/e2004-00124-y
Newman, M. E. J. (2010). Networks: An Introduction: OUP Oxford.
Newman, M. E. J. (2011). Complex Systems: A Survey. American Journal of Physics,
79(8), 800. doi:10.1119/1.3590372
NVivo for Mac (Version 11.1.1 (1551)). (2015): QSR International.
Onwuegbuzie, A. J., & Collins, K. M. T. (2007). A typology of mixed methods sampling
designs in social science research. The qualitative report, 12(2), 281-316.
155
Perony, N. (Producer). (2014). Puppies! Now that I've Got Your Attention, Complexity
Theory. Retrieved from https://www.youtube.com/watch?v=0Y8-IzP01lw
Peters, T. (1992). Liberation Management: Necessary Disorganization for the
Nanosecond Nineties. London: Macmillan.
Plano Cark, V. L., & Creswell, J. W. (2008). The mixed methods reader. Thousand Oaks,
CA: Sage Publications.
Plowman, D. A., Solansky, S., Beck, T. E., Baker, L., Kulkarni, M., & Travis, D. V.
(2007). The role of leadership in emergent, self-organization. The Leadership
Quarterly, 18(4), 341-356. doi:10.1016/j.leaqua.2007.04.004
Prigogine, I. (1997). The end of certainty. New York, NY: The Free Press.
Qualtrics. (2015). Provo, UT: http://www.qualtrics.com/.
Randall, K. R., Resick, C. J., & DeChurch, L. A. (2011). Building team adaptive
capacity: the roles of sensegiving and team composition. J Appl Psychol, 96(3),
525-540. doi:10.1037/a0022622
Randall, L. M., & Coakley, L. A. (2007). Applying adaptive leadership to successful
change initiatives in academia. Leadership & Organization Development Journal,
28(4), 325-335. doi:10.1108/01437730710752201
Regine, B., & Lewin, R. (2000). Leading at the edge: How leaders influence complex
systems. Emergence, 2(2), 5-23.
Salem, P. (2002). Assessment, Change, and Complexity. Management Communication
Quarterly, 15(3), 442-450.
156
Schreiber, C., & Carley, K. M. (2005). Ineffective Organizational Practices at NASA: A
Dynamic Network Analysis. Retrieved from Pittsburgh, PA:
Schreiber, C., & Carley, K. M. (2006). Leadership style as an enabler of organizational
complex functioning. E:CO Emergence: Complexity and Organization, 8(4), 61-
76. doi:10.1111/j.1399-5618.2010.00833.x
Shakouri, N., Teimourtash, M., & Teimourtash, M. (2014). Chaos/Complexity Theory in
Language Learning: An Ideological Look. Theory and Practice in Language
Studies, 4(7). doi:10.4304/tpls.4.7.1503-1510
Statistics, N. C. f. E. Integrated Postsecondary Education Data System. Retrieved from
http://nces.ed.gov/collegenavigator/?q=ohio+wesleyan&s=all
Tashakkori, A., & Teddlie, C. (2003). Handbook of mixed methods in social and
behavioral research. Thousand Oaks, CA: Sage.
Teddlie, C., & Tashakkori, A. (2009). Foundations of mixed methods research:
Integrating quantitative and qualitative approaches in the social and behavioral
sciences: Sage Publications Inc.
Uhl-Bien, M., & Marion, R. (2008a). Complexity Leadership, Part I: Conceptual
Foundations. Charlotte, NC: Information Age Publishing, Inc.
Uhl-Bien, M., & Marion, R. (Eds.). (2008b). Complexity Leadership, Part I: Conceptual
Foundations. Charlotte, NC: Information Age Publishing, Inc.
Uhl-Bien, M., Marion, R., & McKelvey, B. (2007). Complexity Leadership Theory:
Shifting leadership from the industrial age to the knowledge era. The Leadership
Quarterly, 18(4), 298-318. doi:10.1016/j.leaqua.2007.04.002

157
van der Hulst, R. C. (2011). Terrorist networks: the threat of connectivity. In J. Scott & P.
J. Carrington (Eds.), (pp. 256-270). Thousand Oaks, CA: SAGE Publications, Inc.
Walczak, S., & Sincich, T. (1999). A comparative analysis of regression and neural
networks for university admissions. Information Sciences, 119, 1-20.
Walumbwa, F. O., & Lawler, J. J. (2003). Building effective organizations:
transformational leadership, collectivist orientation, work-related attitudes and
withdrawal behaviours in three emerging economies. The International Journal of
Human Resource Management, 14(7), 1083-1101.
doi:10.1080/0958519032000114219
Wasserman, S., & Faust, K. (1994). Social network analysis: Methods and applications.
Cambridge: Cambridge University Press.
Weng, L., Menczer, F., & Ahn, Y.-Y. (2013). Virality Prediction and Community
Structure in Social Networks. Scientific Reports, 3, 1-6. doi:10.1038/srep02522
Wilkinson, R. B., Taylor, J. S., Peterson, A., & Machado-Taylor, M. D. L. (2007). A
Practical Guide to Strategic Enrollment Management Planning in Higher
Education: Educational Policy Institute.
Yammarino, F. J., Salas, E., Serban, A., Shirreffs, K., & Shuffler, M. L. (2012).
Collectivistic leadership approaches: Putting the “we” in leadership science and
practice. Industrial and Organizational Psychology, 5(4), 382-402.
Yukl, G., & Falbe, C. M. (1990). Influence tactics and objectives in upward, downward,
and lateral influence attempts. Journal of Applied Psychology, 75(2), 132-140.
doi:10.1037/0021-9010.75.2.132