dynamic daylight performance metrics for sustainable building design
TRANSCRIPT
Dynamic Daylight Performance Metrics forSustainable Building Design
Christoph F. Reinhart*, John Mardaljevic, Zack Rogers
Abstract—The objective of this document is to promote the use ofdynamic daylight performance measures for sustainable buildingdesign. The paper initially explores the shortcomings of conventional,static daylight performance metrics which concentrate on individualsky conditions, such as the common daylight factor. It then provides areview of previously suggested dynamic daylight performance metrics,discussing the capability of these metrics to lead to superiordaylighting designs and their accessibility to nonsimulation experts.Several example offices are examined to demonstrate the benefit ofbasing design decisions on dynamic performance metrics as opposedto the daylight factor.
Keywords—–daylighting, dynamic, metrics, sustainable buildings
1 INTRODUCTION
B uilding performance metrics are supposed to be “quality measures” forbuildings with respect to their energy efficiency, safety, quality of design,
and so on. Performance metrics can be used for comparative studies to guidebuilding design or to benchmark a building against a pool of other buildings.Performance metrics range from being rather specific, for example, how well aretwo building zones acoustically separated, to very general, for example, how“green” is a building. The latter type of metrics usually combines severalindividual submetrics into a single overall rating, stipulating a pass or failcriteria for each submetric1. Pass/fail criteria are effective at initially drawingthe attention of the design team towards a specific issue such as “are theresufficient showers and bicycle racks in a building to allow staff to walk or cycle
* Corresponding author: email: [email protected]; Tel �1(613)993-9703.CF Reinhart: National Research Council Canada, 1200 Montreal Road M-24, Ottawa, ON, K1A0R6, Canada; J Mardaljevic: Institute of Energy and Sustainable Development, De MontfortUniversity, The Gateway, Leicester, LE1 9BH, UK; Z Rogers: Architectural Energy Corporation,2540 Frontier Avenue, Suite 201, Boulder, Colorado 80301, USA
1 Prominent rating systems used in North America are LEED (www.usgbc.org/LEED/), GreenGlobe. (www.greenglobe21.com), and the Collaborative for High Performance Schools (http://www.chps.net/).
L E U K O S V O L 3 N O 1 J U L Y 2 0 0 6 P A G E S 7 – 3 1
©2006 National Research Council Canada (Crown Copyright)doi: 10.1582/LEUKOS.2006.03.01.001
7
to work” or “the proper way to set up an erosion and sedimentary control plan”.They are more difficult to formulate and potentially less effective for morequalitative or multifaceted aspects of design, such as daylighting.
Daylighting is a notoriously difficult building performance strategy to evalu-ate. What is good daylighting? Research careers have been invested in answeringthis question. One of the difficulties of pinpointing good daylighting may be thatdifferent professions concentrate on different aspects of daylighting. Table 1
presents a sample list of definitions for daylighting that were presented toparticipants in a recent survey on the use of daylighting in sustainable buildingdesign (Reinhart and Galasiu 2006).
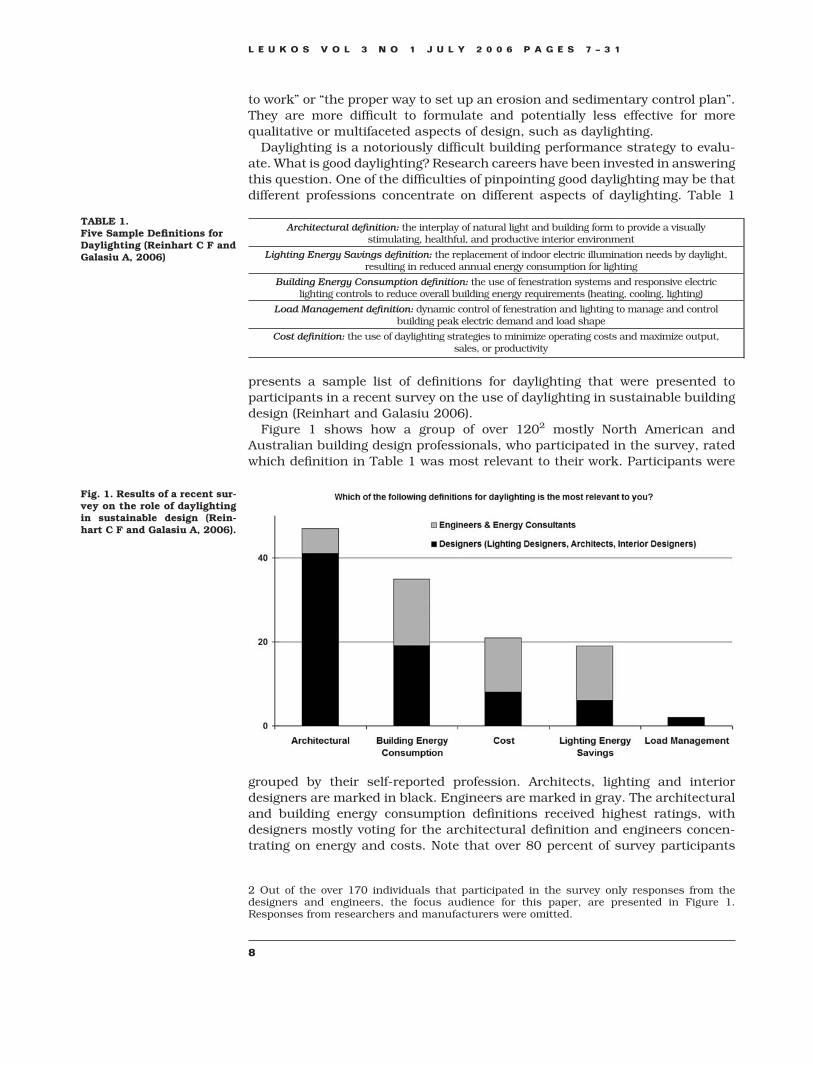
Figure 1 shows how a group of over 1202 mostly North American andAustralian building design professionals, who participated in the survey, ratedwhich definition in Table 1 was most relevant to their work. Participants were
grouped by their self-reported profession. Architects, lighting and interiordesigners are marked in black. Engineers are marked in gray. The architecturaland building energy consumption definitions received highest ratings, withdesigners mostly voting for the architectural definition and engineers concen-trating on energy and costs. Note that over 80 percent of survey participants
2 Out of the over 170 individuals that participated in the survey only responses from thedesigners and engineers, the focus audience for this paper, are presented in Figure 1.Responses from researchers and manufacturers were omitted.
Fig. 1. Results of a recent sur-vey on the role of daylightingin sustainable design (Rein-hart C F and Galasiu A, 2006).
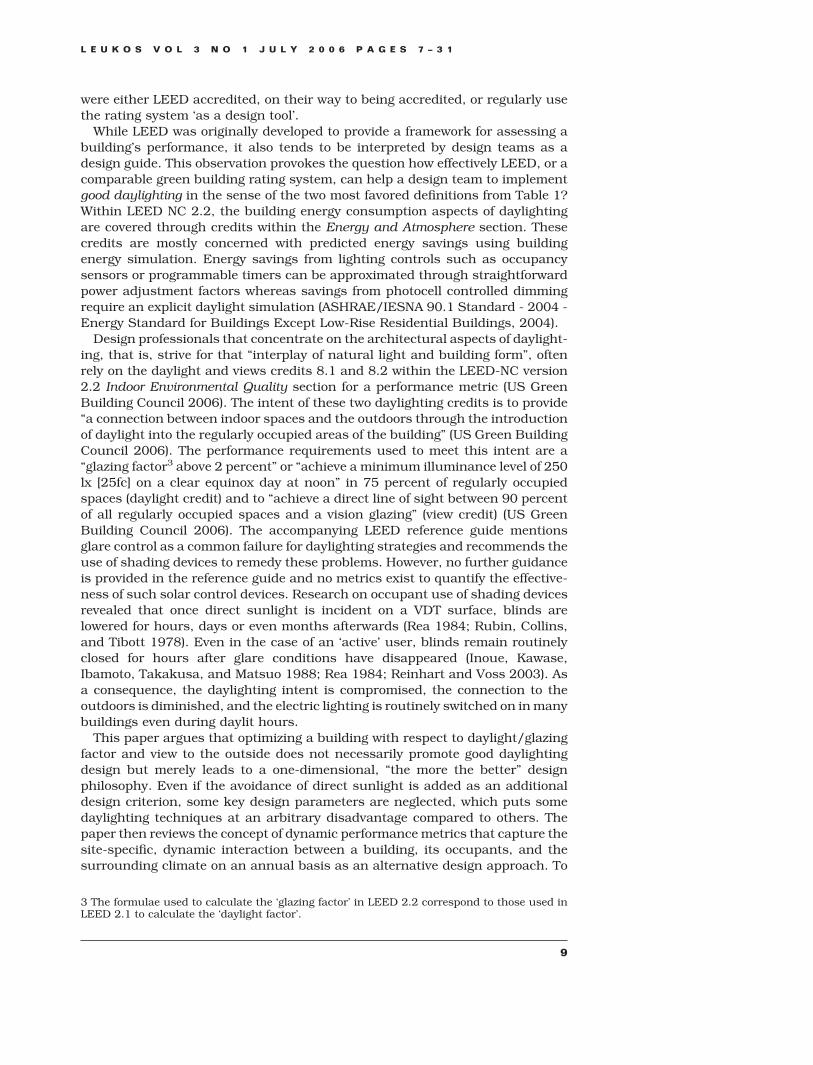
TABLE 1.Five Sample Definitions forDaylighting (Reinhart C F andGalasiu A, 2006)
Architectural definition: the interplay of natural light and building form to provide a visuallystimulating, healthful, and productive interior environment
Lighting Energy Savings definition: the replacement of indoor electric illumination needs by daylight,resulting in reduced annual energy consumption for lighting
Building Energy Consumption definition: the use of fenestration systems and responsive electriclighting controls to reduce overall building energy requirements (heating, cooling, lighting)
Load Management definition: dynamic control of fenestration and lighting to manage and controlbuilding peak electric demand and load shape
Cost definition: the use of daylighting strategies to minimize operating costs and maximize output,sales, or productivity
L E U K O S V O L 3 N O 1 J U L Y 2 0 0 6 P A G E S 7 – 3 1
8
were either LEED accredited, on their way to being accredited, or regularly usethe rating system ‘as a design tool’.
While LEED was originally developed to provide a framework for assessing abuilding’s performance, it also tends to be interpreted by design teams as adesign guide. This observation provokes the question how effectively LEED, or acomparable green building rating system, can help a design team to implementgood daylighting in the sense of the two most favored definitions from Table 1?Within LEED NC 2.2, the building energy consumption aspects of daylightingare covered through credits within the Energy and Atmosphere section. Thesecredits are mostly concerned with predicted energy savings using buildingenergy simulation. Energy savings from lighting controls such as occupancysensors or programmable timers can be approximated through straightforwardpower adjustment factors whereas savings from photocell controlled dimmingrequire an explicit daylight simulation (ASHRAE/IESNA 90.1 Standard - 2004 -Energy Standard for Buildings Except Low-Rise Residential Buildings, 2004).
Design professionals that concentrate on the architectural aspects of daylight-ing, that is, strive for that “interplay of natural light and building form”, oftenrely on the daylight and views credits 8.1 and 8.2 within the LEED-NC version2.2 Indoor Environmental Quality section for a performance metric (US GreenBuilding Council 2006). The intent of these two daylighting credits is to provide“a connection between indoor spaces and the outdoors through the introductionof daylight into the regularly occupied areas of the building” (US Green BuildingCouncil 2006). The performance requirements used to meet this intent are a“glazing factor3 above 2 percent” or “achieve a minimum illuminance level of 250lx [25fc] on a clear equinox day at noon” in 75 percent of regularly occupiedspaces (daylight credit) and to “achieve a direct line of sight between 90 percentof all regularly occupied spaces and a vision glazing” (view credit) (US GreenBuilding Council 2006). The accompanying LEED reference guide mentionsglare control as a common failure for daylighting strategies and recommends theuse of shading devices to remedy these problems. However, no further guidanceis provided in the reference guide and no metrics exist to quantify the effective-ness of such solar control devices. Research on occupant use of shading devicesrevealed that once direct sunlight is incident on a VDT surface, blinds arelowered for hours, days or even months afterwards (Rea 1984; Rubin, Collins,and Tibott 1978). Even in the case of an ‘active’ user, blinds remain routinelyclosed for hours after glare conditions have disappeared (Inoue, Kawase,Ibamoto, Takakusa, and Matsuo 1988; Rea 1984; Reinhart and Voss 2003). Asa consequence, the daylighting intent is compromised, the connection to theoutdoors is diminished, and the electric lighting is routinely switched on in manybuildings even during daylit hours.
This paper argues that optimizing a building with respect to daylight/glazingfactor and view to the outside does not necessarily promote good daylightingdesign but merely leads to a one-dimensional, “the more the better” designphilosophy. Even if the avoidance of direct sunlight is added as an additionaldesign criterion, some key design parameters are neglected, which puts somedaylighting techniques at an arbitrary disadvantage compared to others. Thepaper then reviews the concept of dynamic performance metrics that capture thesite-specific, dynamic interaction between a building, its occupants, and thesurrounding climate on an annual basis as an alternative design approach. To
3 The formulae used to calculate the ‘glazing factor’ in LEED 2.2 correspond to those used inLEED 2.1 to calculate the ‘daylight factor’.
L E U K O S V O L 3 N O 1 J U L Y 2 0 0 6 P A G E S 7 – 3 1
9
further illustrate the predictive power of dynamic performance metrics, severalpreviously suggested metrics are applied to a series of example offices. Anoutlook of how dynamic performance metrics could be introduced into greenbuilding rating schemes is given in the discussion.
2 CURRENT METRICS: DAYLIGHT FACTOR, VIEW, AND THEAVOIDANCE OF DIRECT SUNLIGHT
Daylight factor, view to the outside, and (sometimes) the avoidance of directsunlight are currently the sole quantitative performance metrics used to imple-ment daylighting in a building. How well does the use of these measures lead togood daylighting design according to the architectural definition in Table 1?
2.1 DAYLIGHTING FACTOR
The daylight factor is defined as the ratio of the internal illuminance at a pointin a building to the unshaded, external horizontal illuminance under a CIEovercast sky (Moon and Spencer 1942). The concept of using an illuminanceratio to quantify the amount of daylight in buildings has at least been aroundsince 1909 when Waldram published a measurement technique based on theapproach (Waldram 1909). The original motive for using ratios rather thanabsolute values was to avoid the difficulty of having to deal with “frequent andoften severe fluctuations in the intensity of daylight” (Waldram 1950). Initially,sky factors were used that quantify the contribution of direct light from the skydome to a point in a building. Over time the sky factor evolved into the daylightfactor, as light reflected from external obstructions, light losses through glaz-ings, and internal reflectances were added as well (Waldram 1950). In 1949 thereference sky changed from a uniform to what is now a CIE overcast sky (Moonand Spencer 1942).
In those early days, illuminance ratios were primarily used as legal evidence incourt. In Waldram’s words, “legal rights of light . . . constituted practically theonly profitable . . . field for daylight experts” (Waldram 1950). Based on an oldRoman law, the UK Prescription Act of 1832 established that if one has benefitedfrom daylight access across someone else’s property for over 20 years, ‘anabsolute and indefensible rights to light’ is granted to the window. A violation ofa window’s right to light was found when a new neighboring structure caused‘inadequate’ indoor daylight levels (Waldram 1950). The decisive question has ofcourse always been what one might consider to be adequate daylighting levelsfor various tasks. Nowadays 500 lx on the work plane are often recommended foroffice work (Canadian Labor Code, Part II: Occupational Safety & Health 1991;IESNA Lighting Handbook (9th Edition) 2000). Assuming an outside illuminanceof around 10000 lx under an overcast sky, the corresponding daylight factorrequirement becomes 500 lx/10000 lx � 2 percent, which happens to coincidewith the LEED threshold level.
This brief historical excursion suggests that the daylight factor was nevermeant to be a measure of good daylighting design but a minimum legal lightingrequirement. Given this background, designers’ expectations that it might helpthem to “provide a visually stimulating, healthful, and productive interiorenvironment” seem unfounded.
Nevertheless, daylight factor remains the most widely used performancemeasure for daylighting and for the majority of practitioners, the consideration
L E U K O S V O L 3 N O 1 J U L Y 2 0 0 6 P A G E S 7 – 3 1
10
of any quantitative measure of daylight begins and ends with daylight factor(Nabil and Mardaljevic 2005). Over the past fifty years, this design practice hasremained largely unchallenged with a few notable exceptions (Kendrick andSkinner 1980; Tregenza 1980). Its popularity probably stems from the fact thatdaylight factor remains the only widely accepted, quantitative performancemeasure for daylighting. There are also a number of qualities that supportdaylight factor’s use as a design metric.
Daylight factors vary for different building designs and accordingly have thecapacity to influence design choices. What design aspects are affected by thedaylight factor? Building geometry, surrounding landscape and buildings, aswell as surface properties (color, diffuseness, specularity, transmittance, reflec-tance) have an impact on the daylight factor. A common argument used byproponents of the daylight factor is that the reference overcast sky is the worstcase sky condition and therefore any other sky will lead to more daylight in thespace. The argument continues that movable shading devices – such as venetianblinds – are operated by occupants to avoid glare but – even if lowered – usuallyprovide sufficient daylight to avoid electric lighting. Note that the daylight factorcalculations do not include any movable shading devices as they are not neededunder the worst case overcast sky condition.
On a practical level, daylight factor has the advantage that predictions areintuitive and easy to communicate within a design team. A number of calcula-tion methods exist for the daylight factor ranging from simple spreadsheetcalculations (Canadian Green Building Council 2004) to the BRE split fluxmethod to advanced calculation techniques based on radiosity (Lighting Ana-lysts Inc. 2006), Lumen Designer (Lighting Technologies Inc. 2006) and/orraytracing (Ward and Shakespeare 1998). Using Radiance, one can calculatedaylight factor distributions for more or less any building geometry and manymaterial types.
What “message” does daylight factor convey to its users, that is, how does the“daylight factor mindset” influence the practice of daylighting design andevaluation? Some form-giving features that are generally associated with gooddaylighting are indeed promoted by daylight factor: high window-head heights,high reflective ceiling and wall finishes, narrow floor plans, large facade andskylight openings with high transmittance glazings. A daylight factor optimizedbuilding admits as much daylight as possible into the building, following a “themore the better” approach. Taking this to the extreme, the daylight factoroptimized building has a fully glazed building envelope. Commercial buildingswith fully glazed facades often exhibit comfort and energy problems, revealingthat the above sketched argument for the use of daylight factor is flawed.
What are the limitations of the daylight factor metric? Design recommenda-tions based on the daylight factor are the same for all facade orientations andbuilding locations as the daylight factor does not consider season, time of day,direct solar ingress, variable sky conditions, building orientation, or buildinglocation. This bears a number of important consequences: Daylight factorinvestigations cannot help to develop glare prevention strategies for differentfacade orientations, even though problems of glare associated with low solaraltitudes are known to be most prominent for east and west facing facades andcan be significant. Daylight factor analysis cannot even provide a warning flag asto whether there will be a glare problem in certain parts of a building.
L E U K O S V O L 3 N O 1 J U L Y 2 0 0 6 P A G E S 7 – 3 1
11
2.2 VIEW TO THE OUTSIDE
The provision of a view to the outside is promoted in buildings through the LEEDrating system. The system stipulates that 90 percent of regularly occupiedspaces should have a direct line of sight to the outside through a vertical windowthat is located between 2�6� (76 cm) and 7�6� (228 cm) above the floor. This creditaims to acknowledge findings that a view to the outside is a highly praisedbenefit of a window. As it stands, the design criteria has several shortcomings,the most important one being that research has shown that to qualify as a“view”, a visual connection to the outside from a point in a building has to extendabove a minimum solid angle width and height, the size of which depends on thetype of view (Farley 2001; Ne’eman and Hopkinson 1970). View benefits are alsodependent on the content of the view (Ne’eman and Hopkinson 1970). The LEEDcriteria become less meaningful for spaces in which a movable shading deviceattached to a view window is frequently fully lowered due to glare. Perforatedroller shades or horizontal venetian blinds with the slats set in horizontalposition can mitigate this effect by still allowing some view to the outside.
2.3 DAYLIGHT FACTOR AND AVOIDANCE-OF-DIRECT-SUNLIGHT
Fortunately, many design teams are aware of the above cited limitations of thedaylight factor and consider the avoidance of direct sunlight in parallel withdaylight factor predictions. Direct sunlight studies can be performed usingsimulations or scale model measurements. The objective is to design facadesthat avoid direct sunlight in the building during the cooling season. A conse-quent combination of daylight factor predictions and direct shading studiesleads to a building in which facade openings are reduced to the minimumpossible size and a required minimum daylight factor can be maintained withina desired area adjacent to facade and ceiling openings. It is interesting to notethat in combination with a direct shading analysis, the daylight factor is reducedto its initial historic scope: A minimum level of interior daylight by which theusers can ‘get by’. Buildings that are the result of this “combined approach”(weighting daylight factor against unwanted solar gains) should exhibit aconsiderably better energy balance than those designed following a daylight-factor-only approach. A remaining, valid question is: “Could it be better?”
A practical limitation of the combined approach is that only static shadingdevices such as lightshelves can be considered, whereas the performance ofdynamic shading devices such as venetian blinds remains elusive. It remainstherefore difficult to compare the performance of a lightshelf or a translucentglazing to arguably the most common solution for sidelit spaces: A window withmanually operated venetian blinds.
Also, even though the combined approach considers building orientation andlatitude, the actual climate in which the building is placed is not considered. Abuilding in Vancouver, Canada, (latitude 49° N), a climate renowned for its rainywinters, is treated the same as a building in Regina, Canada, (latitude 50° N), aclimate characterized through clear winter days with a snow covered ground forseveral months of the year.
Finally, the combined approach completely ignores building type and occu-pant requirements of the building. Is it a school that is occupied half days fromSeptember to June or a hospital with 24/7 service? What lighting levels arerequired by the occupants?
L E U K O S V O L 3 N O 1 J U L Y 2 0 0 6 P A G E S 7 – 3 1
12
3 DYNAMIC DAYLIGHT PERFORMANCE METRICS
This section describes dynamic daylight performance metrics as an alternativeto the daylight factor-based approaches described in the previous section.
3.1 TODAY’S DESIGN CONTEXT
Dynamic performance metrics require the use of three-dimensional CAD soft-ware as well as a daylight simulation model. A series of circumstances haverecently lead to an increased use of daylight simulation tools in professionalpractice and at some schools of architecture:• Access to enhanced computing power at affordable prices for small to medium-
sized Architectural and Engineering firms and architectural students.• Widespread computer agility and interest in information technology and
multimedia within the current generation of graduating architects. Considerthe following numbers: A 1990 survey of the US architectural communityfound that over 75 percent of participants “could not name a CAD system theyhad used in the past” (Hattrup 1990). A 1997 study concluded that “90 percentof design professionals [surveyed] use some kind of CAD tool in their commer-cial design work” (Turnbull and Loisos 2000). Today, architecture studentsthroughout North America are required to learn at least one three-dimensionalCAD tool. Many acquire proficiency in several tools.
• Availability of enhanced user interfaces that allow users to generate three-dimensional building models, carry out a daylight simulation, and display theresults in a meaningful, easy-to-understand fashion. The authors’ teachingexperiences suggest that architectural students are now able to carry outadvanced daylighting studies after only a few weeks of formal instruction4.While most current daylight simulation tools remain limited to daylight factor
and illuminance calculations and/or shading analysis studies, a few offer thecapability to carry out annual calculations. The following section discusses theextra effort required by the simulationist to go from a daylight factor analysis toa dynamic daylight simulation.
3.2 DYNAMIC DAYLIGHT SIMULATIONS
Dynamic daylight performance metrics are based on time series of illuminancesor luminances within a building. These time series usually extend over the wholecalendar year and are based on external, annual solar radiation data for thebuilding site. The key advantage of dynamic daylight performance metricscompared to static metrics is that they consider the quantity and character ofdaily and seasonal variations of daylight for a given building site together withirregular meteorological events.
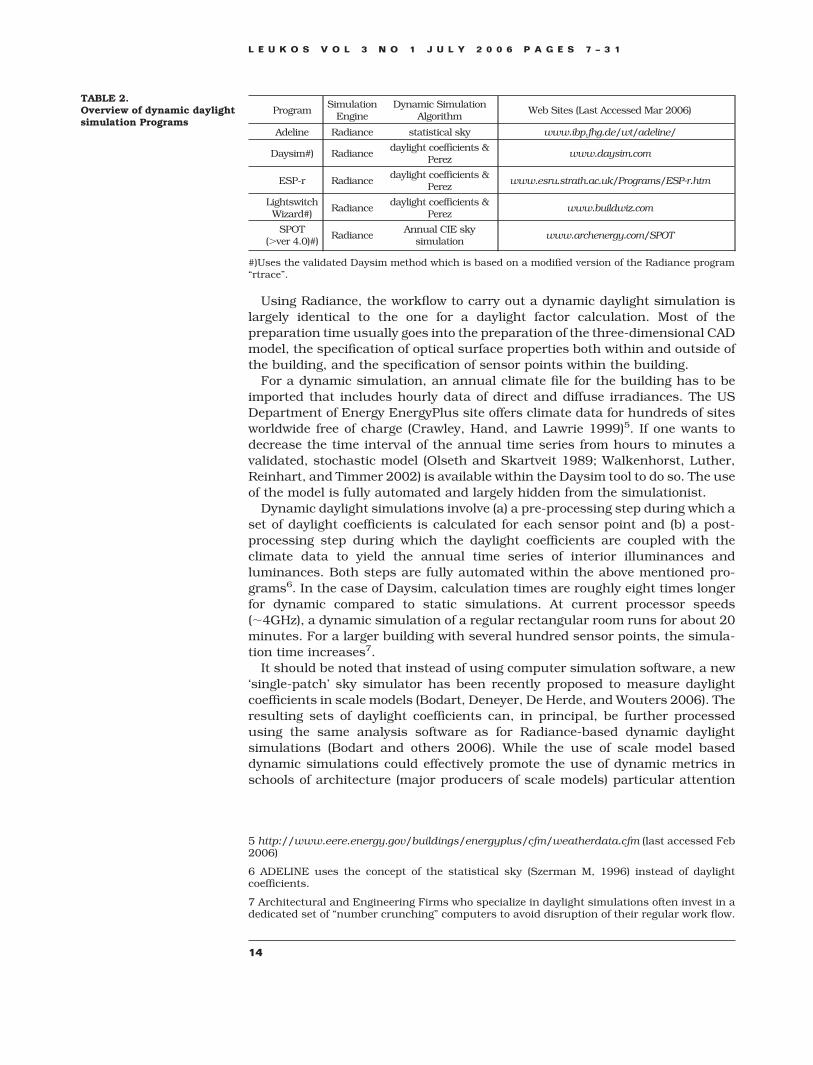
Several studies have demonstrated that the Radiance raytracer combined witha daylight coefficient approach and the Perez Sky Model is able to reliably andeffectively calculate time series of illuminances and luminances in buildings(Mardaljevic 2000; Reinhart and Andersen 2006; Reinhart and Walkenhorst2001). An overview of the daylight coefficient approach and selected Radiancevalidation studies can be found under Reinhart and Anderson (Reinhart andAndersen 2006). Table 2 lists several Radiance-based daylighting tools that canbe used to carry out dynamic daylight simulations.
4 See e.g.: http://www.arch.mcgill.ca/prof/reinhart/arch474/winter2005/ (last accessed Feb2006)
L E U K O S V O L 3 N O 1 J U L Y 2 0 0 6 P A G E S 7 – 3 1
13
Using Radiance, the workflow to carry out a dynamic daylight simulation islargely identical to the one for a daylight factor calculation. Most of thepreparation time usually goes into the preparation of the three-dimensional CADmodel, the specification of optical surface properties both within and outside ofthe building, and the specification of sensor points within the building.
For a dynamic simulation, an annual climate file for the building has to beimported that includes hourly data of direct and diffuse irradiances. The USDepartment of Energy EnergyPlus site offers climate data for hundreds of sitesworldwide free of charge (Crawley, Hand, and Lawrie 1999)5. If one wants todecrease the time interval of the annual time series from hours to minutes avalidated, stochastic model (Olseth and Skartveit 1989; Walkenhorst, Luther,Reinhart, and Timmer 2002) is available within the Daysim tool to do so. The useof the model is fully automated and largely hidden from the simulationist.
Dynamic daylight simulations involve (a) a pre-processing step during which aset of daylight coefficients is calculated for each sensor point and (b) a post-processing step during which the daylight coefficients are coupled with theclimate data to yield the annual time series of interior illuminances andluminances. Both steps are fully automated within the above mentioned pro-grams6. In the case of Daysim, calculation times are roughly eight times longerfor dynamic compared to static simulations. At current processor speeds(�4GHz), a dynamic simulation of a regular rectangular room runs for about 20minutes. For a larger building with several hundred sensor points, the simula-tion time increases7.
It should be noted that instead of using computer simulation software, a new‘single-patch’ sky simulator has been recently proposed to measure daylightcoefficients in scale models (Bodart, Deneyer, De Herde, and Wouters 2006). Theresulting sets of daylight coefficients can, in principal, be further processedusing the same analysis software as for Radiance-based dynamic daylightsimulations (Bodart and others 2006). While the use of scale model baseddynamic simulations could effectively promote the use of dynamic metrics inschools of architecture (major producers of scale models) particular attention
5 http://www.eere.energy.gov/buildings/energyplus/cfm/weatherdata.cfm (last accessed Feb2006)
6 ADELINE uses the concept of the statistical sky (Szerman M, 1996) instead of daylightcoefficients.
7 Architectural and Engineering Firms who specialize in daylight simulations often invest in adedicated set of “number crunching” computers to avoid disruption of their regular work flow.
TABLE 2.Overview of dynamic daylightsimulation Programs
ProgramSimulation
EngineDynamic Simulation
AlgorithmWeb Sites (Last Accessed Mar 2006)
Adeline Radiance statistical sky www.ibp.fhg.de/wt/adeline/
Daysim#) Radiancedaylight coefficients &
Perezwww.daysim.com
ESP-r Radiancedaylight coefficients &
Perezwww.esru.strath.ac.uk/Programs/ESP-r.htm
LightswitchWizard#)
Radiancedaylight coefficients &
Perezwww.buildwiz.com
SPOT(�ver 4.0)#)
RadianceAnnual CIE sky
simulationwww.archenergy.com/SPOT
#)Uses the validated Daysim method which is based on a modified version of the Radiance program“rtrace”.
L E U K O S V O L 3 N O 1 J U L Y 2 0 0 6 P A G E S 7 – 3 1
14
has to be paid to intrinsic limitations of physical model studies such as parallaxerrors (Mardaljevic 2002).
3.3 A REVIEW OF DYNAMIC DAYLIGHT PERFORMANCE METRICS
The preceding section made the case that the extra effort to carry out a dynamicas opposed to a static daylight simulation has been reduced recently, making theresulting annual time series of interior illuminances or luminances more readilyavailable to nonexpert designers. The obvious question is what a designer is todo with the voluminous data from a climate-based analysis (thousands of datapoints for each sensor). The task at hand is to reduce the data withoutdiminishing its value for building design. This section provides a systematicreview of the choices that need to be made to develop a dynamic performancemetric for a space.
3.3.1 IDENTIFYING SENSOR POINTS
The first performance-metric-related decision a simulationist faces is to pick thenumber and location of sensor points. A common approach is to define a grid ofupward facing illuminance sensors that extends throughout a lighting zone. Atypical grid resolution would be 0.5 m � 0.5 m at work plane height (0.8m abovethe floor). Depending on the particular space, some of these sensors might besingled out as ‘core work plane sensors’, that is, sensors close to where theoccupants are usually located (Nabil A and Mardaljevic J, 2005). The choice ofusing illuminance as opposed to luminance sensors is linked to the decisionunder 3.3.3 to use work plane illuminances as a basis to judge whether thedaylighting in a space is ‘adequate’. If other criteria such as luminance ratios inthe field of view (FOV) were chosen under 3.3.3, the choice of sensor location andtype would have to be adopted accordingly.
3.3.2 DEFINING A TIME BASIS
The next step is to decide which times of the year to consider as a time basis fordaylight performance metrics. Two obvious time selection criteria come to mind:(a) the daylit hours during the year or (b) the occupied times of the year for anygiven zone in the building. Both approaches have their pros and cons.
An initial reaction of a designer might be to use the daylit hours during theyear since these hours are unambiguously intertwined with the building site.Building occupancy patterns are not standard architectural considerationswhen determining building form. Also, building usage might change over time aswarehouses become offices and offices become apartments. If one is to design atruly sustainable building with a long term perspective, the annual daylit hourswill never change unless the surrounding urban environment changes.
On the other hand, occupancy patterns and occupants’ lighting requirementslie at the heart of the desired interplay between natural light and building form(Table 1). Daylighting needs “witnesses” to be appreciated and these witnesseswill rely on a set of cultural and practical expectations when judging a space. Theadmittance of bright sunlight might be evaluated positively on a winter day in anatrium, cafeteria, and so on but less so at a VDT work space. Based on thisargument, the authors recommend using occupancy profiles as the time basisfor dynamic daylight performance metrics.
This time basis has the advantage that the resulting metrics are normalized: a“perfectly daylit” building that satisfies the daylighting requirement (defined
L E U K O S V O L 3 N O 1 J U L Y 2 0 0 6 P A G E S 7 – 3 1
15
under 3.3.3) throughout the occupied times of the year will score 100 percent. Incontrast, a zone occupied only outside of daylit hours will, rightfully, score 0percent. Also, as a counterpoint to the above argument for using all daylighthours, when a building function changes (that is, a warehouse becomes anapartment) many times apertures are added or removed as part of the retrofit.
A critical reader might object that - in terms of practicality - the task ofassigning occupancy patterns for various building zones might be onerous forthe design team and ambiguous if the performance metric is to be used in ratingschemes. A contra-argument is that typical occupant profiles are alreadyroutinely used in energy performance simulation and standards exist for a rangeof building zones and types (National Research Council Canada 1997).
3.3.3 DAYLIGHTING REQUIREMENTS
Once sensor locations and a time basis have been established, the next step isto choose a criteria that determines whether the daylight situation at a sensor is‘adequate’ at a particular point in time. Several criteria have been suggested inthe past:• Daylight Autonomy (DA), uses work plane illuminance as an indicator of
whether there is sufficient daylight in a space so that an occupant can work bydaylight alone. Required minimum illuminance levels for different space typescan be directly taken from reference documents such as the IESNA LightingHandbook (IESNA Lighting Handbook (9th Edition), 2000). The definition ofdaylight autonomy being ‘the percentage of the year when a minimumilluminance threshold is met by daylit alone’ goes at least as far back as 1989when it was mentioned in a Swiss norm (Association Suisse des Electriciens1989). According to that norm, the term is a function of daylight factor andminimum required illuminance level. In 2001 Reinhart and Walkenhorstredefined daylight autonomy at a sensor as the percentage of the occupiedtimes of the year when the minimum illuminance requirement at the sensor ismet by daylight alone (Reinhart and Walkenhorst 2001). In later publications,the concept of daylight autonomy was further refined by combining it with amanual blind control model that predicts the status of movable shadingdevices at all time steps in the year. The resulting concept of an ‘effective’daylight autonomy was applied to open plan and private offices (Reinhart2002; Reinhart and Andersen 2006).
• Useful Daylight Illuminances (UDI), proposed by Mardaljevic and Nabil in 2005,is a dynamic daylight performance measure that is also based on work planeilluminances (Nabil and Mardaljevic 2005; Nabil and Mardaljevic 2006). As itsname suggests, it aims to determine when daylight levels are ‘useful’ for theoccupant, that is, neither too dark (�100 lx) nor too bright (�2000 lx). Theupper threshold is meant to detect times when an oversupply of daylight mightlead to visual and/or thermal discomfort. The suggested range is founded onreported occupant preferences in daylit offices (Nabil and Mardaljevic 2005).Based on the upper and lower thresholds of 2000 lx and 100 lx, UDI results inthree metrics, that is, the percentages of the occupied times of the year whenthe UDI was achieved (100–2000 lx), fell-short (�100 lx), or was exceeded (�2000 lx). The last bin is meant to detect the likely appearance of glare.
• Continuous Daylight Autonomy (DAcon), recently proposed by Rogers, is an-other set of metrics that resulted from research on classrooms (Rogers Z,2006). In contrast to earlier definitions of daylight autonomy, partial credit isattributed to time steps when the daylight illuminance lies below the minimum
L E U K O S V O L 3 N O 1 J U L Y 2 0 0 6 P A G E S 7 – 3 1
16
illuminance level. For example, in the case where 500 lx are required and 400lx are provided by daylight at a given time step, a partial credit of 400 lx/500lx � 0.8 is given for that time step. The result is that instead of a hardthreshold the transition between compliance and noncompliance becomessoftened. This change to the metric can be justified by field studies thatindicate that illumination preferences vary between individuals (Jennings,Rubinstein, DiBartolomeo, and Blanc 1999; Reinhart and Voss 2003) and thatmany office occupants tend to work at lower daylight levels than the commonlyreferred 300 or 500 lx (Lindelof and Morel 2006; Reinhart and Voss 2003).Essentially, the metric acknowledges that even a partial contribution ofdaylight to illuminate a space is still beneficial.
To synchronously consider the likely appearance of glare, a second quantity,maximum Daylight Autonomy (DAmax), is reported together with DAcon toindicate the percentage of the occupied hours when direct sunlight or exceed-ingly high daylight conditions are present. Assuming that the threshold ofpotentially glary conditions depends on the space type, DAmax was defined tobe a sliding level equal to ten times the design illuminance of a space. E.g. fora computer lab with a design illuminance of 150 lx DAmax corresponds to 1500lx (Rogers 2006). This upper threshold criteria is essentially a measure of theoccurrence of direct sunlight or other potentially glary conditions and can givean indication of how often and where large illuminance contrasts appear in aspace.
• Annual Light Exposure is an already established performance indicator todesign spaces that contain light-sensitive artwork. It is defined as the cumu-lative amount of visible light incident on a point of interest over the course ofa year. Annual light exposure is measured in lux hours per year. TheInternational Commission on Illumination (CIE) Division 3 TC3.22 ‘Museumlighting and protection against radiation damage’ recommends annual lightexposures for various types of artwork ranging from stone and ceramics to silkand sensitive pigments (International Commission on Illumination (CIE) Divi-sion 3 TC-22, 2004). Dynamic daylight simulations have already been used toestablish that recommended annual light exposure levels in a museum aremet (Franks 2006). The time basis for this metric is ‘permanent occupancy’,that is, 24 hours a day, 365 days a year, as light sensitive materials are alwaysat risk of radiation damage.
3.3.4 SHADING DEVICES (STATIC AND MOVABLE)
According to a recent survey on the use of daylight simulations during buildingdesign, shading type and control were the most common design aspects influ-enced by a daylighting analysis (Reinhart and Fitz 2006). This is not surprisinggiven that the shading device choice decisively defines the amount of daylightavailable in a space.
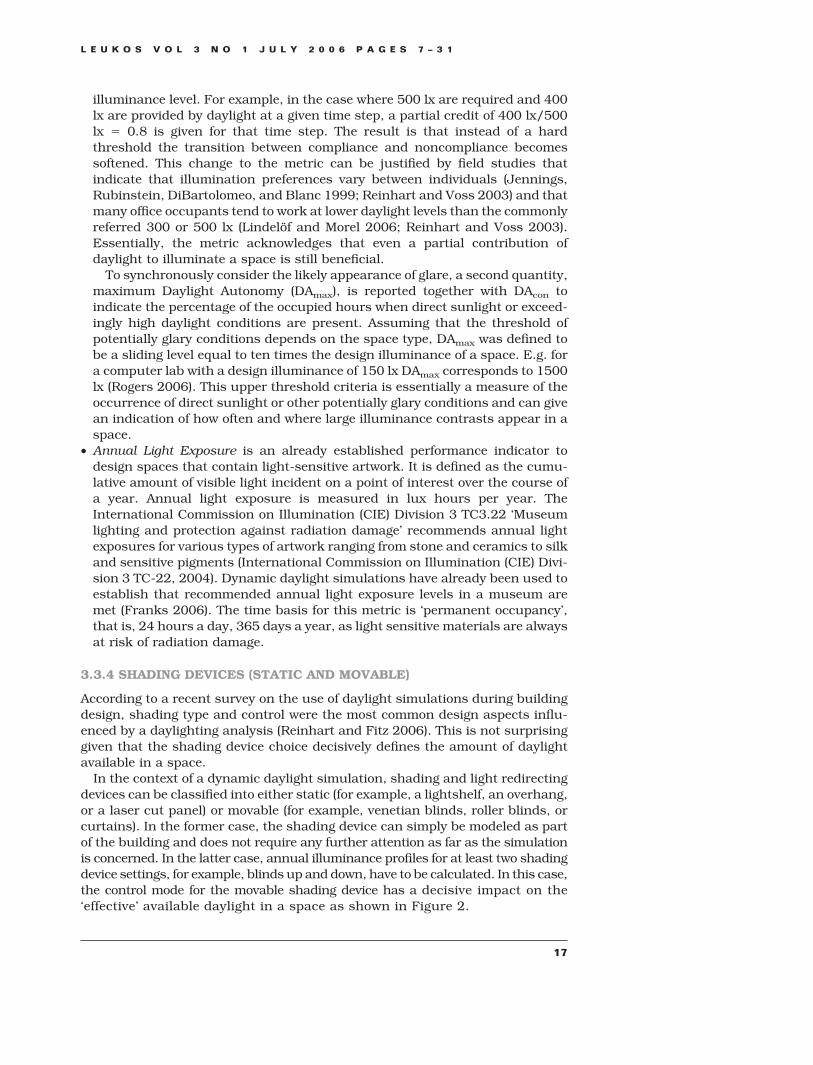
In the context of a dynamic daylight simulation, shading and light redirectingdevices can be classified into either static (for example, a lightshelf, an overhang,or a laser cut panel) or movable (for example, venetian blinds, roller blinds, orcurtains). In the former case, the shading device can simply be modeled as partof the building and does not require any further attention as far as the simulationis concerned. In the latter case, annual illuminance profiles for at least two shadingdevice settings, for example, blinds up and down, have to be calculated. In this case,the control mode for the movable shading device has a decisive impact on the‘effective’ available daylight in a space as shown in Figure 2.
L E U K O S V O L 3 N O 1 J U L Y 2 0 0 6 P A G E S 7 – 3 1
17
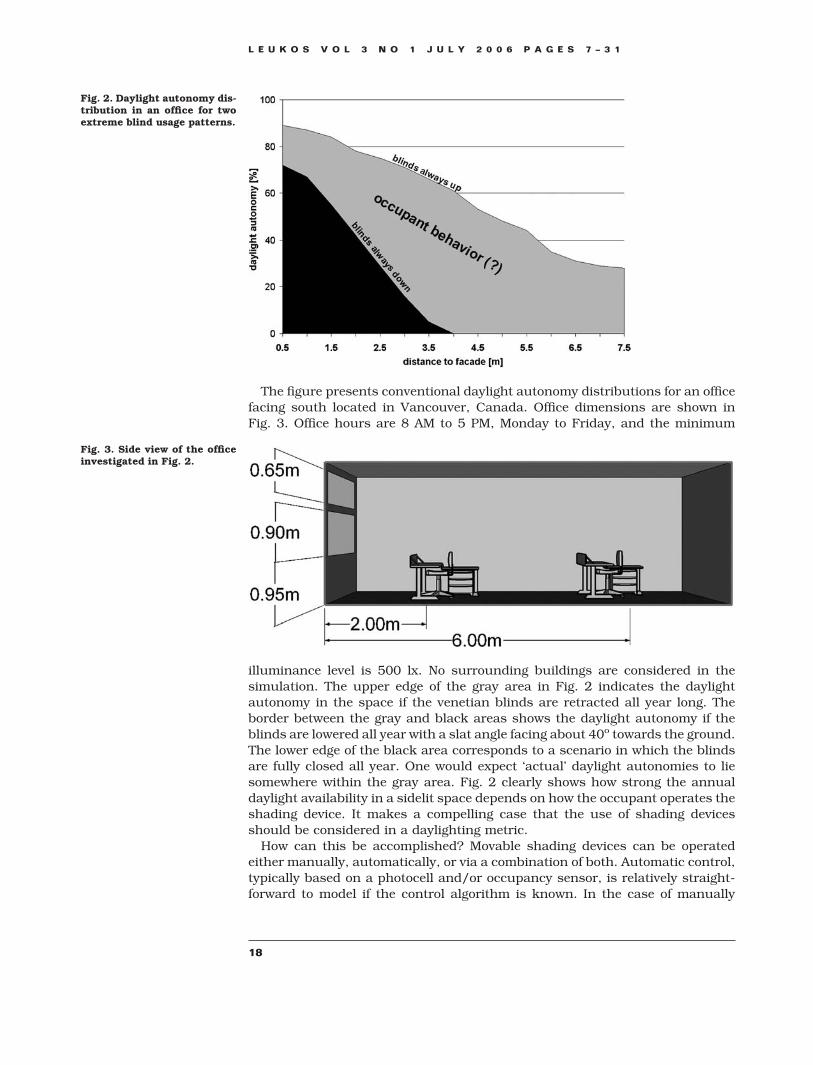
The figure presents conventional daylight autonomy distributions for an officefacing south located in Vancouver, Canada. Office dimensions are shown inFig. 3. Office hours are 8 AM to 5 PM, Monday to Friday, and the minimum
illuminance level is 500 lx. No surrounding buildings are considered in thesimulation. The upper edge of the gray area in Fig. 2 indicates the daylightautonomy in the space if the venetian blinds are retracted all year long. Theborder between the gray and black areas shows the daylight autonomy if theblinds are lowered all year with a slat angle facing about 40o towards the ground.The lower edge of the black area corresponds to a scenario in which the blindsare fully closed all year. One would expect ‘actual’ daylight autonomies to liesomewhere within the gray area. Fig. 2 clearly shows how strong the annualdaylight availability in a sidelit space depends on how the occupant operates theshading device. It makes a compelling case that the use of shading devicesshould be considered in a daylighting metric.
How can this be accomplished? Movable shading devices can be operatedeither manually, automatically, or via a combination of both. Automatic control,typically based on a photocell and/or occupancy sensor, is relatively straight-forward to model if the control algorithm is known. In the case of manually
Fig. 2. Daylight autonomy dis-tribution in an office for twoextreme blind usage patterns.
Fig. 3. Side view of the officeinvestigated in Fig. 2.
L E U K O S V O L 3 N O 1 J U L Y 2 0 0 6 P A G E S 7 – 3 1
18
operated blinds, the simulation has to mimic how an occupant might operate theblinds. The Lightswitch algorithm is an example ‘user behavior model’ that isexclusively based on field data (Reinhart 2004). To use the model, each movableshading device has to be associated with one or several work plane sensors thatcharacterize the area where the individual(s) controlling the shading device is(are) usually located. The illuminances at these work plane sensors control thesetting of the shading device. Lightswitch recognizes two distinct types ofoccupant behavior. For an active user, the blinds are opened once in themorning upon arrival and closed if the space is occupied and direct sunlightabove 50Wm-2 is incident on any of the work plane sensors. For a passive userthe blinds remain lowered throughout the year. The resulting daylight autonomyfor a passive user is the transition between the gray and the black area in Fig. 2.The use of a user behavior model allows the meaningful comparison of daylight-ing strategies involving manually controlled venetian blinds – arguably the mostcommon shading device currently used in North America and Europe – and moreadvanced daylighting strategies involving static and dynamic shading devices.
3.3.5 SPATIAL CONSIDERATIONS
Introducing movable shading devices effectively couples all sensors in a lightingzone together. While only the work plane sensors or the photocell determine thestatus of the venetian blinds at any given point in time, all other sensors in thelighting zone are affected by the resulting shading device setting. For example, inthe deep plan, sidelit office in Fig. 3, the occupant near the window drives thesetting of the blinds, which may lead at times to less daylight than desirable forthe occupant sitting further back in the room.
In cases where a space features several independently operated movableshading devices, the number of combinations of different shading devicessettings rises exponentially. At the same time, the dynamics between differentusers within such a space becomes increasingly complicated. Such a situationcannot be addressed by the current generation of user behavior models.
3.3.6 IDENTIFYING A SINGLE METRIC FOR A SPACE
Once a dynamic daylight performance metric has been calculated for multiplesensor points in a space, the result can be presented through graphicalrepresentations such as contour plots and falsecolor maps. Such graphicalpresentations are valuable by themselves because they present how daylight isdistributed throughout a space. Yet, for a rating system it is often more desirableto come up with single metric for a space. For dynamic performance metrics,different overall rating procedures have been proposed in the past.
One approach is to concentrate on work plane sensors assuming that themetric near the workplace is most relevant. In Fig. 2, this would be the sensorson the center axis at 2 m and 6 m from the facade. This is the approach that hasbeen used for the daylight autonomy calculations (Reinhart 2002).
In order to capture the interconnection between different sensors in a lightingzone, Mardaljevic recommended to group all work plane sensors together andconsider daylight only “useful” if all work place sensors synchronously lie in therecommended 100 lx to 2000 lx range (Nabil and Mardaljevic 2005).
Rogers proposed to report the area percentage of a workplane with a contin-uous daylight autonomy (DAcon) level above either 40 percent, 60 percent or 80percent. To avoid overly daylit conditions or conditions of too much direct
L E U K O S V O L 3 N O 1 J U L Y 2 0 0 6 P A G E S 7 – 3 1
19
sunlight, Rogers also reported the area percentage of a workplane in whichDAmax, the maximum accepted illuminance, was exceeded for more than 5percent of the time.
4 EXAMPLE APPLICATIONS
This section presents a series of example applications of the previously dis-cussed static and dynamic metrics in a two-person office. The intent of thissection is to demonstrate how the results of a daylighting analysis differdepending on the daylight performance metric used.
The reference geometry corresponds to the deep plan office in Fig. 3 (4m high,4m wide, and 8m deep). The material properties of individual surfaces are shownin Table 3. By default, the office is located in Boulder, Colorado, USA (40o N, 105o
W), faces South, and is used as a regular office space with a design illuminanceof 400 lx and occupancy Monday through Friday from 8AM to 5PM.
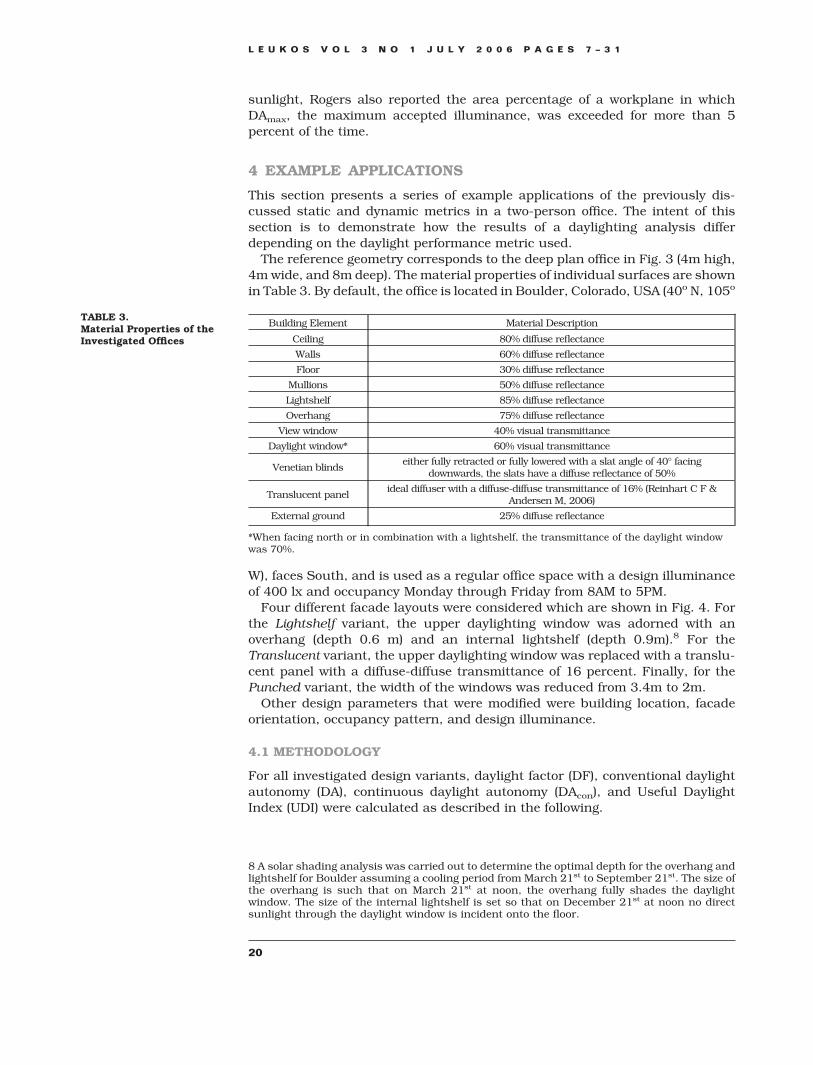
Four different facade layouts were considered which are shown in Fig. 4. Forthe Lightshelf variant, the upper daylighting window was adorned with anoverhang (depth 0.6 m) and an internal lightshelf (depth 0.9m).8 For theTranslucent variant, the upper daylighting window was replaced with a translu-cent panel with a diffuse-diffuse transmittance of 16 percent. Finally, for thePunched variant, the width of the windows was reduced from 3.4m to 2m.
Other design parameters that were modified were building location, facadeorientation, occupancy pattern, and design illuminance.
4.1 METHODOLOGY
For all investigated design variants, daylight factor (DF), conventional daylightautonomy (DA), continuous daylight autonomy (DAcon), and Useful DaylightIndex (UDI) were calculated as described in the following.
8 A solar shading analysis was carried out to determine the optimal depth for the overhang andlightshelf for Boulder assuming a cooling period from March 21st to September 21st. The size ofthe overhang is such that on March 21st at noon, the overhang fully shades the daylightwindow. The size of the internal lightshelf is set so that on December 21st at noon no directsunlight through the daylight window is incident onto the floor.
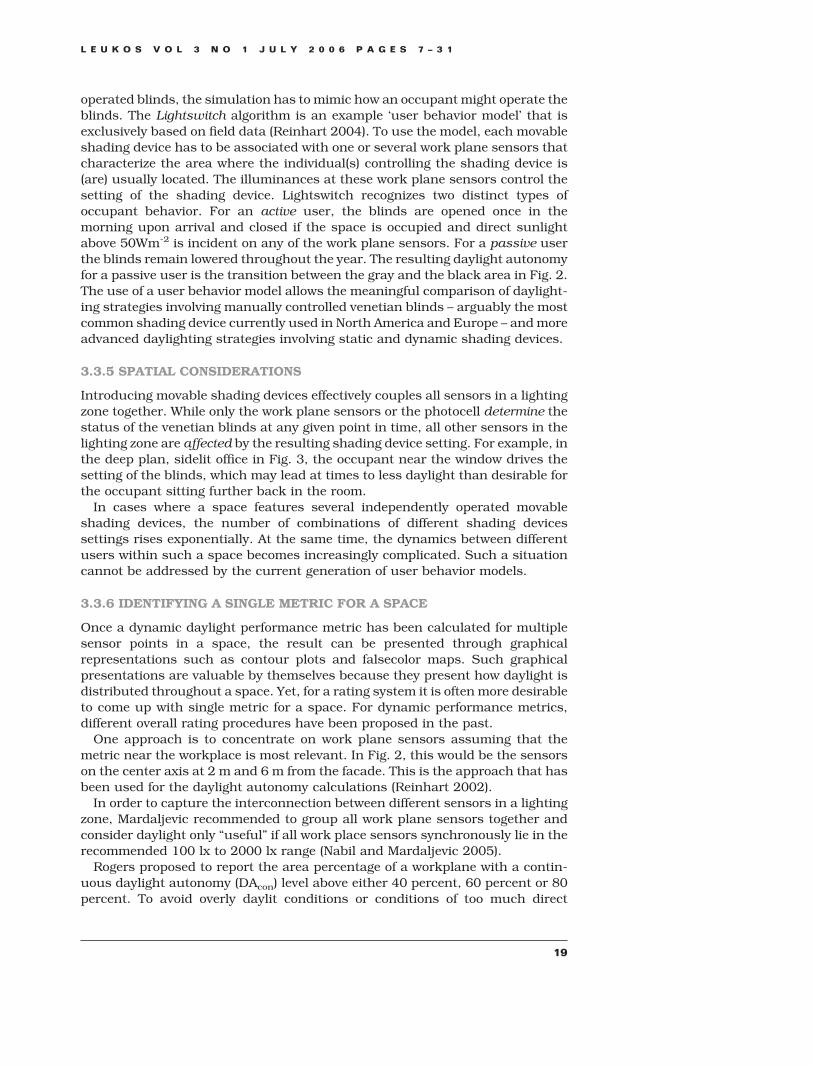
TABLE 3.Material Properties of theInvestigated Offices
Building Element Material Description
Ceiling 80% diffuse reflectance
Walls 60% diffuse reflectance
Floor 30% diffuse reflectance
Mullions 50% diffuse reflectance
Lightshelf 85% diffuse reflectance
Overhang 75% diffuse reflectance
View window 40% visual transmittance
Daylight window* 60% visual transmittance
Venetian blindseither fully retracted or fully lowered with a slat angle of 40° facing
downwards, the slats have a diffuse reflectance of 50%
Translucent panelideal diffuser with a diffuse-diffuse transmittance of 16% (Reinhart C F &
Andersen M, 2006)
External ground 25% diffuse reflectance
*When facing north or in combination with a lightshelf, the transmittance of the daylight windowwas 70%.
L E U K O S V O L 3 N O 1 J U L Y 2 0 0 6 P A G E S 7 – 3 1
20
For all performance metrics, the same annual illuminance profiles were usedbased on Daysim calculations. The simulation time step was one hour. Nonde-fault Radiance simulation parameters are listed in Table 4. Venetian blinds were
operated in either one of three modes: Active or passive user (see section 3.3.4)or automated. In automated mode, the blinds remained closed only when directsunlight was incident on either of the two seating positions. The mode corre-sponds to an idealized automated control and is supposed to indicate if and byhow much the daylight performance for an automated control changes com-pared to the two manual controls.
Daylight factors and conventional daylight autonomies were calculated on thecenter line at distances of 2 m and 6 m from the facade. These sensorscorrespond to the seating positions of the two occupants in the front and theback of the office (Fig. 3). Continuous daylight autonomy calculations werebased on a 0.5 � 0.5 m grid that extended across the whole office. Usefuldaylight index calculations were based on the same grid but reported separatelyfor the front and the back half of the space, that is, UDI100–2000 was only met ifall sensors in the front or back half lay between 100 lx and 2000 lx.
4.2 SIMULATION RESULTS
4.2.1 FACADE LAYOUT
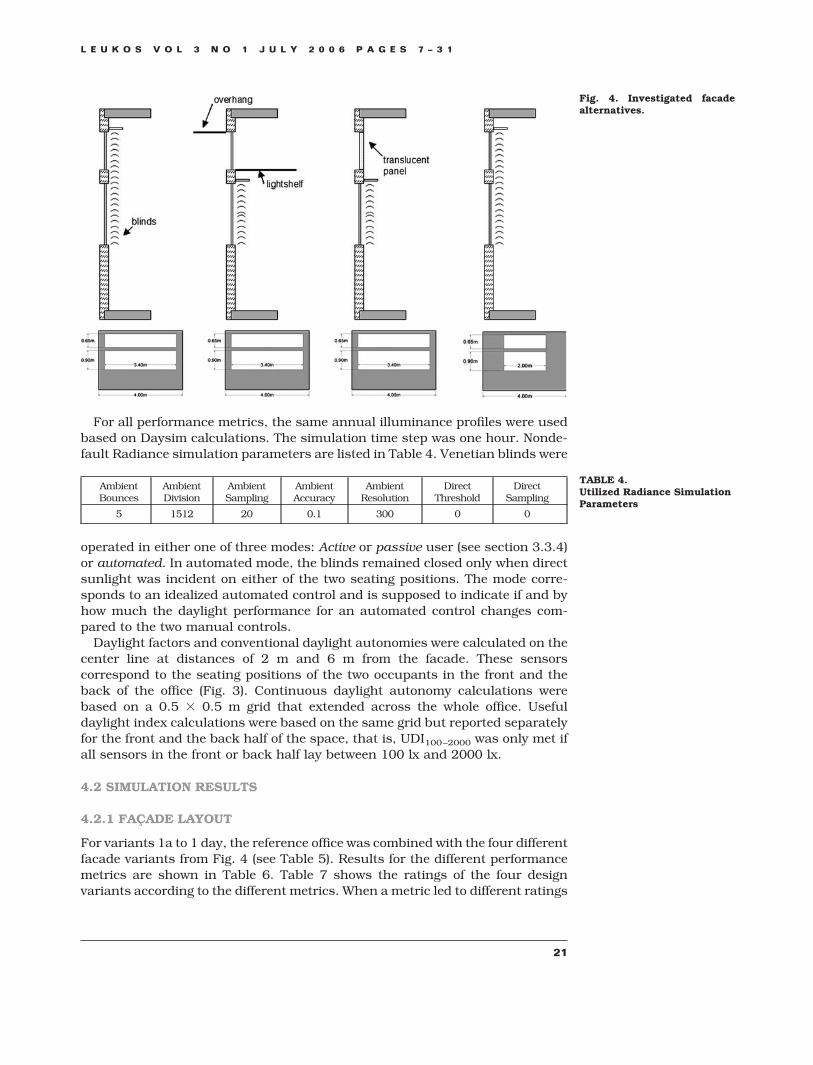
For variants 1a to 1 day, the reference office was combined with the four differentfacade variants from Fig. 4 (see Table 5). Results for the different performancemetrics are shown in Table 6. Table 7 shows the ratings of the four designvariants according to the different metrics. When a metric led to different ratings
Fig. 4. Investigated facadealternatives.
TABLE 4.Utilized Radiance SimulationParameters
AmbientBounces
AmbientDivision
AmbientSampling
AmbientAccuracy
AmbientResolution
DirectThreshold
DirectSampling
5 1512 20 0.1 300 0 0
L E U K O S V O L 3 N O 1 J U L Y 2 0 0 6 P A G E S 7 – 3 1
21
for the front and the back of the space, the mean results for both work placeswere compared. Specifically, UDI100–2000 yielded higher levels for the front workplace for Reference than for Lightshelf and vice versa for the back work place.Using the mean for both results, (52 percent � 40 percent)/2 and (46 per-cent�80 percent)/2 yields a score of 46 percent for Reference and 63 percent forLightshelf.
As one would expect, the results differ for the different performance metrics.Punched Window scored considerably lower than the other three facades in allfour metrics, indicating that the illuminance level reached through the narrowwindow are insufficient, particularly in the back of the office.
According to the daylight factor metric, Reference is superior to the three othervariants followed by Lightshelf and Translucent. The three dynamic metrics allrate Lightshelf and Translucent above Reference. DF does not take blind use intoaccount which explains why the facade with the largest glazing area receives thehighest rating. All three dynamic metrics consider blinds. The “% of time whenthe blinds are down” indicate that for Lightshelf and Translucent, the blinds arelowered 45 percent of the working year whereas they are closed for 54 percent or53 percent of the working year for Reference or Punched. The reason why theblinds are closed more regularly for Reference than for Lightshelf and Translu-cent is that direct sun through the upper daylight window is never blocked or
TABLE 5.Description of Variants 1a to1d
Variant Climate Facade Or. Shade Control Space Use
1a Boulder, CO Reference SouthManual (active
user)typical office
1b Boulder, CO Lightshelf SouthManual (active
user)typical office
1c Boulder, CO Translucent SouthManual (active
user)typical office
1d Boulder, COPunchedWindows
SouthManual (active
user)typical office
TABLE 6.Simulation Results forVariants 1a to 1d
Variant 1a 1b 1c 1d
Facade Reference Lightshelf Translucent Punched
% of Time When the Blinds areDown
54% 45% 45% 53%
Work Place (front/back) f b f b f b f b
Daylight Factor (DF) 3.5% 0.6% 1.9% 0.4% 2.2% 0.4% 1.3% 0.2%
Daylight Autonomy (DA) 76% 1% 90% 10% 86% 0% 29% 0%
Continuous DA (DAcon)
�40% 71% 100% 76% 38%
�60% 52% 73% 60% 20%
�80% 34% 54% 41% 8%
Maximum DA (DAmax) �5% 6% 8% 5% 0%
UDI�100 16% 60% 6% 20% 9% 42% 65% 97%
UDI100–2000 52% 40% 46% 80% 47% 58% 13% 3%
UDI�2000 32% 0% 48% 0% 44% 0% 22% 0%
TABLE 7.Rating of Variants 1a to 1dBased on Table 6
Metric 1st Place 2nd Place 3rd Place 4th Place
Daylight Factor Reference Translucent Lightshelf Punched Window
DA Lightshelf Translucent Reference Punched Window
DAcon Lightshelf Translucent Reference Punched Window
UDI Lightshelf Translucent Reference Punched Window
L E U K O S V O L 3 N O 1 J U L Y 2 0 0 6 P A G E S 7 – 3 1
22
redirected. One might expect the blinds to be open more often for Punched sincethe window is smaller. The reason for the high closing rate of 53 percent forPunched is that the front work place, located centrally behind the window, is noteffectively shielded from direct sunlight unless the blinds are drawn.
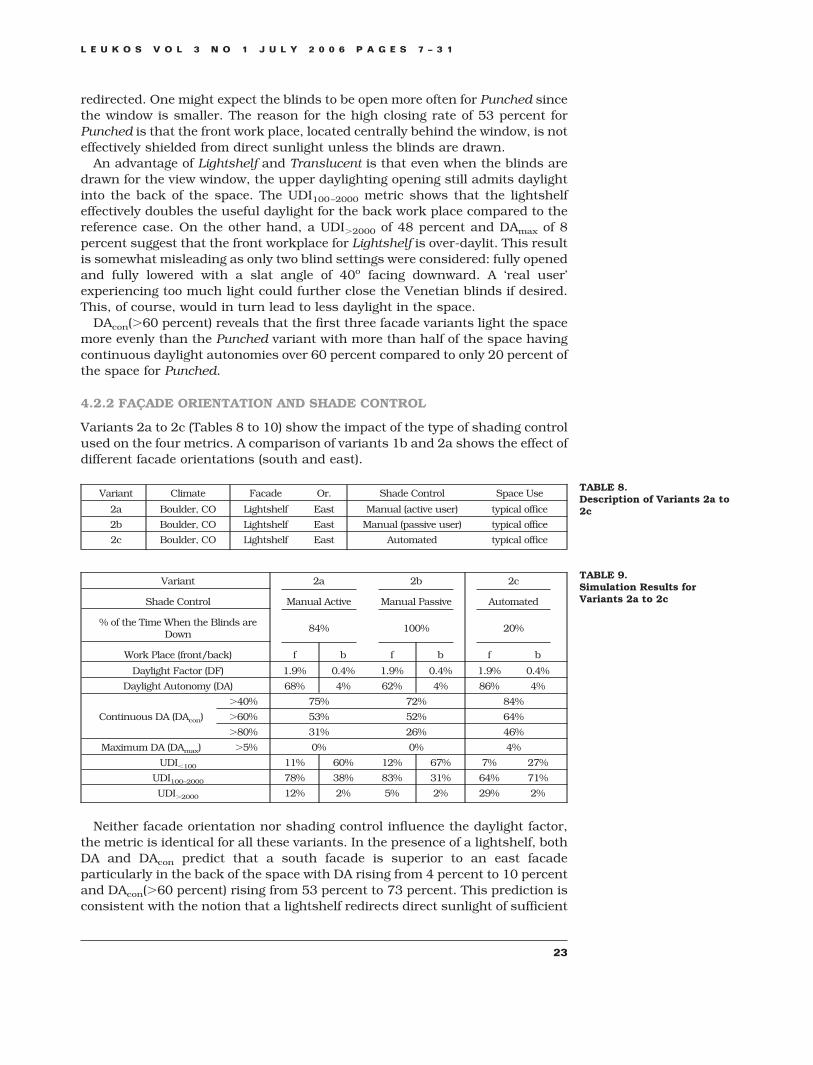
An advantage of Lightshelf and Translucent is that even when the blinds aredrawn for the view window, the upper daylighting opening still admits daylightinto the back of the space. The UDI100–2000 metric shows that the lightshelfeffectively doubles the useful daylight for the back work place compared to thereference case. On the other hand, a UDI�2000 of 48 percent and DAmax of 8percent suggest that the front workplace for Lightshelf is over-daylit. This resultis somewhat misleading as only two blind settings were considered: fully openedand fully lowered with a slat angle of 40o facing downward. A ‘real user’experiencing too much light could further close the Venetian blinds if desired.This, of course, would in turn lead to less daylight in the space.
DAcon(�60 percent) reveals that the first three facade variants light the spacemore evenly than the Punched variant with more than half of the space havingcontinuous daylight autonomies over 60 percent compared to only 20 percent ofthe space for Punched.
4.2.2 FACADE ORIENTATION AND SHADE CONTROL
Variants 2a to 2c (Tables 8 to 10) show the impact of the type of shading controlused on the four metrics. A comparison of variants 1b and 2a shows the effect ofdifferent facade orientations (south and east).
Neither facade orientation nor shading control influence the daylight factor,the metric is identical for all these variants. In the presence of a lightshelf, bothDA and DAcon predict that a south facade is superior to an east facadeparticularly in the back of the space with DA rising from 4 percent to 10 percentand DAcon(�60 percent) rising from 53 percent to 73 percent. This prediction isconsistent with the notion that a lightshelf redirects direct sunlight of sufficient
TABLE 8.Description of Variants 2a to2c
Variant Climate Facade Or. Shade Control Space Use
2a Boulder, CO Lightshelf East Manual (active user) typical office
2b Boulder, CO Lightshelf East Manual (passive user) typical office
2c Boulder, CO Lightshelf East Automated typical office
TABLE 9.Simulation Results forVariants 2a to 2c
Variant 2a 2b 2c
Shade Control Manual Active Manual Passive Automated
% of the Time When the Blinds areDown
84% 100% 20%
Work Place (front/back) f b f b f b
Daylight Factor (DF) 1.9% 0.4% 1.9% 0.4% 1.9% 0.4%
Daylight Autonomy (DA) 68% 4% 62% 4% 86% 4%
Continuous DA (DAcon)
�40% 75% 72% 84%
�60% 53% 52% 64%
�80% 31% 26% 46%
Maximum DA (DAmax) �5% 0% 0% 4%
UDI�100 11% 60% 12% 67% 7% 27%
UDI100–2000 78% 38% 83% 31% 64% 71%
UDI�2000 12% 2% 5% 2% 29% 2%
L E U K O S V O L 3 N O 1 J U L Y 2 0 0 6 P A G E S 7 – 3 1
23
altitude deeper into the space, resulting in a more uniform illumination9.UDI100–2000 also clearly favors the south-facing over the east-facing lightshelf forthe back work place. On the other hand, UDI�2000 falls from 48 percent to 12percent for the east-facing facade suggesting that it is less prone to glare. Again,this result is an artifact of the manual blind control model since the slats couldbe closed further. The results for the two facade orientations reveal both thechallenges as well as the potential benefits of a lightshelf.
The rating between the three shading control modes is easier to interpret usingall the dynamic metrics except DF which is identical for all three. Automated isalways rated highest followed by manual and passive. The difference between anactive and a passive user is small with blinds being lowered 84 percent or 100percent of the time, respectively, opposed to only 20 percent for automated. Thereason for this drastic discrepancy is introduced by the active blind controlmodel, as it only opens the blinds once a day in the morning and closes them assoon as direct sunlight is present. This places an inherent disadvantage on eastfacades compared to west facades, which only receive direct sunlight later in theday (Reinhart 2002). On the other hand, UDI�2000 raises a warning flag that 29percent of the time during the working year the illuminance level in the front ofthe room lies above 2000 lx. Thus, automated might at times fail to close theblinds when there may actually be too much daylight in the space.
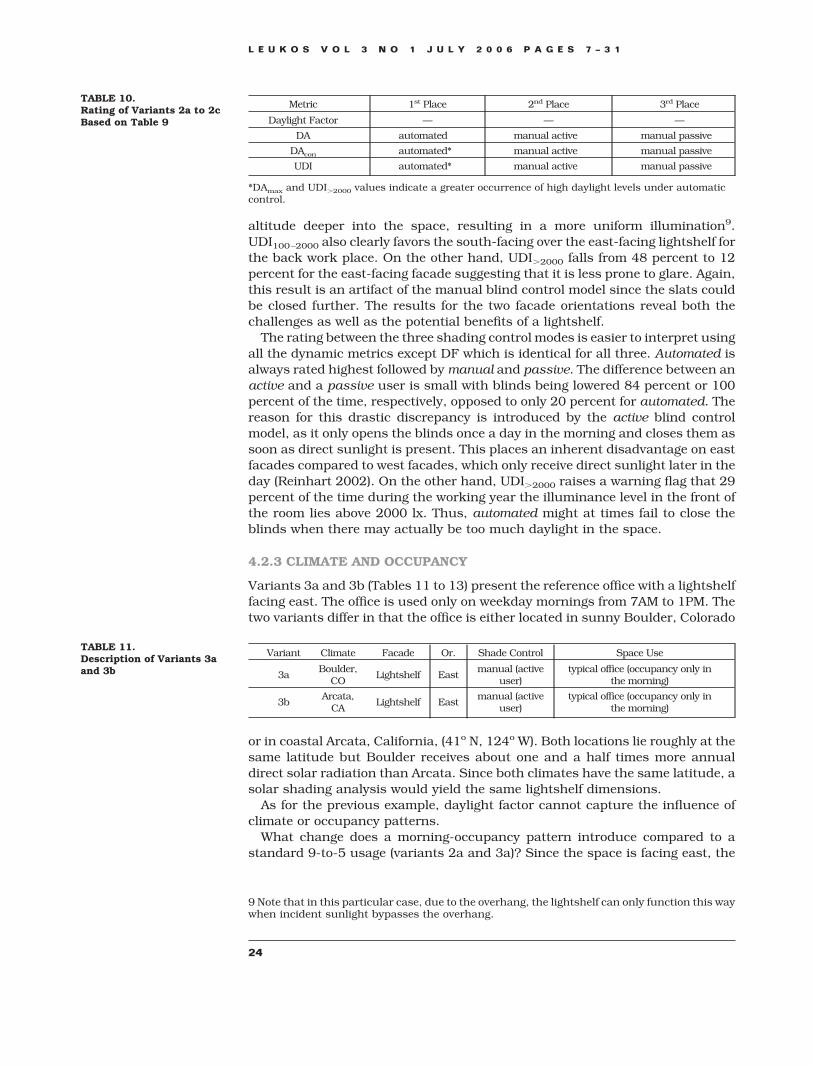
4.2.3 CLIMATE AND OCCUPANCY
Variants 3a and 3b (Tables 11 to 13) present the reference office with a lightshelffacing east. The office is used only on weekday mornings from 7AM to 1PM. Thetwo variants differ in that the office is either located in sunny Boulder, Colorado
or in coastal Arcata, California, (41o N, 124o W). Both locations lie roughly at thesame latitude but Boulder receives about one and a half times more annualdirect solar radiation than Arcata. Since both climates have the same latitude, asolar shading analysis would yield the same lightshelf dimensions.
As for the previous example, daylight factor cannot capture the influence ofclimate or occupancy patterns.
What change does a morning-occupancy pattern introduce compared to astandard 9-to-5 usage (variants 2a and 3a)? Since the space is facing east, the
9 Note that in this particular case, due to the overhang, the lightshelf can only function this waywhen incident sunlight bypasses the overhang.
TABLE 10.Rating of Variants 2a to 2cBased on Table 9
Metric 1st Place 2nd Place 3rd Place
Daylight Factor — — —
DA automated manual active manual passive
DAcon automated* manual active manual passive
UDI automated* manual active manual passive
*DAmax and UDI�2000 values indicate a greater occurrence of high daylight levels under automaticcontrol.
TABLE 11.Description of Variants 3aand 3b
Variant Climate Facade Or. Shade Control Space Use
3aBoulder,
COLightshelf East
manual (activeuser)
typical office (occupancy only inthe morning)
3bArcata,
CALightshelf East
manual (activeuser)
typical office (occupancy only inthe morning)
L E U K O S V O L 3 N O 1 J U L Y 2 0 0 6 P A G E S 7 – 3 1
24
morning-occupancy coincides with the times when most daylight is incident onthe facade. Accordingly, morning occupancy scores higher than all-day usage,demonstrating that basing a dynamic metric on the occupied hours of the year‘self-normalizes’ the metric.
Differences between the metrics for the two climates are small as two con-founding factors cancel each other: Boulder receives more direct solar radiationbut this results in the venetian blinds being closed 83 percent of the time inBoulder as opposed to 50 percent in Arcata. DA favors Boulder for the back workplace as the blinds are mostly reducing daylight levels near the facade whereasthe lightshelf redirects daylight into the back of the space. UDI�2000 warns that9 percent of the time this redirected daylight leads to an oversupply in the backof the room for Boulder. On the other hand, the UDI�2000 predicts that in Arcatathe front work place might be overly lit 30 percent of the time, a consequence ofthe blinds not being lowered as often as for Boulder. DAcon yields more or lessidentical results for both locations with a slight bias towards Boulder.
It is worthwhile to note that a far as ‘view to the outside’ is concerned, Arcatais far more desirable than Boulder as the blinds are only closed 50 percent of thetime in Arcata as opposed to 83 percent in Boulder. This shows that performancemetrics for view and daylight availability can lead to conflicting results.
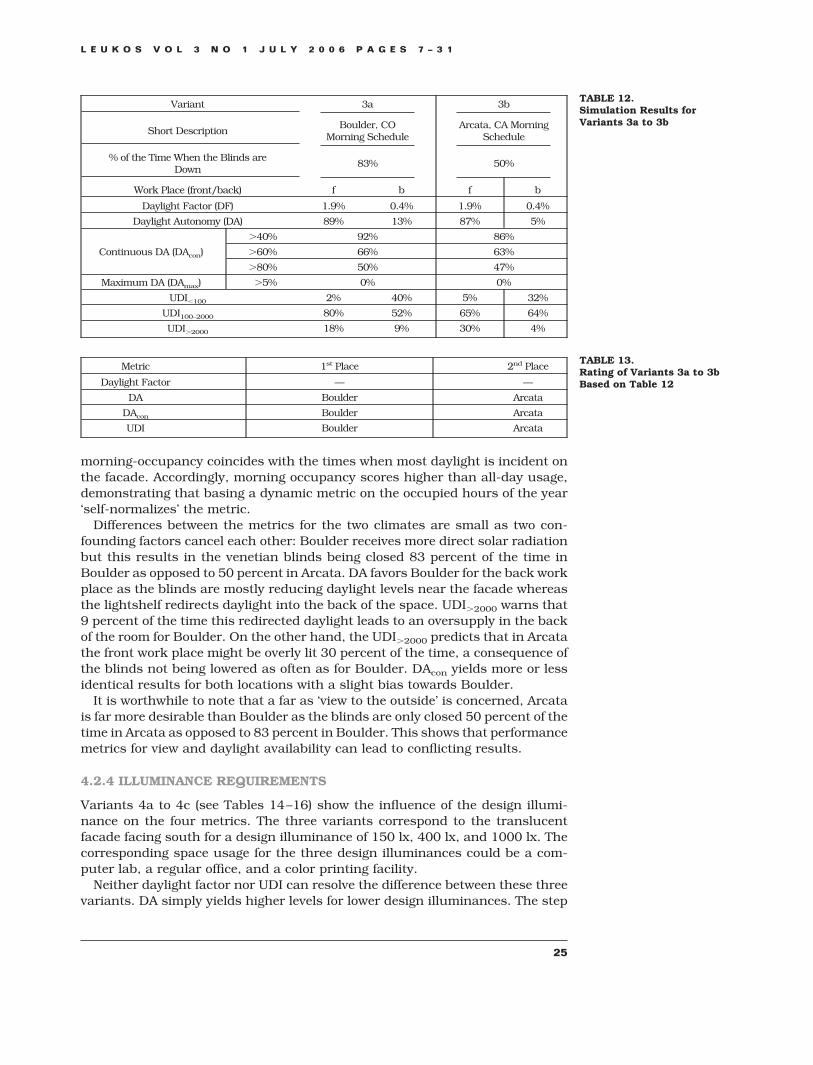
4.2.4 ILLUMINANCE REQUIREMENTS
Variants 4a to 4c (see Tables 14–16) show the influence of the design illumi-nance on the four metrics. The three variants correspond to the translucentfacade facing south for a design illuminance of 150 lx, 400 lx, and 1000 lx. Thecorresponding space usage for the three design illuminances could be a com-puter lab, a regular office, and a color printing facility.
Neither daylight factor nor UDI can resolve the difference between these threevariants. DA simply yields higher levels for lower design illuminances. The step
TABLE 12.Simulation Results forVariants 3a to 3b
Variant 3a 3b
Short DescriptionBoulder, CO
Morning ScheduleArcata, CA Morning
Schedule
% of the Time When the Blinds areDown
83% 50%
Work Place (front/back) f b f b
Daylight Factor (DF) 1.9% 0.4% 1.9% 0.4%
Daylight Autonomy (DA) 89% 13% 87% 5%
Continuous DA (DAcon)
�40% 92% 86%
�60% 66% 63%
�80% 50% 47%
Maximum DA (DAmax) �5% 0% 0%
UDI�100 2% 40% 5% 32%
UDI100–2000 80% 52% 65% 64%
UDI�2000 18% 9% 30% 4%
TABLE 13.Rating of Variants 3a to 3bBased on Table 12
Metric 1st Place 2nd Place
Daylight Factor — —
DA Boulder Arcata
DAcon Boulder Arcata
UDI Boulder Arcata
L E U K O S V O L 3 N O 1 J U L Y 2 0 0 6 P A G E S 7 – 3 1
25
from 400 lx to 150 lx is significant (0 percent to 53 percent for the back),revealing that the illuminances in the back usually lie between 150 lx and 400lx. DAcon(�60 percent) saturates for 150 lx indicating that the required illumi-nances are met throughout the space for at least 60 percent of the time. On theother hand, DAmax raises a warning flag that for the 150 lx variant nearly aquarter of the space is subject to more than 1500 lx, that is, the illuminanceuniformity of the space is poor.
5 DISCUSSION AND CONCLUSION
5.1 STATIC AND DYNAMIC METRICS
The information presented throughout this document suggest that illuminance-based dynamic performance metrics such as daylight autonomy, continuousdaylight autonomy, and useful daylight index have become ‘viable’ alternativesto the daylight factor metric. Arguments in their favor are:(a) The underlying physical simulation models have been rigorously validated
for a range of building materials and geometries.(b) A number of design tools exist that make the required simulation capabilities
accessible to nonsimulation-experts.(c) The extra effort required on behalf of the simulationist to calculate a dynamic
metric as opposed to the daylight factor is small and the additional inputs
TABLE 14.Description of Variants 4aand 4c
Variant Climate Facade Or. Shade Control Space Use
4aBoulder,
COTranslucent South
Manual (activeuser)
typical office (computer work, min ill.150lux)
4bBoulder,
COTranslucent South
Manual (activeuser)
typical office
4cBoulder,
COTranslucent South
Manual (activeuser)
typical office (drafting room, min ill.1000lux)
TABLE 15.Simulation Results forVariants 4a and 4c
Variant 4a 4b 4c
Design Illuminance 150 lux 400 lux 1000 lux
% of the Time When the Blinds areDown
45% 45% 45%
Work Place (front/back) f b f b f b
Daylight Factor (DF) 2.2% 0.4% 2.2% 0.4% 2.2% 0.4%
Daylight Autonomy (DA) 97% 53% 86% 0% 42% 0%
Continuous DA (DAcon)
�40% 100% 73% 43%
�60% 100% 60% 31%
�80% 77% 41% 18%
Maximum DA (DAmax) �5% 24% 5% 0%
UDI�100 9% 42% 9% 42% 9% 42%
UDI100–2000 47% 58% 47% 58% 47% 58%
UDI�2000 44% 0% 44% 0% 44% 0%
TABLE 16.Rating of Variants 4a to 4cBased on Table 14
Metric 1st Place 2nd Place 3rd Place
Daylight Factor — — —
DA 150 lux 400 lux 1000 lux
DAcon 400 lux 150 lux 1000 lux
UDI — — —
L E U K O S V O L 3 N O 1 J U L Y 2 0 0 6 P A G E S 7 – 3 1
26
required (climate data, occupancy patterns, space usage) are readily avail-able.
(d) The predictive power of these metrics for design comparisons is larger thanfor the daylight factor.
The last argument is crucial and requires further qualification. The examplesin section 4 yielded that design recommendations based on the daylight factoreither contradicted the recommendations of the dynamic metrics or that thedaylight factor could not resolve the difference between the variants. Justbecause the dynamic metrics contradicted the daylight factor rating does notnecessarily mean that they are ‘right’. One should rather revisit the four facadesfrom Fig. 4 and try to understand the origin between these differences. Thereference facade (favored by the daylight factor) admits the most daylight into theadjacent space. But, the blind control model predicts that the venetian blinds,which extend over the view and daylight windows, will be lowered 54 percent ofthe year. This will seriously reduce the amount daylight available within thespace. For the Lightshelf and Translucent variants, the venetian blinds onlycovered the view window and the blind model predicted that they will be closedfor 45 percent of the year. As a result, one would expect more daylight to beavailable for these variants especially in the back of the space. The betterperformance that the dynamic metrics attest to Lightshelf and Translucent istherefore supported by design intuition. The fact that the daylight factor fails tocompare all other design variants in section 4 reiterates its limitations as adesign metric.
The three dynamic metrics all have their merits and shortcomings. Daylightautonomy only relies on task-specific minimum illuminance levels which havethe advantage of already being well established for different space types (IESNALighting Handbook (9th Edition), 2000). Combined with a manual blind controlmodel, daylight autonomy can be used to directly compare the performance ofmovable and static shading devices.
Useful Daylight Illuminances require upper and lower thresholds which firsthave to be established for different building zones, requiring further research(see below). On the other hand, UDI provides an effective mechanism to flag thezone in a building in which a shading device is needed which makes it attractivefor initial design investigations that concentrate on the daylighting/shadingperformance of the fixed building form. Recently it has been suggested that theUDI scheme could be enhanced by partitioning the UDI100–2000 range into100–500 lx and 500-2000 lx bins (Mardaljevic 2006). These bins have beenprovisionally called UDIsupplementary and UDIautonomous for the lower and upperranges, respectively. That is, supplementary electric lighting might be needed fordaylight illuminances in the lower range, whereas daylight alone is sufficientwhen levels are in the higher range (Mardaljevic 2006).
Continuous daylight autonomy and DAmax combine elements of both earliermetrics. DAcon retains the concept of space–specific design illuminances butintroduces partial credit for daylight contributions that lie below the designilluminance. This softens the transition between compliance and noncompli-ance, and acknowledges that ‘some’ daylight is preferable to ‘no’ daylight. Thesliding upper threshold of ten times the design illuminance incorporates aspectsof glare prevention and may detect the frequent appearance of high illuminancecontrasts within a space. The custom of reporting the percentage of space areawith daylight autonomies that lie above a minimum threshold resembles theLEED daylight factor criteria. A remaining weakness of the DAmax concept is that
L E U K O S V O L 3 N O 1 J U L Y 2 0 0 6 P A G E S 7 – 3 1
27
the constant factor of ten times the design illuminance is based on intuitionrather than documented research.
The next obvious question for a practitioner is: ‘which metric should I use?’Since all metrics can be automatically reported side-by-side, it seems advisableto consider them all (and others that may be developed) synchronously until aset criteria has been established as outlined in the following.
5.2 THE NEED FOR BENCHMARKS
Following the arguments presented in section 5.1, the reader may jump to theconclusion that dynamic daylight performance metrics are ready to be intro-duced into green building rating systems to act as alternative compliance pathsto daylight factor-based criteria. In the authors’ opinion, one step is still missingbefore this should be done. As demonstrated in section 4, dynamic performancemetrics can already be successfully used for comparative studies betweendifferent design variants. What is missing are absolute benchmark levels, whichestablish pass/ fail criteria for dynamic performance metrics. Rather thanfollowing the LEED daylight factor approach of assigning a 2 percent minimumlevel in an ad hoc fashion, the authors advocate a more scientifically basedapproach. For example, selected dynamic metrics could be ‘calibrated’ against aseries of building examples or case studies. The daylighting ‘quality’ of thesecase studies would have to be independently established beforehand throughevaluations by building occupants and daylighting design experts. Being asubstantial research undertaking in itself, this approach holds the promise ofdelivering a more effective benchmark in the long run. A suitable venue for this‘calibration’ exercise may be a new subcommittee on ‘daylighting metrics’ thathas recently been commissioned by the Illuminating Engineering Society ofNorth America (IESNA).
5.3 MODELING MANUAL BLIND CONTROL
Modeling manual blind control is notoriously difficult. Nevertheless, it is animportant aspect of a dynamic metric since venetian blinds are the mostcommon shading device type found in commercial and residential spacesthroughout North America and Europe. Blinds are very effective at reducingglare but they also reduce the daylight available indoors. The current generationof field-study-based blind models tend to overestimate the use of blinds, becausethe ‘triggers’ that prompt an occupant to close the blinds have been clearlyidentified whereas the ones to open them have not. Another remaining modeluncertainty is how slat angles are set when the blinds are closed. While fullyacknowledging these limitations of current models, the authors recommendtheir use over not taking blinds into account at all. Also, a conservative estimateis generally better than an overestimate that cannot be met in reality.
Manual blind control is also important when assessing view to the outside fordifferent design variants. If the venetian blinds for one variant are a lot moreoften closed than for a competing option, the building occupants for the formeroption will routinely end up with less or no view. This argument suggests thatthe view credit in LEED should be combined with an estimate of the percentageof occupied hours per year when the view might actually be available. In practicethis would provide no additional simulation work for the design team if thedaylight factor credit were also to be replaced with a dynamic performancemetric.
L E U K O S V O L 3 N O 1 J U L Y 2 0 0 6 P A G E S 7 – 3 1
28
5.4 CONCLUSION
While this paper focused on dynamic performance metrics and their ability tocapture the ‘architectural’ dimension of daylighting, we do not suggest that thesemetrics can predict holistic ‘good’ daylighting. Nor do we place any valuejudgment on the architectural definition of daylighting over the other definitionsin Table 1. A well daylit space should host a stimulating interplay of light andbuilding form that satisfies occupant needs by keeping them comfortable. At thesame time, overall electric lighting loads should be low and solar gains con-trolled. As mentioned earlier in this document, these qualities reveal themselvesas energy savings in whole-building energy efficiency metrics. In the long run, allof these requirements should lead to a set of daylight performance metrics thateach describe different aspects of daylighting design and that all have to be metsynchronously for a space to receive an overall ‘good’ rating for daylight.
Finally, a metrics-based approach to daylighting design is intrinsically limited.The ultimate success of a daylit space, the ‘sparkle’ that makes it a pleasure forthe eye and speaks to the soul, makes daylighting an art as much as a science.For aspects that can be addressed by metrics, this paper presented alternativesto the daylight factor, and it is the authors’ hope that it will contribute to theongoing discussion of where daylighting design practice should go in the future.
ACKNOWLEDGMENTS
This paper is the result of many discussions the authors had with eminentexperts in the field. We would like to particularly thank Derrick Kendrick forsharing his insight in the historical development of the daylight factor method aswell as Lisa Heshong, Joel Loveland, Steve Selkowitz, and other members of the‘Daylight Working Group’. Finally, we acknowledge the financial support for thewriting of this paper provided by the National Research Council Canada andKalwall Corporation.
REFERENCES
[ASHRAE/IESNA] American Society of Heating, Refrigerating and Air-Conditioning Engineers/Illuminating Engineering Society of North America]. ASHRAE/IESNA 90.1 2004. Standard -2004 - Energy Standard for Buildings Except Low-Rise Residential Buildings.
Association Suisse des Electriciens. 1989. Eclairage interieur par la lumicre du jour.Association Suisse Des Electriciens, Swiss Norm SN 418911, Zurich.
Bodart M, Deneyer A, De Herde A, Wouters P. 2006. Design of a new single patch sky andsun simulator. Lighting Research and Technology, 38(1):73–89.
Canadian Green Building Council. 2004. LEED-Canada NC version 1.0, Reference Guide.
Canadian Government. 1991. Canadian Labor Code, Part II: Occupational Safety & Health.Butterworths.
[CIE] Commission International de l’Eclairage. Division 3 TC-22. 2004. Control of Damage toMuseum Objects by Optical Radiation, Publication CIE 157. ISBN 3 901 906 27 4. CIE,Vienna. 35 p.
Crawley DB, Hand JW, Lawrie LK. 1999. Improving the Weather Information Available toSimulation Programs. Sixth International IBPSA Conference (BS ’99) Kyoto, Japan, II, 529–536.
Farley K M J. 2001. A room with a view: A Review of the effects of windows on work andwell-being. Research Report National Research Council Canada, IRC-RR-136. August 2001.pp 1–33.
L E U K O S V O L 3 N O 1 J U L Y 2 0 0 6 P A G E S 7 – 3 1
29
Franks M. Daylighting in Museums; www.radiance-online.org/radiance-workshop4/cd/website/PDF/Franks ArupCaseStudies.pdf. Last accessed Jan 2006.
Hattrup MP. 1990. Daylighting Practices of the Architectural Industry. Prepared for the USDepartment of Energy by Pacific Northwest National Laboratory (Contract DE-AC06–76RLO1830), Richmond, Washington.
Inoue T, Kawase T, Ibamoto T, Takakusa S, Matsuo Y. 1988. The development of an optimalcontrol system for window shading devices based on investigations in office buildings.ASHRAE Transactions, 104:1034–1049.
Jennings J, Rubinstein F, DiBartolomeo D, Blanc S. 1999. Comparison of Control Options inPrivate Offices in an Advanced Lighting Control Testbed. Proceedings of the IESNA 1999Annual Conference, New Orleans, LA. August 10–12.
Kendrick JD, Skinner S. 1980. Dynamic Aspects of Daylight. In: CIE Symposium onDaylight: Physical, Psychological and Architectural Aspects. TC3.5. July 1980. Berlin,Germany, 238–252.
Lighting Analysts Inc. AGI32 - lighting design software, http://www.agi32.com. Lastaccessed February 2006.
Lighting Technologies Inc. Lumen Designer, http://www.lighting-technologies.com. Lastaccessed February 2006.
Lindelof D, Morel N. 2006. A field investigation of the intermediate light switching by users.Energy and Buildings, 38(7):790–801.
Mardaljevic J. 2000. Simulation of annual daylighting profiles for internal illuminance.Lighting Res Tech. 32(2):111–118.
Mardaljevic J. 2002. Quantification of Parallax Errors in Sky Simulator Domes for Clear SkyConditions. Lighting Res Tech. 34(4):313–332.
Mardaljevic J. 2006. Examples of Climate-Based Daylight Modelling. CIBSE NationalConference 2006: Engineering the Future.
Moon P, Spencer DE. 1942. Illumination form a non-uniform sky. Illum. Eng. (N.Y.). 37:707–726.
Nabil A, Mardaljevic J. 2005. Useful Daylight Illuminance: A New Paradigm to AccessDaylight in Buildings. Lighting Res Tech. 37(1):41–59.
Nabil A, Mardaljevic J. 2006. Useful Daylight Illuminances: A Replacement for DaylightFactors. Energy and Buildings. 38(7):905–913.
National Research Council Canada. 1997. Model National Energy Code of Canada forBuildings 1997. National Research Council Report #NRCC 38731.
Ne’eman E, Hopkinson RG. 1970. Critical minimum acceptable window size: A study ofwindow design and provision of a view. Lighting Res Tech. 2:17–27.
Olseth JA, Skartveit A. 1989. Observed and modeled hourly luminous efficacies underarbitrary cloudiness. Solar Energy. 42(3):221–233.
Rea MS. 1984. Window Blind Occlusion: A Pilot Study. Building and Environment,19(2):133–137.
Rea M. editor. 2000. IESNA Lighting Handbook. 9th edition. New York, NY: IlluminatingEngineering Society of North America, ISBN 0–87995-150–8.
Reinhart CF. 2002. Effects of interior design on the daylight availability in open plan offices.In: Proceedings of the ACE3 2002 Summer Study on Energy Efficiency in Buildings. PacificGrove, CA. USA.
Reinhart CF, 2004. Lightswitch 2002: A model for manual control of electric lighting andblinds. Solar Energy. 77(1):15–28.
Reinhart CF, Andersen M. 2006. Development and validation of a Radiance model for atranslucent panel. Energy and Buildings. 38(7):890–904.
L E U K O S V O L 3 N O 1 J U L Y 2 0 0 6 P A G E S 7 – 3 1
30
Reinhart CF, Fitz A. 2006. Findings from a survey on the current use of daylight simulationsin building design. Energy and Buildings. 38(7):824–835.
Reinhart C F, Galasiu A. 2006. Results of an Online Survey of the Role of Daylighting inSustainable Design. NRC-IRC Report.
Reinhart CF, Voss K. 2003. Monitoring Manual Control of Electric Lighting and Blinds.Lighting Res Tech. 35(3):243–260.
Reinhart CF, Walkenhorst O. Dynamic RADIANCE-based Daylight Simulations for a full-scale Test Office with outer Venetian Blinds. Energy & Buildings. 33(7):683–6971.
Rogers Z. 2006. Daylighting Metric Development Using Daylight Autonomy Calculations Inthe Sensor Placement Optimization Tool. Boulder, Colorado, USA: Architectural EnergyCorporation. http://www.archenergy.com/SPOT/download.html.
Rubin AI, Collins BL, Tibott RL . 1978. NSB Building Science Series. 112. National Bureau ofStandards, Washington.
Szerman M. 1996. Auswirkungen der Tageslichtnutzung auf das energetische Verhalten vonBurogebauden. Bauphysik. 4:97–109.
Tregenza PR. 1980. The daylight factor and actual illuminance ratios. Lighting Res Tech.12(2), 64–68.
Turnbull P, Loisos G. 2000. Baselines and Barriers: Current Design Practices in Daylighting.Conf. Proc. of the ACEEE 2000 Summer Study on Energy Efficient Buildings. p3.329–3.337.
US Green Building Council. 2006. LEED-NC (Leadership in Energy and EnvironmentalDesign). Version 2.2. from www.usgbc.org/LEED/.
Waldram PJ. 1909. A Standard of Daylight Illumination of Interiors. Illum. Eng., 2:469.
Waldram PJ. 1950. A Measuring Diagram for Daylight Illumination. Edited by B T BatsfordLtd, London.
Walkenhorst O, Luther J, Reinhart CF, Timmer J. 2002. Dynamic Annual DaylightSimulations based on One-hour and One-minute Means of Irradiance Data. Solar Energy,72(5):385–395.
Ward G, Shakespeare R. 1998. Rendering with RADIANCE. The Art and Science of LightingVisualization. Morgan Kaufmann Publishers. 700 p.
L E U K O S V O L 3 N O 1 J U L Y 2 0 0 6 P A G E S 7 – 3 1
31