sustainable computing: informatics and systems -...
TRANSCRIPT
Sustainable Computing: Informatics and Systems 1 (2011) 7–22
Contents lists available at ScienceDirect
Sustainable Computing: Informatics and Systems
journa l homepage: www.e lsev ier .com/ locate /suscom
An information-centric energy infrastructure: The Berkeley view!
Randy H. Katz !, David E. Culler, Seth Sanders, Sara Alspaugh, Yanpei Chen,Stephen Dawson-Haggerty, Prabal Dutta, Mike He, Xiaofan Jiang, Laura Keys, Andrew Krioukov,Ken Lutz, Jorge Ortiz, Prashanth Mohan, Evan Reutzel, Jay Taneja, Jeff Hsu, Sushant ShankarUniversity of California, Berkeley, CA, United States
a r t i c l e i n f o
Article history:Received 8 October 2010Received in revised form 23 October 2010Accepted 23 October 2010
Keywords:Smart GridEnergy networksSupply-following loadsSlack and slide
a b s t r a c t
We describe an approach for how to design an essentially more scalable, flexible and resilient elec-tric power infrastructure – one that encourages efficient use, integrates local generation, and managesdemand through omnipresent awareness of energy availability and use over time. We are inspired byhow the Internet has revolutionized communications infrastructure, by pushing intelligence to the edgeswhile hiding the diversity of underlying technologies through well-defined interfaces. Any end deviceis a traffic source or sink and intelligent endpoints adapt their traffic to what the infrastructure cansupport. Our challenge is to understand how these principles can be suitably applied in formulating anew information-centric energy network for the 21st Century. We believe that an information-centricapproach can achieve significant efficiencies in how electrical energy is distributed and used. The exist-ing Grid assumes energy is cheap and information about its generation, distribution and use is expensive.Looking forward, energy will be dear, but pervasive information will allow us to use it more effectively, byagilely dispatching it to where it is needed, integrating intermittent renewable sources and intelligentlyadapting loads to match the available energy.
© 2010 Elsevier Inc. All rights reserved.
“The coming together of distributed communication technolo-gies and distributed renewable energies via an open access,intelligent power grid, represents ‘power to the people.”’ –Jeremy Rifkin [28]
1. Introduction and motivation
1.1. The energy challenge
Today’s energy infrastructure is a marvel of the Industrial Age,yet it is showing its age. The Grid as it exists today is characterizedby centralized generation via large plants, and a massive, centrallycontrolled transmission and distribution system. It delivers highquality power to all consumers simultaneously and is sized to ser-vice the peak aggregate demand at each distribution point. Power istransmitted via high voltage lines over long distances, with associ-ated inefficiencies, power losses, and right-of-way costs. Addingtransmission capacity is expensive, and involves long construc-
! Research supported by NSF Grant #CPS-0932209, the FCRP MuSyC Center,Department of Energy/Lawrence Berkeley Laboratories, and industrial support fromeBay, Fujitsu, Intel, Samsung, Siemens, and Vestas.
! Corresponding author at: 465 Soda Hall, CS Division, University of California,Berkeley, CA 94720-1776, United States. Tel.: +1 510 642 8778; fax: +1 510 6437352.
E-mail address: [email protected] (R.H. Katz).
tion delays. Local distribution, via step-down transformers, is alsoexpensive in cost and efficiency, and is a single point of failure foran entire neighborhood. The system demands end-to-end synchro-nization, and lacks a pervasive mechanism for energy storage orbuffering, thus complicating the integration of renewable gener-ation sources, sharing among grids, or independent operation ofsubgrids during upstream outages.
Supplies are meticulously scheduled, or dispatched, to meet pro-jected loads, which in turn are oblivious to the available supply.When demand exceeds supply, the only available response is toshed load through brownouts and blackouts. The utility’s strategycan best be described as one of load-following supply: the utilitymanages its portfolio of increasingly expensive generation sources– including if necessary entering a regional marketplace for energy– to scale its supply to meet its load. This approach relies heavilyon multiplexing a large population of loads to smooth the aggre-gate demand. For example, a home draws on average 25 kWh/day,which is less than 5% of its 100 A service, but demand swings rapidlyfrom a fraction of a kW to several kW. Consumption correlations,like air conditioners on a hot day, drive demand beyond estimatedaggregates. This can result in huge spikes in supply cost, and maytrigger blackouts.
Part of the challenge of the traditional load-following supplyapproach is indicated by Fig. 1, which shows how California’sstatewide daily peak electricity demand varies. For most of the yearthe demand hovers around 38 GW, but it increases during the sum-
2210-5379/$ – see front matter © 2010 Elsevier Inc. All rights reserved.doi:10.1016/j.suscom.2010.10.001

8 R.H. Katz et al. / Sustainable Computing: Informatics and Systems 1 (2011) 7–22
Fig. 1. California statewide electricity demand and power content.
mer months due to air conditioning loads and reaches a peak ofwell over 60 GW for a few hours of a few days. The variation withineach day is equally dramatic. Other parts of the world experiencesuch peaks for other reasons, but, in general, the peak demand farexceeds the average and is present for a small fraction of the time, asillustrated by Fig. 2. Capital investment in generation, transmission,and distribution must address the peak, even though this meansthat much of the resources will sit idle.
A second part of the challenge is increasing the penetration ofrenewable sources beyond the scale that is typical today, as indi-cated for California and a hypothetical retail electricity product inthe Power Content Label. Renewable resources like wind and solarbring additional variability due to environmental effects and theycannot be dispatched whenever desired.
Utilities are motivated to mitigate energy consumption becauseof the expense of deploying new infrastructure to meet growingdemands, and they generally seek to reduce the carbon content ofthe fuel mix. But, the system is neither agile, making it difficultto exploit non-dispatchable renewable supplies, nor is it able tomitigate demand except through the blunt instrument of price sig-nals, also known as demand response. Alternatively, some loads canbe shifted to off-peak periods, through a process of demand-side
management. Intelligence can be distributed to loads as well as thesupply side. But these are steps towards supply-following loads, thatis, loads that adapt their behavior to the available supply.
Information technology can improve the reliability, visibility,and controllability of the Grid. But making the Grid into a SmartGrid will require more than the intelligent metering currently beingdiscussed in the context of demand response systems. The Inter-net suggests alternative organizing principles for a smarter SmartGrid. The Internet succeeded by pushing intelligence to the edgeswhile hiding the diversity of underlying technologies through well-defined interfaces. Any device can be a source or sink of routabletraffic and intelligent endpoints adapt their behavior to what theinfrastructure can deliver in accordance with localized utility func-tions. While others have also made these observations (e.g. [17,23]),we focus more deeply on the underlying information architectureof the Smart Grid, an intensive area of active research.
Radical proposals to replace existing infrastructures, given theirwide deployment, high capital costs, and well-understood tech-nologies, are unlikely to succeed. Here, too, the Internet offers amodel – of infrastructural co-existence and service displacementover time. The early network was deployed on top of the telephonenetwork. It provided a more resilient set of organizing principles,
Fig. 2. The load duration curve.

R.H. Katz et al. / Sustainable Computing: Informatics and Systems 1 (2011) 7–22 9
became its own infrastructure, and eventually the roles reversed:services such Voice over IP (VoIP) telephony are recent additions,having been added over time. The same approach can yield a newarchitecture for local energy generation and distribution that lever-ages the existing energy grid, but achieves new levels of efficiencyand robustness. This is similar to how the Internet, built in part ontop of the telephony technology of ATM, has improved the phonenetwork.
Combining intelligent communication protocols with energytransmission in a common architecture makes possible distributedcontrol and continuous demand response to pricing signals or toricher expressions of energy availability. Such an infrastructuredesign would permit a shift from the current strategy of man-aging for the peak/worst case to focusing on the average case,with some headroom. This is analogous to statistical multiplex-ing in packet networks. The key is to use this headroom as aninput for controlling generation, storage, and loads. Standardizedintelligent “interfaces,” at the level of homes or even individualappliances, push intelligence to the edges to allow independentpowered operation, distributed generation, and energy exchange.The architecture should allow aggregations of loads and suppliesto plug into the regional grid, the neighborhood peer-to-peer grid,or the facility grid to use localized storage and control to smoothload, adapt demand, and engage in exchange.
The “computing systems” analogy is valuable in conceptualizingthe energy network. It is founded on the concepts of hierar-chy and aggregation, layering, application programming interfaces(APIs) and protocols. Storage on the path breaks the synchro-nization between generation and loads, much as network buffersallow decoupling of senders and receivers. Critical service func-tions include resource allocation, load balancing, load shifting, andredirection. By analogy with the Internet’s smart edges and dumbpipes, an energy network can support smart generation and loads,but there are the challenges of reliability in this environment. Per-vasive energy awareness and supply-following load operations areachieved through monitoring, modeling, and management.
In this paper, we review the current state-of-the-art in energyinfrastructure and management, introduce some basic terminol-ogy, and identify opportunities for information technology orientedenergy research. Our overarching goal is to provide an informa-tion system’s view of the next generation of energy infrastructure,a truly Smart Grid. The rest of this paper is organized as follows.Section 2 introduces the concept of Energy Networks. Section 3
describes recent trends in Energy Supply and Demand. Section 4introduces Energy System Terminology. We present the conceptof Deep Demand Response and Intelligent Loads in Section 5. Wedescribe Energy Proportional Computing in Section 6. Our initialapproach for an Architecture for Energy Networks is presented inSection 7. Our Summary and Conclusions are given in Section 8.
2. The concept of energy networks
Pervasive information can fundamentally change how electricalpower is produced, distributed and used. The crucial insight is tointegrate information exchange everywhere that power is trans-ferred. We call such an information-augmented system an energynetwork. The challenge is to exploit this information to construct adecentralized energy system that can match instantaneous demandto available supply on finer scales, be they geographical, logicalaggregations, time grain, as well as all of these at once.
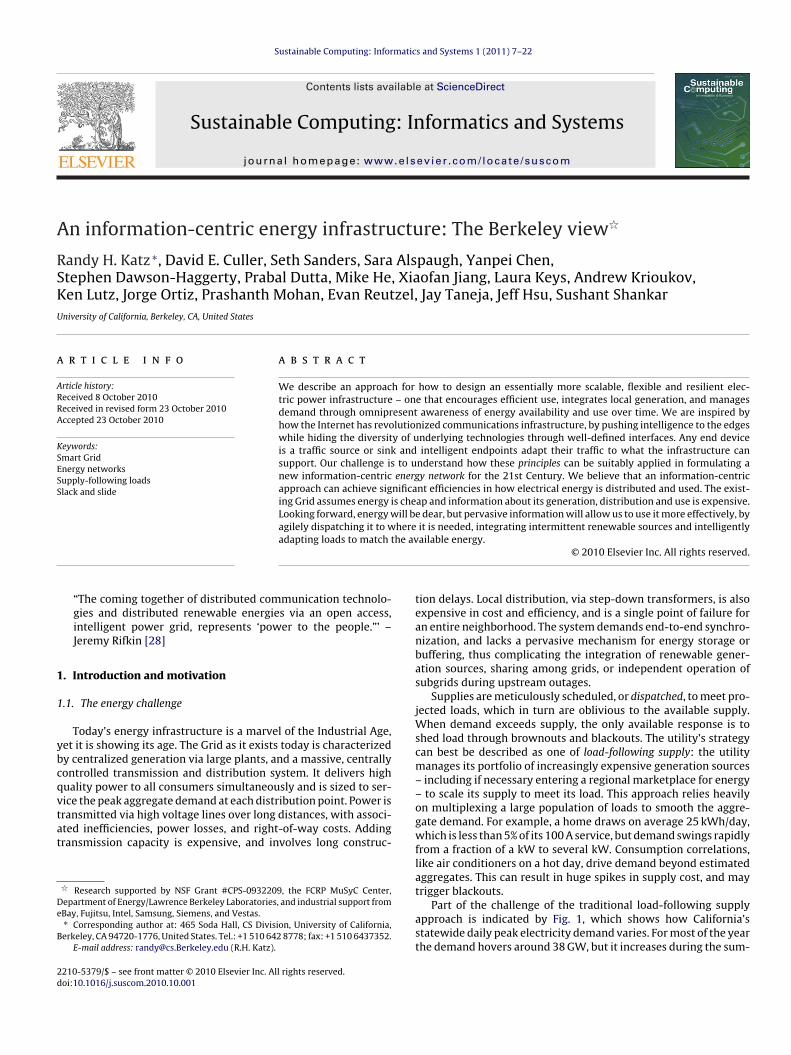
An Information-centered Energy Network is an informationoverlay on the energy distribution system in its various physi-cal manifestations, e.g., machine rooms, buildings, neighborhoods,isolated generation islands and regional grids. Fig. 3 presents aschematic view of such an overlay network. Collections of sup-plies or loads or storage capabilities can be grouped into energysubnets that interact with other parts of the network through well-defined interfaces, called an Intelligent Power Switch (IPS) in thefigure. It serves to represent the aggregate demand and supply ofits constituents as a schedule commodity that can be forecasted,resourced and adapted. It provides the communication exchangethat accompanies the on-going energy transactions between sup-plies and loads (Fig. 4).
Within this general framework, one can envision, for example,a collection of communicating supplies and loads cooperating toform a zero-net energy Virtual Private Grid (VPG) or as a mix ofrenewable and conventional utility portfolio resources in concertwith adaptive loads to sustain a target power content blend bypreferably drawing power when renewable resources are available.
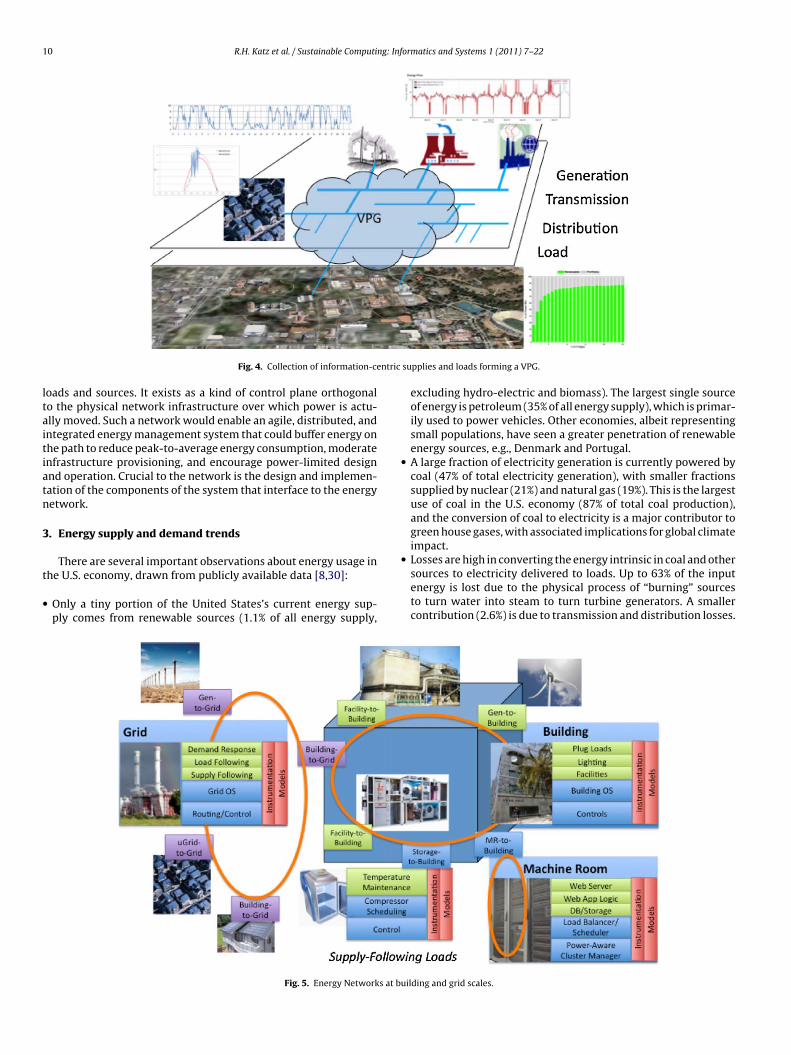
Fig. 5 sketches the implementation of such an energy network,with a particular focus on a building as an intelligent aggregationof loads, supplies, and even storage in its own right. It suggeststhe layers of software within loads like buildings and across theGrid necessary to implement its functionality. Such a networkbrings together pervasive information about energy availability anduse, interactive load/supply negotiation protocols, and controllable
Fig. 3. Intelligent energy network as an overlay on existing grid and Internet infrastructure.
10 R.H. Katz et al. / Sustainable Computing: Informatics and Systems 1 (2011) 7–22
Fig. 4. Collection of information-centric supplies and loads forming a VPG.
loads and sources. It exists as a kind of control plane orthogonalto the physical network infrastructure over which power is actu-ally moved. Such a network would enable an agile, distributed, andintegrated energy management system that could buffer energy onthe path to reduce peak-to-average energy consumption, moderateinfrastructure provisioning, and encourage power-limited designand operation. Crucial to the network is the design and implemen-tation of the components of the system that interface to the energynetwork.
3. Energy supply and demand trends
There are several important observations about energy usage inthe U.S. economy, drawn from publicly available data [8,30]:
• Only a tiny portion of the United States’s current energy sup-ply comes from renewable sources (1.1% of all energy supply,
excluding hydro-electric and biomass). The largest single sourceof energy is petroleum (35% of all energy supply), which is primar-ily used to power vehicles. Other economies, albeit representingsmall populations, have seen a greater penetration of renewableenergy sources, e.g., Denmark and Portugal.
• A large fraction of electricity generation is currently powered bycoal (47% of total electricity generation), with smaller fractionssupplied by nuclear (21%) and natural gas (19%). This is the largestuse of coal in the U.S. economy (87% of total coal production),and the conversion of coal to electricity is a major contributor togreen house gases, with associated implications for global climateimpact.
• Losses are high in converting the energy intrinsic in coal and othersources to electricity delivered to loads. Up to 63% of the inputenergy is lost due to the physical process of “burning” sourcesto turn water into steam to turn turbine generators. A smallercontribution (2.6%) is due to transmission and distribution losses.
Fig. 5. Energy Networks at building and grid scales.

R.H. Katz et al. / Sustainable Computing: Informatics and Systems 1 (2011) 7–22 11
• Energy usage is more or less balanced among residential andcommercial buildings (respectively 22% and 19% of all energyconsumption), industrial plants and factories (30%), and vehicles(29%). Thus, buildings are about 40% of energy use and 72% of elec-tricity use, a kind of aggregated load that represents a near-termtarget for energy network deployment.
• Electricity generation currently consumes more energy thanvehicles (respectively 41% and 29% of total energy consump-tion). It has been suggested that shifting to electric vehicles couldsignificantly reduce the U.S. dependence on foreign oil. This issometimes called “the million volt answer to oil.” This would, ofcourse, add significantly to the load and change the dynamics onthe existing Grid, but also provides a potentially vast manageableload that could accelerate the deployment of a true Smart Grid.
4. Electrical energy system terminology
The traditional Electrical Energy System, also known as the Grid,consists of a three-tiered architecture of electrical energy genera-tion, long-distance transmission, and regional distribution to localconsumers of energy. We discuss each of these below:
Electrical Energy Generation: Electricity is generated from otherforms of energy, typically by exploiting the principle of electro-magnetic induction. This is accomplished by rotating a wire in amagnetic field to induce electricity through a device called a gen-erator. The rotational forces come from many mechanical sources,such as water through a turbine, wind moving a blade, or the burn-ing of a fuel source, such as nuclear, coal, or natural gas, to heatwater into steam, which in turn is used to turn a turbine generator.The burning of fossil fuels, as well as the by-products of nuclearreactions, has implications for the environment, driving a strongdesire to find alternative generation sources.
Transmission: This is the part of the system that delivers electric-ity at high voltages across long distances from remote generationsources for delivery to consumers. The transmission infrastruc-ture can have bottlenecks: limited capacity for delivering energyto a particular region. This can result in large spikes in the cost ofelectricity when regional demand exceeds supply, whether due togeneration or transmission capacity limits.
Distribution: This is the final stage of the delivery process, con-necting the transmission system through a distribution tree to theconsumers and providing electricity at the appropriate voltages forthe local loads.
Two emerging components of the energy system reflect the shifttowards a more intelligent distributed architecture: Distributedgeneration and Energy storage.
Distributed generation: Consisting of smaller generation sourcesthan traditional generators, these are integrated closer to the loads.Examples include small-scale gas turbine generators, gas poweredfuel cells, solar plants, and wind farms. They are intended to beused as an augmentation or enhancement to the traditional gridresources, providing more localized energy sources when the sys-tem as a whole becomes over subscribed or to bypass bottlenecksin the transmission system.
Energy storage: This important component of the energy systemallows energy production to be decoupled from its use in time. Thisis becoming increasingly important as difficult to schedule, renew-able energy sources are becoming integrated into the Grid. Theseare known as non-dispatchable sources. Batteries exploit reversiblechemical reactions to charge, hold, and supply energy as needed,yet tend to be expensive and have environmental impacts due tothe kinds of materials used. Other approaches based on mechan-ical or thermal processes for energy storage are also possible. SeeSection 5.2 for how energy buffering can be implemented by slackand slide in intelligent loads (Figs. 6 and 7).
Fig. 6. The three-tier architecture of the grid.http://peswiki.com/index.php/Image:Pathwaytopower.gif.

12 R.H. Katz et al. / Sustainable Computing: Informatics and Systems 1 (2011) 7–22
Fig. 7. Detailed grid schematic.http://upload.wikimedia.org/wikipedia/commons/5/56/Electricity grid schema- lang-en.jpg.
Energy markets: The energy system exists in a market place.If a utility has insufficient generation resources to meet its loaddemand, it can enter that marketplace to purchase additional sup-ply at a market price. Similarly it can sell surpluses in its owncapacity to other operators in its region. Some regions, like Califor-nia, have deregulated their energy sector, limiting traditional utilitycompanies to becoming energy distributors, and establishing an
energy exchange that allows such distributors to purchase energyfrom a variety of energy suppliers [5,20]. Fig. 8 shows the variabil-ity of the wholesale market, which establishes hourly prices 24 h inadvance and determines the scheduling of dispatchable resourcesin the supply portfolio, and the volatility of spot prices, which arefor 5 min intervals an hour in advance. When demand exceeds pre-diction the price sources, but when is falls below estimates prices
Fig. 8. Day ahead wholesale market and hourly spot prices for CA ISO.

R.H. Katz et al. / Sustainable Computing: Informatics and Systems 1 (2011) 7–22 13
Fig. 9. Smart Grid schematic.http://www.energy-daily.com/images/smart-grid-electricity-schematic-bg.jpg.
go negative and major loads are paid handsomely to remove powerfrom the grid.
These trends in technology and markets, combined with a gen-eral societal desire to increase the efficiency of energy systemsand to improve the environment by integrating more renewablesources in the generation mix, have yielded the Smart Grid concept.
Smart Grid: The Smart Grid exploits new technologies and archi-tectures for managing the energy system, for improved efficiencyand integration of alternative energy sources (Fig. 9). A key enableris pervasive monitoring and information communication betweenloads and generation sources, potentially to the level of individualconsumer appliances. Monitoring and communication are essen-tial for integrating non-dispatchable sources with the Grid. Thefirst step towards the Smart Grid involves the broad deploymentof Smart Meters, with utilities communicating real-time prices toconsumers [15]. They, in turn, are expected to respond by reducingconsumption when prices are high. The Smart Grid requires intelli-gent loads, beyond the meter on the building. Demand Responseis an enhanced functionality for automated reduction of loaddemand in response to higher prices, by turning off non-criticalloads or shifting their use in time. We describe such loads assupply-following, modifying their work function in response toenergy supply signals. Enabling supply-following loads requires theSmart Grid to be as much focused on an information architecturebased on communications and information exchanges betweenenergy suppliers and consumers to better match supply anddemand.
5. Deep demand response
5.1. Intelligent loads meet intermittent supply
On the demand side, intelligent loads, and on the supply side,the larger penetration of renewables, will be crucial to the SmartGrid’s success. There is a special opportunity to combine both. Thetipping point may well be the introduction of electric vehicles (EVs)on a large scale, which will place considerable demands on the Grid.EVs also represent a new revenue stream for the electricity industryas vehicles migrate away from petroleum, presumably sufficient tounderwrite new infrastructure.
The average quick charging load of an EV is comparable to thatof a typical residence. More intelligent charging, spreading demandover time or sequenced in cooperation with other loads in theneighborhood, allows better integration of this new load with theGrid by reducing its effect on peak demand. EVs also offer thepossibility of stabilization, by acting as Grid storage to absorb inter-mittent energy generated by renewables while locally sourcingenergy during times of high demand. However, in current tech-nologies, battery lifetimes are affected by charge–discharge cycles,which mitigates their usability in this role.
A regulatory push to increase renewables in the source mix ofis well underway in the U.S., with 24 states and the District ofColumbia having policy in place to achieve a Renewables PortfolioStandard (RPS) of 10–45% of total energy consumed by 2015–2030.These states account for well over half the total U.S. electricity con-sumption, with more states setting voluntary goals. California’s RPScalls for renewables to comprise 33% of its energy mix by 2020 [2,9].
5.2. Slack
These trends suggest the need for a new kind of deep demandresponse: combining energy information with new kinds of controlsystems and sensor/actuator networks to enable more intelligentloads. This allows energy systems to match supply and demanddynamically, down to the appliance level, in real-time. The keysare predicting the output of renewable sources and controlling theconsumption of loads in response to these. The challenge lies inmeeting the work function “quality-of-service requirements” of theload, while adapting to any variations in the source. To reason aboutload adaptability, we introduce energy slack: the amount of time anenergy-consuming operation can be advanced or delayed while stillperforming its intended function. To model source variability, weconsider the cumulative distribution function (CDF) of the changein output.
To illustrate deep demand response and slack, consider wind asthe renewable source and a refrigerator as supply-following load.A wind source exhibits extremely high variability over time. As anexample, consider a power profile that changes by less than 5 kWover a 5 min window 95% of the time, yet can source up to 25 kWover a 60 min window 95% of the time. If this kind of information

14 R.H. Katz et al. / Sustainable Computing: Informatics and Systems 1 (2011) 7–22
were available to loads, an intelligent refrigerator could advancethe start time of its cooling cycle to consume excess energy (pre-cooling), or it can increase a temperature set point slightly to reduceits energy consumption.
To make decisions in sculpting energy loads in this way, it isimportant to have metrics to express the ability to change theload. Fine-grained alignment of supply and consumption requirescontrollers that make continuous decisions based on informationabout load schedule as well as energy availability. For a load to besculptable:
• Its consumption schedule involves choices on when to consumeenergy;
• There is some capacity to store energy in the system, which wecall slack. Precooling is an example of a mechanism for increasingslack in a physical system;
• There is an ability to schedule its energy consumption, which wecall slide. Running a washing machine at an off-peak time is a con-ventional example of slide. Less conventionally, slack can enableslide, for example, by deferring a cooling cycle in the refrigerator.Harnessing slide in physical systems like heaters, air conditions,and refrigerators is a rich arena for making loads more intelligentand adaptable.
Slack is the potential of an energy load to be advanced or deferredwithout affecting earlier or later operations or outcomes. In criticalpath analysis, the term refers to the scheduling flexibility in a taskthat keeps it off the critical path. In our context, we measure slackin units of energy, and apply it to the operation of physical sys-tems, where the goal is not completion time, but rather reshapingthe profile of how energy is consumed. More simplistically, energyslack closely follows a credit analogy. As energy is used by the sys-tem to do work – in the case of a refrigerator, as the compressoroperates – slack is credited. Then, during the natural warming cycle,the credits are drained as slack is slowly reduced. Slack can remainin a system across cycles in the form of stored energy. In the caseof a battery, this is the capability of the battery to introduce energyinto the system later. For a refrigerator, this is the thermal energystored in the contents of the refrigerator, whether it is food, liquids,or even air. Its consumption manifests itself in affecting the coolingschedule of the refrigerator’s compressor.
6. Energy proportional computing
While information technology is a key part of the solution to cre-ating a more sustainable energy infrastructure, it is also part of theproblem, since it represents a large, rapidly increasing industrialand consumer demand. But perhaps more importantly, it providesa model problem that serves as an excellent testing ground fordeveloping and evaluating solution techniques. The datacenter is abuilding or part of a building that presents both an environmentalcondition demand (cooling, ventilation, humidity) and an indus-trial demand (information processing production). It is of greaterintensity and more systematically engineered than typical build-ings or manufacturing processes. And it is inherently friendly toautomated solutions. Indeed, many of the ideas and opportunitiesfor monitoring, modeling and mitigation translate over to otherdomains.
6.1. Introduction
The energy consumption of datacenters has received a great dealof attention, from massive web services like Google and Amazonlocated in proximity with massive electrical generation, to enter-prise datacenters on urban grids, to building machine rooms. The
EPA estimates that U.S. datacenters consumed 61 billion kW h in2006, at a cost of about $450 million. This constitutes about 2% ofUS electricity consumption and has been the fastest growing con-sumption sector, representing an alarming growth trend [12,25].
An influential 2007 study examined the carbon footprint asso-ciated with information technology (IT) equipment extrapolated tothe year 2020 [6]. In 2007, IT equipment generated 1.43 billion tonsCO2 equivalent, which represented 2% of the world’s greenhousegas footprint. This is comparable to the footprint of commercialaviation. This is expected to grow to 4% by 2020. The breakdownby equipment type extrapolates the category of PCs, peripheralsand printers to yield 820 million tons CO2, or 57% of the total.Telecoms infrastructure and device yields a further 360 milliontons CO2, or an additional 25%, while datacenters are expected togenerate a further 260 million tons CO2, or 18% of the total. Thecompounded aggregate growth rate per sector from 2002 to 2020is 5% in telecommunications, 7% for datacenters, and 5% for PCs andrelated equipment. Thus, datacenters represent the fastest growingcontributor. In developing this estimate, numerous assumptionsabout the effectiveness of server consolidation and energy effi-ciency at the node and datacenter facility levels were assumed, sothis should be considered as a lower bound to the actual contribu-tions.
Much of the focus has been on the ratio of total datacenter con-sumption to that consumed by the computing equipment, calledPower Utilization Efficiency (PUE). Typical, large data centers oper-ate at a PUE of 2–3 so the energy required to deliver power toand remove the heat from the servers is equal to that used bythe servers. Considerable design efforts focused on improved heatexchange, airflow, and power distribution has reduced this over-head and demonstrated PUE of 1.2–1.4. PUE is simple to measureand track by metering the whole center and the PDU output, but itfails to recognize that real measure of effectiveness is not the powerconsumed by the servers, but the work accomplished.
Another key observation, made by engineers at Google, is thatcurrent computer systems are not power proportional [3]. At thesystem level, power consumed does not scale down with systemutilization. In practical terms, it is surprisingly hard to achieve highlevels of utilization of typical servers. Energy efficiency, defined as:
Energy efficiency = System utilizationPower
should approach 0 as utilization approaches 0, but does not. Evena relatively energy-efficient server still consumes about half of itspeak power when doing virtually no work. Interestingly enough,many physical systems exhibit this poor behavior, including airconditioning and power distribution systems. These have beenoptimized for peak efficiency in case of rarely encountered peakuse, yet operate proportionally inefficiently in the more commoncase of lower usage. Such a system does not exhibit the criticalprinciple of Doing Nothing Well.
In fact, the utilization of the servers in datacenters is typicallyonly about 25%. For example, in a study of over 5000 of its servers,Google found that the average CPU utilization for most servers isbetween 10% and 50% of maximum utilization. This should not besurprising, since reasonable capacity planning must provide head-room to accommodate transient bursts in demand and potentialfuture growth.
6.2. Architecture of Internet Datacenters
With enormous amounts of computing located under a singleroof, the design of an Internet Datacenter must critically balanc-ing the dense computing infrastructure with the needed facilitiesfor power distribution and cooling. Within the datacenter, powerpasses through a distribution tree of Mains-UPS-PDU-Computer

R.H. Katz et al. / Sustainable Computing: Informatics and Systems 1 (2011) 7–22 15
Racks-Computer Equipment. The HVAC system provides cool airto maintain the equipment at a proper operating temperature. Amodest amount of the power budget goes to lights, conditioningoffice spaces, and so on, but the overarching loads are the computerequipment, the air conditioning system, and the power distributioninfrastructure itself.
6.2.1. IT equipment in the datacenterEnergy consumption by information technology equipment is
especially important because other elements of datacenter energyconsumption scales with it, such as air-conditioning and power dis-tribution facilities. While a PUE of 2–3 is considered good, Googlehas achieved PUEs as low as 1.2 in some of its datacenters [16].
Consider a datacenter with a PUE of 3.3, one in which for everydollar spent on power for its IT equipment, another $2.3 is spenton the power and cooling infrastructure. In such a datacenter,typical numbers for energy consumption are as follows. For thephysical infrastructure of cooling and power equipment, the 70%of the datacenter energy footprint breaks down as: the ComputerRoom Air Conditioner (CRAC) consumes 9%, the humidifier 3%,the chiller 33%, the uninterruptable power supply (UPS) 18%, thePower Distribution Unit 5%, the lighting 1%, and the transformersand related power switchgear 1%. For the 30% that is the IT load,33% can be attributed to the CPU, 30% to DRAM, 10% to disks, 5%to networking equipment, and 22% to other backend servers andappliances [18].
Some simple rules can be followed to minimize coolingcosts. First, raise the datacenter temperatures. Highly redundantarchitectures combined with practical experience suggest that tra-ditional machine rooms have been overcooled. Second, maintaintight control of the flow of cool and hot air via short path whileavoiding mixing with short paths. Third is to exploit airside econ-omization, using cool outside air to augment and thus reduce theneed for conventional air conditioning. Waterside economizationturns off the air-conditioning when it is not needed. The best cur-rent designs have water cooling placed close to the load, but avoiddirect water cooling.
6.2.2. Datacenter power distributionThe prime figure of datacenter sizing is its power rating: the
maximum load it presents to the utility. From this we can derive thenumber of computers and other information technology equipmentit can support.
First, let us consider the conversion losses in a typical datacen-ter. Moving power from high voltage transmission lines (115 kV) tothe local distribution infrastructure (13.2 kV) typically encountersa 0.3% loss. Power then passes through the datacenter’s Uninter-ruptable Power Supply (UPS), still at 13.2 kV, where it sustains afurther 6% loss. The purpose of the UPS is to protect the datacenterfrom disruptions in the power supplied from the Utility. It is usu-ally implemented as large battery banks. When combined with alocal generation source like a diesel generator, this makes it pos-sible for the datacenter operate independently of the Grid for aperiod of time. Power Distribution Units (PDU), operating at 480 V,feed power throughout the datacenter, incurring a further 0.3% loss.At the next stage, power passes through the Power Panel at 208 V,with a further 0.3% loss. The final step takes the power through thePower Switch Gear and Conductors to deliver it finally to the com-puters in their racks, losing an additional 1%. Thus the total powerdelivered after these losses as approximately 92%: a 1 MW data-centers can provide only 920 kW of power to its computers andother facilities.
Some general rules are useful for minimize power distributionlosses. First, avoid conversions, such as making use of fewer volt-age transformation steps as well as a more efficient UPS. Googlegets rid of the need for a UPS by distributing batteries to individual
server nodes, dramatically reducing the inefficiencies of conven-tional large-scale battery-based UPS systems. Another possibilityis to increase the efficiency of conversions, particularly at the levelof the server node. This can be achieved by better matching voltageregulators to their loads and using more efficient parts, more effi-cient power conversion can be achieved. Commodity server designsrarely make these choices. Other efficiency improvements can beachieved by distributing high voltages as close to the load as pos-sible, as well as DC distribution.
A critical observation is the principle of distributing powerand cooling infrastructure via smaller, better utilized componentslocated close to where they are used.
6.2.3. Datacenter IT equipmentIndividual processor chips and system-level server nodes have
been the intense focus of the development of new energy manage-ment techniques (e.g. [4,14]). What makes datacenters particularlyinteresting is the large-scale deployment of such equipment underone roof. The typical building blocks of a large-scale datacenter areserver racks with 10–80 nodes, with 20–60 such racks per PDU.For a given power sizing, the goal is to deploy as many machinesas possible. In this endeavor, it is important to distinguish betweennameplate and actual peak power. It is rare to be able to fully utilizeall components of the compute node simultaneously. Google engi-neers have reported that a typical compute node with a nameplatepower of 213 W was measured under a heavy workload as consum-ing only 145 W, about two-thirds of its rated peak. Furthermore,in practical terms, it is difficult to drive such systems to anythingapproaching even these levels of utilization. These observations areessential for proper sizing of the number of nodes to the deployedpower infrastructure [13].
In general, it is worthwhile consolidating computation on fewermachines if possible, while placing the remainder in low powersleep states. It is better to have one computer at 50% utilizationthan five computers at 10% utilization. In the design of the com-pute node, issues of system balance must be carefully considered.It does not make sense to deploy too high performance a CPU if theother components of the system, like memory or disk, representthe performance bottleneck.
6.3. Datacenter in a box
A new form of system packaging has emerged, consisting ofcontainerized datacenters. These systems represent a new kindof mechanical–electrical co-design. The idea is to just add power,chilled water, and network connectivity to create a datacenterbuilding block. Manufacturers include Rackable Systems [27] andSun Microsystems [29]. Systems like these have been used by bothGoogle and Microsoft in their datacenter deployments.
Many considerations have led to modular datacenters. The firstis the faster pace of infrastructure innovation, now typically on athree-year cycle. Modular design allows a container to be swappedout and replaced with an updated model. The second is efficientscale down, as compute density and network connectivity increase.The third is service-free fail in place. 20–50% of system outagesare caused by administrator errors, and it is better to allow com-ponents to fail and remain in place. Once a critical number havefailed, the whole container can be replaced. The final considera-tion is the way in which containers allow the datacenter to growincrementally.
Some parameters of Sun’s pioneering Black Box container areas follows. It provides power and cooling for 200 kW of rackedhardware. It provides external taps for electricity, network, andwater. A 20 foot " 20 foot " 20 foot container contains 7.5 racks ofapproximately 250 Servers, 7 TB DRAM, and 1.5 PB disk [29].

16 R.H. Katz et al. / Sustainable Computing: Informatics and Systems 1 (2011) 7–22
Fig. 10. LoCal power proportional cluster tracking Wikipedia demand with slack and slide.
6.4. Case study: energy-proportional cluster management
For web service workloads, the amount of work is primarilydetermined by the rate of user requests, which can vary drasticallyover time. Web service operators must at the very least provisionfor the observed peak, taking “. . .the busiest minute of the busiesthour of the busiest day and build[ing] capacity on that.” However,most clusters provision for far more than the observed peak in orderto provide a safety margin against flash crowds. A typical rule ofthumb is to provision for twice the maximum average load overa moderate window experienced in the last planning cycle. In a 1-week request trace obtained from Wikipedia, we observed the peakdemand over a minute that was 1.6 times the average rate, thoughpeaks as large as 19 times the average have been observed. A naturalconsequence of the gap between peak and average requests rates inworkloads, amplified by overprovisioning, is that much of the timemany servers sit at low levels of utilization. In an energy efficientdata center, not only should the PUE be small, the power consump-tion should be proportional to the rate at which work is performed.
Unfortunately, modern server platforms are very far from powerproportional despite substantial improvements in power efficiencyof the microprocessor, including Dynamic Voltage/Frequency Scal-ing (DVFS) and the introduction of a family of sophisticated powerstates. Even for specially engineered platforms, the power con-sumed when completely idle is over 50% of that when fully active,and idle consumption often over 80% of peak for commodityproducts. Thus, the service power consumption is essentially pro-portional to provisioned capacity, not the request rate. To makethe service power proportional, we must harness the idleness forenergy savings.
In this subsection, we consider the design and implementationof power proportional clustered services constructed from non-power proportional systems [1]. Similar work for computationalgrids rather than web services workload can be found in [22]. Thebasic approach is to put idle servers to sleep and wake them upwhen they are needed. Thus, capital equipment spending trackspeak demand, but energy consumption tracks delivered service.However, realizing this simple goal presents several challenges.
The active work must be coalesced into a subset of nodes, so thata significant amount of coarse-grained, i.e., entire node idleness, isobtained. But enough capacity must be available to absorb bursts indemand. Servers exhibit a dramatic increase in delay or loss rate asthe requested load approaches the maximum delivered load, whichtraditional services avoid by having all the resources running allthe time. We dynamically provision active nodes to track demand,while providing headroom for bursts. Interestingly, the solution isvery similar to approach used by electric utilities to match powergeneration to time varying demand without any explicit protocolbetween consumers and providers. A set of baseline resources issupplemented by an array of intermittent resources. Intermittentresources are brought on-line or off-line in accordance with esti-mated demand in the near future. Each of those resources maintaina certain amount of “spinning reserve” to absorb transient burstsand to cover the ramp-up delay in spinning up additional resources.Each seeks to operate at sufficiently high utilization to be efficient,while leaving enough reserve capacity to be reliable.
Our basic result is summarized in Fig. 10, which shows thesecond-by-second request rate of a Wikipedia trace over a 2 daysrelative to the energy-consuming resources provisioned to servicethat load. The diurnal pattern is apparent, as is the stochastic fluc-tuation in demand. Traditional capacity planning would provisionfor approximately 10,000 requests per second. The power-awarecluster manager performs Server Actuation and Control on a het-erogeneous set of machines. It dynamically provisions enoughmachines to serve the requested load with just enough headroom toaccommodate the bursts and allow for re-provisioning to increaseddemand – much like utilities maintain a certain fraction of spinningreserve to accommodate increases in demand while new suppliesramp up. The jagged pattern shown in the graph reflects the capac-ity of the individual machines engaged to serve the load. Energyconsumption is proportional to the work performed at essentiallya joule per request, despite large variation in the request rate, whilestatic provisioning is only efficient near the peak load. Furthermore,the fine-grain overprovisioning required to track the load withoutincurring a significant congestion penalty is small compared to theworst-case provisioning used in capacity planning.
R.H. Katz et al. / Sustainable Computing: Informatics and Systems 1 (2011) 7–22 17
Fig. 11. Energy aware cluster manager.
A key observation is that most clustered systems employ amaster-worker pattern where the master is responsible for loadmanagement. It is natural to extend the master to manage thepower state of the workers and to assign work in a manner thatis consistent with its power provisioning.
Leading server products do not actually support going intostandby and resuming, other than by actuating the AC power line,so we examine the use of desktop, mobile, and even embeddedplatforms for use in service applications. The Wake-on-LAN andlow-power sleep states available on these platforms are sufficientmechanisms for this design. Under the 2" provision rule, we areable to achieve 90% of the savings that an optimal scheme wouldachieve. With our design we are able to reduce energy consump-tion while maintaining acceptable response times for a web serviceworkload based on Wikipedia.
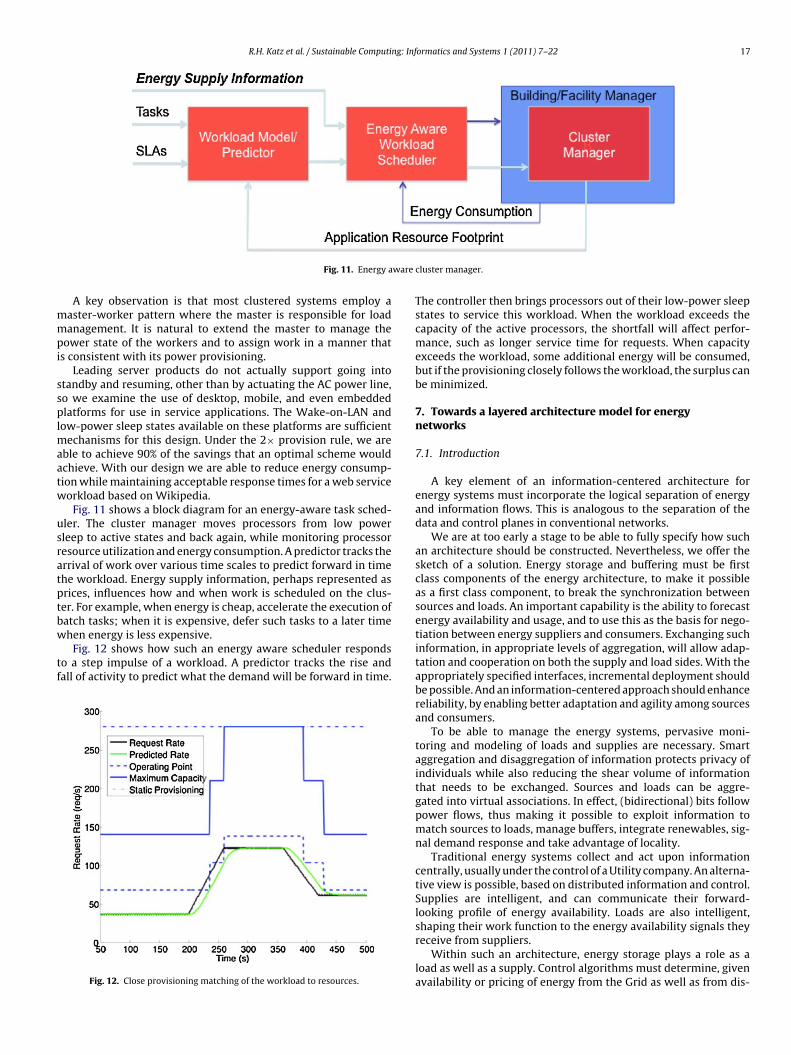
Fig. 11 shows a block diagram for an energy-aware task sched-uler. The cluster manager moves processors from low powersleep to active states and back again, while monitoring processorresource utilization and energy consumption. A predictor tracks thearrival of work over various time scales to predict forward in timethe workload. Energy supply information, perhaps represented asprices, influences how and when work is scheduled on the clus-ter. For example, when energy is cheap, accelerate the execution ofbatch tasks; when it is expensive, defer such tasks to a later timewhen energy is less expensive.
Fig. 12 shows how such an energy aware scheduler respondsto a step impulse of a workload. A predictor tracks the rise andfall of activity to predict what the demand will be forward in time.
Fig. 12. Close provisioning matching of the workload to resources.
The controller then brings processors out of their low-power sleepstates to service this workload. When the workload exceeds thecapacity of the active processors, the shortfall will affect perfor-mance, such as longer service time for requests. When capacityexceeds the workload, some additional energy will be consumed,but if the provisioning closely follows the workload, the surplus canbe minimized.
7. Towards a layered architecture model for energynetworks
7.1. Introduction
A key element of an information-centered architecture forenergy systems must incorporate the logical separation of energyand information flows. This is analogous to the separation of thedata and control planes in conventional networks.
We are at too early a stage to be able to fully specify how suchan architecture should be constructed. Nevertheless, we offer thesketch of a solution. Energy storage and buffering must be firstclass components of the energy architecture, to make it possibleas a first class component, to break the synchronization betweensources and loads. An important capability is the ability to forecastenergy availability and usage, and to use this as the basis for nego-tiation between energy suppliers and consumers. Exchanging suchinformation, in appropriate levels of aggregation, will allow adap-tation and cooperation on both the supply and load sides. With theappropriately specified interfaces, incremental deployment shouldbe possible. And an information-centered approach should enhancereliability, by enabling better adaptation and agility among sourcesand consumers.
To be able to manage the energy systems, pervasive moni-toring and modeling of loads and supplies are necessary. Smartaggregation and disaggregation of information protects privacy ofindividuals while also reducing the shear volume of informationthat needs to be exchanged. Sources and loads can be aggre-gated into virtual associations. In effect, (bidirectional) bits followpower flows, thus making it possible to exploit information tomatch sources to loads, manage buffers, integrate renewables, sig-nal demand response and take advantage of locality.
Traditional energy systems collect and act upon informationcentrally, usually under the control of a Utility company. An alterna-tive view is possible, based on distributed information and control.Supplies are intelligent, and can communicate their forward-looking profile of energy availability. Loads are also intelligent,shaping their work function to the energy availability signals theyreceive from suppliers.
Within such an architecture, energy storage plays a role as aload as well as a supply. Control algorithms must determine, givenavailability or pricing of energy from the Grid as well as from dis-

18 R.H. Katz et al. / Sustainable Computing: Informatics and Systems 1 (2011) 7–22
tributed generation sources, whether to charge storage for futureuse or discharge it for current use. Beyond conventional storage,such as batteries, energy can be buffered by essentially schedulingits work. By consuming energy now, we advance the work functionof the load, introducing slack that allows energy consumption to bedeferred later. In effect, we are buffering energy.
Controlling this system admits of many optimizationapproaches. In addition to traditional energy system metricsof peak reduction, minimum energy consumption, and responsive-ness to changing energy conditions, we are interested in stabilityand convergence properties of the system. The best distributedcontrol system remains an area of active research investigation.
7.2. The building operating system
Multiple studies have indicated that commercial buildingenergy consumption can be reduced 10–50% should better build-ing energy management systems be available. Although some newcommercial systems have started to break out of the “silo” approachto building management software architecture, the predominantparadigm is still monolithic software managing all facets of abuilding’s energy spend. A better approach is a flexible, open,service-based architecture to solve the problems inherent in theolder system and prototype all of the core functionality. Our evalu-ation proceeds on real metrics like problems identified, portabilitybetween buildings, and ultimately, energy savings.
A building operating system provides a context and runtime forother software that runs “on the building.” We envision numerousvendors competing on delivering the best solution for a particularbuilding management task, but running alongside software fromother providers. Pervading all of this are core pieces of functionality,providing five key backplane service abstractions: sensor and actu-ator access, access management, metadata, archiving, and discovery.Executing on this platform are building-scale applications: batchand real-time analytics, supervisory control loops, and individualizedenergy feedback. These building services are described below.
Sensor and Actuator Access: Imposing a uniform data model andaccess method on the diverse instrumentation found in a typicalcommercial building is a critical enabling piece of technology. Wedefine a uniform data model for sensors and actuators, in whichdevices expose multiple sense points and channels. Using thisdecomposition, we define a simple set of objects and propertiesrequired for interpreting nearly any sensor; the result is the Sim-ple Measurement and Actuation profile, or sMAP [7]. It is possible toexpose a huge diversity of underlying sensors as time-series.
Archiving: Data is not commonly used in real-time but ratherit is stored for later analysis. We have experimented with severaldifferent archival backends for storage: a custom file-based enginewith a simple query language on top, SQL-based stores, and NoSQLdocument stores. In general, we have found these solutions to beacceptable for the current amount of data generated (3000 pointsat 20 second resolution), although doubts exist as to their abilityto scale to larger numbers. Additionally, it seems that it will benecessary to degrade historical data at some point instead of storingit “forever.”
Alternatively, horizontal scaling can be employed to scale as theamount of data grows. The take-away, however, has been is thatexisting data management solutions are acceptable for this formof time-series data when properly employed and with the addi-tion of a simple RESTful interface can be easily integrated into ourarchitecture.
Metadata: A key piece of infrastructure is the metadata server.Potential examples of metadata include building models, locationsand types of sensors and actuators, and the logical entity rela-tionships between these devices. This type of information is keyto automatically drive analyses of the building data. Two proto-
types of this system exist. The first is a simple application builton a heavily de-normalized relational schema. It was designed tocapture the electrical distribution design of Cory Hall, the homeof Electrical Engineering at Berkeley, which necessarily forms atree. Significant metadata concerning the sensors in the system hasbeen entered into this system, to the point at which we can con-sider re-normalizing the schema and thus deriving a data modelrich enough to capture the diversity of the real building systems. Asecond prototype system, StreamFS (formerly IS4 [26]), is much fur-ther along at developing RESTful machine-to-machine interfacesfor exposing the building metadata to other consumers. It treatsmetadata as a set of file-like structures, where the file paths referto a physical resources and the associated metadata is kept as aJSON document associated with that resource. StreamFS also pro-vides versioning of the file system structure in order to keep trackof changes in the building or deployment over time; an importantinnovation so that the appropriate metadata for any sensor read-ing can be reconstructed. The goal is to encode enough informationinto a uniform data model so that metrics such as kW/ft3 andpower breakdowns between different device classes can be easilycomputed.
Access management: A crosscutting design requirement is theneed for security. Depending on the part of the system, there maybe a need for authentication, integrity checking, or confidentiality.For instance, certain data is public but consumers need to checkthat it has not been altered since production in transit; they must beable to verify its integrity. Other sensors may allow a malicious userto discover when a person is in their office and thus invade theirprivacy. Thus access to data should be contingent on authentica-tion and confidentiality guarantees. Multiple systems exist whichhave solved these problems in other areas. Kerberos and PKI are themost relevant in this context. One key concept is that of principals:identities that receive capabilities. In a building operating system,both computer users and pieces of software (agents) are princi-pals. Another is role, as defined by role-based access control. In thisparadigm, the capabilities granted to a principal are determinedby the role they play. A principal can play multiple roles. We pro-pose to define a set of roles for a building operating system, usingwell-known cryptographic primitives for enforcement. By defin-ing a new HTTP authentication mechanism that understands andenforces these access restrictions, we construct a modern versionof “kerberized” web service protocols that carries the traffic for thebuilding operating system.
Discovery: The final key component tying together all others isdiscovery. At the minimum, a client must be able to enumeratethe access management server, although the ability to enumerateother services may itself require a particular role. There are manyways to implement this. Predominant approaches are DNS based,either using Zero configuration-like multicast DNS, or a centralizeddynamic DNS system. Services receive names that resolve to a num-ber of records containing details on how to contact them. AlthoughDNS names are themselves hierarchical, we do not use the DNS hier-archy to capture a significant amount of metadata concerning theservices. Although it may be convenient to do so in some cases, thefull metadata is too complex to be captured by a simple hierarchy.We use either dynamic DNS, where services coming online identifythemselves to a DNS server and update their records with appropri-ate information, or a simplified version of a custom web-servicesprotocol to accomplish essentially the same thing; the decision bemade based on the difficulty integrating DNS access control mech-anism (TKIP) with our new authentication architecture.
Significant challenge remains in extending such a system toaccommodate multiple building or entities within the same sys-tem. It is entirely reasonable to presume that a single campus oroffice park would run only a single “instance” of the same oper-ating system. The boundaries between systems are organizational

R.H. Katz et al. / Sustainable Computing: Informatics and Systems 1 (2011) 7–22 19
Fig. 13. Monitoring layer.
rather then physical. Thus, key concepts from the DNS architecturecan play a role such as delegation and replication.
7.3. Underlying layers for monitoring, modeling, andmanagement
7.3.1. Building-scale web services architectureAs traditional building instrumentation becomes more net-
worked, more diverse, and more pervasive, and as physicalinformation is widely used in a broad range of applications,networked sensors are evolving into tiny embedded informa-tion servers. Web Services can enable the integration of diversesources of physical information, as do diverse conventional sources.Uniform, machine-independent access to self-describing physi-cal information obviates the innumerable drivers and adaptersfor specific sensor and actuator devices found in industrial build-ing automation, process control, and environmental monitoringsolutions. Physical information is in more challenging than conven-tional data because its interpretation is dependent on the behaviorand context of the particular sensor or actuator. Also, the diversityof sensors is large. In many cases, the representation, transporta-tion, and storage of this data must be efficient. While it is easy towrap readings in XML and transport them over HTTP, it is challeng-ing to get widespread agreement on a simple, easily understoodsolution.
An approach based on a simple representation of measurementinformation and actuation events, founded on modern RESTfulweb service techniques, allows for arbitrary architectural com-
position of data sources, freeing application designers from tightframeworks and enabling widespread exploration of the sensor-application arena. We focus on defining a particular web servicefor exchanging physical data. Success means becoming a widelyaccepted interchange format for sensor data on the Internet.
The design space for a web service for physical information con-sists of three areas:
• Metrology the study of measurement; what is necessary to rep-resent a datum.
• Syndication concerns how a data is propagated out from the sen-sor into a larger system.
• Scalability relates to the range of devices and uses the service cansupport, from small, embedded systems to huge Internet datacenters.
Each of these concerns presents a set of design decisions. Wefocus on representing and transmitting physical information.
A prototypical interaction between a client and an instrumentexposing a sMAP interface is as follows. The client contacts thedevice over HTTP and discovers what resources, and thus what datais provided by the instrument. The client first determines what theunits of a particular channel and measurement point are, beforetaking a sample by fetching the reading resource. Finally, the clientarranges for period reports to be delivered to him. Since all commu-nication references a schema, the client can also fetch the schemato validate the data.
Fig. 14. Networking layer.

20 R.H. Katz et al. / Sustainable Computing: Informatics and Systems 1 (2011) 7–22
Fig. 15. Modeling layer.
sMAP forms the basis for a build to electric grid testbed whichprovides fine-grained, multi-resolution sensor data about thebuilding under inspection. The project currently provides around2000 distinct measurement channels. These channels monitorelectricity consumption, environmental quality data, HVAC param-eters, weather data, and more. An early problem we confronted washow to integrate all of these sensors to allow “building applications”to be possible; the answer was sMAP. sMAP is designed to unifyaccess to legacy instruments with a consistent representation andup-to-date technological underpinnings. While many recognize theneed for such integration, much of the work is present in propri-etary products and seeks to interoperate only within the particularindustrial sector. By presenting a simple but carefully consideredspecification along with a substantial amount of data, we can boot-strap the process of making all physical information universallyaccessible.
Fig. 13 shows the lowest, physical level of the building operatingsystem, consisting of the pervasive sensors [21] that monitor theconsumption of energy and the environmental conditions of thephysical space being managed. These provide critical inputs aboutthe current state of the physical world, to drive the developmentof models that in turn form components of the necessary building-scale control systems.
Fig. 14 takes the perspective up to the networking level, in whichthe sensors form a self-organizing network from which their mea-surements can be collected and aggregated for use by higher layersof processing [10,11]. Services are needed here for hiding the het-erogeneity of the underlying sensors and the data they collect.Collection and processing is not limited to the physical space of thebuilding. The collections can be shared across the Internet, whetherit is to aggregate the collection for campus-scale purposes, or tocreate shared repositories from which more flexible models can bederived.
Fig. 15 offers the highest layer, which we have described as thebuilding operating system. This level performs the critical resourceallocation tasks that balance consumption, efficiency, and cost ofenergy to achieve the desired qualities of the environment withinthe building. This where monitoring data and extracted modelscome together to provide the foundation for control systems thatcan actually shape the behavior of the major facilities within thebuilding and their energy consumption. With the necessary openinterfaces defined, such an operating system view would enablewhole new kinds of applications, user interfaces, and services to bedeveloped for energy-efficient buildings of the future.
8. Summary and conclusions
In this paper, we have discussed energy consumption in infor-mation technology equipment and how it serves as a first modelsystem of a supply-following sculptable load. The key idea hereis that of energy proportional computing: consume energy in direct
proportion to the amount of work being performed. A related obser-vation is that most systems are designed to be energy efficient athigh levels of utilization, yet few systems actually operate at theselevels. This suggests a new challenge: design systems to doing noth-ing well. Internet Datacenters are a particularly interesting designpoint, with tens of thousands of computers under one roof, a com-puting facility co-designed with a physical building to achieve lowpower utilization efficiency metrics to minimize the overhead ofdelivering power and cooling to the processor complex. Container-ized datacenters further suggest new packaging opportunities forthe better optimization of computing, communications, power, andmechanical subsystems.
Our group at Berkeley is designing LoCal, a prototype scalableenergy network [19,24]. Considering the inherent inefficiencies atall levels of electrical energy distribution and usage, LoCal inves-tigates how information exchange can better support an energysystem with close integration of energy generation, storage, andconsumption. We are developing energy information interfaces andexchange protocols at a variety of scales including the machineroom, building facility, energy storage, building, and grid genera-tion levels. We feel it is particularly important to explore intelligentloads beyond datacenters to include the whole building and aggre-gations of buildings. The concept of deep demand response andsupply-following loads focus on how energy-aware loads can mod-ify their work functions in response to information about energyavailability and costs.
LoCal is based on a layered architecture founded sensing toobtain information about energy consumption, actuation to affectenergy consumption in component facilities, decision making basedon inputs from sensors and generating outputs to actuators, dis-tributed among multiple sensing/actuating/decision making enti-ties, all of whom communicating through well defined APIs. LoCalmakes it possible to turn non-dispatchable sources into sourceswhose energy can be matched to agile, supply-following loads. Thisis an alternative for integrating distributed energy resources, bydeveloping loads that can closely follow varying supplies.
These systems demonstrate the ways in which information canbe exploited to yield a more efficient energy system. While newenergy sources and storage technologies are of crucial importance,this paper has shown the essential value of an underlying infor-mation architecture for the Smart Grid. Information exchange andbetter awareness of energy availability and load profiles can be usedto more accurately match supplies to loads, integrating renewablesources, achieving higher levels of overall energy efficiency, andavoiding the need to grossly overprovision the energy system.
References
[1] S. Alspaugh, L. Keys, A. Krioukov, P. Mohan, D. Culler, R.H. Katz, NapSAC: Designand Implementation of a Power-Proportional Web Server, in: First ACM SIG-COMM Workshop on Green Networking, New Delhi, India, August 2010.
[2] California Air Resources Board, http://www.arb.ca.gov/cc/cc.htm.

R.H. Katz et al. / Sustainable Computing: Informatics and Systems 1 (2011) 7–22 21
[3] L.A. Barroso, U. Holze, The case for energy-proportional computing, IEEE Com-puter 40 (12) (December 2007) 33–37.
[4] R. Bianchini, R. Rajamony, Power and energy management for server systems,IEEE Computer 37 (11) (November 2004) 68–74.
[5] California Independent System Operator, http://www.caiso.com/.[6] The Climate Group. SMART 2020: Enable the Low Carbon Economy in the Infor-
mation Age, see http://www.smart2020.org/.[7] S. Dawson-Haggerty, X. Jiang, G. Tolle, J. Ortiz, D. Culler, sMAP: a simple mea-
surement and actuation profile for physical information, in: ACM Sensys 10,Zurich, Switzerland, November, 2010.
[8] U.S. Energy Information Administration, Annual Energy Review, U.S. Depart-ment of Energy, 2009, see http://www.eia.doe.gov.
[9] U.S. Energy Efficiency and Renewable Energy, State Activities and Partnerships,U.S. Department of Energy, 2010.
[10] P. Dutta, D.E. Culler, System Software techniques for low-power operation inwireless sensor networks, ICCAD (2005) 925–932.
[11] P. Dutta, D. Culler, Practical asynchronous neighbor discovery and rendezvousfor mobile Sensig applications, in: ACM SenSys 08, Raleigh, NC, November,2008.
[12] Environmental Protection Agency, 2007.[13] X. Fan, W.-D. Weber, L.A. Barroso, Power provisioning for a warehouse-sized
computer, in: ISCA’07, San Diego, CA, August, 2007.[14] R. Gonzalez, M. Horowitz, Energy dissipation in general-purpose microproces-
sors, IEEE Journal of Solid-State Circuits (1996) 1277–1284.[15] http://www.google.org/powermeter/.[16] Data Center Efficiency Measurements, Google Inc., 2010,
http://www.google.com/corporate/green/datacenters/measuring.html.[17] M. Gupta, S. Singh, The Greening of the Internet, in: ACM SIGCOMM 2003,
Karlsruhe, Germany, August, 2003.[18] James Hamilton, http://perspectives.mvdirona.com/.[19] M. He, E. Reutzel, D. Culler, R.H. Katz, S. Sanders, An architecture for local
energy generation, distribution, and sharing, in: Proceedings of IEEE Energy2030 Conference, Atlanta, GA, November, 2008.
[20] K. Hedman, R. O’Neill, E. Bartholomew Fisher, S.S. Oren, Optimal transmissionswitching with contingency analysis, IEEE Transactions on Power Systems 24(3) (2009) 1577–1586, May.
[21] X. Jiang, S. Dawson-Haggerty, P. Dutta, D. Culler, Design and Implementationof a high-fidelity AC metering network, in: 8th International Conference onInformation Processing in Sensor Networks, IPSN SPOTS 2009, April, 2009.
[22] S.U. Khan, I. Ahmad, A cooperative game theoretical technique for joint opti-mization of energy consumption and response time in computational grids,IEEE Transactions on Parallel and Distributed Systems 20 (3) (2009) 346–360,March.
[23] S. Keshav, C. Rosenberg, How Internet concepts and technologies can helpgreen and Smarten the electrical grid, in: ACM Sigcomm Workshop on GreenNetworking, New Delhi, India, August, 2010.
[24] http://local.cs.Berkeley.edu.[25] J. Mitchell-Jackson, J.G. Koomey, B. Nordman, M. Blazek, Data center power
requirements: measurements from Silicon Valley, Energy (Energy) 28 (4)(2003) 837–850, ISSN 0360-5442.
[26] Jorge Ortiz, David Culler. A System for Managing Physical Data in Buildings.Technical Report No. EECS-2010-128, EECS Department, University of Califor-nia, Berkeley 2010.
[27] See http://www.sgi.com/products/data center/.[28] Jeremy Rifkin, The Third Industrial Revolution: Leading the Way to a Green
Energy Era and a Hydrogen Economy, http://www.foet.org/lectures/lecture-hydrogen-economy.html.
[29] See http://www.sun.com/service/sunmd/.[30] UBS Research Focus, Climate Change: Beyond Whether, January 2007.
Randy H. Katz received his undergraduate degree fromCornell University, and his M.S. and Ph.D. degrees fromthe University of California, Berkeley. He joined the Berke-ley faculty in 1983, where since 1996 he has been theUnited Microelectronics Corporation Distinguished Pro-fessor in Electrical Engineering and Computer Science. Heis a Fellow of the ACM and the IEEE, and a member ofthe National Academy of Engineering and the AmericanAcademy of Arts and Sciences. He has published over 250refereed technical papers, book chapters, and books. Hehas supervised 49 M.S. theses and 39 Ph.D. dissertations.His recognitions include 13 best paper awards (includingone “test of time” paper award and one selected for a 50-
year retrospective on IEEE Communications publications), three best presentationawards, the Outstanding Alumni Award of the Computer Science Division, the CRAOutstanding Service Award, the Berkeley Distinguished Teaching Award, the CS Divi-sion’s Diane S. McEntyre Award for Excellence in Teaching, the Air Force ExceptionalCivilian Service Decoration, the IEEE Reynolds Johnson Information Storage Award,the ASEE Frederic E. Terman Award, the IEEE James H. Mulligan Jr. Education Medal,the ACM Karl V. Karlstrom Outstanding Educator Award, and the ACM SigmobileOutstanding Contributor Award.
David E. Culler received his B.A. from UC Berkeley, 1980,and a M.S. and Ph.D. from MIT, 1985 and 1989 respectively.He joined the EECS faculty in 1989 and is the foundingDirector of Intel Research, UC Berkeley and the AssociateChair of the EECS Department. He is a member of theNational Academy of Engineering, an ACM Fellow, andwas selected in Scientific American Top 50 Researchersand Technology Review 10 Technologies that Will Changethe World. He was awarded the NSF Presidential YoungInvestigator and the Presidential Faculty Fellowship. Hisresearch addresses networks of small, embedded wirelessdevices, planetary-scale Internet services, parallel com-puter architecture, parallel programming languages, and
high performance communication.
Seth R. Sanders is a Professor of Electrical Engineeringin the Department of Electrical Engineering and Com-puter Sciences at the University of California, Berkeley. Hereceived S.B. degrees (1981) in Electrical Engineering andPhysics, and the S.M. (1985) and Ph.D. (1989) degrees inElectrical Engineering from the Massachusetts Institute ofTechnology, Cambridge. Following an early experience asa Design Engineer at the Honeywell Test Instruments Divi-sion in 1981–1983, he joined the UC Berkeley faculty in1989. His research interests are in high-frequency powerconversion circuits and components, in design and con-trol of electric machine systems, and in nonlinear circuitand system theory as related to the ower electronics field.
Dr. Sanders is presently or has recently been active in supervising research projectsin the areas of flywheel energy storage, novel electric machine design, renewableenergy, and digital pulse-width modulation strategies and associated IC designs forpower conversion applications. During the 1992–1993 academic year, he was onindustrial leave with National Semiconductor, Santa Clara, CA. Dr. Sanders receivedthe NSF Young Investigator Award in 1993 and multiple Best Paper Awards from theIEEE Power Electronics and the IEEE Industry Applications Societies. He has servedas Chair of the IEEE Technical Committee on Computers in Power Electronics, andas a Member-At-Large of the IEEE PELS Adcom. He is an IEEE Fellow.
Sara Alspaugh is a second year graduate student at theUniversity of California, Berkeley pursuing a PhD in com-puter science. She is advised by Dr. Randy Katz. She isthe recipient of a National Science Foundation Gradu-ate Research Fellowship. Her research interests includedesigning energy efficient large-scale computing systemsand applying computer science techniques to improvingthe electric grid. She received her BA in computer scienceand mathematics in 2009 from the University of Virginia.
Yanpei Chen is a fourth year Ph.D. student working withProfessor Randy Katz. He received a B.S. in EECS from UCBerkeley in 2007, and a M.S. from the same departmentin 2009. His research interests include energy efficiencyfor MapReduce, and Internet data center performancemeasurement in general. He holds a National ScienceFoundation Graduate Research Fellowship.
Stephen Dawson-Haggerty is a computer science gradu-ate student at Berkeley. He works on enabling ubiquitousaccess to data collected from the world, moving from theembedded sensor tier into the cloud. He has an undergrad-uate degree from Harvard University and a Masters fromUCB.

22 R.H. Katz et al. / Sustainable Computing: Informatics and Systems 1 (2011) 7–22
Prabal Dutta is an Assistant Professor in EECS at theUniversity of Michigan. He received his Ph.D. from theUniversity of California, Berkeley in 2009. His researchinterests straddle the hardware/software interface andinclude embedded systems, networking, and architecture,with a focus on low-power, wireless embedded systems.His research has enabled some of the largest sensor net-works deployed to date including the 1000+ node ExScalproject and the 557 node DARPA NEST Final Experiment.He was a National Science Foundation Graduate ResearchFellow and a Microsoft Research Graduate Fellow.
Mike He is currently a Ph.D. student at the University ofCalifornia, Berkeley in Electrical Engineering. The topicof his thesis is low cost solar thermal electric generationwith Stirling engines. He is a National Science FoundationFellow. He graduated from the University of Wisconsin– Madison in 2006 with a B.S. in Electrical Engineering,Math, and Physics. His past jobs have included work as aresearch engineer at GE Research, as a software program-mer at Epic Software, and as a research assistant at a cancerresearch lab.
Xiaofan Jiang received his undergraduate and graduatedegrees from U.C. Berkeley in 2004 and 2010 respectively.He is currently a member of technical staff at MicrosoftResearch in Beijing China.
Laura Keys received her undergraduate degree fromWashington University in St. Louis and her M.S. degreefrom Berkeley in 2010. She is currently a member of tech-nical staff at the IBM Zurich Research Laboratory.
Andrew Krioukov is a Ph.D. student working with Prof.David Culler. His research interests include cluster powermanagement and integrating computer and electrical sys-tems. He is a recipient of the NSF Graduate ResearchFellowship. He received a BS in computer engineeringfrom the University of Wisconsin, Madison.
Ken Lutz received a BSEE degree in Electrical Engineer-ing from the University of California, Davis in 1979. From1985 till 1998, he was connected to the University ofCalifornia, Berkeley as technical staff leader. In 1998,he became Director of Technical Operations at Inktomi,responsible for the management of technical staff, defin-ing operational quality and performance requirements for24 " 7 " 365 revenue producing systems. He is currentlythe Executive Director for the GSRC.
Jorge Ortiz graduated from MIT in 2003 with a degreein Electrical Engineering and Computer Science. He iscurrently a Ph.D. student at the University of California,Berkeley.
Prashanth Mohan is a graduate student in ElectricalEngineering and Computer Science at the University ofCalifornia Berkeley. He received his undergraduate degreefrom the College of Engineering, Guindy in India.
Evan Reutzel is a graduate student in Electrical Engineering and Computer Scienceat the University of California, Berkeley. His research focuses on bidirectional powergrid interfaces.
Jay Taneja is a Ph.D. candidate advised by Prof. DavidCuller at the University of California, Berkeley. Hisresearch interests include applications of networked sens-ing and embedded systems. He received his M.S. inComputer Science from Berkeley in 2007 and his B.S. inElectrical and Computer Engineering from The Ohio StateUniversity in 2005. He expects to finish his dissertation in2011.
Jeff Hsu is an undergraduate researcher for the LoCalGroup and the Wireless Embedded Systems group atthe University of California, Berkeley. His research inter-ests include energy-efficient buildings and technology fordeveloping regions. His past technical experiences involvedesign work on the A4 chip used by Apple’s iPhone 4 andthe iPad, and founding the technology behind MobilizingHealth, a non-profit organization that connects doctors tomedically underserved masses of rural villages in Indiathrough text messages.
Sushat Shankar graduated with a degree in ElectricalEngineering and Computer Science from the University ofCalifornia, Berkeley in 2010. He has just begun a graduatedegree program at Stanford University in Fall 2010.