sustainable cities and society - doc-pak.undip.ac.id
TRANSCRIPT

Contents lists available at ScienceDirect
Sustainable Cities and Society
journal homepage: www.elsevier.com/locate/scs
The spatio-temporal trends of urban growth and surface urban heat islandsover two decades in the Semarang Metropolitan Region
Anang Wahyu Sejatia,b,c,⁎, Imam Buchoria,c, Iwan Rudiartoa
a Department of Urban and Regional Planning, Universitas DiponegorobDoctoral Programme in Architecture and Urbanism, Universitas Diponegoroc Centre of Geomatics Application for Sustainable Development (CEGAS), Universitas Diponegoro
A R T I C L E I N F O
Keywords:Sustainable environmentSemarang metropolitan region (SMR)Land use and land cover changeUrbanisationSUHIRemote sensingStochastic cellular automata-markov chain
A B S T R A C T
This paper conveys the findings of a study of the development of Semarang Metropolitan Region (SMR) over twodecades. The developments seen were urbanisation and its impact on Surface Urban Heat Islands (SUHI). Thisresearch used remote sensing data satellite imagery of Landsat 5 TM and Landsat 8 OLI to see land cover changefrom 1998 to 2018. Furthermore, to predict the land cover change, this research used a Stochastic CellularAutomata-Markov Chain (SCA-MC) algorithm. Measurements of the LST and SUHI used Landsat products withThermal Infra-Red Sensors (TIRS) Band 10 (2018) and TIRS Band 6 (1998). The classification of the results from1998 to 2018 indicates a widespread change in the built-up area of about 74.62%, revealing urban expansion inthe SMR. Moreover, there has been a decline in the vegetation canopy of 36.14%, resulting in an increase inaverage surface temperature of 2–5 °C. Areas with increased surface temperatures reached more than 30 °C,which is an increase of 245.57 km2 from 1998 to 2018. Furthermore, the SCA-MC prediction suggests thescenario to mitigate the SUHI through Spatial planning instruments. Thus, control of development is essential tothe sustainability of the SMR, through land use planning scenarios.
1. Introduction
The New Urban Agenda highlights the problem of sustainable urbangrowth, as currently more than 50% of the world’s population lives inurban areas, a figure which will grow to 66% by 2050, mostly in Asiaand Africa (WHO, 2014). Increasing urban population concentration isa serious problem for all cities in the world because it has a significantimpact on increasing surface temperature and linearly influences ofurban growth (Mathew, Khandelwal, & Kaul, 2018). Increasing tem-peratures have a very large impact on ecosystems at local, regional andglobal Scales that have an impact on the urban environment. The re-lationship between widespread urban areas and surface temperaturessignificantly affect temperature differences between urban and sub-urban, peri-urban, or rural areas. It is known as Surface Urban HeatIsland (SUHI) phenomenon. The first case of SUHI that Howard hadstudied in 1818 (Gartland, 2008; Howard, 2007; Mirzaei & Haghighat,2010) revealed the fact that urban growth is in line with the emergenceof the SUHI, and their results have stimulated the development of si-milar research in several countries to assess their impact.
Several recent studies have indicated that climate change, SUHI,and urban growth are closely related to urban size (Handayani et al.,
2017; Huang & Ye, 2015; Oke, 1973; Pal & Ziaul, 2017; Shwetha &Kumar, 2016). These studies are interesting to examine because the sizeof an urban area is very dynamic and fast growing, and so SUHI isdynamic. Some urban areas are growing rapidly, resulting in urbangrowth and land use land cover change (LULCC), it indeed has ac-celerated the rise in surface temperatures. As stated by the current re-search that Land Use/Land Cover Change (LULCC) are always synon-ymous with the emergence of uncontrolled environmental anddevelopment issues (Buchori & Sugiri, 2016; Du, 2016; Sugiri, Buchori,& Soetomo, 2011). Hence, explicitly, the increase in SUHI is stronglyinfluenced by the city size and the type of land cover (Bokaie,Kheirkhah, Daneshkar, & Hosseini, 2016; Huang & Ye, 2015). For in-stance, Ward, Lauf, Kleinschmit, and Endlicher, (2016) has proven thatland use patterns and urban forms affect the SUHI in Europe. Othercases, Wang, Huang, Fu, Atkinson, and Zhang, 2016; Wang, Ma, Ding, &Liang, 2016) in China, Adeyeri, Akinsanola, and Ishola, (2017) in Ni-geria, and Tran et al. (2017) in Vietnam who have proven the in-vestigation that LULCC affects the SUHI. More details, SUHI also causesan increase in pollutant concentrations in areas that affect local me-teorology. Investigation results from Mirzaei and Haghighat (2010)mentioning the fact that SUHI can cause health problems, the
https://doi.org/10.1016/j.scs.2019.101432Received 27 July 2018; Received in revised form 9 January 2019; Accepted 10 January 2019
⁎ Corresponding author.E-mail addresses: [email protected] (A.W. Sejati), [email protected] (I. Buchori), [email protected] (I. Rudiarto).
Sustainable Cities and Society 46 (2019) 101432
Available online 11 January 20192210-6707/ © 2019 Elsevier Ltd. All rights reserved.
T
emergence of diseases, and cause death in large numbers every year. Itneeds special attention because of the fact that the SUHI incident startsfrom population growth, urban growth, and LULCC.
Rapidly growing populations are projected to accelerate urbangrowth and show the effects of SUHI in Asian cities, thus affecting thequality of life of urban populations. In the last decade, urban growthand its impact on SUHI have been assessed for several rapid growingcities in Asia (Kotharkar & Bagade, 2018; Li et al., 2011; Mathew,Khandelwal, & Kaul, 2016; Qaid, Bin Lamit, Ossen, & Raja Shahminan,2016; Sannigrahi, Bhatt, Rahmat, & Uniyal, 2017), but research on thistopic in Indonesia is lack. Furthermore, urbanisation in Indonesia notonly extends urban size but also changes the structure of land use andpopulation activity because Indonesia has a unique characteristic ofurbanisation (Setyono, Yunus, & Giyarsih, 2016). Indonesia is a fast-growing country and has experienced significant increases in urbanareas in several regions that affect the quality of life in urban areas,especially in the National Strategic Region of Indonesia, such as theSemarang Metropolitan Region (SMR). Both local and global environ-mental issues in the SMR should be responded quickly. Since beingelected in the list of 100 Resilience Cities in 2014, the SMR has animportant role in maintaining urban resilience to global issues, espe-cially climate change. It is now also growing as a metropolitan area thatstrongly affects the surrounding area (Buchori & Sugiri, 2016; Buchori,Pramitasari et al., 2018; Buchori, Sugiri et al., 2018; Sugiri et al., 2011)and has had a powerful influence on its peri-urban area (Giyarsih &Marfai, 2017) especially on urban climate change.
The SMR is experiencing rapid urbanisation and LULCC. The pre-sence of industrial estates in the SMR, particularly in the northern,eastern and southern sectors, has a significant impact on land use shiftsand the growth of built-up areas. This growth in the SMR is 8.2% peryear, and there has been population growth of 1.4% per year since 2000(Sejati, Buchori, & Rudiarto, 2018). Efforts to control urban expansionhave been undertaken, including analysing patterns of urban landconversion and existing urban expansion conditions in the SMR(Buchori & Sugiri, 2016; Sejati et al., 2018; Sugiri et al., 2011).
However, in the long term, spatial monitoring and prediction of landcover changes and their impact on SUHI have not been implemented.Furthermore, other phenomena of climate change such as rob (the In-donesian local term for tidal flood) (Buchori, Sugiri et al., 2018; Marfai& King, 2008; Sejati & Buchori, 2010), alongside the burden of in-dustrial development on the northern coast, causing land subsidence(Marfai & King, 2007), also have an impact on people’s survival in theSMR.
Given that the impact is multi-scale and very serious, the SUHIphenomenon has received considerable attention from researchers invarious environmental fields, such as climatology, ecosystem ecology,urban planning, and sustainable development (Bokaie et al., 2016;Chen, Zhao, Li, & Yin, 2006; Pal & Ziaul, 2017; Rudiarto, Handayani, &Setyono, 2018; Shwetha & Kumar, 2016). Research on SUHI has ob-served and compared urban and rural temperatures with instrumentsbased on remote sensing technology (Chen et al., 2006; El-zeiny & Effat,2017; Wang, Huang et al., 2016; Wang, Ma et al., 2016). Satelliteimagery-based observations are capable of measuring SUHI and urbanland cover changes and can illustrate variations in the distribution ofsurface temperatures in larger areas. In addition, this paper also pre-sents the typology of land use change and predictions made with Sto-chastic Cellular Automata – Markov Chain (SCA-MC) models, so it canpredict land use change and the impact of changes on SUHI (Arsanjani,Helbich, Kainz, & Boloorani, 2012; García, Santé, Boullón, & Crecente,2012; Guan et al., 2011; Moghadam & Helbich, 2013). These predic-tions provide input to land use planning scenarios in the direction ofsustainable development in Indonesia. In this way, this study aims toexamine patterns of LULCC in the last two decades in the SMR and itspotential impact on SUHI. Furthermore, this study also predicts LULCCscenarios as input of SUHI mitigation in SMR.
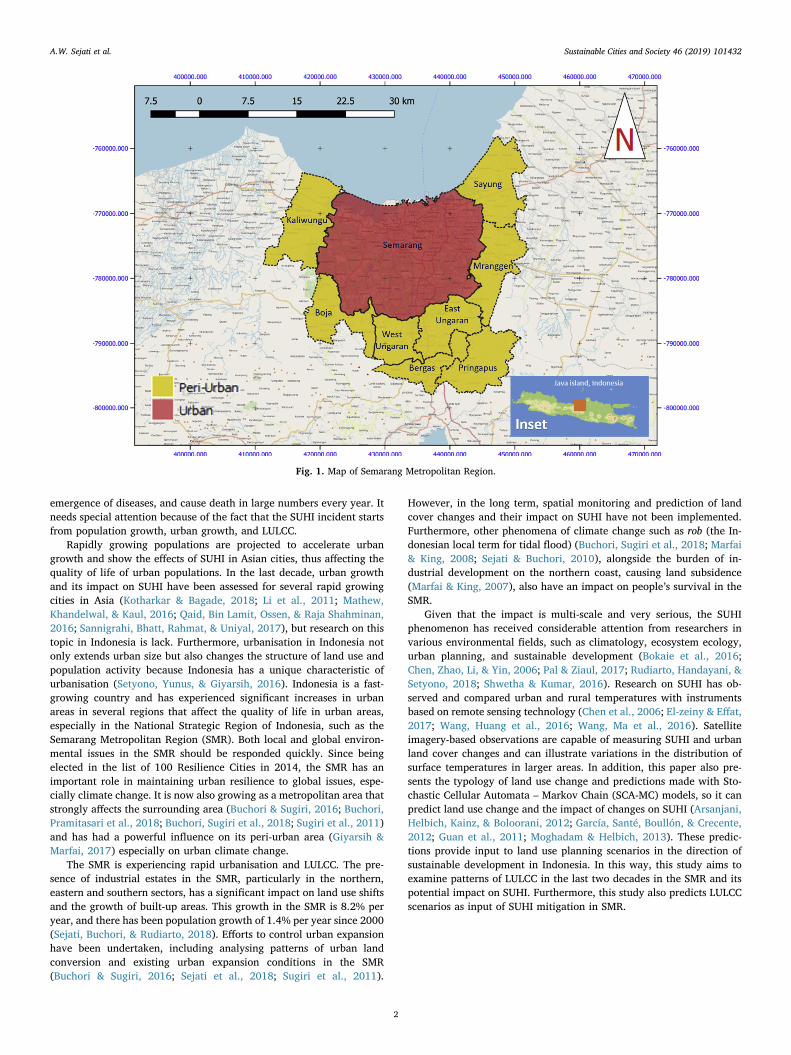
Fig. 1. Map of Semarang Metropolitan Region.
A.W. Sejati et al. Sustainable Cities and Society 46 (2019) 101432
2

2. Study area and methods
2.1. Study area
The study area is the Semarang Metropolitan Region (SMR) (lati-tude 6° 58 °S, longitude 110° 25 °E). Administratively, the region inIndonesia is divided into cities and regency. Most urban areas in the cityand peri-urban areas are in adjacent regencies. SMR consists ofSemarang City (urban area) and three Regencies (peri-urban area) thathave been affected by urban growth; Kendal (District Kaliwungu andBoja), Demak (District Sayung and Mranggen), and Semarang Regency(District West Ungaran, East Ungaran, Pringapus, and Bergas) (seeFig. 1) (Rudiarto, Handayani, Pigawati, & Pangi, 2013; Sejati et al.,2018).
2.2. Landsat product for spatial image analysis
This study used Landsat satellite imagery from 1998 (Landsat 5 TM)and 2018 (Landsat 8 OLI). These years became the reference for spatio-temporal change over 20 years. Product information (Table 1) providesan overview of the year of acquisition and some information on con-stants to see changes in the surface temperature of the Earth. Further-more, to see the link to land cover, the band combination informationneeds to be presented (Table 2). This provides information on how toview urban and non-urban areas as well as some other uses seen fromland cover (Fig. 2).
2.3. Land use and land cover analysis (LULCC)
2.3.1. Gaussian mixture methodsAccording to the field of land cover classifications, this research
used the supervised classification technique with a Gaussian MixtureMethods approach. Sample trainings used were 50 samples representingeach land cover in detail. This method is a part of the Machine LearningAlgorithm, that used to learn the image character of the colour samplefrom the sample training with QGIS and dzetsaka tools (Karasiak,2017).
2.3.2. Markov chain transition and stochastic cellular automataA Markov Chain is a transitional rule change from one type of pixel
to another pixel value (Helbich, Darvishi Boloorani, Jokar Arsanjani, &Kainz, 2012; Moghadam & Helbich, 2013). In image analysis usingremote sensing data, the change in pixel value indicates mostly thechange of land cover (Moghadam & Helbich, 2013). Changes were seenfrom pixel values converted into square km, so that the area of changecan be calculated; thus, this transition matrix becomes the basis of thecellular automata model (Guan et al., 2011; Mitsova, Shuster, & Wang,2011; Yang, Zheng, & Lv, 2012). Generally, the winning cells representthe number of cells with one particular dominant land function. This islike a biological metaphorical process in which raster data containingcells can change cell value if there is a dominant agent, such as a black
(urban) change in a white (non-urban) area at a given time (t) in achange scenario (Liu, 2009).
The modelling scenario used two periods of 20 years from 1998 to2018 and 2018–2038. The results from the 20 years before and after2018 can be measured and directed. This study used the year 1998 as areference because in that year there was an economic crisis inIndonesia. This year was a turning point for the economies of states inAsia, especially Indonesia, because it had to survive the monetary crisisof 1998. By using the period 1998–2018, the picture of urban growthwill help evaluate the impact of SUHI. In addition, the images of urbangrowth as an economic indicator can be evaluated by using environ-mental sustainability indicators, which in this case is an increase in thesurface temperature of the land. SCA-MC-model validation (2038) usedKappa Coefficient (Wang, Hasbani, Wang, & Marceau, 2011). Kappastatistic reflects the difference between actual agreement and theagreement expected by chance. For example, Kappa of 0.85 meansthere is 85% better agreement. The formula for kappa was illustrated inEq. (1)
Kappa = (P0 − Pe)/(1 − Pe) (1)
where P0 is the estimated observation accuracy and Pe is the expectedobservation accuracy. The Kappa index was devided into five categorieswith detail information is in the Table 3.
2.4. Surface urban heat island analysis
2.4.1. Conversion of digital number to TOA radianceConversion of DN to TOA Radiance was used in accordance with the
calculation formula on the Landsat product of USGS. The calculationformula used product information obtained from a metafile fromLandsat of each TIRS band, namely band 10 for Landsat OLI and band 6for Landsat 5 TM. The calculation is shown by Eq. (2).
Lλ = MLQcal+AL (2)
where: Lλ is TOA spectral radiance (Watts/(m2 * srad * μm)), ML is aBand-specific multiplicative reSCA-MCling factor from the metadata(RADIANCE_MULT_BAND (RMB)_x, where x is the band number), AL isa band-specific additive reSCA-MCling factor from the metadata(RADIANCE_ADD_BAND_(RAB)x, where x is the band number), andQcal is Quantised and calibrated standard product pixel values (DN)(see Table 1).
2.4.2. Land surface temperatureTo see the spatial distribution of surface temperature, an LST cal-
culation was performed which also used TIRS band data and theAtmosphere Correction calculation result. TIRS band data can be con-verted from spectral radiance to the top of the atmosphere by thethermal constants provided in the metadata file, as in Eq. (3).
=
+( )T K
ln 1KL
2
λ1
(3)
Where: T is the top of the atmosphere brightness temperature (K), Lλ isTOA spectral radiance (Watts/(m2 * srad * μm)), K1 is band-specificthermal conversion constant from the metadata (K1_CONST-ANT_BAND_x, where x is the thermal band number), and K2 is band-specific thermal conversion constant from the metadata (K2_CONST-ANT_BAND_x, where x is the thermal band number (see Table 1)).
Table 1Landsat Product Information for LST Analysis.
No Year Type Date_acquired Band RMB RAB K1 K2
1 2018 Landsat 8 OLI 2018-05-05 10 0.00033420 0.1 774.8853 1,321.07892 1998 Landsat 5 TM 1998-08-02 6 0.055375 1.18243 607.76 1,260.56
Table 2Landsat Composite Band for Urban Detection.
Type Band Combination Detection
Landsat 8 OLI (2018) R=7; G=6; B= 4 Urban and Land CoverLandsat 5 TM (1998) R=5; G=4; B= 3 Urban area (Special-color)
A.W. Sejati et al. Sustainable Cities and Society 46 (2019) 101432
3

3. Results
3.1. LULCC from 1998 to 2018
The area shift from non-built up to build-up area in urban and periurban area was based on the satellite image classifications in 1998 and2018, as shown in Fig. 3. In 1998, the built-up area centred on theSemarang City (urban area) and the main line of transportation.However, its presence in the centre of Semarang City looked moreprominent than in the peri-urban (Fig. 3 (a)). In contrast, built-up areasin 2018 are more diffuse and there has been some leapfrog or urbansprawl (Fig. 3 (b)). In 2018, the analysis also shows that urban ex-pansion has spread to the north, east and south peri-urban SMR, such asSayung and Mranggen sub-districts, West Ungaran and East Ungaran.Only few can be seen separately, in the Kaliwungu (Kendal Regency)section. This shows that in the period 1998–2018, urban expansion hasdominated the coastal areas north and east of Semarang City.
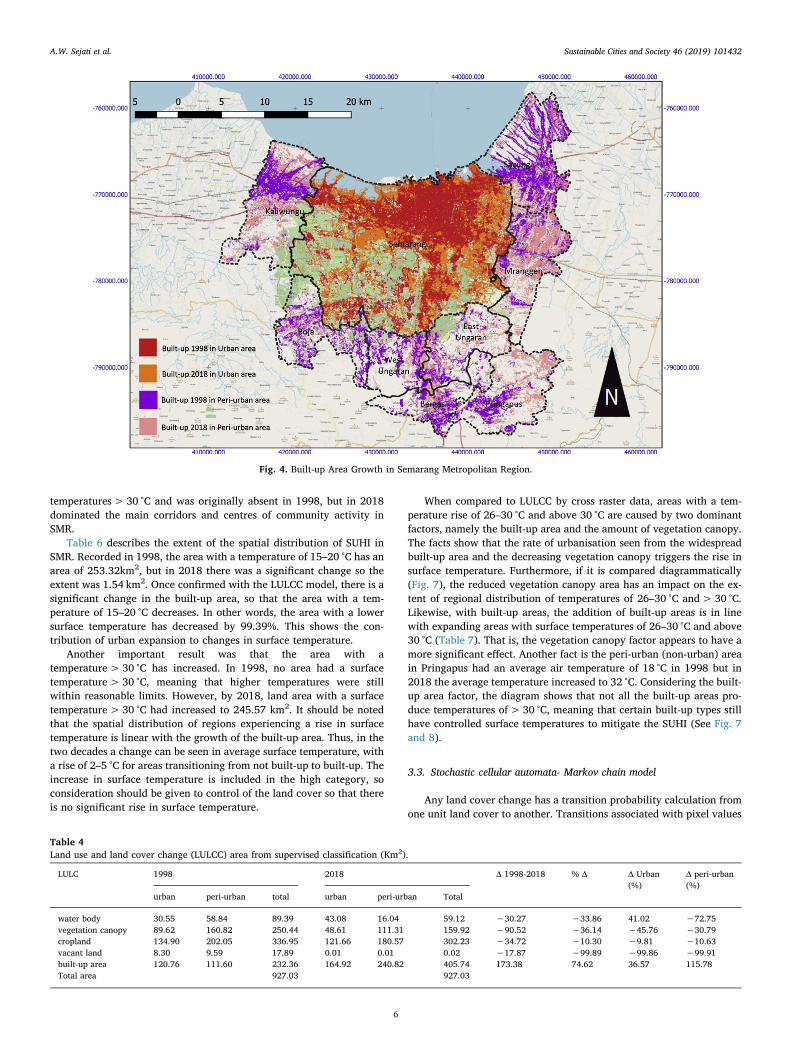
However, there was a different situation on the southern side. Theexistence of urban sprawl was due to the educational centres in thesouth, such as the existence of the Diponegoro University, SemarangState Polytechnic, and the emergence of new commercial centres inSouth SMR (Fig. 3(b)). Furthermore, new industrial centres have alsodeveloped in the southern SMR, such as in East Ungaran, Bergas, andthe Pringapus corridors, where the industry also sprawls. Peri-urbandominates the growth of Buit-up area in 2018, which is up by 115.78%compared to 1998. Meanwhile, the growth of built-up in Urban areas in2018 is only 36.57% compared to 1998 (Fig. 4 and Table 4). This showsthat the growth of development in peri-urban areas runs more rapidlythan in urban areas. Urban expansion had also spread to the west partof the SMR in the Kendal Regency. The emergence of industrial areassuch as the Special Industrial Zone in Kaliwungu was a trigger for
growth in rural-urban SMR transition areas. In the same period, thedevelopment of the areas built in the southwest only grew along themain corridors of the Semarang-Boja and Semarang-Kaliwungu lines.
Table 4 depicts the change in land cover area from 1998 to 2018.The total built-up area in SMR in 1998 was 232.36 km2, with built-upgrowth in Semarang City dominating SMR. In 2018, the dominance hasfaded, and growth in the city centre is stagnant, but has started to ex-pand into the peri-urban area, especially to the north, east and south.The total built-up area in 2018 was recorded at 405.74 km2. This showsthe change of land from non-built-up to built-up in two decades is173.38 km2 or 74.62%. In contrast, the vegetation canopy and croplandhas decreased significantly (Table 4). The vegetation canopy in 1998was recorded as 250.44 km2, but this had dropped to 159.92 km2 in2018. This shows that vegetation canopy fell 90.52 km2, or by 36.14%.The same condition also occurred for cropland, as in 1998 this covered336.95 km2 and in 2018 it had fallen to 302.23 km2. This shows a de-crease in cropland of 34.72 km2 or 10.3%. Decreasing the area of ve-getation canopy and cropland indicates the conversion of land to an-other form. It is possible that, in the past two decades, land coverchanges have shifted to the built-up area, seeing significant changetrends. The Typology of land use change as shown in Fig. 5 and Table 5.
Fig. 4 and Table 4 also shows urban growth in the SMR and that notall land has been converted into industries or settlements (Built-up).However, a built-up area of nearly 50% still needs to receive seriousattention to maintain environmental sustainability in the SMR. On theother hand, In total, 40% of metropolitan land is still crop land (33%)and vegetation canopy (17%). This means that agricultural and forestactivities, especially the protected area, are maintaining pace withurban growth and expansion. One further interesting feature was thatperi-urban area like Mranggen and Sayung turned out to have moreurban character than the southwestern part of Semarang City.
3.2. Surface urban heat island
Howard’s (1818) theory states that urbanisation has an impact onland surface temperatures, causing SUHI. The SUHI transition from1998 to 2018 is as shown in Fig. 6. Spatially, it can be seen that thenumber of areas with surface temperatures of 26–30 °C and>30 °Cincreased rapidly. The yellow colour, which originally dominated thecity of Semarang as the centre of the SMR, has expanded in the year2018, even to the peri-urban areas of SMR. The red colour indicates
Fig. 2. Landsat Band Combination.
Table 3Kappa Index for Model Accuracy Assessment.
K Strength of Agreement
< 0.2 Poor0.21–0.4 Fair0.41–0.6 Moderate0.61–0.8 Good0.81–1.00 Very Good
A.W. Sejati et al. Sustainable Cities and Society 46 (2019) 101432
4

Fig. 3. LULCC 1998–2018 in Semarang Metropolitan Region; (a) LULC 1998; (b) LULC 2018.
A.W. Sejati et al. Sustainable Cities and Society 46 (2019) 101432
5
temperatures> 30 °C and was originally absent in 1998, but in 2018dominated the main corridors and centres of community activity inSMR.
Table 6 describes the extent of the spatial distribution of SUHI inSMR. Recorded in 1998, the area with a temperature of 15–20 °C has anarea of 253.32km2, but in 2018 there was a significant change so theextent was 1.54 km2. Once confirmed with the LULCC model, there is asignificant change in the built-up area, so that the area with a tem-perature of 15–20 °C decreases. In other words, the area with a lowersurface temperature has decreased by 99.39%. This shows the con-tribution of urban expansion to changes in surface temperature.
Another important result was that the area with atemperature> 30 °C has increased. In 1998, no area had a surfacetemperature> 30 °C, meaning that higher temperatures were stillwithin reasonable limits. However, by 2018, land area with a surfacetemperature> 30 °C had increased to 245.57 km2. It should be notedthat the spatial distribution of regions experiencing a rise in surfacetemperature is linear with the growth of the built-up area. Thus, in thetwo decades a change can be seen in average surface temperature, witha rise of 2–5 °C for areas transitioning from not built-up to built-up. Theincrease in surface temperature is included in the high category, soconsideration should be given to control of the land cover so that thereis no significant rise in surface temperature.
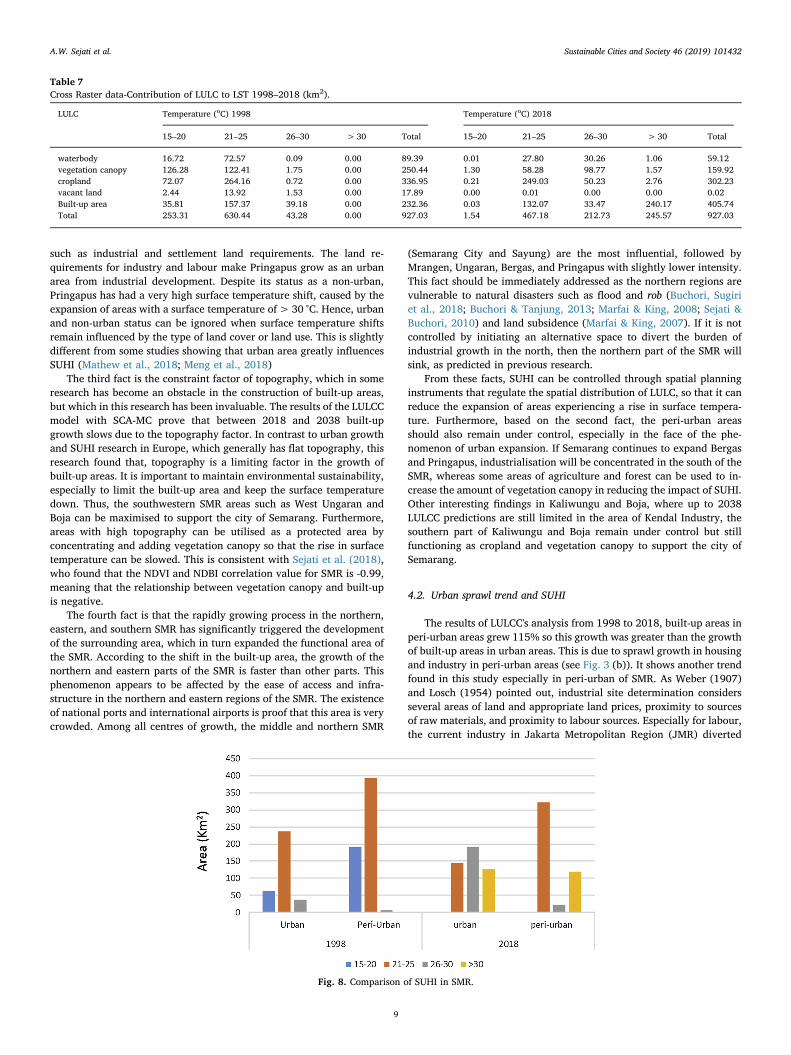
When compared to LULCC by cross raster data, areas with a tem-perature rise of 26–30 °C and above 30 °C are caused by two dominantfactors, namely the built-up area and the amount of vegetation canopy.The facts show that the rate of urbanisation seen from the widespreadbuilt-up area and the decreasing vegetation canopy triggers the rise insurface temperature. Furthermore, if it is compared diagrammatically(Fig. 7), the reduced vegetation canopy area has an impact on the ex-tent of regional distribution of temperatures of 26–30 °C and> 30 °C.Likewise, with built-up areas, the addition of built-up areas is in linewith expanding areas with surface temperatures of 26–30 °C and above30 °C (Table 7). That is, the vegetation canopy factor appears to have amore significant effect. Another fact is the peri-urban (non-urban) areain Pringapus had an average air temperature of 18 °C in 1998 but in2018 the average temperature increased to 32 °C. Considering the built-up area factor, the diagram shows that not all the built-up areas pro-duce temperatures of> 30 °C, meaning that certain built-up types stillhave controlled surface temperatures to mitigate the SUHI (See Fig. 7and 8).
3.3. Stochastic cellular automata- Markov chain model
Any land cover change has a transition probability calculation fromone unit land cover to another. Transitions associated with pixel values
Fig. 4. Built-up Area Growth in Semarang Metropolitan Region.
Table 4Land use and land cover change (LULCC) area from supervised classification (Km2).
LULC 1998 2018 Δ 1998-2018 % Δ Δ Urban(%)
Δ peri-urban(%)
urban peri-urban total urban peri-urban Total
water body 30.55 58.84 89.39 43.08 16.04 59.12 −30.27 −33.86 41.02 −72.75vegetation canopy 89.62 160.82 250.44 48.61 111.31 159.92 −90.52 −36.14 −45.76 −30.79cropland 134.90 202.05 336.95 121.66 180.57 302.23 −34.72 −10.30 −9.81 −10.63vacant land 8.30 9.59 17.89 0.01 0.01 0.02 −17.87 −99.89 −99.86 −99.91built-up area 120.76 111.60 232.36 164.92 240.82 405.74 173.38 74.62 36.57 115.78Total area 927.03 927.03
A.W. Sejati et al. Sustainable Cities and Society 46 (2019) 101432
6

can be modelled by using a Markov Chain. A transition in one of the twotypes of land use affects the other. Imagine a set of transition prob-abilities in which there is a conversion of pixel values from non-built-upland to built-up or developed land in the other direction. The matrix forthis case can be helpful in establishing the assumption as the basis forshowing the pattern of subsequent changes of the probability indexvalue.
The result of the Markov Chain transition model (Table 8) describesthe transition pattern from 1998 to 2018. The transition index in eachcolumn can explain the possibilities that have occurred in the SMR. We
can observe the transition index values for water body, vegetation ca-nopy, crop land, and vacant land into a built-up area. Transition valueindicates a number above 0.3, and means that there is a 30% possibilityof the total land area or pixel value changing into built-up area. If it isassociated with the built-up area dominance in Fig. 5, then the prob-ability of all types of land cover being turned into a built-up area isgreat. This indicates that it is possible for urbanisation to occur in thenext 20 years, and indicates that the growing urban size is very dy-namic. The picture for land cover changes to vacant land is similar. TheMarkov Chain index showed 0.000, meaning that the growth of landcover in the SMR has no tendency to return to vacant land. Further-more, this change scenario can be carried out with the record of nopolicy intervention, meaning that if there are policy factors such as de-industrialisation, these occur outside the simulation system.
The simulation of the Stochastic Cellular Automata-Markov Chain(SCA-MC) model used a basic transition matrix built with the concept ofa Markov Chain. In the transition matrix describing the transitionpattern from the previous 20 years, from 1998 to 2018, the SCA-MCgenerates against the pattern of change over the next 20 years. Thissimulation result consists of two scenarios. The first scenario was for“do nothing scenario” and the second one was for “do something sce-nario”. For the second scenario, the model involves the spatial planning
Fig. 5. LULCC in Semarang Metropolitan Region 1998–2018 (Km2).
Table 5Typology of Land use Change (1998–2018) in SMR (Km2).
From | To WaterBody
VegetationCanopy
Cropland VacantLand
Built-uparea
Water Body 51.77 1.59 5.62 0.01 30.39Vegetation
Canopy0.41 84.88 93.69 0.00 71.44
Cropland 0.20 53.39 157.01 0.00 126.33Vacant Land 0.35 2.21 3.67 0.00 11.64Built-up area 3.36 17.80 42.23 0.00 165.92
Fig. 6. Land Surface Temperature Transition in SMR.
A.W. Sejati et al. Sustainable Cities and Society 46 (2019) 101432
7

instruments like topography, protected area, and the existence of theroad network. The running result of the SCA-MC model is as in Fig. 9.When considering the spatial transition results of LULCC from 2018 to2038, there is a very strong contrast between 1998 and 2018. Table 9provides an actual picture of the transition results of converted pixels inunits of km2 to know the character of urban growth in the SMR in 2038.
The SCA-MC model produces two scenarios. The first scenario,urban growth naturally without intervention by spatial planning in-struments as a constaint factor. The results of the first scenario, thebuilt-up area increased 42.07 Km2 or 10.36% from 2018. Whereas inthe second scenario, the model accommodates spatial planning com-ponents, namely topography, protected areas, and the existence of themain transportation lines. The results of the second scenario, increasedup to 38.79 km2 or 9.5%. The number of built-up areas in the secondscenario is smaller than in the first scenario. However, more importantis the existence of an increased canopy vegetation in the second sce-nario. By utilizing protected areas as areas where there should be nodevelopment, built-up growth can be controlled especially in south-western of SMR.
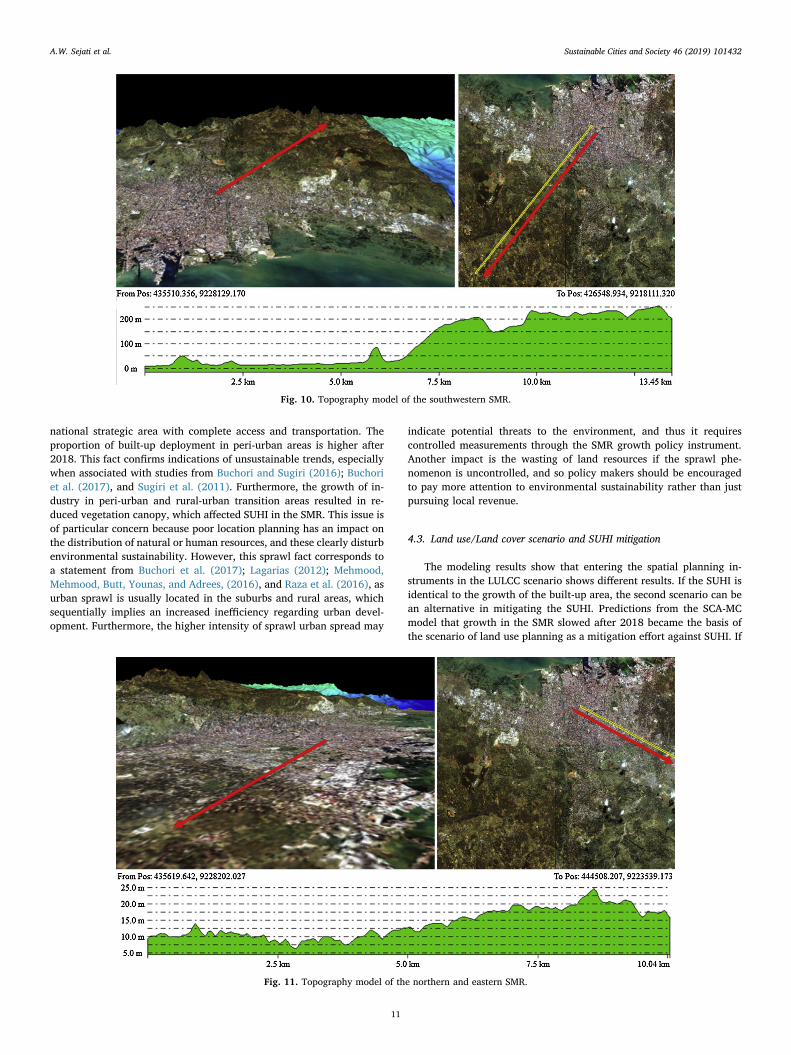
It is known that the southwestern SMR has not developed as a built-up area since 1998, which means that topographic factors greatly affectthe growth of the region. To provide evidence of this, the topography ismodelled separately to compare built-up areas, which maintain growthwith slower growing areas. Fig. 10 shows that built-up areas do notdevelop due to topography constraints. With 2D and 3D modelling(Figs. 10 and 11), it can be concluded that the topography changesdrastically at distances more than 5 km from downtown. The originalaltitude of between 0–20m changes to 50–200m with slopes of up to25%. This rise in topographic value means that the southwestern SMR isunattractive as a residential or industrial area.
In line with the SCA-MC modelling results, the northern and easternregions of the SMR become an area that continues to grow as a built-uparea. This growth is supported by a relatively flat topography conditionwith a height of between 0–25m and 0–8% slope (Fig. 11), making iteasy for the development of built-up areas. The built-up area develop-ment is different in each part of the SMR region because the
relationship between topography and development financing is verystrong. Areas with flat topography minimise costs, especially in ma-turation and land engineering, and vice versa, the higher the slope andtopography, the greater the cost for development. When compareddiagrammatically (Fig. 12), it appears that built-up areas will continueto grow in 2038, but slowed in relation to changes between 1998 and2018. The growth chart of 2018–2038 is gentler than the shifts in1998–2038, as the availability of ready-to-build land becomes limiteddue to topographic characteristics. Validation of this model uses Kappafrom the 2018 projection map with existing 2018 maps with the resultas illustrated in Fig. 13. The Kappa Index is 0.5217 (accuracy is Mod-erate).
4. Discussion
4.1. Impact of LULCC to SUHI
This study reveals the presence of a dominant type of LULCC factoron the changing spatial distribution of SUHI in two decades. The SMRurban growth trend in the last 20 years represents a positive spike butthere is a strong, observable environmental context, which is the re-duction of canopy vegetation. This finding confirms four facts. Firstly,The investigation of LULCC and SUHI in SMR proof the Howard's theory(1818) and studies in several countries (Adeyeri et al., 2017; Tran et al.,2017; Wang, Huang et al., 2016; Wang, Ma et al., 2016; Ward et al.,2016), urban expansion has expanded the size of the city, and thusregions with rising surface temperatures have become more wide-spread. Urban growth has an impact on peri-urban development so thatthe growth of SMR from 1998 to 2018 (see Fig. 3) is more dynamic inperi-urban areas. Secondly, the results are contrary to the findings ofsome previous studies on urban growth in Pringapus areas. In this area,it was found that urban dynamics do not always expand to the nearestarea because in real conditions there is also a sprawl growth pattern.This is in line with the ideas of Buchori, Sugiri, Maryono, Pramitasari,and Pamungkas, (2017) which state that the leap-frog growth trend willbe a challenge in the SMR, mainly because of special towing factors
Table 6Distribution area of LST 1998–2018 (km2).
Temperature (oC) 1998 2018 Δ 1998-2018 % Δ % Δ Urban % Δ Peri-urban
Urban Peri-Urban Total urban peri-urban total
15–20 61.92 191.39 253.31 0.10 1.44 1.54 −251.77 −99.39 −99.84 −99.2521–25 237.12 393.32 630.44 144.35 322.83 467.18 −163.26 −25.90 −39.12 −17.9226–30 37.30 5.98 43.28 191.19 21.55 212.74 169.46 391.54 412.56 260.45> 30 0.00 0.00 0.00 127.06 118.51 245.57 245.57 0.00 127.06 118.51Total Area 927.03 927.03
Fig. 7. Comparison of area with vegetation canopy and Built-up with area by temperature 26–30 °C and>30 °C.
A.W. Sejati et al. Sustainable Cities and Society 46 (2019) 101432
8
such as industrial and settlement land requirements. The land re-quirements for industry and labour make Pringapus grow as an urbanarea from industrial development. Despite its status as a non-urban,Pringapus has had a very high surface temperature shift, caused by theexpansion of areas with a surface temperature of> 30 °C. Hence, urbanand non-urban status can be ignored when surface temperature shiftsremain influenced by the type of land cover or land use. This is slightlydifferent from some studies showing that urban area greatly influencesSUHI (Mathew et al., 2018; Meng et al., 2018)
The third fact is the constraint factor of topography, which in someresearch has become an obstacle in the construction of built-up areas,but which in this research has been invaluable. The results of the LULCCmodel with SCA-MC prove that between 2018 and 2038 built-upgrowth slows due to the topography factor. In contrast to urban growthand SUHI research in Europe, which generally has flat topography, thisresearch found that, topography is a limiting factor in the growth ofbuilt-up areas. It is important to maintain environmental sustainability,especially to limit the built-up area and keep the surface temperaturedown. Thus, the southwestern SMR areas such as West Ungaran andBoja can be maximised to support the city of Semarang. Furthermore,areas with high topography can be utilised as a protected area byconcentrating and adding vegetation canopy so that the rise in surfacetemperature can be slowed. This is consistent with Sejati et al. (2018),who found that the NDVI and NDBI correlation value for SMR is -0.99,meaning that the relationship between vegetation canopy and built-upis negative.
The fourth fact is that the rapidly growing process in the northern,eastern, and southern SMR has significantly triggered the developmentof the surrounding area, which in turn expanded the functional area ofthe SMR. According to the shift in the built-up area, the growth of thenorthern and eastern parts of the SMR is faster than other parts. Thisphenomenon appears to be affected by the ease of access and infra-structure in the northern and eastern regions of the SMR. The existenceof national ports and international airports is proof that this area is verycrowded. Among all centres of growth, the middle and northern SMR
(Semarang City and Sayung) are the most influential, followed byMrangen, Ungaran, Bergas, and Pringapus with slightly lower intensity.This fact should be immediately addressed as the northern regions arevulnerable to natural disasters such as flood and rob (Buchori, Sugiriet al., 2018; Buchori & Tanjung, 2013; Marfai & King, 2008; Sejati &Buchori, 2010) and land subsidence (Marfai & King, 2007). If it is notcontrolled by initiating an alternative space to divert the burden ofindustrial growth in the north, then the northern part of the SMR willsink, as predicted in previous research.
From these facts, SUHI can be controlled through spatial planninginstruments that regulate the spatial distribution of LULC, so that it canreduce the expansion of areas experiencing a rise in surface tempera-ture. Furthermore, based on the second fact, the peri-urban areasshould also remain under control, especially in the face of the phe-nomenon of urban expansion. If Semarang continues to expand Bergasand Pringapus, industrialisation will be concentrated in the south of theSMR, whereas some areas of agriculture and forest can be used to in-crease the amount of vegetation canopy in reducing the impact of SUHI.Other interesting findings in Kaliwungu and Boja, where up to 2038LULCC predictions are still limited in the area of Kendal Industry, thesouthern part of Kaliwungu and Boja remain under control but stillfunctioning as cropland and vegetation canopy to support the city ofSemarang.
4.2. Urban sprawl trend and SUHI
The results of LULCC's analysis from 1998 to 2018, built-up areas inperi-urban areas grew 115% so this growth was greater than the growthof built-up areas in urban areas. This is due to sprawl growth in housingand industry in peri-urban areas (see Fig. 3 (b)). It shows another trendfound in this study especially in peri-urban of SMR. As Weber (1907)and Losch (1954) pointed out, industrial site determination considersseveral areas of land and appropriate land prices, proximity to sourcesof raw materials, and proximity to labour sources. Especially for labour,the current industry in Jakarta Metropolitan Region (JMR) diverted
Table 7Cross Raster data-Contribution of LULC to LST 1998–2018 (km2).
LULC Temperature (oC) 1998 Temperature (oC) 2018
15–20 21–25 26–30 >30 Total 15–20 21–25 26–30 >30 Total
waterbody 16.72 72.57 0.09 0.00 89.39 0.01 27.80 30.26 1.06 59.12vegetation canopy 126.28 122.41 1.75 0.00 250.44 1.30 58.28 98.77 1.57 159.92cropland 72.07 264.16 0.72 0.00 336.95 0.21 249.03 50.23 2.76 302.23vacant land 2.44 13.92 1.53 0.00 17.89 0.00 0.01 0.00 0.00 0.02Built-up area 35.81 157.37 39.18 0.00 232.36 0.03 132.07 33.47 240.17 405.74Total 253.31 630.44 43.28 0.00 927.03 1.54 467.18 212.73 245.57 927.03
Fig. 8. Comparison of SUHI in SMR.
A.W. Sejati et al. Sustainable Cities and Society 46 (2019) 101432
9

investment in SMR especially in Bergas and Pringapus. The first factoris the availability of labour and the minimum wage. In the JMR, theminimum wage is very high at over 3 million IDR per month, while theminimum wage in the SMR is still below 2.5 million IDR per month(Central Bureau of Statistics in the JMR and SMR, 2017). In addition,the price of land is also greatly different in the JMR and is very highcompared to the price of land in Pringapus (SMR), so some industries inthe JMR have chosen to relocate to the SMR (Sugiri, Buchori, & Ma’rif,2015).
The result of the SCA-MC model for SMR growth shows that urbansprawl has wide potential to become a trend considering SMR as a
Table 8Markov Chain Transition Matrix of LULCC in SMR.
From 1998 | to 2018 water body vegetation canopy cropland vacant land built-up Total index
water body 0.4924 0.0215 0.0760 0.0000 0.4101 1
vegetation canopy 0.0018 0.2881 0.4029 0.0000 0.3072 1
cropland 0.0007 0.1792 0.3961 0.0000 0.4240 1
vacant land 0.0197 0.1239 0.2056 0.0000 0.6508 1
built-up 0.0376 0.1055 0.2499 0.0000 0.6070 1
Fig. 9. (a) LULC 1998; (b) LULC 2008; (c) LULC prediction for 2038 scenario 1 (s1); (d) LULC prediction for 2038 scenario 2 (s2).
Table 9SCA-MC simulation up to 2038.
LULC 1998 2018 2038 (s1) 2038 (s2)
water body 89.39 59.12 44.82 38.42vegetation canopy 250.44 159.92 144.32 213.38cropland 336.95 302.23 290.04 230.57vacant land 17.89 0.02 0.03 0.12built-up area 232.36 405.74 447.81 444.53total area 927.03 927.03 927.03 927.03
A.W. Sejati et al. Sustainable Cities and Society 46 (2019) 101432
10
national strategic area with complete access and transportation. Theproportion of built-up deployment in peri-urban areas is higher after2018. This fact confirms indications of unsustainable trends, especiallywhen associated with studies from Buchori and Sugiri (2016); Buchoriet al. (2017), and Sugiri et al. (2011). Furthermore, the growth of in-dustry in peri-urban and rural-urban transition areas resulted in re-duced vegetation canopy, which affected SUHI in the SMR. This issue isof particular concern because poor location planning has an impact onthe distribution of natural or human resources, and these clearly disturbenvironmental sustainability. However, this sprawl fact corresponds toa statement from Buchori et al. (2017); Lagarias (2012); Mehmood,Mehmood, Butt, Younas, and Adrees, (2016), and Raza et al. (2016), asurban sprawl is usually located in the suburbs and rural areas, whichsequentially implies an increased inefficiency regarding urban devel-opment. Furthermore, the higher intensity of sprawl urban spread may
indicate potential threats to the environment, and thus it requirescontrolled measurements through the SMR growth policy instrument.Another impact is the wasting of land resources if the sprawl phe-nomenon is uncontrolled, and so policy makers should be encouragedto pay more attention to environmental sustainability rather than justpursuing local revenue.
4.3. Land use/Land cover scenario and SUHI mitigation
The modeling results show that entering the spatial planning in-struments in the LULCC scenario shows different results. If the SUHI isidentical to the growth of the built-up area, the second scenario can bean alternative in mitigating the SUHI. Predictions from the SCA-MCmodel that growth in the SMR slowed after 2018 became the basis ofthe scenario of land use planning as a mitigation effort against SUHI. If
Fig. 10. Topography model of the southwestern SMR.
Fig. 11. Topography model of the northern and eastern SMR.
A.W. Sejati et al. Sustainable Cities and Society 46 (2019) 101432
11

SUHI is identical to built-up growth, then scenarios that might be im-plemented by policy makers include: (1) designating high topographicareas as protected and buffer areas, namely the southwest of SemarangCity and its peri-urban like West Ungaran, Boja, and some parts ofKaliwungu. The function of these areas is as worth keeping of thebalance of canopy vegetation, so it is not changed or used as a built-uparea. It can control the expanding area with high surface temperatures;(2) the built-up area of the northern SMR should be limited, as thepossibility of sea level increases, such as robs, compounded by landsubsidence, may threaten public safety despite adaptation efforts (seeBuchori, Pramitasari et al. (2018), Buchori, Sugiri et al., 2018)). An-other impact in the northern part of the SMR is the built-up areas, mostof which have industries and surface temperatures above 30 °C; if nocontrols are set, then surface temperature can increase and impact onpublic health in the SMR; (3) areas with surface temperatures between26–30 °C and above 30 °C are required to plant, in particular to plantcanopy vegetation in their settlement environment; (4) the southernpart of the SMR such as Pringapus and Bergas must have immediateplanned control and restrictions on the growth of rural industries.
SUHI mitigation is closely related to efforts to control the increase insurface temperature of the Earth. As Mathew et al. (2016) and 2018);Mirzaei and Haghighat (2010) stated, the impact of SUHI is not only onair quality but also on habitats and ecosystems. The emergence of newdisease vectors, changes in cropping, and human body resistance are amajor concern of mitigation efforts. Furthermore, mitigation throughland use scenarios can assist governments in adopting spatial policies.Mainly within the SMR, Semarang City’s government should start tothink collaboratively by involving the surrounding districts that arepart of the SMR to arrange the layout together. By doing so, SUHI
mitigation efforts are more quickly realised towards the sustainabilityof the SMR.
5. Conclusion
This study has succeeded in revealing the empirical facts of urbangrowth and SUHI dynamics in the Semarang Metropolitan Region overtwo decades. The northern, eastern and southern SMR is tending togrow intensively, triggered by industrial parks and central Java gate-ways, such as ports and airports centred in the SMR, and so the SUHI inthis region is very high and may increase if uncontrolled. The muchlower growth intensity occurred in the western and southwestern re-gions, as indicated by the slowing of built-up growth due to the physicalfactors of space in the region. This has become a potentially beneficialmitigation scenario of SUHI in the SMR.
The occurrence of sprawls randomly filled some peri-urban areas inthe southern part of the SMR. This phenomenon is very likely to occurin urban growth, which is usually followed by the emergence of thespread of built-up areas between the core city and surrounding peri-urban. However, if not carefully managed, it may endanger environ-mental sustainability, as productive land for food agriculture and ve-getation canopy as part of the mitigation of SUHI will be reduced.Furthermore, the successful SCA-MC model illustrates the transitionand prediction of LULCC in the SMR, potentially as a direction for localgovernment in regulating the spatial layout. This evidence shows thedevelopment of the SMR after 2018 slows and stagnates. Based on thesetrends, the government can develop appropriate policies to lead tosustainable development. If left unchecked, the future of the SMR cancontinue into environmental degradation, as it is vital to ensure theequality and sustainability of the SMR’s development.
GIS, remote sensing, and modelling using Cellular Automata -Markov Chain as the main support tools have proven appropriate inproviding spatial information and illustrating predictions of the spatialdynamics of a region. In this study, the data units obtained from sa-tellite imagery with some algorithms and processing techniques areable to describe the phenomenon of two decades of urbanisation in theSMR. Well-managed data and information provided in this format iscertainly useful as a decision support system for the government.However, to obtain a more detailed typology, future work in this area isrequired. One possibility is to use satellite imagery with more detailedresolution to see the utilisation of each land plot and measure its impacton SUHI.
Acknowledgements
The authors would like to thank Mr. M. Luthfi Eko Nugroho fromthe Regional Planning and Development Agency of Semarang for hishelp in providing data on the SMR. The authors are also grateful to Dr-
Fig. 12. Prediction of LULC in SMR 2038.
Fig. 13. Kappa Coefficient for Projected Map.
A.W. Sejati et al. Sustainable Cities and Society 46 (2019) 101432
12
Ing Wiwandari Handayani and her Resilience team for Semarang City inthe 100 RC Programme, for her valuable information and patienceduring the interview. Thanks also to Dr. Yudi Basuki (Head ofGeomatics and Planning Laboratory) and Dr. Hadi Wahyono (Head ofUrban and Regional planning Department) in providing the researchinfrastructure for running the SCA model. This research is partiallyfunded by a research grant to the first author from the Faculty ofEngineering, Universitas Diponegoro, Indonesia.
References
Adeyeri, O. E., Akinsanola, A. A., & Ishola, K. A. (2017). Investigating surface urban heatisland characteristics over Abuja, Nigeria: Relationship between land surface tem-perature and multiple vegetation indices. Remote Sensing Applications Society andEnvironment, 7(June), 57–68. https://doi.org/10.1016/j.rsase.2017.06.005.
Arsanjani, J. J., Helbich, M., Kainz, W., & Boloorani, A. D. (2012). Integration of logisticregression, Markov chain and cellular automata models to simulate urban expansion.International Journal of Applied Earth Observation and Geoinformation, 21(1), 265–275.https://doi.org/10.1016/j.jag.2011.12.014.
Bokaie, M., Kheirkhah, M., Daneshkar, P., & Hosseini, A. (2016). Assessment of UrbanHeat Island based on the relationship between land surface temperature and LandUse/Land Cover in Tehran. Sustainable Cities and Society, 23, 94–104. https://doi.org/10.1016/j.scs.2016.03.009.
Buchori, I., & Sugiri, A. (2016). An empirical examination of sustainable metropolitandevelopment in Semarang City, Indonesia. Australian Planner, 53(3), 163–177.https://doi.org/10.1080/07293682.2016.1151905.
Buchori, I., & Tanjung, K. (2013). Developing a simulation model for predicting in-nundated areas affected by land use change: A case study of keduang sub-watershed.The International Journal of Environmental Sustainability, 9, 79–108.
Buchori, I., Sugiri, A., Maryono, M., Pramitasari, A., & Pamungkas, I. T. D. (2017).Theorizing spatial dynamics of metropolitan regions: A preliminary study in Java andMadura islands, Indonesia. Sustainable Cities and Society, 35(August), 468–482.https://doi.org/10.1016/j.scs.2017.08.022.
Buchori, I., Pramitasari, A., Sugiri, A., Maryono, M., Basuki, Y., & Sejati, A. W. (2018).Adaptation to coastal flooding and inundation: Mitigations and migration pattern inSemarang City, Indonesia. Ocean & Coastal Management, 163(July), 445–455. https://doi.org/10.1016/j.ocecoaman.2018.07.017.
Buchori, I., Sugiri, A., Mussadun, M., Wadley, D., Liu, Y., Pramitasari, A., et al. (2018). Apredictive model to assess spatial planning in addressing hydro-meteorological ha-zards: A case study of Semarang City, Indonesia. International Journal of Disaster RiskReduction, 27(October 2017), 415–426. https://doi.org/10.1016/j.ijdrr.2017.11.003.
Chen, X., Zhao, H., Li, P., & Yin, Z. (2006). Remote sensing image-based analysis of therelationship between urban heat island and land use / cover changes. Remote Sensingof Environment, 104, 133–146. https://doi.org/10.1016/j.rse.2005.11.016.
Du, R. (2016). Urban growth: Changes, management, and problems in large cities ofSoutheast China. Frontiers of Architectural Research, 5(3), 290–300. https://doi.org/10.1016/j.foar.2016.04.002.
El-zeiny, A. M., & Effat, H. A. (2017). Environmental monitoring of spatiotemporalchange in land use/land cover and its impact on land surface temperature in El-Fayoum Governorate, Egypt. Remote Sensing Applications Society and Environment.https://doi.org/10.1016/j.rsase.2017.10.003.
García, A. M., Santé, I., Boullón, M., & Crecente, R. (2012). A comparative analysis ofcellular automata models for simulation of small urban areas in Galicia, NW Spain.Computers, Environment and Urban Systems, 36(4), 291–301. https://doi.org/10.1016/j.compenvurbsys.2012.01.001.
Gartland, L. (2008). Heat islands: Understanding and mitigating heat in urban areas. London,United Kingdom: Earthscan.
Giyarsih, S. R., & Marfai, M. A. (2017). Regional transformation in Semarang city,Indonesia. Journal of Urban and Regional Analysis, 9, 129–139.
Guan, D., Li, H., Inohae, T., Su, W., Nagaie, T., & Hokao, K. (2011). Modeling urban landuse change by the integration of cellular automaton and Markov model. EcologicalModelling, 222(20–22), 3761–3772. https://doi.org/10.1016/j.ecolmodel.2011.09.009.
Handayani, W., Rudiarto, I., Setyono, J. S., Chigbu, U. E., Sukmawati, A., & Awanah, M.(2017). Vulnerability assessment: A comparison of three different city sizes in thecoastal area of Central Java, Indonesia. Advances in Climate Change Research, 8(4),286–296. https://doi.org/10.1016/j.accre.2017.11.002.
Helbich, M., Darvishi Boloorani, A., Jokar Arsanjani, J., & Kainz, W. (2012). Integrationof logistic regression, Markov chain and cellular automata models to simulate urbanexpansion. International Journal of Applied Earth Observation and Geoinformation, 21,265–275. https://doi.org/10.1016/j.jag.2011.12.014.
Howard, L. (2007). The climate of London. IAUC. Available at www.lulu.com in two vo-lumes .
Huang, C., & Ye, X. (2015). Spatial modeling of urban vegetation and land surface tem-perature: A case study of Beijing. Sustainability, 7(7), 9478–9504. https://doi.org/10.3390/su7079478.
Karasiak, N. (2017). Dzetsaka: Classification tool. Retrieved fromhttps://plugins.qgis.org/plugins/dzetsaka/.
Kotharkar, R., & Bagade, A. (2018). Evaluating urban heat island in the critical localclimate zones of an Indian city. Landscape and Urban Planning, 169(August 2017),92–104. https://doi.org/10.1016/j.landurbplan.2017.08.009.
Lagarias, A. (2012). Urban sprawl simulation linking macro-scale processes to micro-
dynamics through cellular automata, an application in Thessaloniki, Greece. AppliedGeography, 34, 146–160. https://doi.org/10.1016/j.apgeog.2011.10.018.
Li, J., Song, C., Cao, L., Zhu, F., Meng, X., & Wu, J. (2011). Impacts of landscape structureon surface urban heat islands: A case study of Shanghai, China. Remote Sensing ofEnvironment, 115(12), 3249–3263. https://doi.org/10.1016/j.rse.2011.07.008.
Liu, Y. (2009). Urban development modelling using GIS and cellular automata. London:London Press.
Marfai, M. A., & King, L. (2007). Monitoring land subsidence in Semarang, Indonesia.Environmental Geology, 53(3), 651–659. https://doi.org/10.1007/s00254-007-0680-3.
Marfai, M. A., & King, L. (2008). Potential vulnerability implications of coastal inundationdue to sea level rise for the coastal zone of Semarang city, Indonesia. EnvironmentalGeology, 54(6), 1235–1245. https://doi.org/10.1007/s00254-007-0906-4.
Mathew, A., Khandelwal, S., & Kaul, N. (2016). Spatial and temporal variations of urbanheat island effect and the effect of percentage impervious surface area and elevationon land surface temperature: Study of Chandigarh city, India. Sustainable Cities andSociety, 26, 264–277. https://doi.org/10.1016/j.scs.2016.06.018.
Mathew, A., Khandelwal, S., & Kaul, N. (2018). Investigating spatio-temporal surfaceurban heat island growth over Jaipur city using geospatial techniques. SustainableCities and Society, 40(August 2017), 484–500. https://doi.org/10.1016/j.scs.2018.04.018.
Mehmood, R., Mehmood, S. A., Butt, M. A., Younas, I., & Adrees, M. (2016).Spatiotemporal analysis of urban sprawl and its contributions to climate and en-vironment of Peshawar using remote sensing and GIS techniques. Journal ofGeographic Information System, 08(02), 137–148. https://doi.org/10.4236/jgis.2016.82013.
Meng, Q., Zhang, L., Sun, Z., Meng, F., Wang, L., & Sun, Y. (2018). Characterizing spatialand temporal trends of surface urban heat island effect in an urban main built-uparea: A 12-year case study in Beijing, China. Remote Sensing of Environment,204(September 2017), 826–837. https://doi.org/10.1016/j.rse.2017.09.019.
Mirzaei, P. A., & Haghighat, F. (2010). A novel approach to enhance outdoor air quality:Pedestrian ventilation system. Building and Environment, 45(7), 1582–1593. https://doi.org/10.1016/j.buildenv.2010.01.001.
Mitsova, D., Shuster, W., & Wang, X. (2011). A cellular automata model of land coverchange to integrate urban growth with open space conservation. Landscape and UrbanPlanning, 99(2), 141–153. https://doi.org/10.1016/j.landurbplan.2010.10.001.
Moghadam, H. S., & Helbich, M. (2013). Spatiotemporal urbanization processes in themegacity of Mumbai, India: A Markov chains-cellular automata urban growth model.Applied Geography, 40, 140–149. https://doi.org/10.1016/j.apgeog.2013.01.009.
Oke, T. R. (1973). City size and the urban heat island. Atmospheric Environment, 7,769–779.
Pal, S., & Ziaul, S. (2017). Detection of land use and land cover change and land surfacetemperature in English Bazar urban centre q. The Egyptian Journal of Remote Sensingand Space Sciences, 20(1), 125–145. https://doi.org/10.1016/j.ejrs.2016.11.003.
Qaid, A., Bin Lamit, H., Ossen, D. R., & Raja Shahminan, R. N. (2016). Urban heat islandand thermal comfort conditions at micro-climate scale in a tropical planned city.Energy and Buildings, 133, 577–595. https://doi.org/10.1016/j.enbuild.2016.10.006.
Raza, S. M. H., Mahmood, S. A., Alvi, F. S., Atif, M., Yahya, S., Ahmad, J., et al. (2016).Spatiotemporal monitoring of urban sprawl and its impact assessment in districtSheikhupura through remote sensing and GIS using satellite images from 1976–2014.Science International (Lahore), 28(2), 1583–1588.
Rudiarto, I., Handayani, W., Pigawati, B., & Pangi, P. (2013). Zona peri-urban semarangmetropolitan: Perkembangan Dan Tipologi sosial ekonomi. TATALOKA, 15(2),116–128.
Rudiarto, I., Handayani, W., & Setyono, J. S. (2018). A regional perspective on urbani-zation and climate-related disasters in the northern coastal region of Central Java,Indonesia. Land, 7(1), 34. https://doi.org/10.3390/land7010034.
Sannigrahi, S., Bhatt, S., Rahmat, S., & Uniyal, B. (2017). Analyzing the role of biophy-sical compositions in minimizing urban land surface temperature and urban heating.Urban Climate, (September), 0–1. https://doi.org/10.1016/j.uclim.2017.10.002.
Sejati, A. W., & Buchori, I. (2010). A GIS model for predicting disaster prone areas affected byglobal Sea-level rise: A case study of Semarang City. ICRD proceeding5–12.
Sejati, A. W., Buchori, I., & Rudiarto, I. (2018). The impact of urbanization to Forestdegradation in metropolitan Semarang: A preliminary study. IOP conference series:Earth and environmental science, 123(1), 12011. Retrieved from http://stacks.iop.org/1755-1315/123/i=1/a=012011.
Setyono, J. S., Yunus, H. S., & Giyarsih, S. R. (2016). The spatial pattern of urbanizationand small cities development in central java: A case study of Semarang-Yogyakarta-Surakarta region. Geoplanning Journal of Geomatics and Planning, 3(1), 53–66. https://doi.org/10.14710/geoplanning.3.1.53-66.
Shwetha, H. R., & Kumar, D. N. (2016). Prediction of high spatio-temporal resolution landsurface temperature under cloudy conditions using microwave vegetation index andANN. ISPRS Journal of Photogrammetry and Remote Sensing, 117, 40–55. https://doi.org/10.1016/j.isprsjprs.2016.03.011.
Sugiri, A., Buchori, I., & Ma’rif, S. (2015). Towards participatory spatial policy:Facilitating rural non-farm activities in Susukan suburb of Semarang MetropolitanRegion. The International Journal of Civic, Political, and Community Studies, 13, 1–17.
Sugiri, A., Buchori, I., & Soetomo, S. (2011). Sustainable metropolitan development:Towards an operational model for semarang metropolitan region. The InternationalJournal of Environmental Cultural Economic and Social Sustainability Annual Review,7(5), 301–324.
Tran, D. X., Pla, F., Latorre-carmona, P., Myint, S. W., Caetano, M., & Kieu, H. V. (2017).Characterizing the relationship between land use land cover change and land surfacetemperature. ISPRS Journal of Photogrammetry and Remote Sensing, 124, 119–132.https://doi.org/10.1016/j.isprsjprs.2017.01.001.
Wang, F., Hasbani, J.-G., Wang, X., & Marceau, D. J. (2011). Identifying dominant factors
A.W. Sejati et al. Sustainable Cities and Society 46 (2019) 101432
13

for the calibration of a land-use cellular automata model using Rough set Theory.Computers, Environment and Urban Systems, 35(2), 116–125. https://doi.org/10.1016/j.compenvurbsys.2010.10.003.
Wang, J., Huang, B., Fu, D., Atkinson, P. M., & Zhang, X. (2016). Response of urban heatisland to future urban expansion over the Beijing e Tianjin e Hebei metropolitan area.Applied Geography, 70, 26–36. https://doi.org/10.1016/j.apgeog.2016.02.010.
Wang, S., Ma, Q., Ding, H., & Liang, H. (2016). Detection of urban expansion and landsurface temperature change using multi-temporal landsat images. Resources,
Conservation, and Recycling. https://doi.org/10.1016/j.resconrec.2016.05.011.Ward, K., Lauf, S., Kleinschmit, B., & Endlicher, W. (2016). Heat waves and urban heat
islands in Europe: A review of relevant drivers. Science of the Total Environment,569–570, 527–539. https://doi.org/10.1016/j.scitotenv.2016.06.119.
WHO (2014). Urban population growth.Yang, X., Zheng, X.-Q., & Lv, L.-N. (2012). A spatiotemporal model of land use change
based on ant colony optimization, Markov chain and cellular automata. EcologicalModelling, 233, 11–19. https://doi.org/10.1016/j.ecolmodel.2012.03.011.
A.W. Sejati et al. Sustainable Cities and Society 46 (2019) 101432
14