sustainability of airlines in india with covid-19
TRANSCRIPT

Vol.:(0123456789)
Journal of Revenue and Pricing Management (2021) 20:457–472 https://doi.org/10.1057/s41272-020-00257-z
PRACTICE ARTICLE
Sustainability of airlines in India with Covid‑19: Challenges ahead and possible way‑outs
Anshu Agrawal1
Received: 2 July 2020 / Accepted: 11 August 2020 / Published online: 10 September 2020 © Springer Nature Limited 2020
AbstractCoronavirus outbreak has been highly disruptive for aviation sector, threatening the survival and sustainability of airlines. Apart from massive losses attributed to suspended operations, industry foresee a grim recession ahead. Restrictive move-ments, weak tourism, curtailed income, compressed commercial activities and fear psychosis are expected to compress the passenger demand from 30 to 60%, endangering the commercial viability of airlines operation. Fragile to withstand the cyclic momentary shocks of oil price fluctuation, demand flux, declining currency, airlines in India warrants for robust structural changes in their operating strategies, business model, revenue and pricing strategies to survive the long-lasting consequences of Covid-19. Paper attempts to analyze impact of lockdown and covid crisis on airlines in India and possible challenges ahead. Study also suggests the possible way-out for mitigating the expected losses.
Keywords Airlines · Liquidity · Covid-19 impact · Altman Z-score · Cash burn rate · Cargo-cum-passenger model
Introduction
The world, at present is combating with pandemic Covid-19. Emerged from Wuhan (China) in December 2019, within few months it has taken 215 countries across the globe into its clutches. With 580 reported cases on 22 January 2020, the infected cases have crossed 10. 62 million as on July 1.1 India is no different; with 3 cases reported as on 22 February, the number has surpassed 587,092,2 whilst three extended phases of lockdown.3 The magnitude of virus con-tagion spread in the absence of any antidote developed so far has left the countries across the world with quarantine as the only remedy, despite of its drastic consequences on the economy.
Aviation sectors is perhaps worst hit with covid impact. The preventive restrictive movements have drastically dented the airlines and allied services with huge losses. Airlines passengers’ services in India remain suspended for sixty day (25 March 2020 to 24 May 2020), bringing massive loss to the industry. According to DGCA, six days suspended operations of March leads to 33% decline in passenger traffic
(from 11.5 million reported in March 2019 to 7.8 million in March 2020).4 As per CRISIL Infrastructure Advisory report, the expected revenue loss to the Indian aviation sector due to lockdown amounts to 240 billion; inter se, airlines account for 70% losses, followed by allied services-ground handling, etc. CAPA India estimates the industry staggering losses of 240 to 270 billion in April-June quar-ter, assuming operations to remain suspended till June 2020. This imply loss of 2.67 to 3 billion for per day of extended lockdown.5 In addition to the above losses, the industry foresees grim recession ahead. Restrictive movements and destinations, truncated consumable income, decline in tour-ism, and fear psychosis are expected to significantly curtail the passenger traffic for the current fiscal or perhaps longer.
* Anshu Agrawal [email protected]
1 Indian Institute of Management Sirmaur, Sirmaur, Himachal Pradesh, India
1 https ://www.world omete rs.info/coron aviru s/ as on 10th June 2020.2 https ://www.world omete rs.info/coron aviru s/count ry/india / as on 1st July 2020.3 Lockdown phase 1 begin in India from 22 March 2020- 14th April, Phase 2 begin from 15th April to 30th April and Phase 3 from 1st May to 31st May.4 https ://www.busin ess-stand ard.com/artic le/compa nies/india -suspe nds-fligh ts-till-may-17-as-losse s-for-airli nes-mount -in-lockd own-12005 02006 18_1.html5 https ://econo micti mes.india times .com/indus try/trans porta tion/airli nes-/-aviat ion/india n-aviat ion-secto r-may-incur -3-3-3-6-billi on-loss-in-june-quart er-capa-india /artic lesho w/74813 509.cms?from=mdr#:~:text=India %20has %20sus pende d%20ope ratio n%20of,be%20USD %201.50%2D1.75%20bil lion

458 A. Agrawal
India is the third largest domestic civil aviation market in the world (IBEF, Report).6 However, thin profit mar-gins, high operating cost, inflated taxes and cut-throat price war make it one of the toughest aviation market (Saranga and Nagpal 2016). The cost structure of airlines in India is believed to be highly bloated with ATF taxes, landing and parking charges, which are perhaps highest in India.7 The industry is exposed to high operating leverage. The air-lines operating cost structure consists of nearly 30 to 40% of fuel cost, 15% lease rental, nearly 25% for other operat-ing expenses (including general administrative, operating expenses such as flight equipment, maintenance, overhaul, user charges including landing, airport charges and air navi-gation charges (DGCA Report). Other than fuel cost, main-tenance of aircraft, selling & distribution cost, and parking & landing charges, rest other expenses are fixed and are to be honored irrespective of flight operations. Burden of fixed charges- lease rental, interest charges, and crew salaries keep the airlines on their toes for managing cashflows. The high operating cost and cut-throat competition compel the air-lines to struggle with low margins. The airlines demand in India is highly price elastic (Wang et al. 2018). Entry of low-frill competitors has changed the airlines price dynamics of pricing the services that were earlier based on additional frills (Saranga and Nagpal 2016). Any hike in the expenses, prima-facie, is a pinch on the airlines margin as ugly fare wars restrict to surpass the uncertain hike in costs on ticket prices. Commercials of airlines revolve around Available
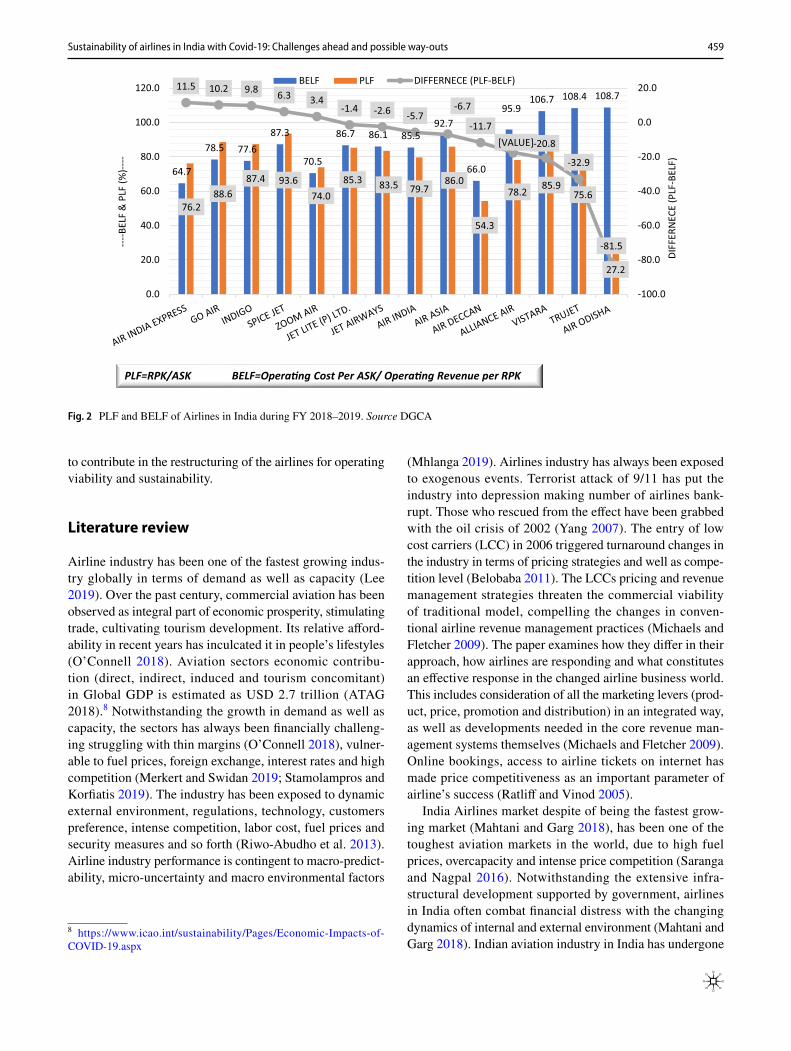
Seat Kilometers (ASK)-capacity, Revenue per kilometer (RPK)-income earned, Passenger load factor (PLF)-capacity utilized, Break-even load factor (BELF)-operating cost per ASK over operating revenue per RPK. Higher the distance flown, more is the opportunity for the airlines to spread the operating fixed cost over longer distance and thereby reduc-ing their adjusted operating cost. In this backdrop, improv-ing PLF by offering lucrative offers is prevalent trend in the industry. As provided, the airlines in India performed at decent capacity of nearly 85% in the month of January, 2020. In the month of February, irrespective of low demand, the SpiceJet, Go Air, Indigo, Air Asia, Vistara have managed high PLF by providing attractive offers (Fig. 1).
Higher PLF, however, does not implies profitability. It only represents the successful selling of available seats. Operating viability requires the PLF to exceed BELF. The irony is that despite of heavy demand, the airlines strive hard for making break-even due to tough competition. In the dilemma of managig operating cash flows, the cash stripped airlines with overmounted fixed operating costs emphasize on selling more seats, ignoring the break-even. As provided in the Fig. 2, only five airlines operate above BELF during FY 2018–2019, with the safety margins from 3.4 to 11.5%, whilst rest all were in red.
The covid outbreak has added financial woes of the sec-tor. With the dwindling demand anticipations, capacity uti-lization certainly will be a major challenge ahead for airlines sustainability. Hitherto combating for break-even, low pas-senger traffic possibly restrain the airlines from recovering their variable expenses, thereby obstructing the commer-cially viability of their operations. Present study attempts to analyze the financial impact of covid outbreak on airlines and challenges ahead. Possible suggestion for sustainable operations of airlines are suggested. Findings are expected
Fig. 1 PLF of airlines in India during January and February 2020. Source DGCA
6 https ://www.ibef.org/indus try/india n-aviat ion.aspx#:~:text=India ’s%20avi ation %20ind ustry %20is%20exp ected ,aviat ion%20nav igati on%20ser vices %20by%20202 67 https ://www.dnain dia.com/busin ess/repor t-the-cost-of-f lyin g-high-27328 79
459Sustainability of airlines in India with Covid-19: Challenges ahead and possible way-outs
to contribute in the restructuring of the airlines for operating viability and sustainability.
Literature review
Airline industry has been one of the fastest growing indus-try globally in terms of demand as well as capacity (Lee 2019). Over the past century, commercial aviation has been observed as integral part of economic prosperity, stimulating trade, cultivating tourism development. Its relative afford-ability in recent years has inculcated it in people’s lifestyles (O’Connell 2018). Aviation sectors economic contribu-tion (direct, indirect, induced and tourism concomitant) in Global GDP is estimated as USD 2.7 trillion (ATAG 2018).8 Notwithstanding the growth in demand as well as capacity, the sectors has always been financially challeng-ing struggling with thin margins (O’Connell 2018), vulner-able to fuel prices, foreign exchange, interest rates and high competition (Merkert and Swidan 2019; Stamolampros and Korfiatis 2019). The industry has been exposed to dynamic external environment, regulations, technology, customers preference, intense competition, labor cost, fuel prices and security measures and so forth (Riwo-Abudho et al. 2013). Airline industry performance is contingent to macro-predict-ability, micro-uncertainty and macro environmental factors
(Mhlanga 2019). Airlines industry has always been exposed to exogenous events. Terrorist attack of 9/11 has put the industry into depression making number of airlines bank-rupt. Those who rescued from the effect have been grabbed with the oil crisis of 2002 (Yang 2007). The entry of low cost carriers (LCC) in 2006 triggered turnaround changes in the industry in terms of pricing strategies and well as compe-tition level (Belobaba 2011). The LCCs pricing and revenue management strategies threaten the commercial viability of traditional model, compelling the changes in conven-tional airline revenue management practices (Michaels and Fletcher 2009). The paper examines how they differ in their approach, how airlines are responding and what constitutes an effective response in the changed airline business world. This includes consideration of all the marketing levers (prod-uct, price, promotion and distribution) in an integrated way, as well as developments needed in the core revenue man-agement systems themselves (Michaels and Fletcher 2009). Online bookings, access to airline tickets on internet has made price competitiveness as an important parameter of airline’s success (Ratliff and Vinod 2005).
India Airlines market despite of being the fastest grow-ing market (Mahtani and Garg 2018), has been one of the toughest aviation markets in the world, due to high fuel prices, overcapacity and intense price competition (Saranga and Nagpal 2016). Notwithstanding the extensive infra-structural development supported by government, airlines in India often combat financial distress with the changing dynamics of internal and external environment (Mahtani and Garg 2018). Indian aviation industry in India has undergone
64.7
78.5 77.6 87.3
70.5
86.7 86.1 85.5 92.7
66.0
95.9 106.7 108.4 108.7
76.2 88.6
87.4 93.6 74.0
85.3 83.5 79.7 86.0
54.3
78.2 85.9 75.6
27.2
11.5 10.2 9.8 6.3 3.4 -1.4 -2.6 -5.7
-6.7
-11.7 [VALUE]-20.8
-32.9
-81.5
-100.0
-80.0
-60.0
-40.0
-20.0
0.0
20.0
0.0
20.0
40.0
60.0
80.0
100.0
120.0
DIFF
ERN
ECE
(PLF
-BEL
F)
----B
ELF
& P
LF (%
)----
BELF PLF DIFFERNECE (PLF-BELF)
PLF=RPK/ASK BELF=Opera ng Cost Per ASK/ Opera ng Revenue per RPK
Fig. 2 PLF and BELF of Airlines in India during FY 2018–2019. Source DGCA
8 https ://www.icao.int/susta inabi lity/Pages /Econo mic-Impac ts-of-COVID -19.aspx
460 A. Agrawal
rapid transformation with the liberalization of Indian avia-tion sector (Singh 2016). India began to relax controls on its airline industry in 1986, allowing willing entrants to add system’s capacity. However, financial performance of the airlines remains challenging owing to inappropriate policies, restricted capacity allocation on profitability basis (Hooper 1997). Liberalization of air travel services and the advent of low-frill airlines have changed the panorama of Indian Civil Aviation in terms of demand as well as supply (Ohri 2012; Srinidhi 2010). Reformation of regulatory policies resulted in three-fold increase in the number of scheduled airlines and a five-fold increase in the number of aircraft operated (O’Connell and Williams 2006). The increased intercon-nectivity within the global airline markets has altered the dynamics of external environment and internal operations (Riwo-Abudho et al. 2013; Singh 2016). Success and sur-vival in this milieu warrants for coherent strategies adapting with market flavor (Pathak 2015).
Entry of the LCCs in India in 2003, with first ’no-frills’ airlines- Air Deccan has changed the dynamics of Indian domestic aviation market (Sakariya et al. 2009). Low-cost carrier (LCC) by enhancing affordability of air travel has stimulated the demand for air travel in India (Krämer et al. 2018; Wang et al. 2018). Undoubtedly, low-frill operation has proved to be a successful business model in the industry (Alamdari and Fagan 2005). Budget airlines and small char-tered airlines witnessed more efficient in the system (Dhanda and Sharma 2018; Jain and Natarajan 2015; Saranga and Nagpal 2016) and dominated the Indian airline market (Deeppa and Ganapathi 2018; Wang et al. 2018). The LCC in India have managed to achieve significant operational efficiencies with the rigid cost structure, heavy taxes, high landing and parking charges, undesirable regulatory factors (Saranga and Nagpal 2016). India’s low cost carriers show better scale efficiency vis-à-vis their full service competitors (Sakthidharan and Sivaraman 2018). Low Cost Airlines have been witnessed advantageous in utilizing their capacity com-pare to the full service airlines which strives hard to attain break-even capacity (Thirunavukkarasu 2015). However, the inexorable rise of LCC has made the industry more volatile (Doganis 2005). Intense competition and enhanced capacity have made cost effectiveness as the daring need for survival and sustainability.
Financial performance of airlines is vulnerable to both internal conditions of the company and as well the external environment. Operating factors, namely, operating revenue per air kilometers, capacity, cost structure, load factor dictate the operational output of the airlines and their commercial stability. From the external environment, ATF prices largely affect airlines profitability in India. Also, annual inflation and GDP growth rate in the country has a major influence on the sustainability of the airlines in India (Mahtani and Garg 2018). With uncontrollable cost behavior, tight margins
and cut-throat market, survival and subsistence of airlines largely depends on its ability to maximize their customer base (Singh 2016). Fierce competition compel the airlines to optimizes their revenues (Josephi 2005; Krämer et al. 2018). In the backdrop of covid pandemic outbreak, the globally airline industry has been adversely affected. Airlines in India which have been observed vulnerable to withstand the cyclic economic disruption (of fuel prices, inflation, devaluation of currency and demand shock), certainly be entering into a tough time with extremely low demand and ever mounting losses. Present study attempts to analyze the financial impact of covid pandemic on airlines in India and possible impact of their financial strengths and weakness. Further study sug-gests possible way-outs of sustaining operating viability.
Impact of Covid pandemic
Impact of suspended operation amid lockdown
The Indian aviation industry is characterized by high fixed costs of nearly 35 to 40%. These costs include lease rental, employees cost, interest charges. Per day of suspended oper-ations has hit the industry at the rate of 75–90 crore loss per day.9 Table 1 exhibits fixed-cost information pertaining of four key airlines of India for last three years (FY 2017 to 2019). The costs mentioned signify the charges that are to be met irrespective of the business operations. The increas-ing pattern of expenses over years, prima-facie, signify the expanded operations’ size over years. Ceteris paribus, no significant change in the operations size and cost for the FY 2019–2020, per day loss of suspended operations for Inter-globe Aviation accounts for 24 crores, followed 9.2 crores for SpiceJet, 5.83 crores for Go Airlines and 3.1 crores for Air Asia (based on the 2018–2019 estimates).
Drying cash reserves
In capital intensive industries, such as airlines, liquidity plays an important role in boosting profits (Merkert and Swidan 2019). Perhaps the cash rich airlines are in better position to negotiate with the suppliers-oil companies, les-sor, bankers, employees for favorable deals and heavy dis-counts. Airlines in India suffers from weak liquidity. Cash burn rate of airlines in India during the years 2015 to 2019 is provided in Table 2. The cash burn rate indicates the number of days for which a company can sustain its operations with the available cash reserves. The data contained in Table 2, suggests few days of cash back-up available to most of the
9 https ://www.newin diane xpres s.com/busin ess/2020/apr/16/lockd own-airli nes-to-see-rs-75-90-cr-loss-per-day-21307 58.html

461Sustainability of airlines in India with Covid-19: Challenges ahead and possible way-outs
airlines, excluding Interglobe Aviation which is exhibiting consistent pattern of satisfactory cushion of more than a quarter. The aggregated cash reserves of Interglobe Aviation as on December 2020 were reported to be 20068.7 crores10. Assuming, 24.16 crores of daily fixed cost (refer Table 1), the reserves of 1789 crores possibly have been wiped out amid seventy days of lockdown. Remaining cash balance of
18339.7 crores suggest the probability of 228 days of sur-vival, based on estimated burn rate of 80.6 per day. How-ever, for other airlines resuming operations with insufficient operating cash seems to be a challenge.
Deteriorating solvency
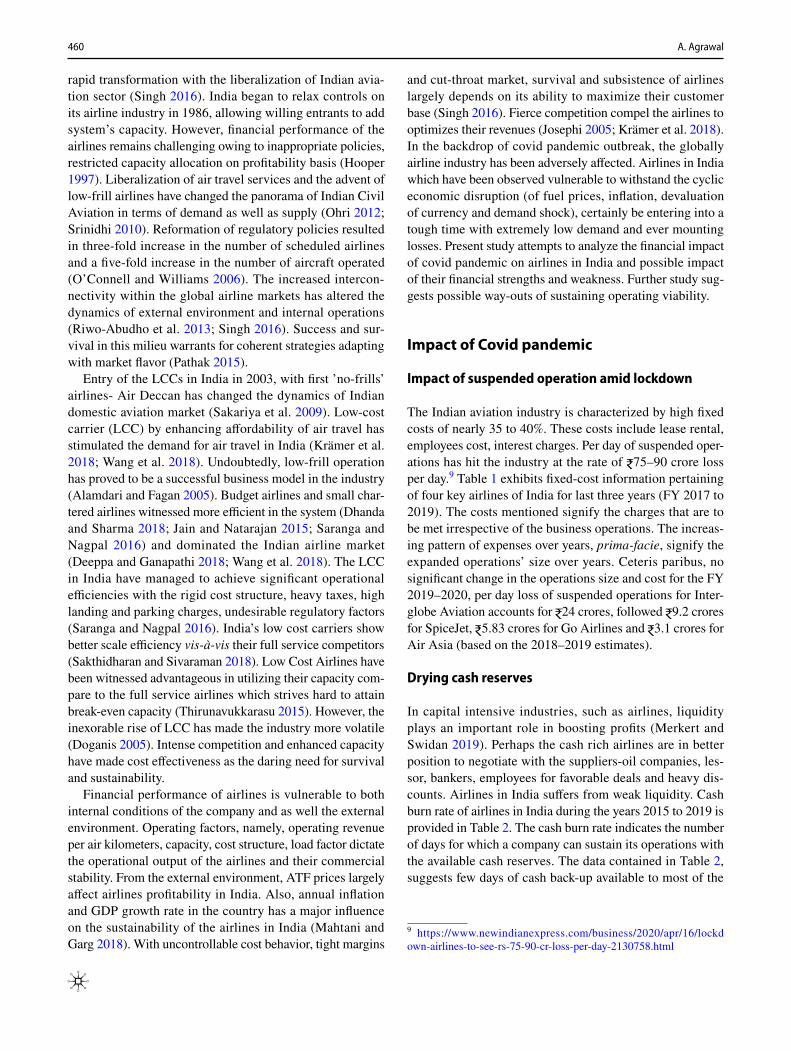
In the backdrop of tight liquidity, thin margins and high burn rate, the airlines have always been fragile to withstand the normal demand shocks, oil price fluctuation, depreciating currency, etc. Industry has vouched the devastating impact of these events ranging deep losses to airlines bankruptcy. Table 3 exhibits 2015 onwards financial performance of air-lines in India in terms of profits margins, rate of returns, assets turnover ratio and interest coverage ratios. As pro-vided, the profit margins of the airlines are highly thin and unsatisfactory to insulate the firms from sudden shocks. Median net profit margin − 0.73, prima-face, corroborate that net profits of all the airlines in India are occasionally positive. There appears only three airlines, Interglobe, Go Air, and Blue Dart (Cargo airline) with positive net profit margin in all the five years. In terms of magnitude, the net
profit margin 0.5 to 9% and EBIT margin of 1 to 15% does not seems satisfactory to justify the corpus invested and the risk involved there in. Oil price hike of 2018 has plunged the sector into deep losses. Interglobe Aviation that appears to be best performer of the industry has experienced deep shrinkage in its net profit margin of 2019 from 9 to 0.5% (Table 3). Unable to take the hit, loss running Jet Airways blown out of the race with its operations meeting grinding halt in April 2019.11 Previously also, Industry has a history of several starts and may failures; East West Airlines and Damania Airways in 90 s, Kingfisher Airlines in 2012 are classic instances of airlines financial failure.
Table 4 exhibit the Altman Z-score of select four air-lines. Altman Z-score model (Altman 1968) was developed by Edward Altman in 1968. It gauges the likelihood of bank-ruptcy of business concern within two years, using multiple corporate income and balance sheet values. Z-scores are used to predict corporate defaults and an easy-to-calculate control measure for the financial distress status of compa-nies. The Z-score is calculated using liquidity, profitability, leverage and turnover parameters. (Altman 1968).
here X1 working capital/total asset, X2 retained earnings/total asset, X3 EBIT/total X4 Market capitalization/ book value of debt, X5total sales/total assets.
Altman Z − score = 1.2X1 + 1.4X2 + 3.3X3 + 0.6X4 + 1.0X5,
Table 1 Fixed charges of Airlines in India during the FY 2017 to 2019
Company Years Employee cost Aircrafts lease Rent Interest Total fixed cost Per day cash for fixed cost
Crores
Air Asia Ltd Mar-19 346.86 739.54 10.69 34.06 1131.15 3.10Mar-18 264.02 441.00 7.52 13.06 725.60 1.99Mar-17 162.74 248.79 2.83 6.45 420.82 1.15
Go Airlines (India) Ltd Mar-19 594.86 1304.38 8.90 221.42 2129.56 5.83Mar-18 420.88 750.86 6.60 202.03 1380.37 3.78Mar-17 335.10 4.34 217.23 556.67 1.53
Interglobe Aviation Ltd Mar-19 3137.79 4999.45 116.30 563.40 8816.95 24.16Mar-18 2455.02 3610.20 100.96 413.09 6579.27 18.03Mar-17 2048.19 3125.37 89.70 406.15 5669.42 15.53
SpiceJet Ltd Mar-19 1057.01 2080.21 56.72 163.59 3357.53 9.20Mar-18 862.57 1665.24 44.71 121.84 2694.36 7.38Mar-17 673.54 1451.36 37.62 95.14 2257.66 6.19
10 https ://www.busin essto day.in/curre nt/corpo rate/indig o-q3-profi t-zooms -over-2-fold-to-rs-496-crore -reven ue-spike s-25/story /39473 5.html
11 https ://www.bbc.com/news/busin ess-47963 536#:~:text=Takin g%20the %20las t%20fli ght%20of%20Ind ia’s%20str icken %20Jet %20Air ways&text=Troub led%20Ind ian%20air line%20Jet %20Air ways,fuel%20and %20oth er%20cri tical %20ser vices

462 A. Agrawal
Score below 1.81 signifies high probability of bank-ruptcy; 1.81 to 2.99 is considered as grey zone and score of above 2.99 is considered as safe zone.
This model was applicable for manufacturing sector. For predicting the bankruptcy of service sector firms in
emerging market modified Atman score was proposed (Alt-man 2013). As per the model,
Z − score = 3.25 + 6.56X1 + 3.26X2 + 6.72X3 + 1.05X4,
Table 2 Cash burn rate in days Company name Year Total expenditure Burn rate per day Cash and cash equivalent
Cash burn rate days
AirAsia (India) Ltd. 2019 3196.57 8.76 102.50 11.70Go Airlines (India) Ltd. 6607.87 18.10 380.42 21.01Interglobe Aviation Ltd. 29211.18 80.03 8606.36 107.54SpiceJet Ltd. 9254.43 25.35 77.90 3.07AIR India Express Ltd. 3115.76 8.54 94.25 11.04Air India Ltd. 2018 27458.45 75.23 742.88 9.87AirAsia (India) Ltd. 1933.74 5.30 206.17 38.92Blue Dart Aviation Ltd. 596.78 1.64 0.33 0.20Go Airlines (India) Ltd. 4559.76 12.49 126.04 10.09Interglobe Aviation Ltd. 20404.19 55.90 6580.60 117.72Jet Airways (India) Ltd. 24105.42 66.04 1360.44 20.60Jet Lite (India) Ltd. 1638.48 4.49 4.47 1.00SpiceJet Ltd. 7090.40 19.43 145.77 7.50TATA SIA Airlines Ltd. 2636.39 7.22 323.19 44.74AIR India Express Ltd. 2017 2806.72 7.69 156.69 20.38Air India Ltd. 24788.11 67.91 735.14 10.82AirAsia (India) Ltd. 1083.61 2.97 112.69 37.96Blue Dart Aviation Ltd. 554.55 1.52 0.84 0.55Go Airlines (India) Ltd. 3265.58 8.95 7.32 0.82Interglobe Aviation Ltd. 16767.98 45.94 4632.53 100.84Jet Airways (India) Ltd. 20887.65 57.23 1537.54 26.87Jet Lite (India) Ltd. 1538.58 4.22 4.14 0.98SpiceJet Ltd. 5713.02 15.65 67.34 4.30TATA SIA Airlines Ltd. 1910.39 5.23 103.25 19.73AIR India Express Ltd. 2016 2350.24 6.44 95.09 14.77Air India Ltd. 22646.15 62.04 805.49 12.98Blue Dart Aviation Ltd. 526.41 1.44 0.22 0.15Go Airlines (India) Ltd. 2716.77 7.44 5.37 0.72Interglobe Aviation Ltd. 13326.05 36.51 3718.67 101.85Jet Airways (India) Ltd. 19821.15 54.30 1477.65 27.21Jet Lite (India) Ltd. 1176.19 3.22 10.48 3.25SpiceJet Ltd. 4674.23 12.81 105.90 8.27TATA SIA Airlines Ltd. 1105.34 3.03 144.96 47.87AIR India Express Ltd 2015 2473.63 6.78 89.40 13.19Air India Ltd. 24545.44 67.25 623.11 9.27Blue Dart Aviation Ltd. 586.13 1.61 0.97 0.60Go Airlines (India) Ltd. 2919.55 8.00 8.57 1.07Interglobe Aviation Ltd. 12252.00 33.57 1999.38 59.56Jet Airways (India) Ltd. 21132.14 57.90 1985.08 34.29Jet Lite (India) Ltd. 1723.31 4.72 90.91 19.25SpiceJet Ltd. 6023.29 16.50 23.58 1.43

463Sustainability of airlines in India with Covid-19: Challenges ahead and possible way-outs
Table 3 Financials of Airlines in India during the years 2010 to 2019
Company name Year end EBIT margin Net profit margin
EBITDA margin
ROTA ROE ROCE Asset turnover Interest coverage
AirAsia (India) Ltd.
2019 − 25.36 − 26.71 − 24.82 − 87.14 0.00 0.00 3.26 − 18.70
Go Airlines (India) Ltd.
4.22 1.97 1.43 3.26 0.00 17.47 1.66 1.19
Interglobe Aviation Ltd.
1.45 0.55 4.12 0.68 2.24 4.38 1.24 0.74
SpiceJet Ltd. − 1.67 − 3.47 1.83 − 7.16 0.00 − 15.11 2.06 − 0.93Air India Ltd. 2018 − 2.93 − 23.20 4.80 − 11.58 0.00 − 2.33 0.50 − 0.14AirAsia (India)
Ltd.− 6.17 − 6.89 − 5.64 − 21.46 0.00 0.00 3.11 − 8.50
Blue Dart Aviation Ltd.
4.13 0.38 14.56 0.61 5.31 9.36 1.60 1.23
Go Airlines (India) Ltd.
9.45 3.27 8.35 4.53 0.00 22.75 1.38 2.17
Interglobe Aviation Ltd
15.38 9.74 17.27 11.72 41.73 44.51 1.20 8.57
Jet Airways (India) Ltd.
0.32 − 3.30 2.99 − 6.10 0.00 4.00 1.85 0.09
Jet Lite (India) Ltd.
0.96 − 24.48 1.00 − 120.94 0.00 0.00 4.94 0.04
SpiceJet Ltd. 8.88 7.31 11.86 16.14 0.00 76.24 2.21 5.65TATA SIA
Airlines Ltd.− 20.09 − 20.17 − 19.26 − 65.09 0.00 0.00 3.23 − 244.64
Air India Ltd. 2017 − 8.41 − 28.78 8.76 − 13.83 0.00 − 5.78 0.48 − 0.41AirAsia (India)
Ltd.− 14.33 − 15.02 − 13.40 − 34.79 0.00 0.00 2.32 − 20.75
Blue Dart Aviation Ltd.
3.65 0.51 13.39 0.99 6.86 9.77 1.95 1.25
Go Airlines (India) Ltd.
14.40 5.65 13.27 6.66 0.00 22.99 1.18 2.41
Interglobe Aviation Ltd.
13.73 8.93 16.19 10.62 52.01 41.33 1.19 6.28
Jet Airways (India) Ltd.
10.83 6.88 13.94 9.32 0.00 46.27 1.36 2.74
Jet Lite (India) Ltd.
0.71 − 24.35 0.76 − 123.86 0.00 0.00 5.09 0.03
SpiceJet Ltd. 8.49 6.96 11.08 14.76 0.00 142.68 2.12 5.53TATA SIA
Airlines Ltd.− 37.25 − 37.30 − 36.12 − 123.15 0.00 0.00 3.30 − 707.17
Air India Ltd. 2016 3.58 − 19.19 12.93 − 8.24 0.00 2.01 0.43 0.16Blue Dart
Aviation Ltd.4.63 0.91 15.23 1.95 12.05 12.59 2.15 1.42
Go Airlines (India) Ltd.
13.58 5.28 9.51 5.79 0.00 20.13 1.10 1.97
Interglobe Aviation Ltd.
19.66 12.31 22.80 15.40 129.29 61.54 1.25 9.06
Jet Airways (India) Ltd.
9.59 5.51 13.90 6.17 0.00 27.26 1.12 2.35
Jet Lite (India) Ltd.
4.02 − 1.84 2.34 − 6.35 0.00 0.00 3.45 0.69
SpiceJet Ltd. 11.32 8.84 13.60 16.50 0.00 197.86 1.87 4.56TATA SIA
Airlines Ltd.− 57.88 − 57.99 − 56.42 − 101.88 − 3058.15 − 3052.65 1.76 − 555.27
464 A. Agrawal
here X1 Working capital/total assets, X 2 retained earnings/total assets, X3 EBIT/total assets, X4 Market capitalization/book value of debt.
Score above 2.6 is considered safe zone, 1.1 to 2.6 as moderate risk and score below 1.1 indicates high risk of bankruptcy.
Table 3 exhibits the Altman Z-score of Airlines in India computed using traditional Altman model and modified Alt-man model for emerging market. In the backdrop of una-vailability of market capitalization information of all the airlines, the enterprise value minus book value of debt is considered as value of equity. The findings of both the mod-els lend credence to the sustainability of Indigo Aviation and SpiceJet. Nevertheless, the decline in the scores is very likely, due to deteriorated finances amid lockdown and grim prospect of passenger demand ahead.
Post‑lockdown challenges
Grim passenger traffic
Covid-19 pandemic has proven highly disruptive. It has wreaked havoc with the global economy, economically, socially and financially (Laing 2020; Wren-Lewis 2020). The aftermath of the disasters is perhaps more threatening, endangering the survival and sustainability of various busi-nesses. Airline industry is worst hit sector, which is expected to lose USD 84.3 billion in 2020, the highest loss the sector
has ever witnessed (IATA).12 Owing to the restricted move-ments and destinations, the industry expects severe decline in its passenger load (Thams et al. 2020), perhaps, a signifi-cant parameter of airlines profitability (Baltagi et al. 1995; Clark and Vincent 2012; Sibdari et al. 2018). As provided in Fig. 3, month of March has witnessed sharp decline in PLF of airlines all across the globe.
Other than the loss amid suspended operation, the future prospect of the industry seems more dreadful for sustainable operations of airlines. In the backdrop of aggressive multi-plication in covid cases, the likelihood of normal passenger traffic seems distant. Restricted movements, fear psychosis, declined tourism, reduced commercial activities, curbed disposable income is expected to have significant impact on passenger airlines demand. Tourism sector is considered as significant driver/ stimulator of airlines business (Bieger and Wittmer 2006). An important aspect of international traffic to and from India pertains to trend in foreign tourist arrivals in India. The months from April to July are gener-ally observed as peak season for the airlines, with the maxi-mum Passenger load factor (PLF). In the FY 2018–2019, YoY growth in PLF is positive only in the month of April & July.13As per the DGCA report, 33% of international passenger traffic during FY 2019 was attributed to tourism sector. In view of expected decline in tourism amid covid pandemic, the airline business foresees a major disruption ahead. According to ICAO united Aviation study, depending upon the duration and intensity of outbreak, control meas-ures and economic and psychological impact, the global
Table 3 (continued)
Company name Year end EBIT margin Net profit margin
EBITDA margin
ROTA ROE ROCE Asset turnover Interest coverage
Air India Ltd. 2015 − 8.84 − 29.59 0.89 − 13.01 0.00 − 5.07 0.44 − 0.43Blue Dart
Aviation Ltd.4.30 0.67 14.69 1.31 10.24 10.70 1.96 1.21
Go Airlines (India) Ltd.
7.59 0.91 7.89 1.49 0.00 17.19 1.63 1.24
Interglobe Aviation Ltd.
14.33 9.37 16.51 12.25 317.71 49.28 1.31 13.34
Jet Airways (India) Ltd.
− 4.62 − 9.01 2.94 − 9.74 0.00 − 12.07 1.08 − 1.05
Jet Lite (India) Ltd.
− 15.92 − 19.68 − 16.09 − 65.23 0.00 0.00 3.32 − 4.24
SpiceJet Ltd. − 9.96 − 13.10 − 8.71 − 24.74 0.00 − 94.41 1.89 − 3.16Median 3.62 − 0.73 6.35 − 2.75 0.00 4.19 1.71 0.72Mean − 1.52 − 9.19 1.66 − 21.67 − 65.28 − 61.77 1.93 − 39.27
13 DGCA Handbook 2018–19.
12 https ://www.ndtv.com/busin ess/coron aviru s-crisi s-airli nes-expec ted-to-lose-84-3-billi on-due-to-covid -19-says-indus try-body-iata-22436 59

465Sustainability of airlines in India with Covid-19: Challenges ahead and possible way-outs
Table 4 Altman Z-score of airlines in India for the years 2015 to 2019
Company Name Year X1 X2 X3 X4 X5 Model A Model BNet CA/TA
Retainedearnings/TA
Operatingprofit/TA
Market cap/Debt
Sales/TA
1.2X1 + 1.4 X2 + 3.3 X3 + 0.6 X4 + 1.0 X5
3.25 + 6.56 X1 + 3.26 X2+ 6.72 X3 +1.05 X4
AirAsia (India) Ltd. 2019 -1.22 -1.63 -0.79 4.31 3.19 -0.26 -10.93Go Airlines (India) Ltd. -0.35 -0.12 0.02 -0.13 1.55 0.99 0.59Interglobe Aviation Ltd. 0.40 0.26 0.05 19.04 1.14 13.52 26.87SpiceJet Ltd. -0.47 -0.20 0.03 5.21 1.90 4.34 5.16AIR India Express Ltd. 2018 -0.93 -0.46 0.22 0.24 0.97 0.17 -2.64Air India Ltd. -0.60 -1.09 0.02 0.51 0.47 -1.18 -3.55AirAsia (India) Ltd. -0.35 -0.81 -0.13 0.00 2.39 0.55 -2.62Blue Dart Aviation Ltd. -0.20 0.05 0.21 0.08 1.42 1.99 3.62Go Airlines (India) Ltd. -0.40 -0.15 0.11 0.01 1.32 1.04 0.91Interglobe Aviation Ltd. 0.40 0.31 0.19 17.48 1.09 13.06 26.36Jet Airways (India) Ltd. -0.57 -0.59 0.06 0.66 1.86 1.05 -1.35Jet Lite (India) Ltd. -0.23 -7.74 0.04 0.47 4.02 -5.13 -22.72SpiceJet Ltd. -0.54 -0.16 0.23 5.65 1.92 5.23 6.60TATA SIA Airlines Ltd. 0.21 -1.78 -0.47 0.00 2.44 -0.99 -4.34AIR India Express Ltd. 2017 -0.92 -0.53 0.23 0.22 0.89 0.04 -2.74Air India Ltd. -0.59 -1.12 0.04 0.53 0.51 -1.08 -3.42AirAsia (India) Ltd. -0.47 -1.20 -0.31 0.00 2.32 -0.71 -5.81Blue Dart Aviation Ltd. 0.00 0.06 0.22 0.00 1.67 2.49 4.96Go Airlines (India) Ltd. -0.41 -0.03 0.15 0.06 1.10 1.10 1.53Interglobe Aviation Ltd. 0.27 0.20 0.18 12.84 1.08 9.93 20.21Jet Airways (India) Ltd. -0.50 -0.52 0.24 0.49 1.70 1.55 0.35Jet Lite (India) Ltd. -0.52 -10.87 0.05 0.59 6.02 -7.14 -34.69SpiceJet Ltd. -0.59 -0.40 0.23 5.22 2.07 4.76 5.01TATA SIA Airlines Ltd. -0.17 -2.51 -1.12 0.00 3.10 -3.80 -13.54AIR India Express Ltd. 2016 -0.85 -0.54 0.25 0.24 0.76 0.05 -2.20Air India Ltd. -0.37 -0.86 0.05 0.39 0.42 -0.65 -1.23Blue Dart Aviation Ltd. -0.23 0.08 0.34 0.15 2.22 3.25 4.44Go Airlines (India) Ltd. -0.69 -0.11 0.09 0.04 0.93 0.30 -0.97Interglobe Aviation Ltd. 0.14 0.16 0.26 8.55 1.14 7.49 15.32Jet Airways (India) Ltd. -0.45 -0.16 0.15 0.44 1.11 1.15 1.29Jet Lite (India) Ltd. -0.39 -11.62 0.09 0.33 4.03 -9.88 -36.21SpiceJet Ltd. -0.68 -0.58 0.24 3.03 1.79 2.90 1.68TATA SIA Airlines Ltd. 0.10 -1.54 -0.99 0.00 1.76 -3.25 -7.79AIR India Express Ltd. 2015 -0.88 -0.63 0.15 0.27 0.68 -0.47 -3.30Air India Ltd. -0.50 -0.82 0.00 0.32 0.44 -0.95 -2.37Blue Dart Aviation Ltd. -0.10 0.07 0.34 0.12 2.33 3.50 5.29Go Airlines (India) Ltd. -0.69 -0.21 0.11 0.04 1.33 0.64 -1.16Interglobe Aviation Ltd. 0.02 0.03 0.20 -0.50 1.19 1.61 4.28Jet Airways (India) Ltd. -0.51 -0.22 0.03 0.30 1.07 0.48 -0.27Jet Lite (India) Ltd. -0.39 -8.66 -0.63 0.30 3.82 -8.94 -31.46SpiceJet Ltd. -0.70 -0.85 -0.18 0.86 2.01 0.10 -4.37
Pink cells portray risky zone and green cells represent safe zone as per Altman Z-score

466 A. Agrawal
airlines industry may witness decline of 33 to 60% seats offered, reduced passenger traffic from 1878 to 3227 million and gross operating revenue loss of approximately USD 244 to 420 million for the year 2020.14 As per the report, the estimated decline is the worst ever observed before during any of the crisis, economic or otherwise (Fig. 4).
Airlines in India are vulnerable to high operating lever-age (Sakthidharan and Sivaraman 2018). Operating lever-age signifies an ability of a firm to use its fixed operating expenses to magnify the impact of change in its sales on its operating profit. Degree of operating leverage (DOL) is cal-culated as Total Contribution /Total EBIT. High the degree of operating leverage, higher will be the magnifying impact of increased operations/sales on EBIT (Chen et al. 2019; García-Feijóo and Jorgensen 2010; Mandelker and Rhee 1984). For instance, 2 times of DOL implies that if sales
Fig. 3 PLF of Airlines across world during January to March 2020. Source Statista 2020
Fig. 4 Global aviation passenger traffic trend amid different crisis (during 1945 to 2020)
14 https ://www.icao.int/susta inabi lity/Docum ents/COVID -19/ICAO_Coron aviru s_Econ_Impac t.pdf

467Sustainability of airlines in India with Covid-19: Challenges ahead and possible way-outs
increase by 10% than EBIT will increase by 10 × 2, i.e., 20 times. It is worth mentioning, that use of fixed operating cost signifies the risk in operations; the risk of repaying the fixed charges in case income fall short of expectations (Gahlon 1981; McDaniel 1984). Performance of high levered firms significantly reduced compared to their competitors in industry downturns due to enhanced cost of financial dis-tress (González 2013). In the backdrop of severe downturn expected in the industry, the highly levered airlines in India are likely to suffer heavy losses. Table 5 exhibits the degree of operating leverage of four airlines in India and the con-sequences on the EBITDA of the airlines, with the different expectations of possible decline in sales amid covid impact. The rationale of including select airlines for analysis is the unavailability of the data for the year 2019. As provided, Air Asia (India) is in losses; Go Air, SpiceJet and Intergloble are reflecting alarming degree of operating risk. High the DOL, higher will the expected losses. With 14.76 times of DOL, EBITDA of Interglobe Aviation is expected to decline by 7.38 times with 50% dip in its revenue, i.e., from 1173.94 lac crores of EBITDA to negative— 7488.06 lac crores.
Cost of social distancing
Social distancing practices initiated by regulatory author-ities and airlines to prevent infection outbreak will be
financial hit on airlines pocket (IATA Economics 2020). Declined PLF coupled with cost of social distancing is expected to threaten the commercial viability of airlines operations. Measures such as leave empty seats between passengers in the aircraft will reduce the seating capacity by 30 to 50%. In India, DGCA laid down social distancing norms and sanitization norms for airlines to be followed during passengers handling, sanitizing aircrafts, check-points and baggage, PPE kits, medical team, etc. This cost will further dig the profitability of the airlines. The DGCA advisory of blocking middle seat, will compressed the seat offering capacity of airlines 60 to 70%. PLF is an important driver of airline financial performance. Based on a sample of 122 airlines, on average, airlines break even at a load factor of 77%. Notwithstanding the high PLF of 70 to 75%, airlines are witnessed struggling for break-even. As per IATA analysis, out of the sample of 122 air-lines across globe, only 4 airlines will manage break-even below 62%. In the present scenario, where airlines PLF is expected to decline by 30 to 50%, the financially feasibility of airlines operations seems scary. Additionally, the cost of implementing other social distancing and sanitization norms will further enhance the airlines’ costing. Airlines perhaps find it difficult to cover the variable cost of their operations.
Table 5 Projected operating loss of Airlines amid Covid impact
Company name AirAsia (India) Ltd. Go Airlines (India) Ltd.
Interglobe Avia-tion Ltd.
Spicejet Ltd.
In croresNet sales 2511.64 6262.44 28496.77 9113.25Other operating income 27.42 213.32 1324.94 144.78Variable cost Power & fuel cost 1371.82 2264.03 11942.79 3456.18 Selling and distribution expenses 50.95 200.02 554.92 207.44
Operating fixed cost (excluding depreciation) 1739.74 3922.4 16150.06 5427.22 Total expenditure 3162.51 6386.45 28647.77 9090.84
Contribution (net sales-variable expenses) 1116.29 4011.71 17324.00 5594.41 EBITDA − 623.45 89.31 1,173.94 167.19 EBITDA margin − 0.25 0.01 0.04 0.02 Degree of operating leverage = EBITDA/contribution − 1.79 44.92 14.76 33.46
% change in EBITDA with change in operations size Decline in sales by 30% − 0.54 13.48 4.43 10.04 Decline in sales by 40% − 0.72 17.97 5.90 13.38 Decline in sales by 50% − 0.90 22.46 7.38 16.73
EBITDA with decline in operations size Decline in sales by 30% − 958.34 − 1114.20 − 4023.26 − 1511.13 Decline in sales by 40% − 1069.97 − 1515.37 −5755.66 − 2070.57 Decline in sales by 50% − 1181.60 − 1916.55 − 7488.06 − 2630.02

468 A. Agrawal
The road ahead
Post-lockdown world will be not be the business as usual. The airline industry combat with Covid-19 and its after effects seems taxing and perhaps long drawn-out. The sustainability and survival of airlines warrants for turna-round changes in their strategies and business model to strengthen their financial stamina. Overcapacity, intense competition and high operating cost are the major factors affecting airlines performance. To overcome the present challenge of covid crisis, optimal utilization of resources, cooperation rather than competition, and cost optimization seem to be the possible way-outs for sustaining with com-mercially viable take-off on rough terrain.
Cargo‑cum‑passenger traffic
Air cargo business despite of being a least preferred choice of airlines compared to passenger business, has an important role to play in the airline’s profitability. Threatening subsistence with the growing challenges of
the industry warrants for major structural changes in the present business model. Accommodating the cargo busi-ness in the existing business model perhaps be an effective steps towards the improved performance (Reis and Silva 2016). The globalization of the supply chain has resulted in competitive pressure on the air cargo industry. With independent and improved supply chain strategies, airlines can positioned themselves in the global supply chain mar-ket (Hong et al. 2018). High degree of cargo business is evident to improve the operational efficiency of combina-tion as well as cargo airline (Hong et al., 2018). Airlines with a high share of cargo business in their overall opera-tions are significantly more efficient than airlines ( Hong and Zhang 2010). However, challenges for handling cargo makes it less attractive to airlines compared to passenger business. Combination airlines use the belly space of pas-senger aircrafts to substantiate the cargo. These airlines often experience the problem of freight orders exceed-ing the airline’s fixed capacity, particularly for hot selling routes (Feng et al. 2015).
Fig. 5 Average seat capacity of scheduled operating Indian fleet (2018–2019). Source DGCA
161 186 157 181 177
144
186
160 160
83 71 71
41
18 17 6
233
186 186 185
180
169
0
50
100
150
200
250
----A
vera
ge S
eat C
apac
ity (I
n N
o.)--
--
DOMESTIC INTERNATIONAL
Fig. 6 Cargo carried through dedicated cargo planes and belly cargo. Source DGCA
83.3 82.1 79.7 78.8 76.9 80.0 79.9 79.82 82 84.1
16.7 17.9 20.3 21.2 23.07 20.0 20.1 20.18 18 15.9
0
20
40
60
80
100
120
BELLY CARGO DEDICATED CARGO

469Sustainability of airlines in India with Covid-19: Challenges ahead and possible way-outs
In present scenario, where a severe decline in passenger traffic as well as restricted destinations is expected amid infection paranoia, cargo business perhaps can be used a rescue boat to safeguard the airlines from expected the crash landing. It is a saying in management accounting, that in short-term if profits can’t be maximized, focus should be on minimizing the losses. For optimum capacity utilization, cargo-cum-passenger model can be an effective way-out. At present nearly 8% of freight business in India is done through belly cargo.15 Only Blue Dart is fully dedicated air-lines for freight cargo business (Fig. 5). In view of restricted passenger movements, from January onwards airlines across the globe have started engaging passenger aircrafts entirely for cargo (Fig. 6). Indigo followed by SpiceJet have also joined the race.
Figure 7 portray the average seat capacity of scheduled airlines in Indian during FY 2018–2019. As provided, most of the airlines have the average capacity of 160 to 180. With the expected 30–35 decline in passenger traffic in current fiscal,16 accommodating cargo load for unutilized seats can mitigate the revenue losses of the airlines. Amid low pas-senger traffic, dedicating small aircrafts (with less seating capacity) for passenger business relatively will be more financially viable for the airlines. Big aircrafts can be tem-porarily converted in cargo planes for carrying supplies. Depending upon the cargo load, large capacity planes can be fully dedicated or utilized as passenger cum cargo planes. In view of DGCA advisory to leave middle seat vacant, some temporary arrangements for accommodating cargo in
provided space can be worked out. For instance, vacant seat can be used for carrying passenger’s luggage and the side carriers can be utilized for lesser weights parcels. Also, the space used for accommodating passengers’ check-in luggage can be utilized for cargo business. The passenger cabin can be restructured in such a manner that its front and back seats can be used for passenger traffic and middle space can be utilized for cargo services.
Alliance for resource sharing
Airline industry is known for ugly competition and fare wars that perhaps has been the prime reason for their meagre profit margin (Eng and Vichitsarawong 2019). In the back-drop of trimmed passenger traffic expected for upcoming months, pooling of resources perhaps can be useful step in this direction. Airlines industry needs to adapt cooperation model instead of competition. Alliance in the airline industry is a widely used strategy to stimulate competition (Cobeña et al. 2019). Alliances are useful rescue for the firms with vulnerable strategic positions either because of competition or when they are attempting pioneering technical strategies (Eisenhardt and Schoonhoven 1996). They enhance value by facilitating optimal utilization of pooled resources (Das and Teng 2000). The alliance, perhaps, can be better way-out for balancing these demand and supply fluctuations. Alliance for aircraft sharing can possibly assist the airlines in optimizing their aircraft capacities and mitigating their operating losses.
Dues waiver
The covid economic impact on aviation is extreme and per-haps uncertain. Higher the reduction in PLF, more difficult will be the attainment of break-even for the airlines. The lockdown of two months with zero revenue and spiraled
Fig. 7 Cargo business using passenger flights during January to April 2020. Source ICAO
16 https ://www.hindu stant imes.com/busin ess-news/india -s-domes tic-air-traffi c-to-fall-to-90-mn-this-fisca l-repor t/story -YnObZ Buttd z95G7 D4Sn4 fM.html
15 Using passenger planes for carrying cargo in belly space

470 A. Agrawal
fixed charges, particularly, loan instalments and lease rental, perhaps has drained out the liquidity of airlines. With the trimmed air traffic estimated in the coming months, there seems meagre probability of recovering the past losses. With the reduced PLF the recovery of variable cost of operating a flight will be challenging, threating the operation viabil-ity of airlines. Figure 8 portray projection done by ICAO regarding commercials of aviation sector. As provided, in all the situations the operating losses are confirmed, with the only difference in the magnitude of losses from high to low. In the given situation, bailout package, particularly, waivers of interest charges pertaining to lockdown period, reduced landing and parking charges, ATF taxes, seems essential for the stability of the sector. The cost waivers by reducing operating cost of airlines will enhance the airlines probability of attaining break-even. In fact, in view of dipped consumable income, the reduced cost possibly be a relief for passengers in terms of affordable flying. Air travelers rate assurance (Singh, 2016) and financial conditions of airlines significantly affect the quality of air travel. Product quality decreases when airlines are in financial distress (Phillips and Sertsios 2013). Given the deteriorating finances and demand crunch ahead, airlines service quality and safe operations may be compromised. Further, the reasonable ticket cap as a safeguard to airlines as well as passengers’ interest may be implemented.
Concluding observations
Present paper attempts to analyze the vulnerability of air-lines in India to withstand Covid-19 after effects. Lock-down of two months has been drastic for the fragile airlines business distressed with thin margins, liquidity crisis, over
mounting fixed cost and debt. Zero revenue, albeit spiral-ing fixed expenses has been a drain on the cash reserves of airlines dragging them towards insolvency. Above all, the sector is viewing grim recession ahead. In this backdrop, the operation viability of airlines seems conditional on the recovery of variable expenses. Sustainability of airlines war-rants of turnaround changes in their revenue strategies and operating models. Focus on minimizing losses rather than profit maximization possibly can help the airlines to combat current situation.
References
Alamdari, F., and S. Fagan. 2005. Impact of the adherence to the original low-cost model on the profitability of low-cost airlines. Transport Reviews 25 (3): 377–392. https ://doi.org/10.1080/01441 64050 00387 48.
Altman, E. I. (2013). Predicting financial distress of companies: Revis-iting the Z-Score and ZETA® models. In Handbook of Research Methods and Applications in Empirical Finance (pp. 428–456). Edward Elgar Publishing. https ://doi.org/10.4337/97808 57936 097.00027
Altman, I. (1968). Altman Z-Score. FCS Commercial Finance Group.Baltagi, B.H., J.M. Griffin, and D.P. Rich. 1995. The measurement of
firm-specific indexes of technical change. The Review of Econom-ics and Statistics 77 (4): 654. https ://doi.org/10.2307/21098 13.
Belobaba, P.P. 2011. Did LCCs save airline revenue management? Journal of Revenue and Pricing Management 10 (1): 19–22. https ://doi.org/10.1057/rpm.2010.45.
Bieger, T., and A. Wittmer. 2006. Air transport and tourism: Perspec-tives and challenges for destinations, airlines and governments. Journal of Air Transport Management 12 (1): 40–46. https ://doi.org/10.1016/j.jairt raman .2005.09.007.
Chen, Z., J. Harford, and A. Kamara. 2019. Operating leverage, profit-ability, and capital structure. Journal of Financial and Quanti-tative Analysis 54 (1): 369–392. https ://doi.org/10.1017/S0022 10901 80005 95.
Fig. 8 Possible scenarios of Covid impact on airlines commercials. Source ICAO

471Sustainability of airlines in India with Covid-19: Challenges ahead and possible way-outs
Clark, R., and N. Vincent. 2012. Capacity-contingent pricing and competition in the airline industry. Journal of Air Transport Management 24: 7–11. https ://doi.org/10.1016/j.jairt raman .2012.04.005.
Cobeña, M., Á. Gallego, and C. Casanueva. 2019. Diversity in airline alliance portfolio configuration. Journal of Air Transport Manage-ment 75: 16–26. https ://doi.org/10.1016/j.jairt raman .2018.11.004.
Das, T.K., and B.-S. Teng. 2000. A resource-based theory of strate-gic alliances. Journal of Management 26 (1): 31–61. https ://doi.org/10.1177/01492 06300 02600 105.
Deeppa, K., and R. Ganapathi. 2018. Customers’ loyalty towards low cost airlines in India. SCMS Journal of Indian Management 15: 42–48.
Dhanda, N., and M. Sharma. 2018. A study on analysis of operating efficiency of Air India and Indigo airlines. Journal of Advances and Scholarly Researches in Allied Education 15 (3): 6–10. https ://doi.org/10.29070 /15/56746 .
Doganis, R. 2005. The Airline Business. The Airline Business: Routledge.
Eisenhardt, K.M., and C.B. Schoonhoven. 1996. Resource-based view of strategic alliance formation: Strategic and social effects in entrepreneurial firms. Organization Science 7 (2): 136–150. https ://doi.org/10.1287/orsc.7.2.136.
Eng, L.L., and T. Vichitsarawong. 2019. Competition and profits in the airline industry: The case of AirAsia and Malaysia Airlines. International Journal of Revenue Management 11 (1/2): 126. https ://doi.org/10.1504/IJRM.2019.10304 9.
Feng, B., Y. Li, and H. Shen. 2015. Tying mechanism for airlines’ air cargo capacity allocation. European Journal of Opera-tional Research 244 (1): 322–330. https ://doi.org/10.1016/j.ejor.2015.01.014.
Gahlon, J.M. 1981. Operating leverage as a determinant of systematic risk. Journal of Business Research 9 (3): 297–308. https ://doi.org/10.1016/0148-2963(81)90023 -0.
García-Feijóo, L., and R.D. Jorgensen. 2010. Can operating leverage be the cause of the value premium? Financial Management 39 (3): 1127–1154. https ://doi.org/10.1111/j.1755-053X.2010.01106 .x.
González, V.M. 2013. Leverage and corporate performance: Interna-tional evidence. International Review of Economics & Finance 25: 169–184. https ://doi.org/10.1016/j.iref.2012.07.005.
Hong, S.-J., W. Randall, K. Han, and A.S. Malhan. 2018. Estimation viability of dedicated freighter aircraft of combination carriers: A data envelopment and principal component analysis. Interna-tional Journal of Production Economics 202: 12–20. https ://doi.org/10.1016/j.ijpe.2018.05.012.
Hong, S., and A. Zhang. 2010. An efficiency study of airlines and air cargo/passenger divisions: A DEA approach. World Review of Intermodal Transportation Research 3 (1/2): 137. https ://doi.org/10.1504/WRITR .2010.03158 4.
Hooper, P. 1997. Liberalisation of the airline industry in India. Jour-nal of Air Transport Management 3 (3): 115–123. https ://doi.org/10.1016/S0969 -6997(97)00019 -7.
IATA Economics. (2020). IATA Economics Chart of the Week-Social distancing would make most airlines financially unviable. IATA Economics.
Jain, R.K., and R. Natarajan. 2015. A DEA study of airlines in India. Asia Pacific Management Review 20 (4): 285–292. https ://doi.org/10.1016/j.apmrv .2015.03.004.
Josephi, S. (2005). Revenue Management. In Key Concepts in Hos-pitality Management (pp. 140–144). 1 Oliver’s Yard, 55 City Road London EC1Y 1SP: SAGE Publications, Inc. https ://doi.org/10.4135/97815 26435 606.n32
Krämer, A., M. Friesen, and T. Shelton. 2018. Are airline passengers ready for personalized dynamic pricing? A study of German con-sumers. Journal of Revenue and Pricing Management 17 (2): 115–120. https ://doi.org/10.1057/s4127 2-017-0122-0.
Laing, T. 2020. The economic impact of the Coronavirus 2019 (Covid-2019): Implications for the mining industry. The Extractive Industries and Society 7 (2): 580–582. https ://doi.org/10.1016/j.exis.2020.04.003.
Lee, J. 2019. Effects of operational performance on financial perfor-mance. Management Science Letters. https ://doi.org/10.5267/j.msl.2018.11.003.
Mahtani, U.S., and C.P. Garg. 2018. An analysis of key factors of financial distress in airline companies in India using fuzzy AHP framework. Transportation Research Part A 117: 87–102. https ://doi.org/10.1016/j.tra.2018.08.016.
Mandelker, G.N., and S.G. Rhee. 1984. The impact of the degrees of operating and financial leverage on systematic risk of common stock. The Journal of Financial and Quantitative Analysis. https ://doi.org/10.2307/23310 00.
McDaniel, W.R. 1984. Operating leverage and operating risk. Journal of Business Finance & Accounting 11 (1): 113–125. https ://doi.org/10.1111/j.1468-5957.1984.tb000 62.x.
Merkert, R., and H. Swidan. 2019. Flying with(out) a safety net: Finan-cial hedging in the airline industry. Transportation Research Part E 127: 206–219. https ://doi.org/10.1016/j.tre.2019.05.012.
Mhlanga, O. 2019. Impacts of the macro environment on airline performances in southern Africa: Management perspectives. Tourism and Hospitality Research 19 (4): 439–451. https ://doi.org/10.1177/14673 58418 77144 2.
Michaels, L., and S. Fletcher. 2009. Competing in an LCC world. Jour-nal of Revenue and Pricing Management 8 (5): 410–423. https ://doi.org/10.1057/rpm.2009.7.
O’Connell, J. F. (2018). The Routledge Companion to Air Transport Management. (N. Halpern & A. Graham, Eds.), The Routledge Companion to Air Transport Management. 1 Edition. | New York : Routledge, 2018. | Series: Routledge companions in business, management and accounting: Routledge. https ://doi.org/10.4324/97813 15630 540
O’Connell, J.F., and G. Williams. 2006. Transformation of India’s domestic airlines: A case study of Indian Airlines, Jet Airways, Air Sahara and Air Deccan. Journal of Air Transport Management 12 (6): 358–374. https ://doi.org/10.1016/j.jairt raman .2006.09.001.
Ohri, M. 2012. Discussion paper: Airport privatization in India. Net-works and Spatial Economics. https ://doi.org/10.1007/s1106 7-009-9117-8.
Pathak, A.A. 2015. Survival lessons from a dying Kingfisher. Strategic Direction 31 (8): 13–16. https ://doi.org/10.1108/SD-06-2015-0086.
Phillips, G., and G. Sertsios. 2013. How do firm financial conditions affect product quality and pricing? Management Science 59 (8): 1764–1782. https ://doi.org/10.1287/mnsc.1120.1693.
Ratliff, R., and B. Vinod. 2005. Future of revenue management: Airline pricing and revenue management: A future outlook. Journal of Revenue and Pricing Management 4 (3): 302–307. https ://doi.org/10.1057/palgr ave.rpm.51701 49.
Reis, V., and J. Silva. 2016. Assessing the air cargo business models of combination airlines. Journal of Air Transport Management 57: 250–259. https ://doi.org/10.1016/j.jairt raman .2016.08.011.
Riwo-Abudho, M., Njanja, L. W., & Ochieng, I. 2013. Key success factors in airlines: Overcoming the challenges. European Journal of Business and Management 5 (3): 84–88.
Sakariya, S., Parmar, D., Thandamalla, J. S., & Suresh, K. (2009). Kingfisher’s acquisition of air deccan: Altering India’s LCC sce-nario? The Case Centre.
Sakthidharan, V., and S. Sivaraman. 2018. Impact of operating cost components on airline efficiency in India: A DEA approach. Asia Pacific Management Review 23 (4): 258–267. https ://doi.org/10.1016/j.apmrv .2017.12.001.
Saranga, H., and R. Nagpal. 2016. Drivers of operational efficiency and its impact on market performance in the Indian Airline industry.
472 A. Agrawal
Journal of Air Transport Management 53: 165–176. https ://doi.org/10.1016/j.jairt raman .2016.03.001.
Sibdari, S., I. Mohammadian, and D.F. Pyke. 2018. On the impact of jet fuel cost on airlines’ capacity choice: Evidence from the U.S. domestic markets. Transportation Research Part E 111: 1–17. https ://doi.org/10.1016/j.tre.2017.12.009.
Singh, A.K. 2016. Competitive service quality benchmarking in airline industry using AHP. Benchmarking 23 (4): 768–791. https ://doi.org/10.1108/BIJ-05-2013-0061.
Srinidhi, S. 2010. Demand model for air passenger traffic on interna-tional sectors. South Asian Journal of Management. 17: 23–56.
Stamolampros, P., and N. Korfiatis. 2019. Airline service quality and economic factors: An ARDL approach on US airlines. Journal of Air Transport Management 77: 24–31. https ://doi.org/10.1016/j.jairt raman .2019.03.002.
Thams, A., Zech, N., Rempel, D., Ayia-koi, A., & Management, H. (2020). Tourism & Hospitality: An initial assessment of economic impacts and operational challenges for the tourism & hospitality industry due to COVID-19. IUBH Discussion Papers.
Thirunavukkarasu, A. 2015. An analysis on domestic airlines capac-ity performance in India. International Journal of Management (IJM). 6: 12.
Wang, K., A. Zhang, and Y. Zhang. 2018. Key determinants of air-line pricing and air travel demand in China and India: Policy,
ownership, and LCC competition. Transport Policy 63: 80–89. https ://doi.org/10.1016/j.tranp ol.2017.12.018.
Wren-Lewis, S. (2020). The economic effects of a pandemic. Econom-ics in the Time of COVID-19.
Yang, H. 2007. Airlines’ futures. Journal of Revenue and Pricing Management 6 (4): 309–311. https ://doi.org/10.1057/palgr ave.rpm.51601 05.
Publisher’s Note Springer Nature remains neutral with regard to jurisdictional claims in published maps and institutional affiliations.
Dr. Anshu Agrawal is a faculty in the area of accounting and finance at Indian Institute of Management Sirmaur, Himachal Pradesh. She has completed M. Com, M.A (Economics). She has done PhD in the area of Mergers and Acquisitions from Department of Management Studies, Indian Institute of Technology Delhi in 2014. She is into teaching for six years. She has research papers in national and international journals to her credit. She has presented papers in national and international conferences.