susan e. perkins, katherine w. phillips, and nicholas a
TRANSCRIPT
National leaders have the ultimate responsibility to balance the needs of a diverse set of con-stituents in society while using their country’s unique set of resources to grow the economy and gain comparative advantages. Ethnic diversity is known to be an extremely challenging factor to reconcile nationally and is negatively associated with GDP growth; in fact, high levels of ethnic diversity are associated with a 2 percent decline in GDP growth.1 In most countries throughout modern history, the role of the national leader has been played by men. Women historically have had limited opportunities to lead their countries and in many early cases, only by the failing of their husband’s health or his death did they ascend to power. In the last decade, however, more women have been elected to lead their countries, such as Ellen Johnson Sirleaf in the Republic of Liberia; Angela Merkel of the Federal Republic of Germany; and most recently, Park Geun-hye in the Republic of Korea, under the political platform of harmonious unification with the Democratic People’s Republic of Korea. With the rise in female national leaders, it begs the question whether there are some conditions in which women might be more effective leaders than their male counterparts. This study examines the intersection of ethnic diversity, gender, and leadership to explore the effectiveness of male versus female leadership in highly diverse societies, as compared to more ethnically homogeneous ones. We examine a unique dataset of 5,709 observations of national leaders in 139 nations over more than five decades. We find that in more ethnically diverse nations, the presence of a female national leader is correlated with a 6.6 percent increase in GDP growth in comparison to having a male leader. We offer some plausible rationales for these patterns and discuss the policy implications of our findings.
National leaders have the ultimate responsibility to balance the needs of a diverse set of constituents in society while using their country’s unique set of
resources to grow the economy and gain comparative advantages. Salient to many observers, the United States of America, the world’s largest economy, has never had a female president or vice president and has had only forty-four women serve in the 224-year history of the U.S. Senate. Moreover, if women do make it into top-ranked government leadership positions, whether or not they perform notably dif-
Fall/Winter 2013 | 85Journal of International Affairs, Fall/Winter 2013, Vol. 67, No. 1.© The Trustees of Columbia University in the City of New York
Susan E. Perkins, Katherine W. Phillips, and Nicholas A. Pearce
Ethnic DivErsity, GEnDEr, anD national lEaDErs

Susan E. Perkins, Katherine W. Phillips, and Nicholas A. Pearce
86 | Journal oF international aFFairs
ferently from their male counterparts still remains unknown. Though studies pre-sented by several psychologists validate that women’s leadership styles differ from their male counterparts—as being more democratic, inclusive, participative, and
transformative—how this plays out nationally in terms of setting national policy agendas and making key decisions for society is explained only anecdot-ally.2 For example, Ellen Johnson Sirleaf, affection-ately known to her countrymen as the “Iron Lady,” was said to bring a “motherly sensitivity” to post-war torn Liberia; Michelle Bachelet, the Republic of Chile’s first female national leader, won in 2006 on a campaign championing gender equality and inclu-sion; and most recently, Park Geun-hye won the presidential election in the Republic of Korea under the political platform of “disarming vicious cycles of distrust and building peace” with the Democratic People’s Republic of Korea.3 These anecdotes all suggest an association with a gender-specific percep-
tion of governance, as well as a gender-specific expectation for substantive policy changes with a female taking the lead at the national level.
To develop a better understanding of the unique contributions of female national leaders, this article uses global cross-national comparative leader data from 188 countries to explore the following questions: How have global trends of national female leadership changed over time? Is there evidence that having a female—as compared to a male—leader has differential consequences for economic growth as ethnic diversity increases?
Global trends of national female leadership: What has chanGed over time?
Early civilizations had no shortage of great women leaders of dynasties, empires, and tribes, such as Cleopatra of Egypt and Julia Augusta of the Roman Empire. The legacy of women in national leadership continued through the 1800s, which featured queens at the helm of burgeoning sovereign states. However, in the recent era of democratization, with the introduction of representative government and equal voting rights, there has been a dearth of female national leaders. Not until 1969 was the first female elected as prime minister—Golda Meir of Israel—after the death of her predecessor. It took yet another decade for the second woman to be elected to lead her country as prime minister—Margaret Thatcher of the United Kingdom.4 The probability of a woman reaching the top leadership ranks
In the recent era of democratization, with the introduction of representative government and equal voting rights, there has been a dearth of female national leaders.
Ethnic Diversity, Gender, and National Leaders
Fall/Winter 2013 | 87
of society is slim; less than 5 percent of the national leaders across the 188 coun-tries we examined since the 1950s have been female. Given how few women have risen to these national leadership positions over time, our interest here is to docu-ment if and how this trend has changed over time. We shall then further explore whether women’s attainment of leadership is associated with differential economic outcomes depending on the level of ethnic diversity in the country.
descriptive statistics
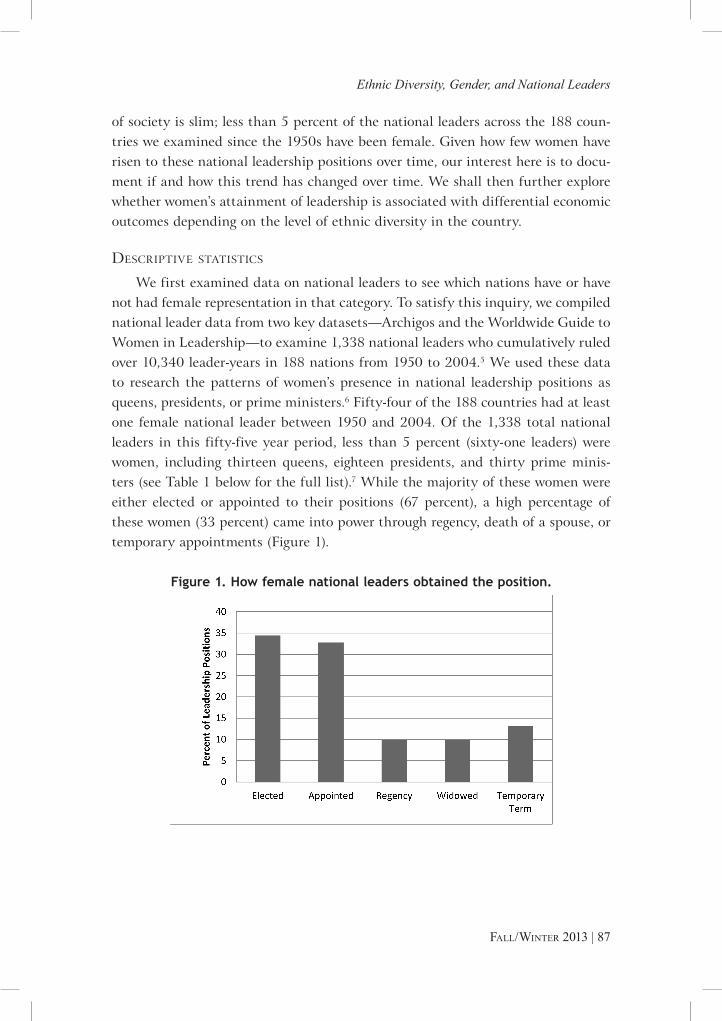
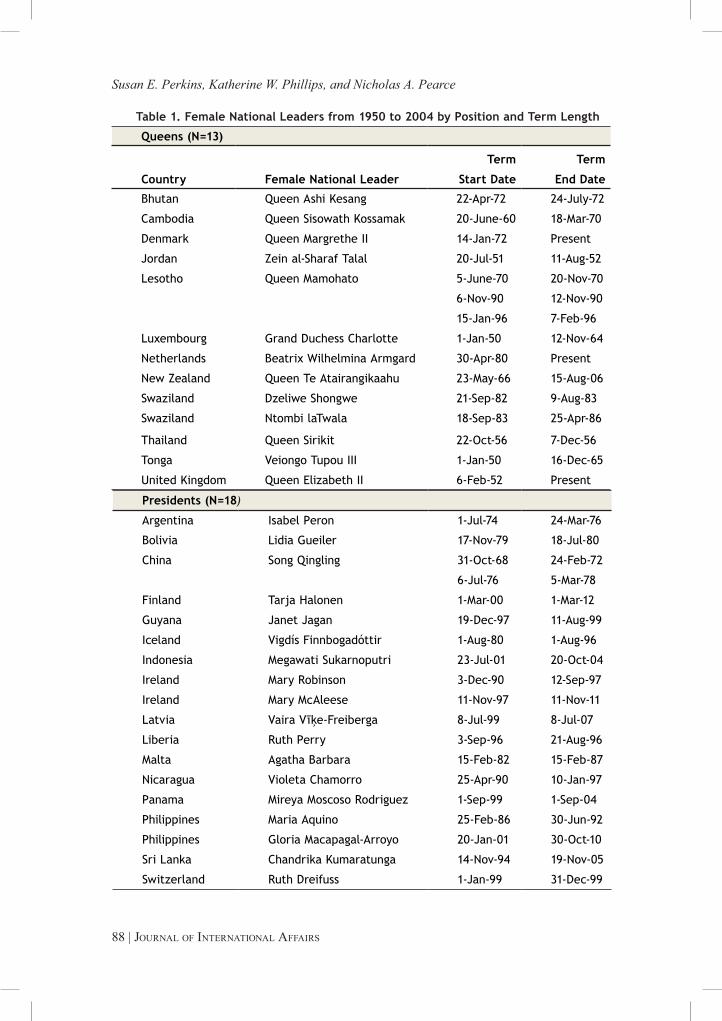
We first examined data on national leaders to see which nations have or have not had female representation in that category. To satisfy this inquiry, we compiled national leader data from two key datasets—Archigos and the Worldwide Guide to Women in Leadership—to examine 1,338 national leaders who cumulatively ruled over 10,340 leader-years in 188 nations from 1950 to 2004.5 We used these data to research the patterns of women’s presence in national leadership positions as queens, presidents, or prime ministers.6 Fifty-four of the 188 countries had at least one female national leader between 1950 and 2004. Of the 1,338 total national leaders in this fifty-five year period, less than 5 percent (sixty-one leaders) were women, including thirteen queens, eighteen presidents, and thirty prime minis-ters (see Table 1 below for the full list).7 While the majority of these women were either elected or appointed to their positions (67 percent), a high percentage of these women (33 percent) came into power through regency, death of a spouse, or temporary appointments (Figure 1).
Figure 1. How female national leaders obtained the position.
Susan E. Perkins, Katherine W. Phillips, and Nicholas A. Pearce
88 | Journal oF international aFFairs
Table 1. Female National Leaders from 1950 to 2004 by Position and Term Length
Queens (N=13)
Country Female National Leader
Term
Start Date
Term
End Date
Bhutan Queen Ashi Kesang 22-Apr-72 24-July-72
Cambodia Queen Sisowath Kossamak 20-June-60 18-Mar-70
Denmark Queen Margrethe II 14-Jan-72 Present
Jordan Zein al-Sharaf Talal 20-Jul-51 11-Aug-52
Lesotho Queen Mamohato 5-June-70 20-Nov-70
6-Nov-90 12-Nov-90
15-Jan-96 7-Feb-96
Luxembourg Grand Duchess Charlotte 1-Jan-50 12-Nov-64
Netherlands Beatrix Wilhelmina Armgard 30-Apr-80 Present
New Zealand Queen Te Atairangikaahu 23-May-66 15-Aug-06
Swaziland Dzeliwe Shongwe 21-Sep-82 9-Aug-83
Swaziland Ntombi laTwala 18-Sep-83 25-Apr-86
Thailand Queen Sirikit 22-Oct-56 7-Dec-56
Tonga Veiongo Tupou III 1-Jan-50 16-Dec-65
United Kingdom Queen Elizabeth II 6-Feb-52 Present
Presidents (N=18)
Argentina Isabel Peron 1-Jul-74 24-Mar-76
Bolivia Lidia Gueiler 17-Nov-79 18-Jul-80
China Song Qingling 31-Oct-68 24-Feb-72
6-Jul-76 5-Mar-78
Finland Tarja Halonen 1-Mar-00 1-Mar-12
Guyana Janet Jagan 19-Dec-97 11-Aug-99
Iceland Vigdís Finnbogadóttir 1-Aug-80 1-Aug-96
Indonesia Megawati Sukarnoputri 23-Jul-01 20-Oct-04
Ireland Mary Robinson 3-Dec-90 12-Sep-97
Ireland Mary McAleese 11-Nov-97 11-Nov-11
Latvia Vaira Vīķe-Freiberga 8-Jul-99 8-Jul-07
Liberia Ruth Perry 3-Sep-96 21-Aug-96
Malta Agatha Barbara 15-Feb-82 15-Feb-87
Nicaragua Violeta Chamorro 25-Apr-90 10-Jan-97
Panama Mireya Moscoso Rodriguez 1-Sep-99 1-Sep-04
Philippines Maria Aquino 25-Feb-86 30-Jun-92
Philippines Gloria Macapagal-Arroyo 20-Jan-01 30-Oct-10
Sri Lanka Chandrika Kumaratunga 14-Nov-94 19-Nov-05
Switzerland Ruth Dreifuss 1-Jan-99 31-Dec-99

Ethnic Diversity, Gender, and National Leaders
Fall/Winter 2013 | 89
Prime Ministers (N=30)
Bangladesh Khaleda Zia 20-Mar-91 30-Mar-96
1-Oct-01 29-Oct-06
Bangladesh Hasina Wajed 23-Jun-96 15-Jul-01
Bulgaria Reneta Indzhova 17-Oct-94 25-Jan-95
Burundi Sylvie Kinigi 27-Oct-93 5-Feb-94
Canada Kim Campbell 25-Jun-93 4-Nov-93
Central African Republic Élisabeth Domitién 3-Jan-75 7-Apr-76
Dominica Eugenia Charles 21-Jul-80 14-Jun-95
Finland Anneli Jäätteenmäki 17-Apr-03 24-Jun-03
France Édith Cresson 15-May-91 2-Apr-92
Guyana Janet Jagan 17-Mar-97 22-Dec-97
Haiti Claudette Werleigh 7-Nov-95 27-Feb-96
India Indira Gandhi 19-Jan-66 24-Mar-77
14-Jan-80 31-Oct-84
Israel Golda Meir 17-Mar-69 3-June-74
Lithuania Kazimira Prunskienė 17-Mar-90 10-Jan-91
Lithuania Irena Degutiené 3-May-99 18-May-99
Mozambique Luísa Diogo 17-Feb-04 16-Jan-10
New Zealand Jennifer Shipley 8-Dec-97 10-Dec-99
New Zealand Helen Clark 10-Dec-99 19-Nov-08
Norway Gro Harlem Brundtland 4-Feb-81 14-Oct-96
9-May-86 16-Oct-89
3-Nov-90 25-Oct-96
Pakistan Benazir Bhutto 2-Dec-88 6-Aug-90
19-Oct-93 5-Nov-96
Peru Beatriz Merino Lucero 28-Jun-03 15-Dec-03
Poland Hanna Suchocka 8-Jul-92 26-Oct-93
Portugal Maria de Lourdes Pintasilgo 1-Aug-79 3-Jan-80
Rwanda Agathe Uwilingiyimana 18-Jul-93 7-Apr-94
Sao Tome and Principe Maria das Neves 3-Oct-02 18-Sept-04
Senegal Mame Madior Boye 3-Mar-01 4-Nov-02
Sri Lanka Sirimavo Bandaranaike 21-Jul-60 27-Mar-65
29-May-70 23-Jul-77
14-Nov-94 10-Aug-00
Sri Lanka Chandrika Kumaratunga 19-Aug-94 14-Nov-94
Turkey Tansu Çiller 25-Jun-93 6-Mar-96
United Kingdom Margaret Thatcher 4-May-79 28-Nov-90
Susan E. Perkins, Katherine W. Phillips, and Nicholas A. Pearce
90 | Journal oF international aFFairs
The first female national leader who did not come into power by regency is Sirimavo Bandaranaike, the Prime Minister of Sri Lanka, who assumed leadership in 1960 after her husband Prime Minister Solomon Bandaranaike’s assassination and his potential successor’s illness.
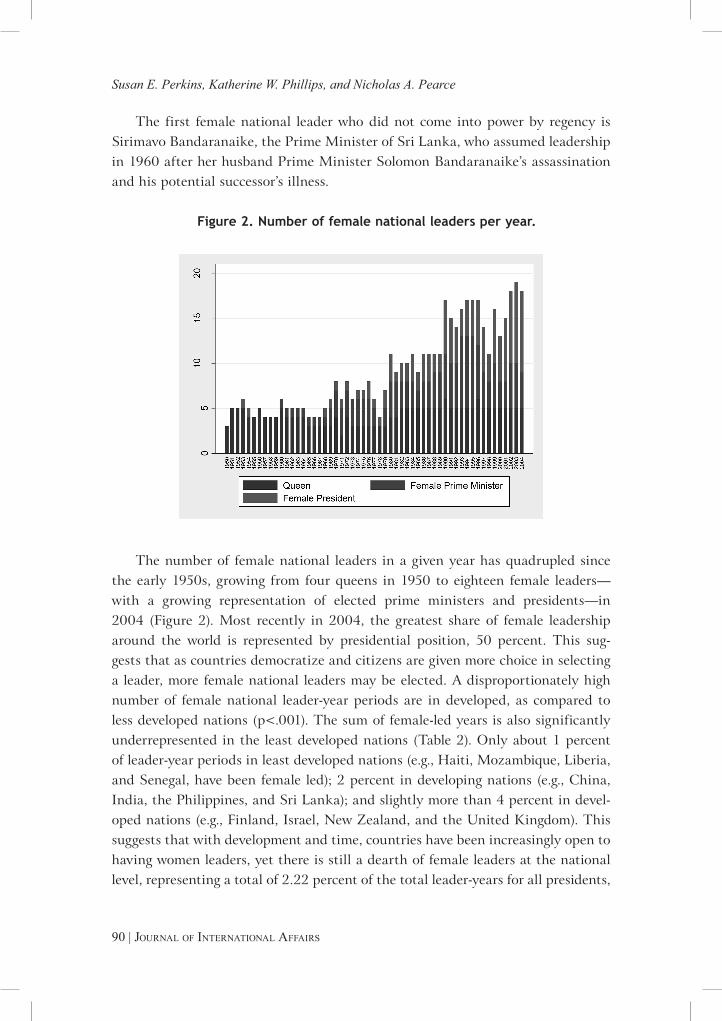
Figure 2. Number of female national leaders per year.
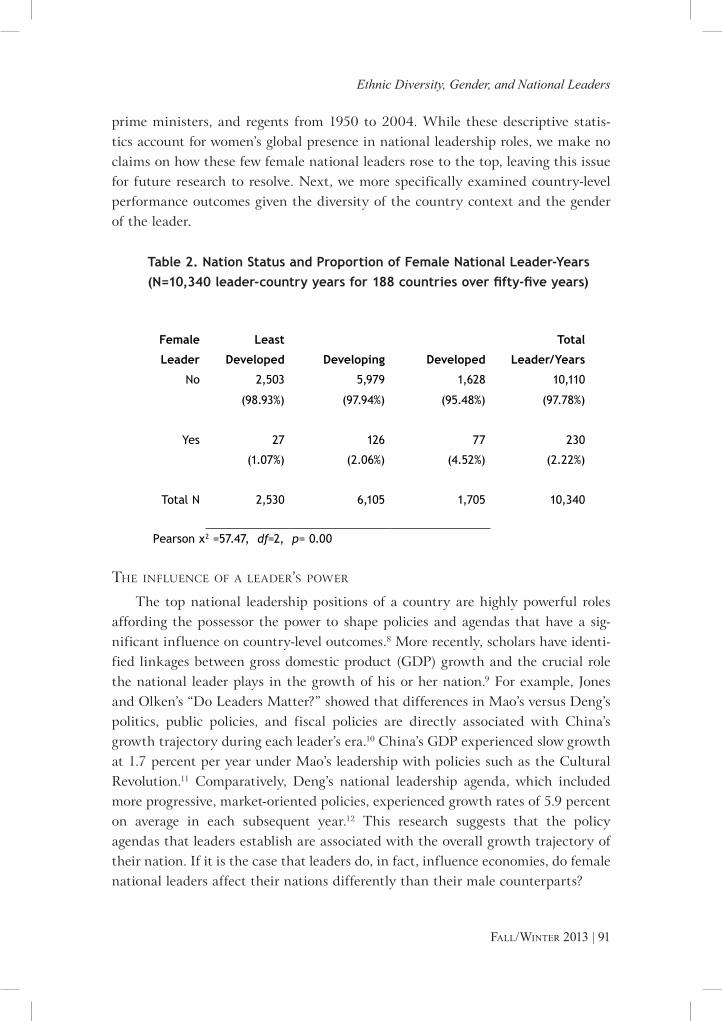
The number of female national leaders in a given year has quadrupled since the early 1950s, growing from four queens in 1950 to eighteen female leaders—with a growing representation of elected prime ministers and presidents—in 2004 (Figure 2). Most recently in 2004, the greatest share of female leadership around the world is represented by presidential position, 50 percent. This sug-gests that as countries democratize and citizens are given more choice in selecting a leader, more female national leaders may be elected. A disproportionately high number of female national leader-year periods are in developed, as compared to less developed nations (p<.001). The sum of female-led years is also significantly underrepresented in the least developed nations (Table 2). Only about 1 percent of leader-year periods in least developed nations (e.g., Haiti, Mozambique, Liberia, and Senegal, have been female led); 2 percent in developing nations (e.g., China, India, the Philippines, and Sri Lanka); and slightly more than 4 percent in devel-oped nations (e.g., Finland, Israel, New Zealand, and the United Kingdom). This suggests that with development and time, countries have been increasingly open to having women leaders, yet there is still a dearth of female leaders at the national level, representing a total of 2.22 percent of the total leader-years for all presidents,
Ethnic Diversity, Gender, and National Leaders
Fall/Winter 2013 | 91
prime ministers, and regents from 1950 to 2004. While these descriptive statis-tics account for women’s global presence in national leadership roles, we make no claims on how these few female national leaders rose to the top, leaving this issue for future research to resolve. Next, we more specifically examined country-level performance outcomes given the diversity of the country context and the gender of the leader.
Table 2. Nation Status and Proportion of Female National Leader-Years(N=10,340 leader-country years for 188 countries over fifty-five years)
Female
Leader
Least
Developed Developing Developed
Total
Leader/Years
No 2,503 5,979 1,628 10,110
(98.93%) (97.94%) (95.48%) (97.78%)
Yes 27 126 77 230
(1.07%) (2.06%) (4.52%) (2.22%)
Total N 2,530 6,105 1,705 10,340
Pearson χ2 =57.47, df=2, p= 0.00
the influence of a leader’s poWer
The top national leadership positions of a country are highly powerful roles affording the possessor the power to shape policies and agendas that have a sig-nificant influence on country-level outcomes.8 More recently, scholars have identi-fied linkages between gross domestic product (GDP) growth and the crucial role the national leader plays in the growth of his or her nation.9 For example, Jones and Olken’s “Do Leaders Matter?” showed that differences in Mao’s versus Deng’s politics, public policies, and fiscal policies are directly associated with China’s growth trajectory during each leader’s era.10 China’s GDP experienced slow growth at 1.7 percent per year under Mao’s leadership with policies such as the Cultural Revolution.11 Comparatively, Deng’s national leadership agenda, which included more progressive, market-oriented policies, experienced growth rates of 5.9 percent on average in each subsequent year.12 This research suggests that the policy agendas that leaders establish are associated with the overall growth trajectory of their nation. If it is the case that leaders do, in fact, influence economies, do female national leaders affect their nations differently than their male counterparts?
Susan E. Perkins, Katherine W. Phillips, and Nicholas A. Pearce
92 | Journal oF international aFFairs
does the Gender of the national leader matter?
To examine whether a leader’s gender affects societal outcomes, we analyzed an economic indicator that could potentially benefit from having a leader with traits such as inclusiveness, democratic diplomacy, and a transformational style—all characteristics that are stereotypically female leadership traits.13 An economic indicator particularly important in capturing the complexity of societal inclusion is the level of ethnic diversity in the country, more commonly known in the eco-nomic development literature as ethnic fractionalization (EF), or ethnic diversity
by political scientists. EF reflects the number of ethnic groups within a country and the probability that a fellow countryman is of another ethnic group.14 The conventional measurement of EF is the likelihood that two people chosen at random in a given society will be from different ethnic groups.15 Development economists and political scientists have shown that more ethnically diverse societies suffer from a lack of inclusion, more inequalities, and greater conflict among ethnic groups.16
Some nations face more complexity when it comes to developing cohesion, maintaining inclu-sion, and managing issues associated with high levels of diversity. For example, ethnic diversity
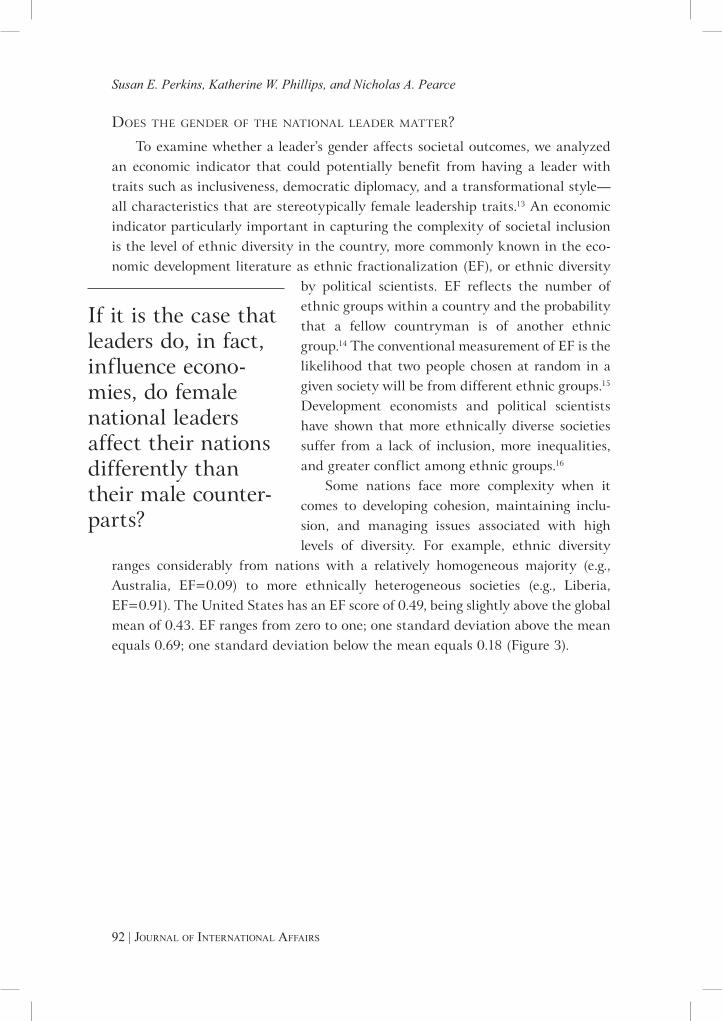
ranges considerably from nations with a relatively homogeneous majority (e.g., Australia, EF=0.09) to more ethnically heterogeneous societies (e.g., Liberia, EF=0.91). The United States has an EF score of 0.49, being slightly above the global mean of 0.43. EF ranges from zero to one; one standard deviation above the mean equals 0.69; one standard deviation below the mean equals 0.18 (Figure 3).
If it is the case that leaders do, in fact, influence econo-mies, do female national leaders affect their nations differently than their male counter-parts?
Ethnic Diversity, Gender, and National Leaders
Fall/Winter 2013 | 93
Figure 3. Ethnic fractionalization (EF) in selected nations. EF is a country-level index measure of ethnic diversity designed to capture the number of ethnic groups in a society. High levels of EF correspond to a value of one; low levels correspond to a value of zero. In our sample of 188 nations, the mean EF is 0.43.
Source: Data obtained from Alesina et al. (2003).
Development economists have repeatedly shown that high levels of ethnic diversity are inversely correlated with GDP growth. A one unit increase in ethnic diversity in a country—a transition from complete homogeneity to high diversity—is associated with 2 percent decline in GDP.17 While this finding may be a surprise to some, recent research has shown that more ethnic diversity in societies adds complexity to governing due to conflicts of interest between ethnic groups, less inclusiveness among the non-governing ethnic groups, and policy failure leading to underdevelopment.18 Collier’s most recent research has shown that unshared leadership in highly ethnically diverse settings can lead to more conflict and an increased risk of a political coup d’état.19
data description
To compare the performance outcomes among national leaders, our research design required longitudinal performance data that can be mapped onto distinct leadership regimes. To precisely link the two variables, we used annual Penn World Table GDP growth data for the subsequent year (GDP growth year +1).20 Leader performance was matched to the subsequent GDP growth year to avoid performance attribution errors during the years the leader transitions in and out of office.21 We followed the longstanding tradition of development economists,

Susan E. Perkins, Katherine W. Phillips, and Nicholas A. Pearce
94 | Journal oF international aFFairs
political scientists, and international institutions, such as the World Bank and the United Nations, that use GDP growth data to examine cross-national macroeco-nomic performance differences. We used the Archigos and Worldwide Guide to Women in Leadership datasets to identify the leader’s gender: 1=female; 0=male.22 In this set of analyses, we excluded the queens and only focused on presidents and prime ministers, as the queen’s power is largely symbolic. Our data across the performance and leader variables included 10,340 leader-year observations from 1950 to 2004.
To measure ethnic diversity at the national level, we used the EF measure introduced above and illustrated in Figure 3.23 The most ethnically homogenous country in our sample is Comoros (EF=0) and the most diverse is Uganda (EF=0.93). Paraguay represents one standard deviation below the mean (EF=0.17), and Senegal represents one standard deviation above the mean (EF=0.69). In addition to the diversity measure, we also collected data on the other known correlates of economic growth. Solow’s classic economic growth theory predicts that national growth is a function of both physical and human capital inputs.24 However, more recent studies on cross-national compara-
tive economic growth focus on institutions as the source of variance in national productivity.25 The four cross-national comparative measures used to proxy these important factors are the Gapminder population database (size proxy), paved roads (investment rate proxy), post-secondary schooling (human capital proxy), and rule of law (institutional proxy).26 The combination of these datasets yielded 5,709 leader-year observations from 1950 to 2004, representing 139 of the 188 total countries.27
The combination of these datasets yielded 5,709 leader-year observations from 1950 to 2004, representing 139 of the 188 total countries.
Ethnic Diversity, Gender, and National Leaders
Fall/Winter 2013 | 95
results
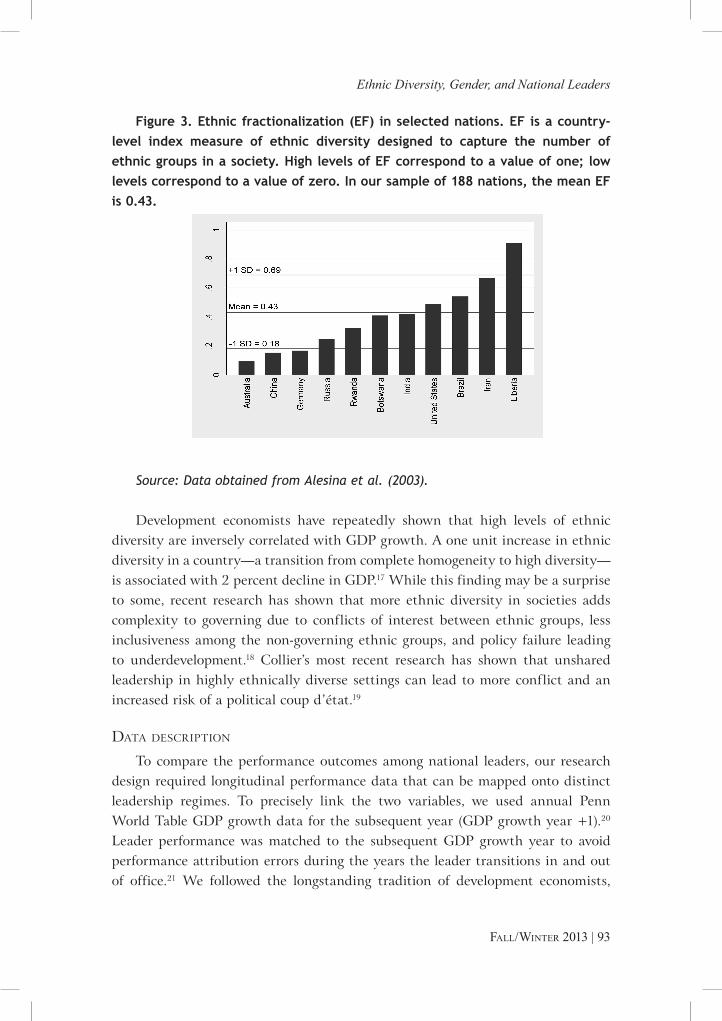
Results detailing significant correlations and interactions are revealed across the four models presented in Table 4, with details on the empirical methodology provided in the appendix. First, we found consistent baseline results that replicate the predicted economic development argument, which suggests that GDP grows at a higher rate in countries with higher investments in infrastructure, human capital, and strong rule of law (Model 1).28 Second, we introduce the EF measure into the empirical test in Model 2 to first establish the known inverse relationship between EF and GDP growth. While we make no claims about the causal mechanisms, the directional impact of EF on GDP growth is consistent with the idea that an ethni-cally diverse country is more difficult to lead than a less diverse country. Next, we conduct an empirical test to examine whether there are overall GDP growth rate differences between female and male leaders, and found no significant differ-ences (Model 3). On average, male and female leaders perform equally. Finally, we then tested the interaction of EF and gender (Model 4) and found a positive and significant (p<0.01) association with GDP growth rate. In other words, this inter-action suggests that high levels of ethnic fractionalization account for the biggest difference in GDP growth for male and female leaders. Highly ethnically diverse countries (EF=1) led by a female have a 6.6 percent GDP growth rate in the sub-sequent year (Figure 4). For example, in Liberia, one of the most ethnically diverse and difficult to lead countries in our sample (EF=0.91), the predicted GDP growth is 6.15 percent if the leader is female, versus 0.69 percent if the leader is male.
Figure 4. Ethnic fractionalization, national leader gender, and GDP growth.Female led countries with high levels of EF, have increasingly higher GDP growth rates in these complex situations relative to male leaders. In highly fractional-ized countries (EF=1), female leadership is correlated with a 6.6 percent GDP growth. Male leaders outperform the average growth rate in more homogenous countries.
Susan E. Perkins, Katherine W. Phillips, and Nicholas A. Pearce
96 | Journal oF international aFFairs
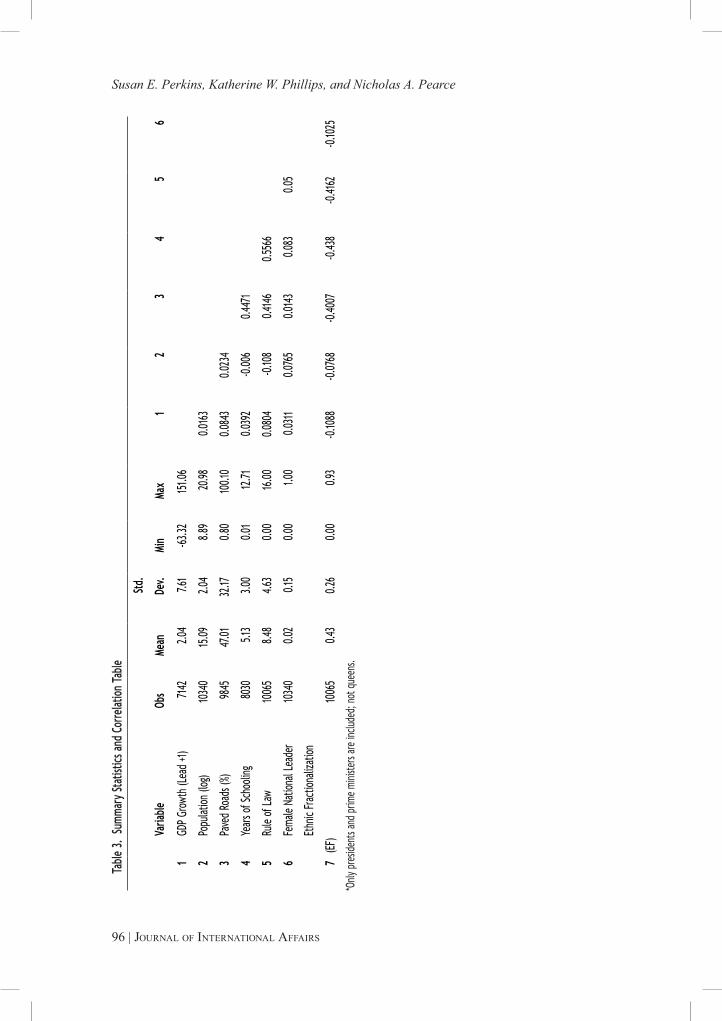
Table
3. S
umma
ry St
atisti
cs an
d Cor
relat
ion Ta
ble
Va
riable
Obs
Mean
Std.
Dev.
Min
Max
12
34
56
1GD
P Gro
wth (
Lead
+1)
7142
2.04
7.61
-63.32
151.0
6
2Po
pulat
ion (l
og)
1034
015
.092.0
48.8
920
.980.0
163
3Pa
ved R
oads
(%)
9845
47.01
32.17
0.80
100.1
00.0
843
0.023
4
4Ye
ars o
f Sch
oolin
g80
305.1
33.0
00.0
112
.710.0
392
-0.00
60.4
471
5Ru
le of
Law
1006
58.4
84.6
30.0
016
.000.0
804
-0.10
80.4
146
0.556
6
6Fe
male
Natio
nal L
eade
r10
340
0.02
0.15
0.00
1.00
0.031
10.0
765
0.014
30.0
830.0
5
7
Ethn
ic Fra
ction
aliza
tion
(EF)
1006
50.4
30.2
60.0
00.9
3-0.
1088
-0.07
68-0.
4007
-0.43
8-0.
4162
-0.10
25
*Only
pres
ident
s and
prim
e mini
sters
are i
nclud
ed; n
ot q
ueen
s.

Ethnic Diversity, Gender, and National Leaders
Fall/Winter 2013 | 97
Mod
el 1
:
Cont
rols
M
odel
2:
EF
M
odel
3:
Lead
er G
ende
r
M
odel
4:
EF X
Fem
ale
Popu
lati
on (
log)
0.09
50.
059
0.05
20.
043
(0.0
6)(0
.06)
(0.0
6)(0
.06)
Pave
d Ro
ads
(%)
0.01
5**
*0.
011
**0.
011
**0.
011
**
(0.0
0)(0
.00)
(0.0
0)(0
.00)
Year
s of
Sch
oolin
g-0
.074
-0.1
22**
-0.1
25**
-0.1
25**
(0.0
4)(0
.04)
(0.0
4)(0
.04)
Rule
of
Law
0.11
4**
*0.
084
**0.
084
**0.
087
**
(0.0
3)(0
.03)
(0.0
3)(0
.03)
Ethn
ic F
ract
iona
lizat
ion
(EF)
-2.4
3**
*-2
.377
***
-2.5
56**
*
(0.4
3)(0
.43)
(0.4
3)
Gen
der
Nat
iona
l Le
ader
0.89
1-1
.249
(0.5
3)(0
.87)
Fem
ale
X EF
7.39
5**
(2.3
7)
Cons
tant
-0.8
581.
478
1.54
31.
746
(0.9
4)(1
.02)
(1.0
2)(1
.03)
R2
0.01
10.
016
0.01
70.
018
N57
09.0
0
5709
.00
57
09.0
0
5709
.00
* p<
0.05
, **
p<0
.01,
***
p<0
.001
Tabl
e 4.
OLS
Reg
ress
ions
of
Lead
er G
DP
Gro
wth
Rat
e (L
ead
1)
Susan E. Perkins, Katherine W. Phillips, and Nicholas A. Pearce
98 | Journal oF international aFFairs
Why do Women perform better in diverse country contexts?
Psychologists point to behavioral correlations to explain why women might be more suitable leaders in diverse settings than men. Several meta-analyses have shown that there are perceptible differences in how men versus women lead in organizations and teams.30 Laboratory experiments and assessment studies show
that women tend to lead with a more participative-democratic style than men. The recent biosocial contingency model of leadership suggests that people look for leaders who fit the adaptive prob-lems of the situation.31 For example, people tend to select leaders with more traditionally feminine facial characteristics when the situation warrants a more cooperative intergroup setting. Conversely, competitive intergroup settings prompt individuals to choose leaders with a more traditional mascu-line appearance. Stereotypes also play a role in choosing a leader. For example, in a recent study, Brown et al. found that when there is a threat and perceived need for change in the environ-ment, people tend to prefer female to male leaders, aligning female stereotypes with change and male
stereotypes with stability.32 These psychological explanations suggest that women may be seen as more effective in difficult situations that require more cooperative, inclusive practices where they can then use their typically more democratic style to navigate.
Perhaps these explanations demonstrate why the unique historical context of a given country plays a role in when that country might be most amenable to having a woman lead. Notable contemporary examples include fragile post-war countries, such as Liberia with Ellen Johnson-Sirleaf; post-reunification Germany with Angela Merkel; the Korean peninsula as it considers reunification, with Park Geun-hye; and countries emerging from the shadow of harsh dictatorships or sup-pressive regimes, such as Chile with Michelle Bachelet. If these findings are true at the national leader level, perhaps nations, when given the opportunity, will elect female leaders in times of particularly intense social strife and conflict. Certainly this appears to be a common theme in the female national leadership examples presented above. Moreover, the complexity and risk of failure that accompanies these environments may make people more open to seeing a woman as an effective leader in such settings.33
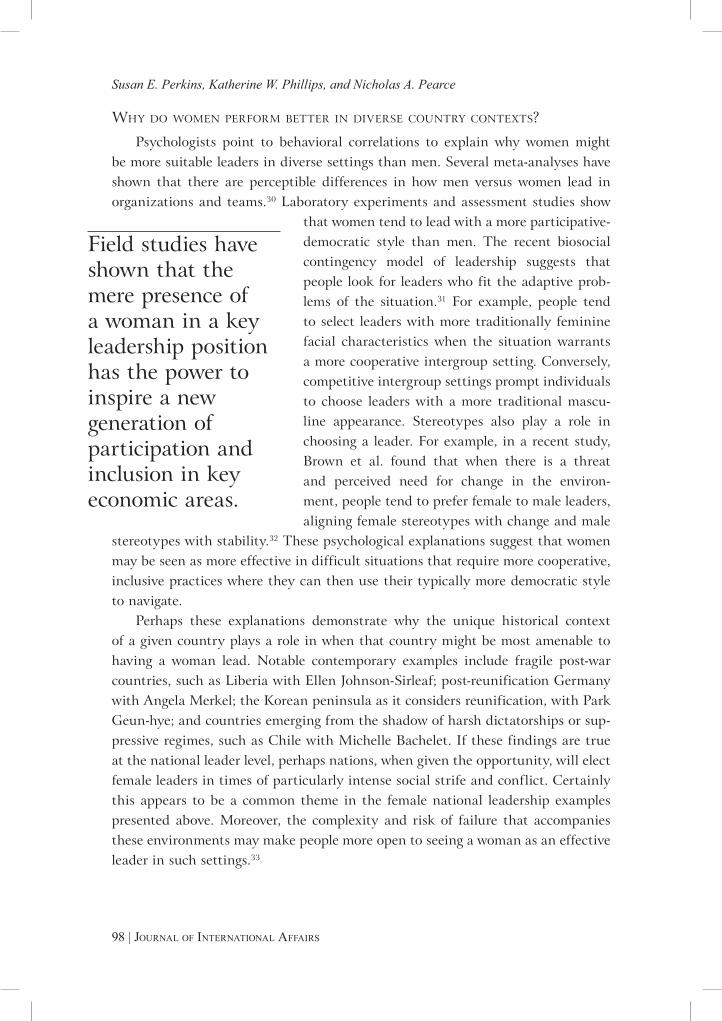
Field studies have shown that the mere presence of a woman in a key leadership position has the power to inspire a new generation of participation and inclusion in key economic areas.
Ethnic Diversity, Gender, and National Leaders
Fall/Winter 2013 | 99
Still another point of evidence for why women perform well in diverse settings is that their gender role is symbolic of change, therefore empowering other groups that had been previously disenfranchised or marginalized. Field studies have shown that the mere presence of a woman in a key leadership position has the power to inspire a new generation of participation and inclusion in key economic areas.34 This symbolic representation of change, coupled with real shifts in the policy agenda, has the potential to mobilize inclusion in societies that were otherwise constrained. We offer these plausible explanations so as to expand the discussion on the role of gender, diversity, and leadership rather than to suggest that these are the only plausible explanations. The scientific inquiry related to this research still has room for further questioning.
conclusion
Given the increasing likelihood of women entering national leadership roles due to changing global attitudes towards female leaders, gender-based political leadership quotas, and psychological explanations of gender-discrepant outcomes of leaders, it is increasingly important to understand and continue to explore these performance differences in female leaders relative to those of male leaders, especially at the national level.35
Our findings suggest that national environments that have perceived needs for leadership characteristics and role expectations, such as improving perceived inequities, empowering others, and inclusiveness, are environments in which female leaders are most effective. In these particularly complex conditions, which call for deep cooperation and collaboration, female leaders outperform their male counterparts. This demonstrated effect is not unique to the national leadership level. Similar evidence has been found in the corporate sector, where the presence of female leaders in the top ranks of U.S. corporations has had a positive effect on performance, but even more so in complex innovation situations where pro-social behaviors and diverse perspectives are most needed.36
The combined results of our study and studies of private sector organizations illustrate the magnitude of the challenges and opportunities facing nations and organizations. Although women represent about half of the world’s population, in the 188 countries we covered from 1950 to 2004, women comprised less than a miniscule 5 percent of national leaders. These small ratios are also prevalent in the private sector. While the pipeline of women in managerial positions in the
In these particularly complex conditions, which call for deep cooperation and collaboration, female leaders outperform their male counterparts.
Susan E. Perkins, Katherine W. Phillips, and Nicholas A. Pearce
100 | Journal oF international aFFairs
U.S. labor force has dramatically increased from 18 percent in 1972 to 45 percent in 2000, and while women currently represent almost 15 percent of the executive officers and board directors in the Fortune 500 (top U.S. firms) and the Financial Post 500 (top Canadian firms), females still only represent 1 percent of CEOs in these corporations.37 On average, national parliaments around the world are comprised of less than 15 percent women, and these positions fuel the pipeline for possible future female national leaders.38 Perhaps long-term sustained efforts—consociationalism for instance, which guarantees equitable representation of all groups, whether gender, ethnic, or otherwise in the top leadership of a society— could stimulate inclusion, participation, and economic advancement in otherwise fractionalized societies.39
future research opportunities
While this study advances our understanding of the correlation between female national leaders and ethnic diversity, we are merely beginning to uncover a myriad of questions regarding the role of female national leaders. Potential future research questions include: What factors influence female national leaders in consideration for election? What roles do country-level quotas for parliamentary positions play in improving the pipeline for female national leaders? What other national-level outcomes might be positively associated with female leaders? All of these are questions that would help us better understand the unique role women play in shaping the global economy.
APPENDIX
econometric models
Models 1 to 4 were estimated using OLS regression with a one-year perfor-mance lead. The analyses were conducted in Stata statistical programming package version 12.1.40 Population data was log transformed to address the right skewed dis-tribution of the variable. Additional robustness checks were conducted using the GDP growth rate two-year time lead (GDP year +2), GDP growth year and time lags (GDP year -1, -2) to capture the period before, during, and after the leader took office. Observing this five-year window around the leader’s entry assists in ruling out alternative explanations for inherited regimes performance (GDP year -1, -2) and continuity of current leader’s performance (GDP year +2). We find both the GDP year and two-year lead produces mostly consistent results.41 Replicating the models using the lagged variables, we find no significant interaction effects between gender of the leader and the ethnic diversity measure (EF). Additionally,

Ethnic Diversity, Gender, and National Leaders
Fall/Winter 2013 | 101
the Fearon et al. ethnic diversity measure is tested in lieu of the Alesina et al. EF measure and the results remain the same.42
We further tested the robustness of the model by trimming GDP growth year outliers, which potentially could skew the data relative to other leadership years.43 Year and country fixed effects were also included. We tested all models including annual GDP per capita as a baseline. Results remained consistent for all of these robustness checks.
notes
1 Alberto Alesina, Arnaud Devleeschauwer, William Easterly, Sergio Kurlat, and Romain Wacziarg, “Fractionalization,” Journal of Economic Growth 8, no. 2 (June 2003), 155-194.2 Alice H. Eagly, Mary C. Johannesen-Schmidt, and Marloes L. van Engen, “Transformational, Transactional, and Laissez-Faire Leadership Styles: A Meta-Analysis Comparing Women and Men,” Psychological Bulletin 129, no. 4 (2003), 569-591; Alice H. Eagly and Blair T. Johnson, “Gender and Leadership Style: A Meta Analysis,” Psychological Bulletin 108, no. 2 (1990), 233-256. 3 “Profile: Liberia’s ‘Iron Lady’,” BBC News, 23 November 2005, http://news.bbc.co.uk/1/hi/world/africa/4395978.stm; Eduardo Gallardo, “Two women leading presidential polls in Chile, raising pros-pect of first female leader,” Associated Press, 18 March 2005; Evan Ramstad, “Korean Political Heiress Seeks Presidency; Ex-Leader’s Daughter, Seeking to Be First Woman President, Joins Race as Front-Runner,” Wall Street Journal, 10 July 2012.4 Our point with these two examples is to distinguish them as prime ministers who were elected rather than appointed, as were Sirimavo Bandaranaike and Indira Ghandi of Sri Lanka and India, respectively. 5 The full Archigos data set can be found at: Henk E. Goemans, Kristian Skrede Gleditsch, and Giacomo Chiozza, “Archigos: A Data Set on Leaders 1875-2004,” Version 2.9 (13 August 2009), http://www.rochester.edu/college/faculty/hgoemans/Archigos.2.9-August.pdf. See Henk E. Goemans, Kristian Skrede Gleditsch, and Giacomo Chiozza, “Introducing Archigos: A Dataset of Political Leaders,” Journal of Peace Research 46, no. 2 (2009), 269-283; Martin K. Christensen, “Worldwide Guide to Women in Leadership” (2011), http://www.guide2womenleaders.com/.6 We follow the general coding rule established in the Archigos database. In parliamentary regimes, the effective leader is the prime minister, and in presidential systems, the president. In communist states, the chairman of the party is generally coded as the effective leader. In Table 1, for simplicity, we list the few leaders that fall into this latter category as presidents.7 We used both the “Archigos: A Data Set on Leaders 1875-2004” and the “Worldwide Guide to Women in Leadership,” to compile this list of female national leader terms.8 Timothy Besley, “Political Selection,” Journal of Economic Perspecives 19, no. 3 (Summer 2005), 43-60; Benjamin F. Jones, “national leadership and economic growth,” in New Palgrave Dictionary of Economics, ed. Steven N. Durlauf and Lawrence E. Blume (Palgrave Macmillan, 2009), http://www.dictionaryofeconomics.com/article?id=pde2009_N000171; Benjamin F. Jones and Benjamin A. Olken, “Do Leaders Matter? National Leadership and Growth Since World War II,” Quarterly Journal of Economics 120, no. 3 (2005), 835-864.9 Jones; Jones and Olken, 835-864.10 See Jones and Olken, 849, Figure 1, for a visual illustration of China’s growth patterns under the two administrations.11 Ibid., 848.12 Ibid., 848-849.13 Eagly, Johannesen-Schmidt, and van Engen, 569-591; Eagly and Johnson, 233-256.14 Alberto Alesina et al., (2003), 155-194; Alberto Alesina and Eliana La Ferrara, “Ethnic Diversity
Susan E. Perkins, Katherine W. Phillips, and Nicholas A. Pearce
102 | Journal oF international aFFairs
and Economic Performance,” Journal of Economic Literature 43, no. 3 (Summer 2005), 762-800; Paul Collier, “Ethnicity, Politics and Economic Performance,” Economics & Politics 12, no. 3 (November 2000), 225-245; William Easterly and Ross Levine, “Africa’s Growth Tragedy: Policies and Ethnic Divisions,” Quarterly Journal of Economics 112, no. 4 (November 1997), 1203-1250; James D. Fearon, “Ethnic and Cultural Diversity by Country,” Journal of Economic Growth 8, no. 2 (June 2003), 195-222; James Fearon, Kimuli Kasara and David Laitin, “Ethnic Minority Rule and Civil War Onset,” American Political Science Review 101, no. 1 (February 2007), 187-193; Ted Gurr, “Minorities at Risk Dataset” (Center for International Development and Conflict Management, University of Maryland, College Park, MD: 1996). 15 Alberto Alesina et al., (2003), 155-194.16 Alberto Alesina, Reza Baqir, and William Easterly, “Public Goods and Ethnic Division,” Quarterly Journal of Economics 114, no. 4 (November 1999), 1243-1284; Easterly and Levine (1997), 1203-1250; Alesina and La Ferrara (2005), 762-800.17 Alesina et al., (2003), 155-194; Easterly and Levine (1997), 1203-1250.18 Alesina et al., (2003), 175.19 Paul Collier, Wars, Guns, and Votes: Democracy in Dangerous Places (New York: Harper Collins, 2010), Ch. 2 and Ch. 6. 20 Growth is calculated as the annual growth rate of real GDP per capita in constant year 2000 prices. Alan Heston, Robert Summers, and Bettina Aten, “Penn World Table Version 6.3” (Center for International Comparisons of Production, Income and Prices, University of Pennsylvania: 2009), https://pwt.sas.upenn.edu/php_site/pwt_index.php.21 Jones and Olken, 835-864.22 Following the definition used in the Archigos database codebook, we identify the “effective primary ruler” (which often corresponds to the head of government) as the national leader—in par-liamentary systems the prime minister is coded, in presidential systems the president is coded, in communist states (generally) the party leader is coded. For those countries not covered in the Archigos database, we used the “Worldwide Guide to Women in Leadership” website, which lists presidents and prime ministers from 1950 to 2011. Our national leader variable is coded 0/1 for gender (0 = male, 1 = female). See Martin K. Christensen, “Worldwide Guide to Women in Leadership,” http://www.guide2womenleaders.com/.23 Eagly and Johnson (1990), 233-256.24 Robert M. Solow, “A Contribution to the Theory of Economic Growth,” Quarterly Journal of Economics 70, no. 1 (February 1956), 65-94.25 Daron Acemoglu, Simon Johnson, and James A. Robinson, “Institutions as the Fundamental Cause of Long-Run Growth,” in Handbook of Economic Growth Volume 1a, ed. Phillipe Aghion and Steven Durlauf (Amsterdam, Elsevier: 2005), 386-472.26 See Robert Barro and Jong-Wha Lee, “International comparisons of educational attainment,” Journal of Monetary Economics 32 (1993), 363-394 and Robert Barro and Jong-Wha Lee, “A New Data Set of Educational Attainment in the World, 1950-2010” (Working Paper 15902, National Bureau of Economic Research, Cambridge, MA: 2010), 1-47, http://www.nber.org/papers/w15902.pdf for human capital data on years of schooling; Mattias Lindgren, “Documentation for Total Population for Countries and Territories” (Gapminder Foundation, Stockholm: 2008) for population data; “Rule of Law” (Freedom House, Washington, DC: 2006) for Rule of Law data; “World Development Indicators” (The World Bank, Washington, DC: 2011) for infrastructure data on paved roads.27 Unavoidable data reduction is primarily due to the lack of country coverage on the Barro and Lee (2010) years of schooling measure, which covers 146 countries.28 See Acemoglu, Johnson, and Robinson (2005), 386-472 for an overview of institutions and eco-nomic growth; Barro and Lee (1993), 363-94 and Barro and Lee (2010), 1-47, http://www.nber.org/papers/w15902.pdf for human capital data on years of schooling; Mattias Lindgren, “Documentation for Total Population for Countries and Territories” for population data; Freedom House for Rule of Law data; “World Development Indicators” for infrastructure data on paved roads.29 Alesina et al., (2003), 166.30 Eagly and Johnson (1990), 233-256; Alice H. Eagly, Mona Makhijani and Bruce G. Klonsky, “Gender and the Evaluation of Leaders - A Meta-Analysis,” Psychological Bulletin 111, no. 1, 3-22.
Ethnic Diversity, Gender, and National Leaders
Fall/Winter 2013 | 103
31 Brian R. Spisak, Astrid C. Homan, Allen Grabo, and Mark Van Vugt, “Facing the situation: Testing a biocontingency model of leadership in intergroup relations using masculine and feminine faces,” Leadership Quarterly 23, no. 2 (April 2012), 273-280.32 Elizabeth R. Brown, Amanda B. Diekman, and Monica C. Schneider, “A Change Will Do Us Good: Threats Diminish Typical Preferences for Male Leaders,” Personality and Social Psychology Bulletin 37, no. 7 (5 April 2011), 930-941.33 S. Alexander Haslam and Michelle K. Ryan, “The Road to the Glass Cliff: Differences in the Perceived Suitability of Men and Women for Leadership Positions in Succeeding and Failing Organizations,” Leadership Quarterly 19, no. 5 (October 2008), 530-546; S. Alexander Haslam and Michelle K. Ryan, “The Glass Cliff: Evidence that Women are Over-Represented in Precarious Leadership Positions,” British Journal of Management 16, no. 29 (February 2005), 81-90.34 Lori Beaman, Esther Duflo, Rohini Pande and Petia Topalova, “Female Leadership Raises Aspirations and Educational Attainment for Girls: A Policy Experiment in India,” Science 335, no. 6068 (February 2012), 582-586.35 For changing voter attitudes see Lori Beaman, Raghabendra Chattopadhgay, Esther Duflo, Rohini Pande and Petia Topalova “Powerful Women: Does Exposure Reduce Bias?” Quarterly Journal of Economics 124, no. 4 (November 2009), 1497-1540. For leadership quotas, see Drude Dahlerup, ed. Women, Quotas and Politics (New York: Routledge, 2006). For psychological explanations, see Spisak, et al., (2012), 273-280.36 Roy D. Adler, “Women in the Executive Suite Correlate to High Profits,” Harvard Business Review 79, no. 3(2001), 131-137; Cristian L. Dezsö and David G. Ross, “Does Female Representation in Top Management Improve Firm Performance? A panel data investigation,” Strategic Management Journal 33, no. 9 (September 2012), 1072-1089.37 Peggy M. Lee and Erika Hayes James, “She’-E-Os: Gender Effects and Investor Reactions to the Announcements of Top Executive Appointments,” Strategic Management Journal 28, no. 3 (March 2007), 227-241; Marianne Bertrand and Kevin F. Hallock, “The Gender Gap in Top Corporate Jobs,” Industrial and Labor Relations Review 55, no. 1 (October 2001), 3-21; “Women ‘Take Care,’ Men ‘Take Charge:’ Stereotyping of U.S. Business Leaders Exposed (New York: Catalyst, 2005), http://www.catalyst.org/knowledge/women-take-care-men-take-charge-stereotyping-us-business-leaders-exposed.38 World Bank Gender Statistics (2011).39 Arend Lijphart, Democracy in Plural Societies: A Comparative Exploration (New Haven: Yale University Press, 1977), 1-9. Consociationalism suggests a model of democracy that is based on equitable repre-sentation when fractionalization and societal exclusion are high.40 “Stata Statistical Software: Release 12” (College Station, TX: StataCorp LP, 2011).41 Using GDP year, Table 4 results are replicated for all models. Using lead +2, Table 4 results are replicated for all models.42 Fearon, Kasara, and Laitin, (2007), 187-193; Alesina et al. (2003), 155-194.43 From 1950 to 2004, there were six observations across four countries (Equatorial Guinea, Ghana, Iraq, and the United Arab Emirates) that had GDP growth rates greater than 100 percent and less than negative 50 percent in a year (e.g., Equatorial Guinea grew 126 percent in 1997 due to oil dis-coveries in the Atlantic Ocean).
We thank Lotte Bailyn, Bruce Kogut, Thomas Kochan, David Ross, Ben Jones, Damon Phillips, Dan Posner, and Brian Uzzi for their helpful comments and feedback on an earlier version of this paper. This research was supported by the Northwestern University Center on the Science of Diversity and the Kellogg School of Management International Business and Markets Program.