survival of the fastest: using cultural algorithms to optimize
TRANSCRIPT
LOGO
Survival of the Fastest: Using Cultural Algorithms to Optimize the Design of a Controller for a 3D Racing Game
Robert G. Reynolds [email protected]
Professor, Department of ComputerWayne State University
Detroit, MI 48202
And
Leonard Kinnaird-HeetherWayne State University
1-27-2009

LOGO
Acknowledgements
Work reported is an extension of game programming projects in courses:
CSC 6430 (and 6431 (Lab))Game Programming and Design II
And
CSC 7800AI in Game Programming
These were offered in the Winter, of 2008.
Dr. Reynolds and Mr. Kinnaird-Heether were supported throughUM-WSU IGERT Grant # DGE-0654014
www.themegallery.com

LOGO
www.ai.cs.wayne.edu
Contents
Introduction to the Car Racing Competition1
Design of the Driver Controller State Machine2
Training the Controller with Cultural Algorithms3
4
2
23Cultural Algorithms Background
24
25 The Competition
Do Networks Matter?326
7Track Complexity and Network Learning
Conclusions328
9 Future Work

LOGOThe WCCI Car Racing Competition
2008
Develop a controller for the TORCS open source racing game. One of several competitions held at the 2008 World Congress in Hong Kong, China,
June 1-6, 2008. Rationale for the competition 1) To provide benchmarks for the comparison of learning algrithms which capture the
complexity of real-world problems. 2) Competition provides software, resources, interfaces and scoring procedures to
fairly and independently evaluate various algorithms and development methodologies.
3) Motivates researchers in the application of their approach to a new area, since entry is not restricted to those with computational intelligence-based approaches. Encourages comparison of seemingly heterogeneous approaches.
4) Opportunity to convince the game industry that CI algorithms can handle “real” games and not just academically posed ones.
www.themegallery.com

LOGO
The Competition Setup (TORCS)
The Open Source Car Simulator is a state-of-the art open source car racing simulator.
http://torcs.sourceforge.com
Midway between an advanced simulator and a 3D car racing game.
Features are:
1). A sophisticated physics engine
(e.g. aerodynamics, traction, fuel consumption, and collisions)
2). A 3D graphics engine for race visualization.
3). Designed to support customizable car controllers for plug
and play. Implemented as separable software modules.
4). A large amount of game content, many different tracks and surfaces.
Therefore, a large number of different racing surfaces can be produced.
www.themegallery.com
LOGO
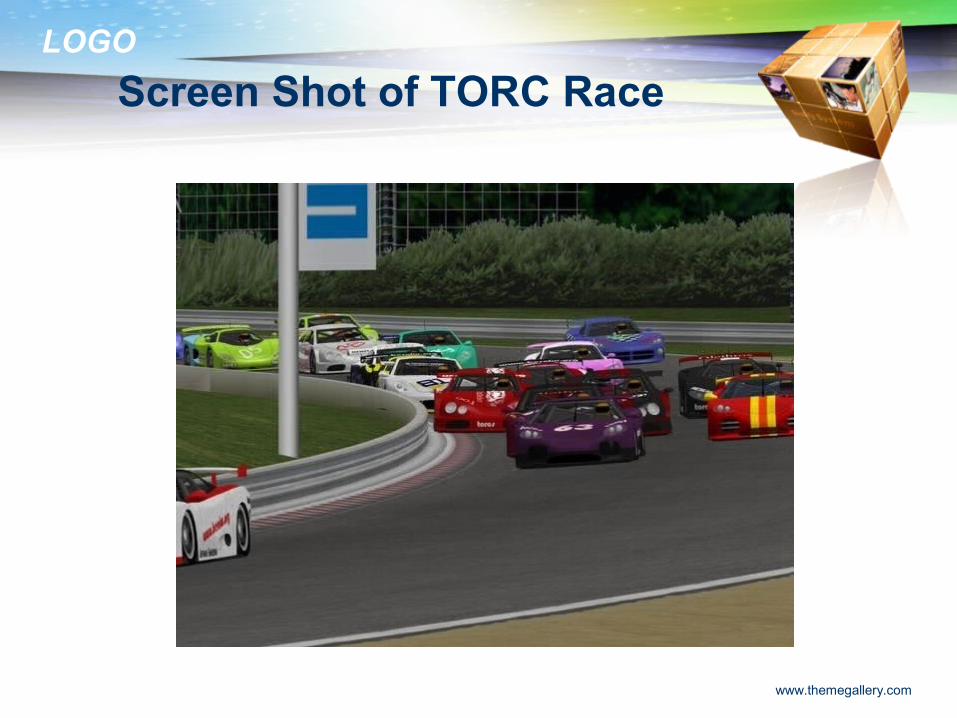
Screen Shot of TORC Race
www.themegallery.com
LOGO
Competition Specific Software Modifications
A specific software interface was developed using a client server architecture. Controllers run as external programs and communicate with a customized version of
TORCS through UDP connections. Controllers perceive the racing environment through sensor readings. Sensors reflect the surrounding environment and basic game state including the
tracks and opponents. They included: distance of nearby opponents, engine speed(RPM), fuel level (petrol), wheel spin velocity, a vector of 19 range finder sensors, and many others.
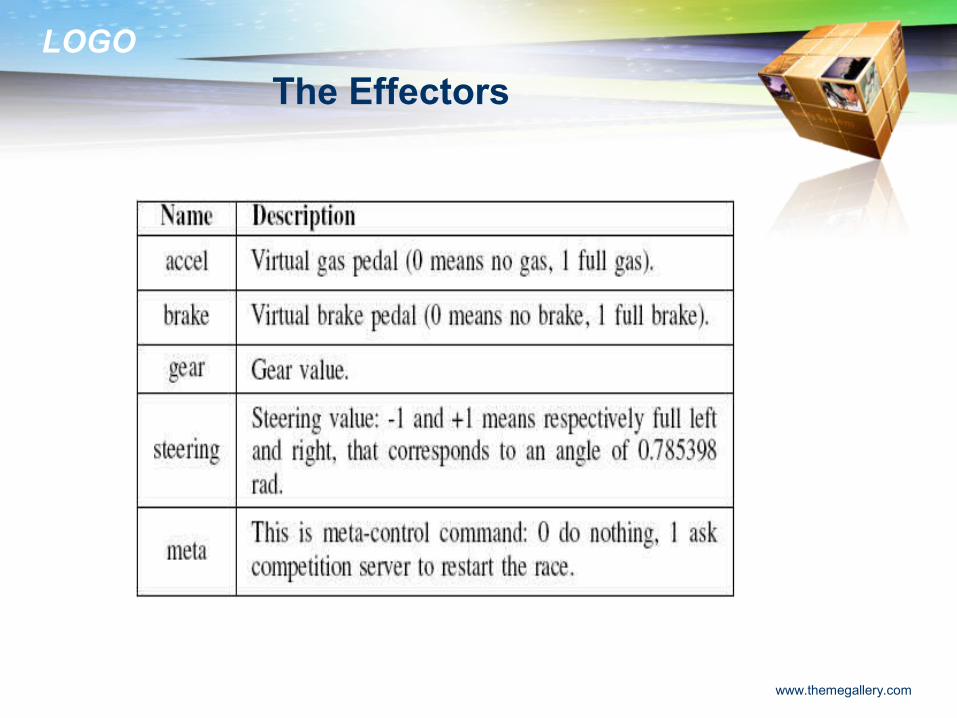
Controllers can invoke effectors that relate to basic driving commands. They include: accelerate, brake, gear shift, steering, and meta which requests a race restart.
Controllers have to act quickly before the data becomes obsolete. Clients were available to support simple APIs along with programmed controllers in
Java and C++ as well as for Windows, MAC, and Linux operating systems.
www.themegallery.com

LOGO
Architecture of the API
The Architecture of the API developed especially for the competition.
www.themegallery.com
LOGO
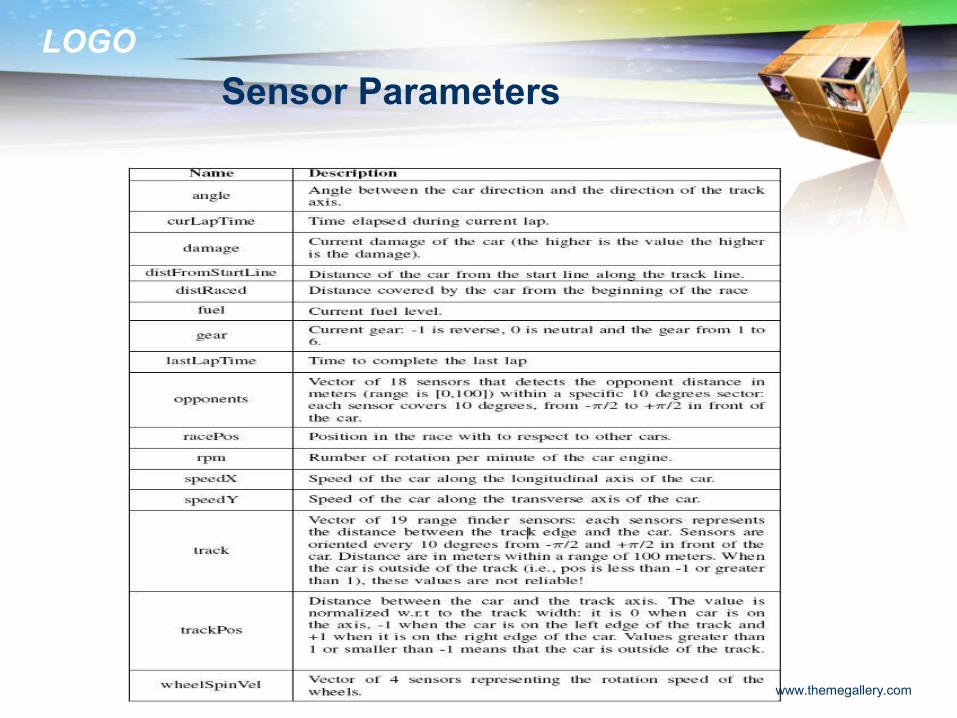
Sensor Parameters
www.themegallery.com
LOGO
The Effectors
www.themegallery.com

LOGO
Competition Rules
Any controller that satisfied the communication protocol was accepted. It could be an Ai-design or a collection of rules authored by a human.
Two stages: 1). Each entrant did a number of qualifying runs for 1000 game tics, or 200 seconds
of real time. The accumulated meters was the score for each run. Performance was compared against a pair of baseline controllers supplied by organizers.
2) Those contestants who performed better than the baseline controllers were elginble for the final head to head races.
Competitors had no idea what tracks would be selected for the time trials and the competition. Tracks varied in shape from ovals to city streets over a variety of different surfaces, dirt, concrete etc. Black ice?
www.themegallery.com
LOGO
2. Designing the State Machine Controller
Design objectives:
1). Get to the final head to head phase.
2). We pragmatically biased our learning to optimize performance in the time trials.
3). However, we used a socially motivated learning approach, cultural algorithms along with certain kinematic functions that supported basic flocking or swarming activities, collision avoidance and orientation among “boids”. It was hoped that this learned behavior would generalize over to the multi-car scenario even though we had not trained it with other cars.
4). As a result while a solo driver might process all of the raw sensors, we tried to design for the “pack”. That is, information about track edges would be obstructed by others, so we wanted to induce information about what we can’t see from the position of nearby competitors.
5). As a by product of this is that we will use fewer sensors, infer more based upon the position of other drivers, and hopefully reduce processing speed relative to those who use them all.
www.themegallery.com
LOGO
The State Machine
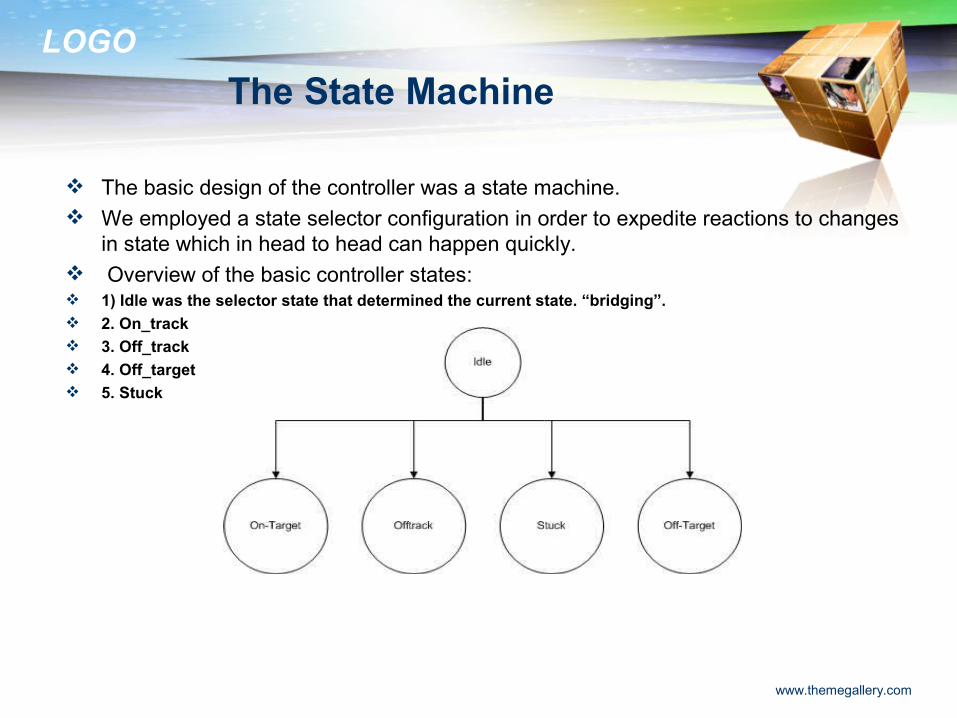
The basic design of the controller was a state machine. We employed a state selector configuration in order to expedite reactions to changes
in state which in head to head can happen quickly. Overview of the basic controller states: 1) Idle was the selector state that determined the current state. “bridging”. 2. On_track 3. Off_track 4. Off_target 5. Stuck
www.themegallery.com

LOGO
The Kinematic Functions
Since we assume that we will always be either in or near the pack we reduced the number of sensors needed from over 30 to 6. We used all of the effectors.
Sensors: trackpos, rpm, gear, angle, speedX
Effectors: accel, brake, gear, steering
We derived two other variables from the raw sensor data:
turnAngle: the angle with the furthest distance to edge of the track (in the trackPos variable).
maxSpeed: determined by turnAngle, or an error correction state.
www.themegallery.com

LOGO
Kinematic Rule Functions
These functions are used across all of the four states. Each function was hardcoded into the controller.
___________________________________________________ steering(turnAngle)
if turnAngle = 0
steering = 0
else
steering = ((turnAngle/10)9)
___________________________________________________ shifting(gear, rpm)
if gear = 0 or (gear = 2 and rpm < 3000)
gear = 1
else if gear > 0 and rpm > 7500
gear = gear + 1
else if gear > 2 and rpm < 4000
gear = gear -1
___________________________________________________________________________________
acceleration(speedX, maxSpeed)
if(speedX < maxSpeed)
accel = 1
else
accel = 0
___________________________________________________________________________________
www.themegallery.com
LOGO
Utility Functions Continued
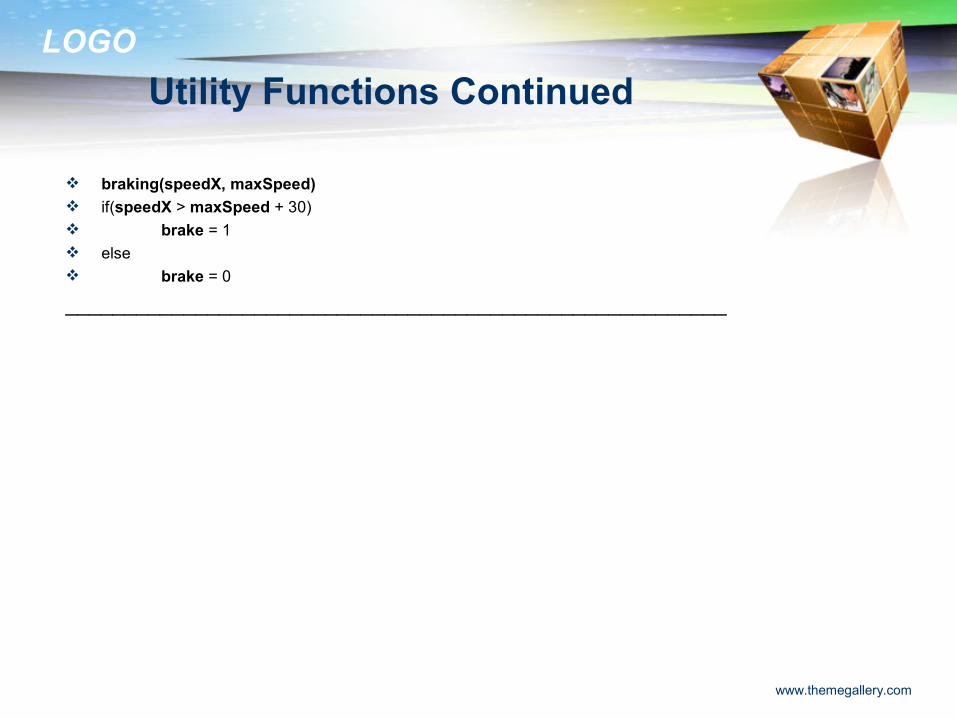
braking(speedX, maxSpeed) if(speedX > maxSpeed + 30) brake = 1 else brake = 0
________________________________________________________
www.themegallery.com

LOGO
The Learning Task
Our goal was to learn to optimize the parameter values for the kinematic utility functions used in all of the states so as to maximize the distance travelled over a run.
The key parameters are Turn Angle and Maximum speed since they are used in all of the functions.
For each 10 degree increment in turn angle we wish to learn the maximum speed that we can go in that angle. Assume symmetry in turn angles (+ and -).
We will use a Cultural Algorithm with a Genetic Algorithm as the population component, and collect aggregate performance knowledge in the Belief Space. That knowledge will be used to guide the application of the genetic operators.
www.themegallery.com

LOGO
3.0 Cultural Algorithms
Holland [1975] developed a formal framework for any generic adaptive systems that is able to alter its structure and/or behavior based on the experience in some set of performance environments
www.ai.cs.wayne.edu
Scale of Social Interaction: The Emergent Properties Depend Upon the Scale at which the Interaction Takes Place

LOGO
Cultural Algor ithms
o Cultural Algorithms are computational models of Social Evolutiono Major components
Begint = 0;
Initialize Population POP(t);Initialize Belief Space BLF(t);repeat Evaluate Population POP(t);
Adjust(BLF(t), Accept(POP(t))); Adjust(BLF(t)); Variation(POP(t) from POP(t- 1));until termination condition achieved
End
Basic
Procedure
www.ai.cs.wayne.edu

LOGO
Acceptance Funct ion
o Regulates the movement of knowledge from the Population Space -> Belief Space
o A subset of the population is chosen to impact the Belief Space. In an optimization problem it is generally a percentage of the top performers
www.ai.cs.wayne.edu

LOGOIntegrat ing the Knowledge Sources in the
Inf luence Funct ion
influence()
Historical Knowledge
Normative Knowledge
Situational Knowledge
Domain Knowledgeaccept()
Topographical Knowledge
update()
www.ai.cs.wayne.edu

LOGOHierarchical Integrat ion of the Knowledge
Sources
Integrator
Normative Knowledge
Domain Knowledge
History Knowledge
Situational Knowledge
Topographical Knowledge
www.ai.cs.wayne.edu

LOGO
KS1
KS2KS3
KS4
KS5
Roulette Wheel
www.ai.cs.wayne.edu
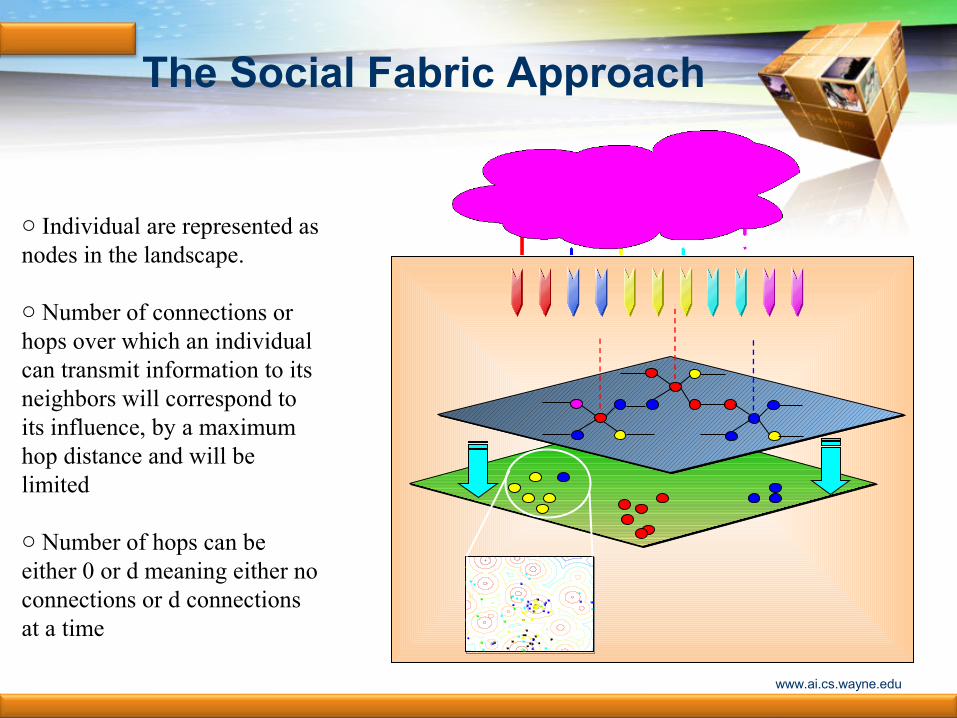
LOGO The Social Fabric Approach
o Individual are represented as nodes in the landscape.
o Number of connections or hops over which an individual can transmit information to its neighbors will correspond to its influence, by a maximum hop distance and will be limited
o Number of hops can be either 0 or d meaning either no connections or d connections at a time
-1 -0.8 -0.6 -0.4 -0.2 0 0.2 0.4 0.6 0.8 1-1
-0.8
-0.6
-0.4
-0.2
0
0.2
0.4
0.6
0.8
1
x
y
Population Swarm - Year: 5
www.ai.cs.wayne.edu
LOGO
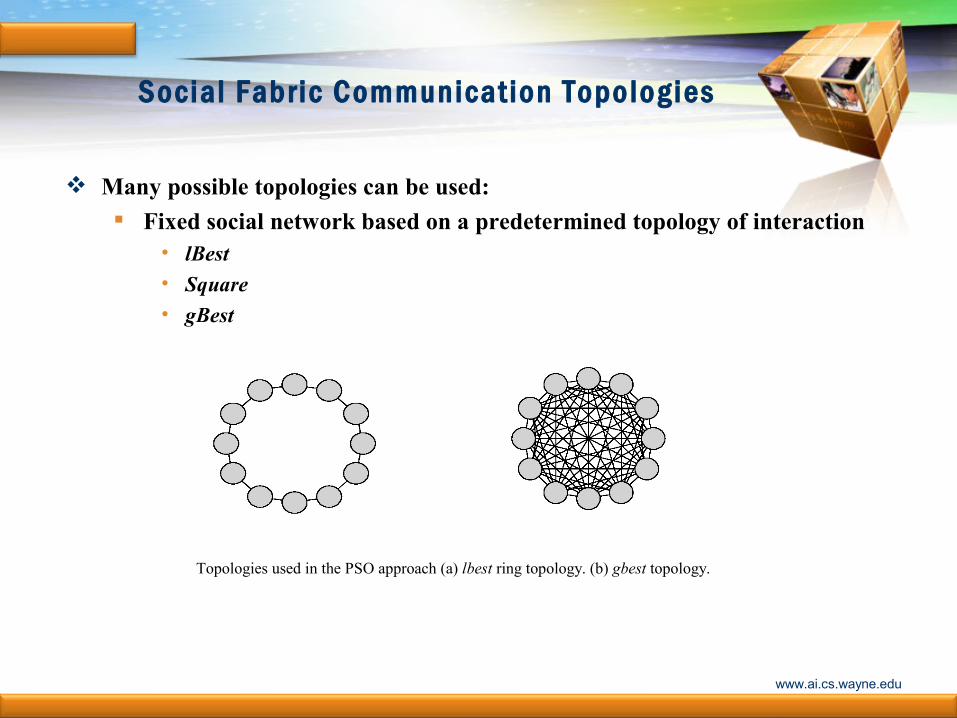
Social Fabric Communicat ion Topologies
Many possible topologies can be used:
Fixed social network based on a predetermined topology of interaction• lBest• Square
• gBest
Topologies used in the PSO approach (a) lbest ring topology. (b) gbest topology.
www.ai.cs.wayne.edu
LOGO
Cont…
In case of a tie, tie breaking rules are used as follows:• Direct Influence• Least Frequently Used (LFU)
• Most Frequently Used (MFU)• Random Influence.
www.ai.cs.wayne.edu

LOGOUsing the SF to Optimize the Cones Wor ld
Problem
www.ai.cs.wayne.edu
Population Swarm and Population Plot at Generation 10
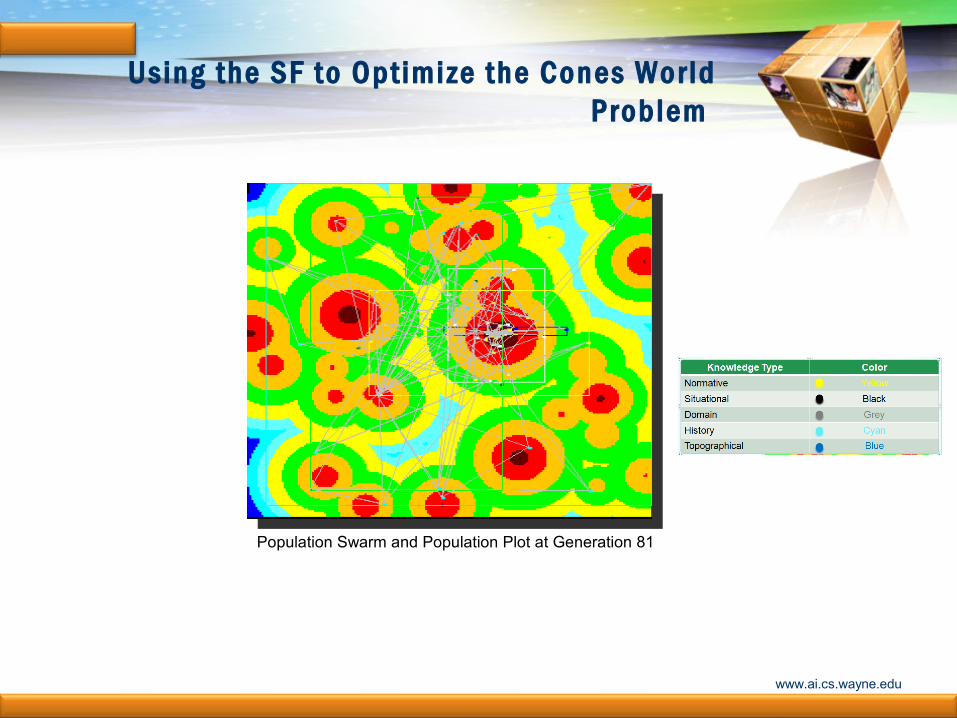
LOGOUsing the SF to Optimize the Cones Wor ld
Problem
www.ai.cs.wayne.edu
Population Swarm and Population Plot at Generation 81

LOGO
4. Training the Controller
The Population Component Genetic Algorithms: evaluate pop => reproduce => modify
A population of behavioral chromosomes:
Each gene corresponds to a turn angle (0, to + 90). Notice that we assume symmetry in the angles to simplify representation. The value for the gene is the maximum speed that the system can possess when in that turn angle.
The goal is to learn these governor relations in order to optimize the application of the kinematic functions within each state.
An example chromosome:
0 | +10 | + 20 | +30 | +40 | +50 | +60 | +70 | +80 | +90
209 160 130 114 115 107 35 86 27 145
Performance function: Distance travelled in metersover a 200sec run..
Chromosomes networked to two others in order to produce an lbest configuration.
Chromosome is completely replaced each time step by a new one.
www.themegallery.com
LOGO
The Acceptance Function
This function determines how to aggregate the individual behaviors.
Here, information about the performance of all 100 individuals in the population, their performance, and their performance environment is given to the belief space.
www.themegallery.com
LOGO
The Belief Space
The Cultural Knowledge Component Domain Knowledge: Specific track information (surface etc) and indexing. Track
knowledge taxonomies. Normative: Ranges of parameter values indexed by track. Situational: Best, worst, and average performance for indexed tracks. History: Statistics on track types raced on. E.G. If an unknown type then select most
frequently used track type to start. Topographic: Not explicitly used here. Implicitly present in relation between
Max_speed and turn_angle. In the future explicit terrain maps can be useful in directing strategy.
Each knowledge source vies to control the generation of a new individual using the Social Fabric Influence Function
www.themegallery.com
LOGO
Cultural Algorithm Parameters
Social Fabric Influence Function:
Fitness proportional application of a knowledge sources to individuals in the population.
The social fabric used here is the lbest topology
When an individual is selected to be directly influenced by a Knowledge Source, it broadcasts that “bid” to its two neighbors (one hop). After each member of the entire population has distributed its direct bid to its neighbors then the total number of bids for each individual are summed up. For each individual, the knowledge source with the majority of bids wins.
In case of a tie we use “direct influence” bidder as the winner.
www.themegallery.com

LOGO
Initial CAT Training
Population size: 100 Number of Generations: 100 Topology: Lbest Hops: 1 Tie breaking: Direct Track: Oval Run: 10000 game turns (game tics). 1000 per 200 seconds.
www.themegallery.com

LOGO
Parameter Leanring
Lbest configuration learning
www.themegallery.com

LOGO
Incremental Learning
A succession of bridging actions, allows the system to build behaviors on behaviors.
First increment ( Generation 1 through 3): Values allow car to stay on track.
Second increment ( Generation 7 though 17): Learns to accelerate.
Third increment: Track segment specialization (Generation 18 through 26): Learns to focus on specific track segments, e.g. straight, curved.
www.themegallery.com
LOGO
5.0 The Competition
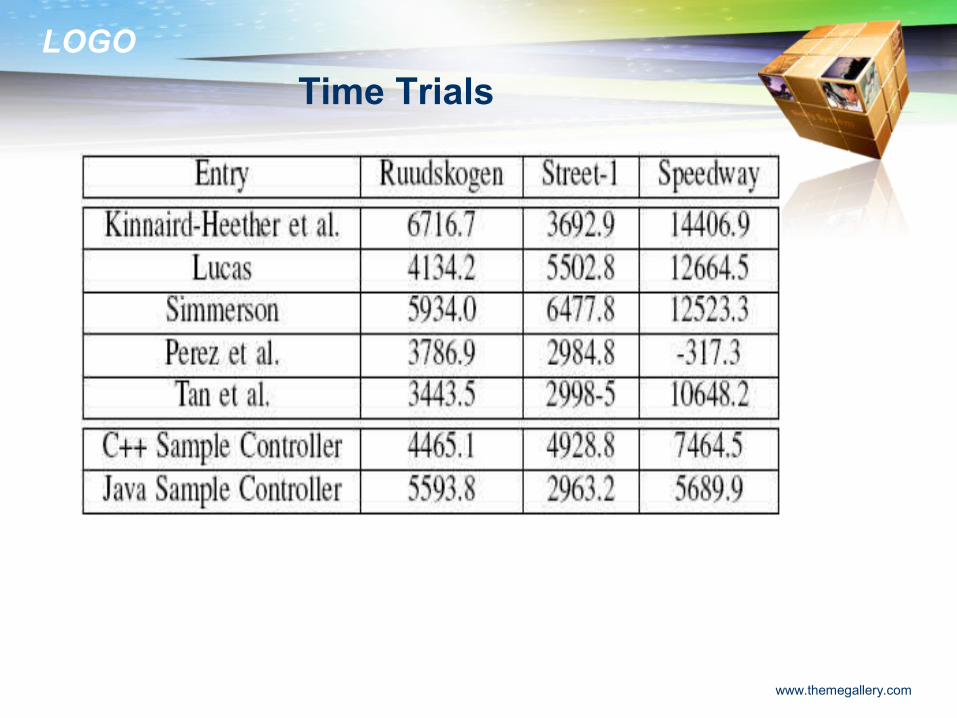
Time trials: Three tracks were selected. Each controller was run 10 times on each track (200 secs of game time each). Performance was the median score over all 10 runs. Two baseline controllers were used to screen entries. Those entries that cannot do
better than the baseline controllers were not allowed to go on.
Head to head: Five controllers were selected. Three exhibited strong conisitent behavior across the
tracks. 10 points to the winner, three laps around, 8 second etc. Competitors randomly positioned on the tracks in each of 10 races on each of three
tracks. Median score for each contestant awarded for that track.
www.themegallery.com

LOGO
The D-Speedway
A simple oval track.
www.themegallery.com

LOGO
The Street1 Track
A more complex street-like track with sharp corners.
www.themegallery.com

LOGO
The Ruudskogen
Oval-like but with a concave turn. Not easy.
www.themegallery.com

LOGO
Start Your Engines
www.themegallery.com
LOGO
Time Trials
www.themegallery.com

LOGO
Head to Head
www.themegallery.com
LOGO
Youtube Race Video
http://www.youtube.com/v/ruHzCF3CHIA&hl=en
www.themegallery.com
LOGO
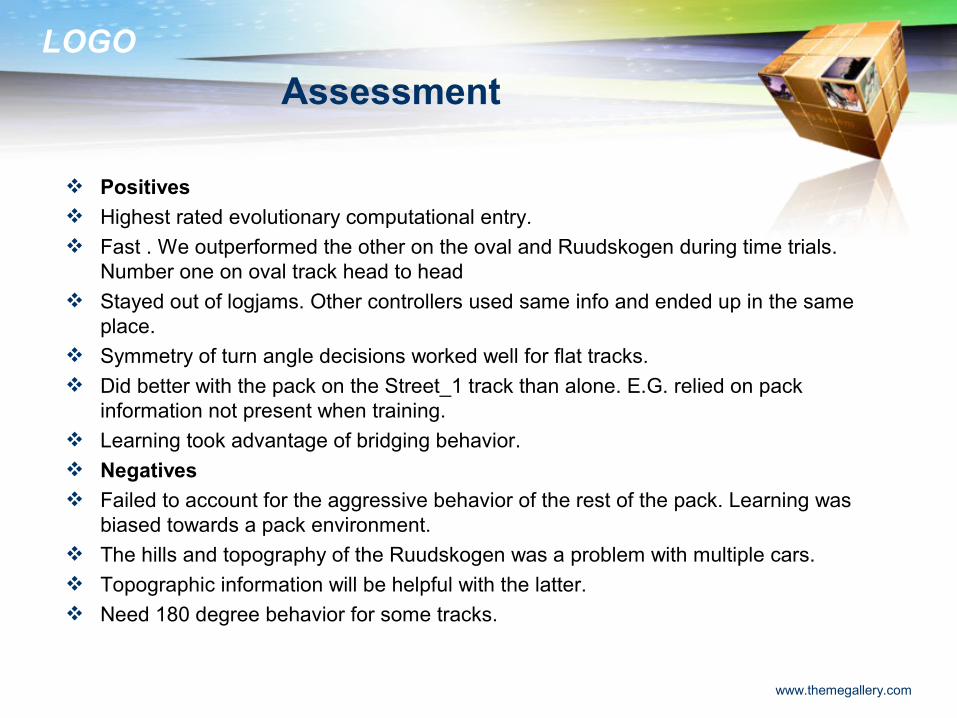
Assessment
Positives
Highest rated evolutionary computational entry.
Fast . We outperformed the other on the oval and Ruudskogen during time trials. Number one on oval track head to head
Stayed out of logjams. Other controllers used same info and ended up in the same place.
Symmetry of turn angle decisions worked well for flat tracks.
Did better with the pack on the Street_1 track than alone. E.G. relied on pack information not present when training.
Learning took advantage of bridging behavior.
Negatives
Failed to account for the aggressive behavior of the rest of the pack. Learning was biased towards a pack environment.
The hills and topography of the Ruudskogen was a problem with multiple cars.
Topographic information will be helpful with the latter.
Need 180 degree behavior for some tracks.
www.themegallery.com
LOGO
6.0 Do Networks Matter?
What was the impact of the population network used?
The “right” network structure appeared to “focus” search more effectively
in other “but simpler” problem solving situations.
So for each of the three tracks we compared:
Lbest
Gbest
Square
Does network structure matter as an optimization problem solving tool?
www.themegallery.com

LOGO
D-Speedway
Performance of the three configurations on the D-Speedway
www.themegallery.com

LOGO
A More Complex Example
Learning the Street Track
www.themegallery.com

LOGO
A More Complex Track
Learning the Ruudskogen
www.themegallery.com

LOGO
Summary
Adjustment of the network structure produces improved performance. All three performed well on the oval track. However, in more complex tracks when new improved speed angle combinations are
found they don’t spread as quickly through the population with lbest. Gbest outperforms Square on the Oval track but not on the more complex ones. Too many new pairs, no time to establish a response. Square distributes but does not overload the system.
The key is that distribution of influence can help establish bridging behavior and allow incremental acquisition of skills in a complex environment. However, too much information does not allow performance to stabilize sufficiently to allow new learning to occur. Less distribution makes the system less responsive to new opportunities, bridging can start later.
www.themegallery.com

LOGO
Conclusions
A Knowledge-based evolutionary learner was able to compete in a complex game. The Optimization process was based upon a socially networked population. The structure of the network was a factor effecting the learning activity. The network distributed new influences faster. Too few connections produced fewer “bridging stages on which to build new
behaviors. (lbest). Too many connections provided less opportunity for bridging behaviors to be
established. (gbest) Intermediate level structures provide more of a balance between bridging and
dissemination. (square)
www.themegallery.com
LOGO
Future Work
Use other knowledge sources more explicitly such as topographic knowledge. This will support the spatial structuring of experience (curves vs straight-aways). Allow the system to self-organize its social network to boost performance in an
unknown system. Improve on the use of history knowledge to make predictions about an unknown
track as the race goes on. Replace simple tie-breaking with n-person games. That is a good fit with the
application. N-person games as an optimization search tool?
www.themegallery.com

LOGO
Related publicat ions
Reynolds, R. G., and Ali, Mostafa, “Cultural Algorithms: Knowledge-Driven Engineering Optimization via Weaving a Social Fabric as an Enhanced Influence Function”, Proceedings of the IEEE World Congress on Computational Intelligence, Hong Kong, June 1-6, 2008.
Reynolds, R. G., and Ali, Mostafa, The Social Fabric Approach for a Better Knowledge Integration in Cultural Algorithms, Proceedings of the IEEE World Congress on Computational Intelligence, Hong Kong, June 1-6, 2008.
Reynolds, R. G., and Ali, Mostafa, Computing with the Social Fabric: The Evolution of Social Intelligence within a Cultural Framework, IEEE Computational Intelligence, IEEE Press, Vol. 3, No. 1, February, 2008, pp. 18-30.
Reynolds, R.G., and Ali, Mostafa, “Mining the Social Fabric of Archaic Urban Centers with Cultural Algorithms”, IEEE Press, Vol. 41, No. 1, February, 2008, pp. 64-72.
Robert G. Reynolds, Bin Peng, Mostafa Z. Ali: The role of culture in the emergence of decision-making roles: An example using cultural algorithms. Complexity 13(3): 27-42 (2008)
Reynolds, R. G., Peng, B., and Ali, M, “The Role of Culture in the Emergence of decision-Making Roles in Dynamic Environments”, accepted for publication, Complexity Journal, 2007.
Reynolds, R G., Ali, M Z., Exploring Knowledge and Population Swarms via an Agent-Based Cultural Algorithms Simulation Toolkit (CAT), in proceedings of IEEE Congress on Computational Intelligence 2007.
Reynolds, R G., Ali, M Z., The Cultural Algorithm Simulation Toolkit: An Approach for Solving Optimization Problems, submitted for publication to NACSOS 2007.
www.ai.cs.wayne.edu

LOGO
Related publicat ions
Reynolds, R.G., Ali, M.Z., and Franzel, P., “Using GP and Cultural Algorithms to Simulate the Evolution of an Ancient Urban Center”, in Advances in Genetic Programming Theory and Practice, Editors: Rick Riolo and Bill Wurzel, Kluwer Academic Press, Ann Arbor, MI., 2007.
Reynolds, R.G., Whallon, R., Ali, M., Zadegan, B., “Agent Based Modeling of Early Cultural Evolution”, Proceedings of the IEEE World Congress on Computational Intelligence, Vancouver, B.C., July 16-21, 2006.
Reynolds, R.G., Ali, M., and Alomari, R., “Optimization Problem Solving using Predator/Prey Games and Cultural Algorithms”, in Proceedings of the 2006 IEEE Symposium on Computational Intelligence and Games, Ed. S.J. Louis and G. Kendall, Reno/Lake Tahoe, Nevada, May 22-24, 2006, pp: 119-125.
A Report on Cultural Algorithms Tutorial System (CAT), A report for the IEEE supported by W.J. Karplus Summer Research Grant
www.ai.cs.wayne.edu

LOGO
www.ai.cs.wayne.edu