survey reporting guide 2012 - patientsafetygroup.org reporting guide... · single survey report ......
TRANSCRIPT

The Patient Safety Group
Culture Survey REPORTING GUIDE

Trademarks The Patient Safety Group is either a registered or trademark of The Patient Safety Group and may be registered in the United States or in other jurisdictions including internationally. Other product names, logos, designs, titles, words or phrases mentioned within this publication may be trademarks, servicemarks, or tradenames of The Patient Safety Group or other entities and may be registered in certain jurisdictions including internationally. Third-Party Information This guide may contain links to third-party websites that are not under the control of The Patient Safety Group, and the Group is not responsible for the content on any linked site. If you access a third-party website mentioned in this guide, then you do so at your own risk. The Patient Safety Group provides these links only as a convenience, and the inclusion of the link does not imply that the Group endorses or accepts any responsibility for the content on those third-party sites. Copyright © 2003 - 2012 The Patient Safety Group. All rights reserved. This manual may not be copied, photocopied, reproduced, translated, or converted to any electronic or machine-readable form in whole or in part without prior written approval of The Patient Safety Group. January 2012 The Patient Safety Group 6 Walnut St., #4 Boston, MA 02108 http://www.patientsafetygroup.org

Contents 3
CONTENTS
Introduction: Culture Survey Reporting .......................................................................................... 4 The Report Generator: Introduction ............................................................................................................ 5 Single Survey Report ................................................................................................ 5 Choosing a Data Set ................................................................................................. 6 Filters .................................................................................................................... 6 Comments .............................................................................................................. 7 Benchmarks ............................................................................................................ 7 Example Report Options ............................................................................................ 8 The Single Survey Results Page ................................................................................. 9 The Scores .............................................................................................................. 9 Charts ................................................................................................................... 10 Demographic Data and Saving Reports ...................................................................... 11 Printing and Exporting Options .................................................................................. 11 The Side-by-Side Survey Report ............................................................................... 12 The Side-by-Side Results Page .................................................................................. 13 The Multi-Survey Report .......................................................................................... 14 The Multi-Survey Results Page .................................................................................. 15 The Composite Line/Trend Chart ............................................................................... 16 The Comment Analysis Report .................................................................................. 17 The Comment Analysis Results Page .......................................................................... 18

4
Introduction
Culture Survey Reporting The Cultural Survey reporting mechanism provides an insightful tool to see how your Organization’s culture of safety is measuring up, how each Unit is progressing in its ability to improve the workplace culture, and how various factors including profession and weekly hours worked weigh on how culture is perceived in the workplace. The report capabilities are similar across the survey types, Hospital Survey, Medical Office Survey and Nursing Home Survey. Reports are available to Users immediately upon the “completion” of a Culture Survey. If the ability to generate a report exists (a survey has been completed), a link will be available under “assignments” on a User’s My Page that states, “View Hospital Culture Survey Results”. The same would be true if the ability to run reports for either the Medical Office or Nursing Home survey exists.
If a User has utilized the “Save Report” function, a link to “View Saved Survey Reports” will also be provided from a User’s My Page.

5
The Report Generator
Introduction The User has a choice between four types of reports, a Single Survey Report, a Side-By-Side Survey Report, a Multi-Survey Report and a Comment Analysis. The Single Survey Report returns information related to the results of one set of survey data and is the default “Report Type” displayed upon entering the Survey Generator. To select a different report type, choose the report type from the drop-down list.
The Single Survey Report The Single Survey Report is the primary and most oft used of the report types.
If the User has access to more than one Unit or one Organization, there will be a drop-down below the report type titled Program. It is defaulted to “All”. To narrow the data choice

6
options for running a report, the User can select the specific Unit/Program. “All” provides all the data possible for generating a report.
Choosing a Data Set Below the “survey report generator” heading is the list of data from which the User can choose to generate results. This list includes all completed Surveys for the Organization and its Units. If the User has access at the Organization level (highest access – which is usually hospital-wide), they will see the hospital (or medical office/nursing home) name with a +/- icon to its left. Clicking the icon will reveal a listing of specific units associated with the Organization.
The number of Units accessible within an Organization is reflected in parenthesis after the Organization name. The date closed indicates when the survey ended. Users must select their data sets, and can choose from the Organization as a whole or from individual units or groups of units. Users check the box alongside the Unit they are interested in.
Filters
Filters allow Users to drill further into the data set chosen from above. The filters include demographic information about the survey participants and are a way to see specific results based on the demographic. For instance, a User may choose the entire Organization’s most

7
recent survey in the data set, and decide to see the results for just the Registered Nurses by opening the Position filter and then selecting the Registered Nurse option. A User may choose more than one filter option by holding down the Control key.
Comments Below the Filter option is a checkbox that allows the User to include written Comments in the report.
Benchmarks Finally, a User has the option to compare their data to the AHRQ Benchmark. Users must check the box next to the option, Compare Results to AHRQ Hospital Benchmark. The default comparison is the All Hospitals benchmark, but Users have the option to choose from amongst the various subsets of benchmarks, including those by Bed Size, Position and Unit type. A User may only choose one benchmark. Benchmarks are provided for the items and safety culture dimensions on the Hospital Survey on Patient Safety Culture (HSOPS) to allow hospitals to compare their survey results. When comparing your hospital’s results against results from the database, keep in mind that the database only provides relative comparisons. Even though your hospital’s survey results may be better than the database statistics, you may still believe there is room for improvement in a particular area within your hospital in an absolute sense. As you will notice from the database results, there are some patient safety composites that even the highest-scoring hospitals could improve upon. Therefore, the comparative data provided in this report should be used to supplement your hospital’s own efforts toward identifying areas of strength and areas on which to focus patient safety culture improvement efforts. The final option in Benchmarks allows you to Identify only “significant” differences between scores. The AHRQ recommends using a 5 percent difference as a rule of thumb when comparing your hospital’s results. Your hospital’s percent positive score should be at least 5 percent higher than the comparison to be considered “better,” and should be at least 5 percent lower to be considered “lower” than the comparison. A 5 percent difference is likely to be statistically significant for most hospitals given the number of responses per hospital, and is also a meaningful difference to consider. Keep in mind that statistically significant differences are not always important, and non-significant differences are not always trivial.

8
Example Report Options In the following scenario, the entire Boston Memorial organization was chosen for the latest survey. Nothing was filtered as indicated by (All) next to the filter choices. Staff Comments were not included. The Compare Results to AHRQ Benchmark, All Hospitals was chosen as well as the Identify only “significant” differences in scores.
9
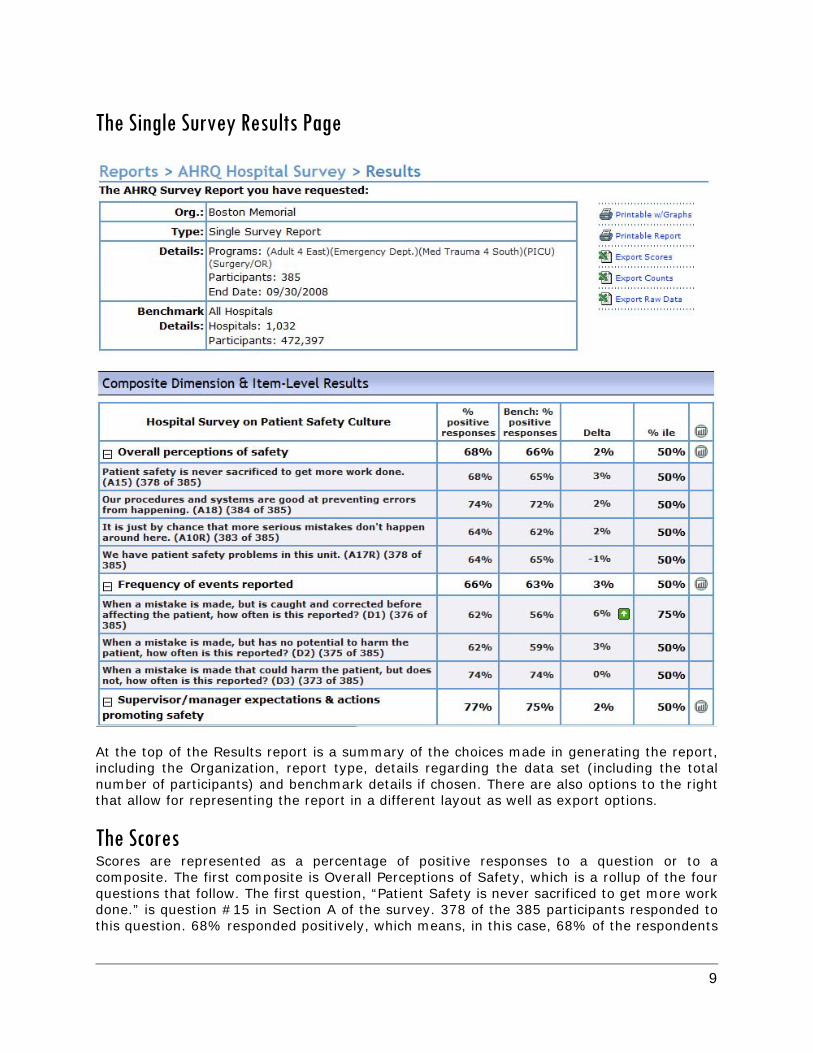
The Single Survey Results Page
At the top of the Results report is a summary of the choices made in generating the report, including the Organization, report type, details regarding the data set (including the total number of participants) and benchmark details if chosen. There are also options to the right that allow for representing the report in a different layout as well as export options.
The Scores Scores are represented as a percentage of positive responses to a question or to a composite. The first composite is Overall Perceptions of Safety, which is a rollup of the four questions that follow. The first question, “Patient Safety is never sacrificed to get more work done.” is question #15 in Section A of the survey. 378 of the 385 participants responded to this question. 68% responded positively, which means, in this case, 68% of the respondents

10
who answered this question answered “Strongly Agree” or “Agree”. The other options for this question were “Neither”, “Disagree” and “Strongly Disagree”. In the case of the Medical Office Survey and the Nursing Home Survey, there is an option to select “Does Not Apply or Don’t Know.” For purposes of scoring, this choice is treated as though the question was not answered for determining the denominator of the score. In the report example, the fourth question is “We have patient safety problems in this unit.” This is question #17 in Section A and is followed by an R. This means that the question is ‘reverse-worded.’ A positive response for a reverse-worded question would be “Strongly Disagree” or “Disagree”. The results factor that into the score. It is always the case that the higher the score, the better the response to the question. Following the score is the Benchmark for that particular item or composite and then a delta representing the % difference. Since we chose “identify significant” in our options, a green or red arrow only appears next to items/composites where the difference is 5% or more. In the case of comparing to the All Hospitals (and only All Hospitals) benchmark the 0, <10, 10, 25, 50 (or median), 75, 90 and 100th percentile scores are displayed for the survey composites and items. Percentiles provide information about the distribution of hospital scores. To calculate percentile scores, all hospital percent positive scores were ranked in order from low to high. A specific percentile score shows the percent of hospitals that scored at or below a particular score. For example, the 50th percentile, or median, is the percent positive score where 50 percent of the hospitals scored the same or lower, and 50 percent of the hospitals scored higher. When the distribution of hospital scores follows a normal, bell-shaped curve (where most of the scores fall in the middle of the distribution with fewer scores at the lower and higher ends of the distribution), the 50th percentile, or median, will be very similar to the average score.
Charts The chart icons, in the final row of the scores, allow the Users to generate a graph representing the scores in the report:

11
Demographic Data and Saving Reports
Following the scores in a report is a listing of the demographic details that makeup the report itself, including position, hours and years worked in the hospital. A User has the option to “Save Report”, which will then populate a list for easily accessing the parameters of this desired report. A User cannot just save or bookmark this page. Saving a Report creates a way for the User to quickly access desired Result pages. A Report title is required to save the report.
Printing and Exporting Options
A User can generate the report in a more compatible layout for printing by clicking either the Printable w/Graphs, or Printable Report options. This will present the report without the left navigation bar or the Patient Safety Group header. Reports are generated in a web-browser window and can be printed using the browser's print function. For users that would prefer to generate an Adobe® .pdf file of the report, there are .pdf print conversion tools available, such as PrimoPDF available at http://www.primopdf.com/. There are three options for exporting the report into a Microsoft Excel® format. Export Scores will put the existing

12
report into Excel with the actual scores in their own column cells. The Export Counts creates an Excel file that identifies how many respondents chose each answer option for every question. The Export Raw Data creates an Excel file that exhibits the ‘raw data’ of the existing survey data. This report returns a row for every respondent and a column for their specific answer. It is formatted in the layout required by the AHRQ for submitting the data to the national database.
The Side-by-Side Survey Report The Side-by-Side Survey Report is an excellent way to compare two sets of data.
By choosing Side-by-Side Report in the Report Type option, users are presented with two columns for data selection. The Primary column is the column that the Secondary column will be compared against. In the example above, the latest survey will be compared with the previous survey. The Users have the option to utilize the Filters in generating their Side-by-Side Report. This would allow a User to compare a survey to itself, in other words, choosing the same Primary and Secondary choices in the data set, but then choosing a different set of Filters for each set of data. For example, the User may want to compare Nurse vs. Physicians.

13
The Side-by-Side Results Page
Similar to the Single Survey Results page, the detail information is posted at the top, with the Primary choices being identified as Survey 1, and the Secondary choices identified as Survey 2. The Delta (% difference) is indicated in the next column and shows how Survey 1 compared to Survey 2. In the above example, since “Identify Significant Differences” was not check, a red or green arrow appears next to every Delta. Print options, charting options, and the ability to Save Report are also available with Side-by-Side Reports.

14
The Multi-Survey Report The Multi-Survey Report is an excellent way to compare up to seven sets of data.
By choosing Multi-Survey Report in the Report Type option, users are presented with a single column and two buttons, “ONE group” and “MULTIPLE groups”. As indicated in the instructions, ONE group puts all of your data selections into one report group, while MULTIPLE groups put each of your selections into a separate reporting group. In the example above, by selecting ONE group, all five units would be put together into one set of data (one grouping). By selecting MULTIPLE groups, five (5) separate groups of data would be created. Once your groups have been selected, you have the option to select a Filter that will be applied to all groupings. You also have the option to add a final Benchmark column, comparing your sets of data against the AHRQ Benchmark.

15
The Multi-Survey Results Page
The results page identifies the details of your data at the top and then puts the scores into a grid next to the items and composites. The Multi-Survey report has a Print Report option as well as an Export Scores option. The Export Scores to Microsoft Excel® is a great way to create an expansive grid of greater than seven sets of data. This can be accomplished by copying and pasting new columns alongside previously generated exported scores.

16
The Composite Line/Trend Chart The trend chart can be revealed by clicking the +/- box next to the Composite Line/Trend Chart heading.
This report will reveal the points of data along a line chart. The above example shows the Overall scores for each of the groupings. The trend chart can be manipulated to show not only the Overall score, but each of the survey composite scores as well. Then Trend Chart is an excellent way to show scoring trends in the case of an organization that has taken the survey multiple times.
17
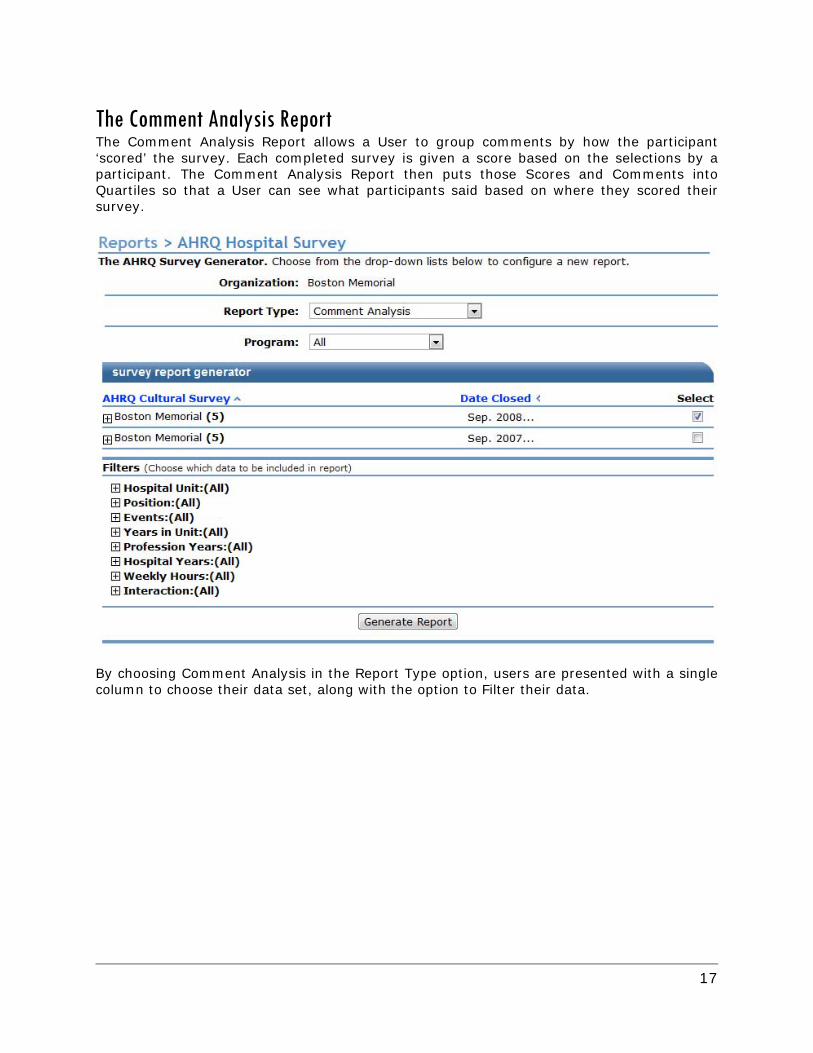
The Comment Analysis Report The Comment Analysis Report allows a User to group comments by how the participant ‘scored’ the survey. Each completed survey is given a score based on the selections by a participant. The Comment Analysis Report then puts those Scores and Comments into Quartiles so that a User can see what participants said based on where they scored their survey.
By choosing Comment Analysis in the Report Type option, users are presented with a single column to choose their data set, along with the option to Filter their data.

18
The Comment Analysis Results Page
The results page list the details of the data set, followed by a Quartile Summary, followed by a Program/Unit Summary, followed by the Comments. The Comments will be displayed based on their Quartile grouping. The Comments Analysis report has a Print Report option as well as an Export Report option.