surveillance+monitoring++ at...
TRANSCRIPT

Surveillance Monitoring at
Dartmouth-‐Hitchcock
George Blike, MD Susan P. McGrath, PhD

Disclosures
• Sue McGrath: No disclosures. • George Blike: No disclosures. • This presenta:on includes data from a before-‐and-‐a?er study at Dartmouth-‐Hitchcock Medical Center, which in December 2007 installed Masimo’s Pa:ent SafetyNet system. Masimo has supported the Hitchcock Founda:on, which helped to fund this research.

Value-‐Based Care: • Safe Care-‐Elimina.ng iatrogenic pa.ent harm • Appropriate & Effec.ve Care-‐Achieving the best
outcomes that pa.ents want and need • Excellent Experience-‐Culture of caring and empathy • Cost Effec.ve-‐Efficient with no waste © 2015 Dartmouth-‐Hitchcock
All Rights Reserved 3

Failure to Rescue—Conceptual Model
4
Hospitalization
Early signs and symptoms of physiological deterioration
Complication Arrest Death
Cascading “domino” physiological derangement
Terminal processes of multisystem organ failure and death
Increasing Physiological Instability t0# tdeath#
Ac#ve&Late*Stage&Research&Limited&Research&Ac#ve&Preven#on&Research&
© 2015 Dartmouth-‐Hitchcock All Rights Reserved 4

Failure to Rescue (FTR)
• Failure to rescue –failure to detect and manage a clinically important deteriora:on, such as death or permanent disability from a complica:on of an underlying illness (e.g., cardiac arrest in a pa:ent with acute myocardial infarc:on) or a complica:on of medical care (e.g., major hemorrhage a?er thrombolysis for acute myocardial infarc:on).
• FTR Rate = Death/1000 Complica:ons • 9 complica:ons considered
Source: AHRQ defini:on @ h^p://psnet.ahrq.gov/popup_glossary.aspx?name=failuretorescue
© 2015 Dartmouth-‐Hitchcock All Rights Reserved 5

FTR drives hospital mortality rates
6
Ghaferi, Birkmeyer et. al.; Annals of Surgery • Volume 250, Number 6, December 2009
© 2015 Dartmouth-‐Hitchcock All Rights Reserved 6

Environment at DHMC in 2006 Recogni:on that: • Risks associated with anesthesia in post-‐op
environment were under-‐emphasized in rela:on to poten:al impact
• Presence of technology was increasing, increasing complexity of the environment (PCA installa:on)
• Nurse-‐to-‐Pa:ent ra:os were changing, and more tasks were being added to individual nurse task load
• Preven:on of circumstances leading to deteriora:on is not possible
• Rapid Response Teams were only part of the solu:on
© 2015 Dartmouth-‐Hitchcock All Rights Reserved 7

.
Prior Work: ARTEMIS Field Triage System
Pulse Oximeter GPS Headset
Processor Unit (Gums:x or PDA)
Wireless Memory
Physiologic monitoring, state determina:on via triage algorithm, state communica:on
Assessment, interac:on, interven:on decision
Soldier or Emergency Responder Medic or EMT
© 2015 Dartmouth-‐Hitchcock All Rights Reserved 8
R. Carella and S. McGrath, “ARTEMIS: Personal Area Networks for Emergency Remote Triage and Informa:on Management”, ISCRAM Conference, Newark, NJ, May 2006.

DHMC Lebanon, NH 25,000 Inpa:ent Discharges
90,000 Inpa:ent Days 8,500 Intermediate Care Days
24,000 ICU Days 30,000 ED visits
9 © 2015 Dartmouth-‐Hitchcock All Rights Reserved
1.7500&1.8000&1.8500&1.9000&1.9500&2.0000&2.0500&2.1000&2.1500&2.2000&
07/2012&
09/2012&
11/2012&
01/2013&
03/2013&
05/2013&
07/2013&
09/2013&
11/2013&
01/2014&
03/2014&
05/2014&
07/2014&
09/2014&
11/2014&
01/2015&
03/2015&
05/2015&
Case%Mix%Index,Inpa.ent%Only%
Case&Mix&Index&

InpaRent Surveillance Model
System Controller
Measurement System
Reference Signal
System Output
Measured Output
System Input
Measured Error
• Interven:ons • Devices
• Mental model • Knowledge • Capacity
• Measurement devices • Observa:ons • Algorithms
© 2015 Dartmouth-‐Hitchcock All Rights Reserved 10

• Data-‐based Change Management
• Component selec:on • Pulse oximetry • Con:nuous monitoring • All inpa:ents
• Workflow analysis & integra:on
• Educa:on • Rounding
PaRent Surveillance System ImplementaRon
© 2015 Dartmouth-‐Hitchcock All Rights Reserved 11
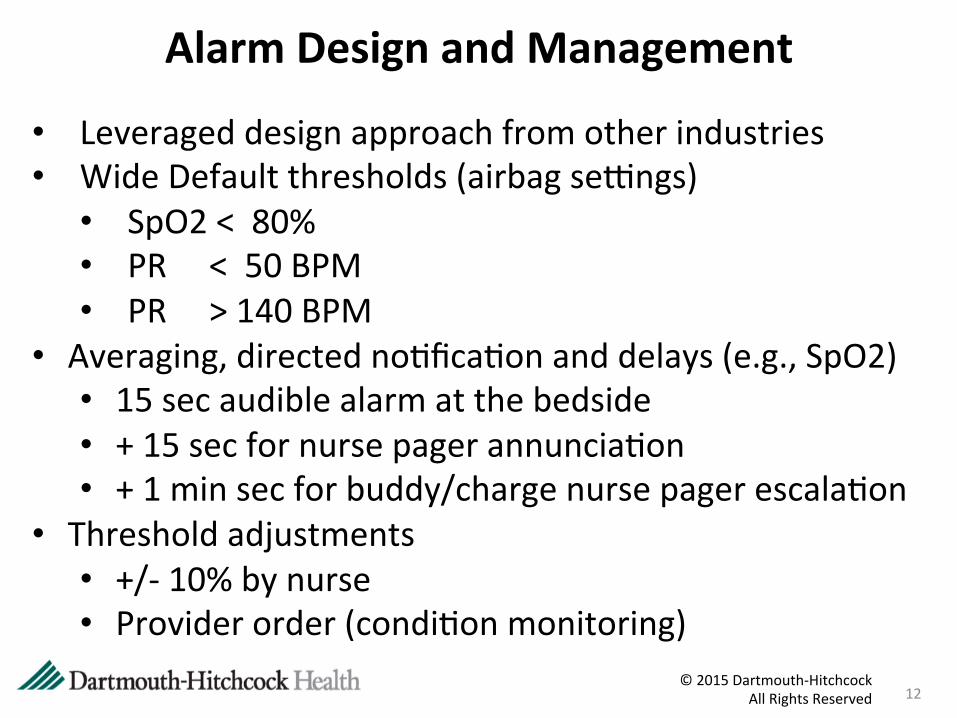
Alarm Design and Management
• Leveraged design approach from other industries • Wide Default thresholds (airbag sesngs) • SpO2 < 80% • PR < 50 BPM • PR > 140 BPM
• Averaging, directed no:fica:on and delays (e.g., SpO2) • 15 sec audible alarm at the bedside • + 15 sec for nurse pager annuncia:on • + 1 min sec for buddy/charge nurse pager escala:on
• Threshold adjustments • +/-‐ 10% by nurse • Provider order (condi:on monitoring)
© 2015 Dartmouth-‐Hitchcock All Rights Reserved 12
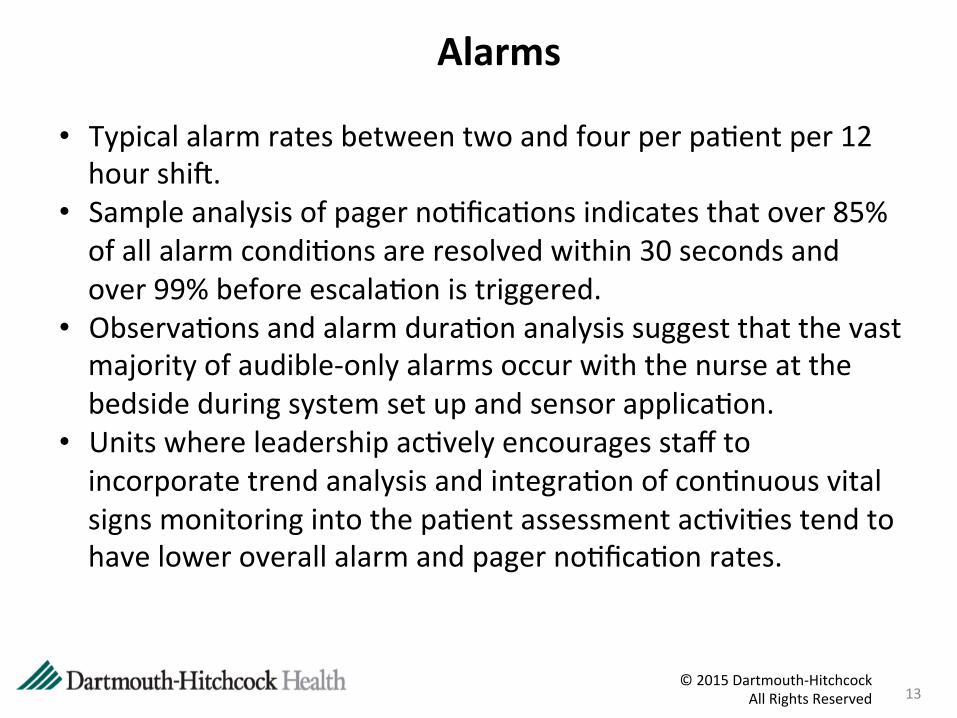
Alarms
CondiRonal Monitoring
Surveillance Monitoring
Alarms 15.62 3.7
0
2
4
6
8
10
12
14
16 Alarm Pages per Hour
Post
Pre
• Typical alarm rates between two and four per pa:ent per 12 hour shi?.
• Sample analysis of pager no:fica:ons indicates that over 85% of all alarm condi:ons are resolved within 30 seconds and over 99% before escala:on is triggered.
• Observa:ons and alarm dura:on analysis suggest that the vast majority of audible-‐only alarms occur with the nurse at the bedside during system set up and sensor applica:on.
• Units where leadership ac:vely encourages staff to incorporate trend analysis and integra:on of con:nuous vital signs monitoring into the pa:ent assessment ac:vi:es tend to have lower overall alarm and pager no:fica:on rates.
© 2015 Dartmouth-‐Hitchcock All Rights Reserved 13

Alarm Management
We do not focus on sensi:vity, specificity and predic:ve value calcula:ons • Time intensive data collec:on • True/False Posi:ve/Nega:ve characteriza:ons are highly
subjec:ve due to complexity of tasks, feedback loops, nurse experience, percep:on of alarms, and many other factors
• Context is cri:cal-‐ in a review of reported safety events (2012-‐2014) there were twice as many reports indica:ng that the “sensor off” alarm provided helpful pa:ent state informa:on as for any other category of report related to the surveillance system.
© 2015 Dartmouth-‐Hitchcock All Rights Reserved 14

Alarm Management
Instead we focus on understanding the benefit/burden considera:ons and focus on using our limited resources on broad tac:cs such as: • Ensuring standardiza:on of configura:ons and prac:ces via
policies and procedures • Providing bedside educa:on around device opera:on and
troubleshoo:ng • Encouraging educa:on around appropriate integra:on of
monitors for pa:ent state assessment
© 2015 Dartmouth-‐Hitchcock All Rights Reserved 15
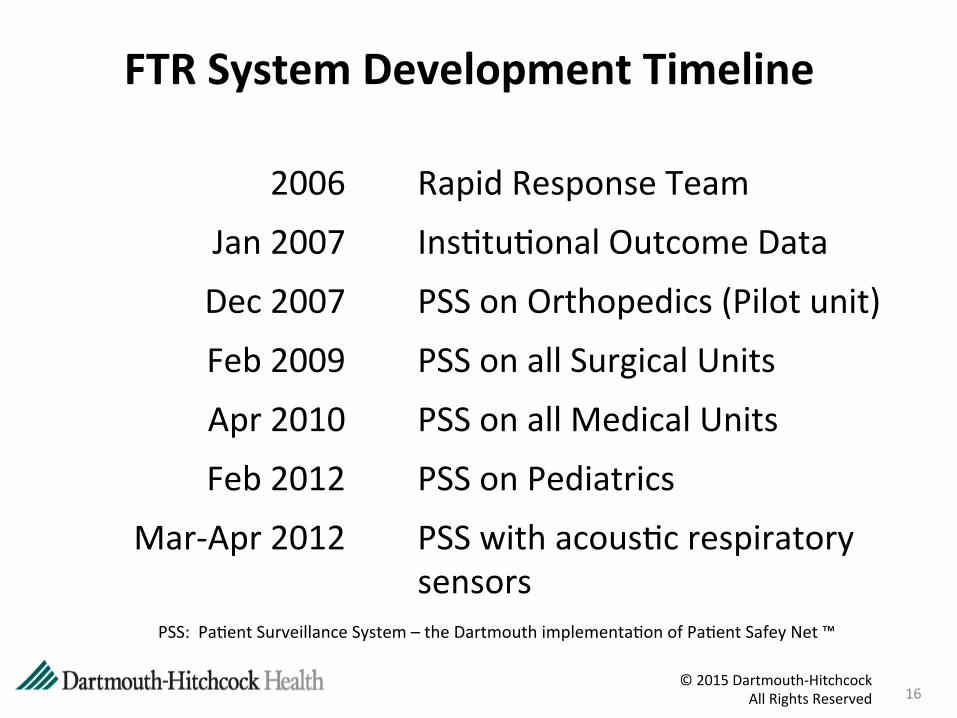
2006 Rapid Response Team
Jan 2007 Ins:tu:onal Outcome Data
Dec 2007 PSS on Orthopedics (Pilot unit)
Feb 2009 PSS on all Surgical Units
Apr 2010 PSS on all Medical Units
Feb 2012 PSS on Pediatrics
Mar-‐Apr 2012 PSS with acous:c respiratory sensors
FTR System Development Timeline
PSS: Pa:ent Surveillance System – the Dartmouth implementa:on of Pa:ent Safey Net ™
© 2015 Dartmouth-‐Hitchcock All Rights Reserved 16

Pilot Performance
From: Taenzer AH, Pyke JB, McGrath SP, Blike GT. Impact of Pulse Oximetry Surveillance on Rescue Events and Intensive Care Unit Transfers. A Before-‐and-‐A?er Concurrence Study. Anesthesiology 2010, 112: 282-‐7
In a comparison of 11 months prior to and 10 months a?er implementa:on in a 36-‐bed orthopedic unit: • 50% reduc:on in transfers to higher levels of care • 60% reduc:on in rescue events There was no significant difference in these metrics in either of 2 comparison units during the same :me period.
© 2015 Dartmouth-‐Hitchcock All Rights Reserved 17

Pediatric ImplementaRon
CondiRonal Monitoring
Surveillance Monitoring
Alarms 15.62 3.7
0
2
4
6
8
10
12
14
16 Alarm Pages per Hour
Post
Pre
56%
44%
The new Masimo devices have given me greater confidence in providing safe paRent care.
Yes No No Different
56%
44%
The new Masimo devices have given me greater confidence in providing safe paRent care.
Yes No No Different
56%
44%
The new Masimo devices have given me greater confidence in providing safe paRent care.
Yes No No Different
© 2015 Dartmouth-‐Hitchcock All Rights Reserved 18
From: Mudge, B. et al. Reducing Monitor Alarms While Enhancing Pa:ent Safety. Children’s Hospital Network 2014 Organiza.onal Transforma.on Conference (2014)

DHMC
0.85
0.0 0.5 1.0 1.5 2.0 2.5 3.0 3.5 4.0
HE
RT
HERT Activations per 1,000 patient days
2.7
DHMC Average
0
1
2
3
4
5
6
Tran
sfer
s
Transfers to Critical Care
Pilot Unit 8 Years Later
© 2015 Dartmouth-‐Hitchcock All Rights Reserved 19
DHMC
0.14
0.0 0.2 0.4 0.6 0.8 1.0 1.2 1.4
Cod
es
Code Activations per 1,000 patient days
DHMC
11.50
0.0
5.0
10.0
15.0
20.0
25.0
Con
sults
Life Safety Consults per 1,000 patient days

0
20
40
60
80
100
120
2009 2010 2011 2012 2013 2014 2015
COUNT OF RE
VERS
ALS
YEAR
Life Safety Consults and Rescue Team Calls Associated with Opioid Reversals in Surveillance Unts, 2009-‐2015 YTD
No Call
Life Safety
HERT
Surveillance System Data
© 2015 Dartmouth-‐Hitchcock All Rights Reserved 20

Hospital-‐wide Code DistribuRons and Trends
0% 10% 20% 30% 40% 50% 60% 70% 80% 90% 100%
2010 2011 2012 2013 2014 2015 YTD
% Arrests by Type Not Assigned
hemorrhaged leading to hypotension and arrest Not On List -‐ Other
Respiratory
Brady
VF
VT
Asystole/PEA
© 2015 Dartmouth-‐Hitchcock All Rights Reserved 21
0
2
4
6
8
10
0
50
100
150
200
2010 2011 2012 2013 2014 2015 Ra
te
Code
s
Codes
DHMC Codes
DHMC Rate Per 1000 Pa:ent Days
0.37/1000 pt days medicine units 0.11/1000 pt days surgical units

Pilot Unit 8 Years Later
86% 79%
0%
10%
20%
30%
40%
50%
60%
70%
80%
90%
100%
Feb-
14
Apr
-14
Jun-
14
Aug
-14
Oct
-14
Dec
-14
Feb-
15
Apr
-15
Jun-
15
Aug
-15
% E
vent
s
% of Events With Surveillance Data 6 Month Rolling Average
Unit Mean DHMC Mean
0:40 0:51
00:00 00:30 01:00 01:30 02:00 02:30 03:00 03:30 04:00 04:30 05:00
Del
ay (h
h:m
m)
Average Delay to Activate 6 Month Rolling Average
Unit Mean DHMC Mean
© 2015 Dartmouth-‐Hitchcock All Rights Reserved 22
0
10
20
30
40
50
60 CO
UNT OF RE
SCUE EV
ENTS
UNIT
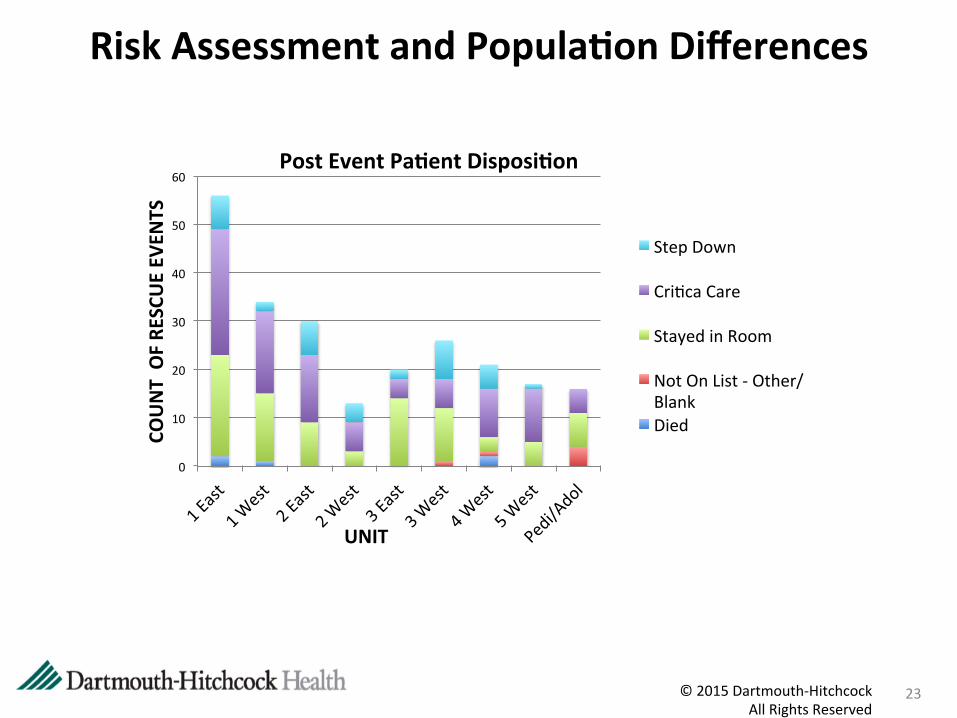
Post Event PaRent DisposiRon
Step Down
Cri:ca Care
Stayed in Room
Not On List -‐ Other/Blank Died
© 2015 Dartmouth-‐Hitchcock All Rights Reserved
23
Risk Assessment and PopulaRon Differences

Building on FTR research at D-‐H
24 © 2015 Dartmouth-‐Hitchcock All Rights Reserved 24

FTR Learning Lab—Rapid Learning/InnovaRon
25
Technology
People
Workflows
Culture
Candidate Solu:ons • Tech-‐Early
Detec.on • People-‐Ac.on
Teams • Integrated System-‐
Resilience Engineering Principles
1—IniRal evaluaRon of soluRons
2—Prototyping and sim-‐based
tesRng
3—Element ready for integraRon and
field tesRng
2
3
Ideal Rescue System
1
© 2015 Dartmouth-‐Hitchcock All Rights Reserved 25
Summary
• Con:nuous monitoring with pulse oximetry in general care sesngs has a posi:ve impact on pa:ent safety and is not cost prohibi:ve
• Benefit-‐burden analysis with respect to nursing tasks and cogni:ve impact remains posi:ve
• Standardiza:on and con:nuing educa:on are key elements to maintaining results
• More work is needed to increase understanding of the socio-‐technical aspects of pa:ent state assessment and response systems
© 2015 Dartmouth-‐Hitchcock All Rights Reserved 26

QuesRons and Discussion
27 © 2015 Dartmouth-‐Hitchcock All Rights Reserved 27