surveillance and outbreak reports outbreak of 2009 … los lagos region, in the south of the...
TRANSCRIPT

1www.eurosurveillance.org
Surveillance and outbreak reports
Outbreak of 2009 pandemic influenza A(H1N1), Los Lagos, Chile, April-June 2009
Chilean Task Force for study of Pandemic Influenza A (H1N1)1, E Pedroni2, M García3, V Espínola3, A Guerrero3, C González ([email protected])3, A Olea3, M Calvo4, B Martorell5, M Winkler5, M V Carrasco5, J A Vergara5, J Ulloa5, A M Carrazana5, O Mujica2, J E Villarroel4, M Labraña3, M Vargas5, P González5, L Cáceres5, C G Zamorano5, R Momberg5, G Muñoz5, J Rocco5, V Bosque5,A Gallardo5, J Elgueta5, J Vega3
1. The Ministry of Health Task Force is integrated by experts of the Ministry of Heath (Epidemiology, Health care services, Clinicians, laboratory), Scientific and medical society experts, Santiago, Chile2. Pan American Health Organization, Washington DC, United States3. Ministry of Health of Chile, Santiago, Chile 4. Chilean Infectiology Society, Valdivia, Chile5. Los Lagos Regional Health Office, Puerto Montt, Chile
Citation style for this article: Citation style for this article: Chilean Task Force for study of Pandemic Influenza A (H1N1), Pedroni E, García M, Espínola V, Guerrero A, González C, Olea A, Calvo M, Martorell B, Winkler M, Carrasco MV, Vergara JA, Ulloa J, Carrazana AM, Mujica O, Villarroel JE, Labraña M, Vargas M, González P, Cáceres L, Zamorano CG, Momberg R, Muñoz G, Rocco J, Bosque V, Gallardo A, Elgueta J, Vega J. Outbreak of 2009 pandemic influenza A(H1N1), Los Lagos, Chile, April-June 2009. Euro Surveill. 2010;15(1):pii=19456. Available online: http://www.eurosurveillance.org/ViewArticle.aspx?ArticleId=19456
This article has been published on 7 January 2010
On 17 May 2009, the first two cases of 2009 pandemic influenza A(H1N1) were confirmed in the Metropolitan region (Santiago, Chile). On 6 June 2009, Chile reported 500 confirmed cases, seven severe and two fatal. Because six of the severe cases and the two deaths occurred in the region of Los Lagos in south-ern Chile, a retrospective study was conducted using data on emergency room visits as well as laboratory viral surveillance, during the period from 1 April to 31 May, in order to establish the date of the beginning of the outbreak. From 1 to 27 June, data were collected in real time, to establish the real magnitude of the outbreak, describe its transmission, clinical severity and secondary attack rates. Confirmed cases, their household contacts and healthcare workers were interviewed. This analysis showed that the outbreak in Los Lagos started on 28 April. By 27 June, a total of 14,559 clinical cases were identified, affecting mostly 5-19 year-olds. The effective reproduction number dur-ing the initial phase (20 days) was 1.8 (1.6–2.0). Of the 190 confirmed cases with severe acute respira-tory infection, 71 (37.4%) presented a risk condition or underlying illness.
IntroductionOn 24 April 2009, the United States (US) Centers for Disease Control and Prevention (CDC) reported eight confirmed cases of a novel strain of influenza A(H1N1) in Texas and California, and Mexico confirmed the same virus in 16 samples [1-5]. That same day, the Ministry of Health of Chile alerted all regions of the country, so they could strengthen their surveillance of respiratory viruses and maximise infection control measures.
On 17 May, the first two cases of the 2009 pandemic influenza A(H1N1) were confirmed in the Metropolitan region of Santiago, in a person returning from Punta Cana (Dominican Republic) and another with no history
of travel outside Chile. The first case in Puerto Montt (Region of Los Lagos) was laboratory-confirmed on 26 May. One week later, Chile reported 500 confirmed cases throughout the country, among those seven cases with severe acute respiratory infection (SARI) and two fatalities. Because six of the SARI cases and the two deaths occurred in the region of Los Lagos, the Ministry of Health formed a field team on 1 June to investigate the outbreak in Puerto Montt. This team conducted a retrospective study from 1 April to 31 May, in order to establish the date of the beginning of the outbreak, and a follow study until 27 June to establish its real magnitude, and to describe its transmission and clinical severity. The Los Lagos region, in the south of the country, has 825,000 inhabitants and is one of the 15 regions in Chile. The capital Puerto Montt with 230,855 inhab-itants has the second most important airport in the country in terms of air traffic. This city receives many foreign travellers for business or tourism. The climate is cold, with temperatures fluctuating between 0 ºC and 8 ºC during the period of this study (1 April to 27 June).
The surveillance of influenza-like illnesses (ILI) in the region is carried out through sentinel units in ambula-tory care centres and hospitals. Until 6 October, Chile reported 12,254 confirmed cases of pandemic influenza, of which 1,585 (9.4 per 100,000 inhabitants) were cases with SARI including 134 fatali-ties (0.8 per 100,000 inhabitants); only one fatality was a pregnant woman. Los Lagos had the third highest rate of severe cases of the country (30.8 per 100,000 inhabitants) and the fourth highest mortality rate (1.33 per 100,000 inhabitants).

2 www.eurosurveillance.org
It is noteworthy that Chile indicates treatment with oseltamivir with a doctor’s prescription for anybody older than five years of age whose symptoms comply with the case definition.
MethodsIn order to establish the date of the beginning of the outbreak, its magnitude, transmission and clinical severity, we carried out a retrospective study using data on emergency room visits, from 1 April to 31 May 2008 and for the same period in 2009 at the two main health facilities in Puerto Montt. The following
diagnoses were included: respiratory viral disease, influenza, severe acute respiratory infection, pneu-monia, pneumonitis, obstructive bronchial syndrome, bronchitis, rhinopharyngitis, common cold and febrile syndrome. In addition, for the same period, a review of viral surveillance was conducted in the local laboratory registers.
From 1 June, case follow-up was implemented: In all healthcare facilities, in the public and private sector, people who fulfilled the following definition of a sus-pected case were notified: “any person presenting
Figure 1Distribution of clinical (n=14,559) and laboratory-confirmed cases (n=301) of pandemic influenza A(H1N1) by date of symptom onset, Los Lagos, Chile, 28 April- 27 June
0
200
400
600
800
1,000
1,200
28 A
pr
01 M
ay
04 M
ay
07 M
ay
10 M
ay
13 M
ay
16 M
ay
19 M
ay
22 M
ay
25 M
ay
28 M
ay
31 M
ay
03 Ju
n
06 Ju
n
09 Ju
n
12 Ju
n
15 Ju
n
18 Ju
n
21 Ju
n
24 Ju
n
27 Ju
n
Date 2009
Case
s
Confirmed cases
Clinical cases, without laboratory confirmation
First detected case in retrospective study Index case is confirmed
Table 1RT-PCR results for influenza A by age group, Los Lagos, Chile, 1 April-27 June 2009
Age groups (years) Total samples processedRT-PCR results
NegativePositive
Seasonal influenza Pandemic H1N1 influenza0 to 4 112 39.29% 2.68% 57.14%5 to 14 78 21.79% 1% 78.21%15 to 29 75 20.00% 0% 80.00%30 to 59 135 36.30% 0.74% 62.96%60 and older 63 73.02% 0.00% 26.98%Not specified 10 0.00% 0% 100.00%Total 473 36.15% 1.06% 62.79%
3www.eurosurveillance.org
a fever of 38.5 °C or higher accompanied by cough-ing and any of the following symptoms: headache, myalgia, arthralgias, and/or sore throat”. In order to identify suspected cases with SARI, the presence of dyspnoea, tachypnoea, cyanosis, or hypoxaemia was added to the previous case definition, and dehydration or food rejection was added for cases involving infants.
In addition, household visits were carried out to con-duct in-depth interviews with laboratory-confirmed cases and their contacts at home, in order to deter-mine the secondary attack rate. A symptomatic contact of the index case was defined as anyone developing ILI within 14 days following the date of onset of symptoms of the confirmed case. Interviews were also conducted with family members and with healthcare personnel who personally provided patient care, to establish the date of symptoms onset, the date of first medical attention and hospitalisation, risk factors and clinical evolution of severe and fatal cases. Clinical files of hospitalised patients and fatal cases in the two facili-ties were also reviewed.
All respiratory samples (nasopharyngeal aspi-ration) were analysed by direct and indirect
immunofluorescence and by the real-time RT-PCR dis-tributed by the US CDC to all national influenza centres.
The reproduction number R was estimated using the Wallinga and Lipsitch linearisation method based on the intrinsic growth rate r of the epidemic curve in its initial phase, which was assumed exponentially by vis-ual inspection of the epidemic curve. The assumption was that its initial phase corresponded to the first 20 days of consecutive transmission (between 15 May and 3 June) and that the intrinsic growth rate corresponded to the beta (slope) of the curve. The merit adjustment was estimated using the exponential regression coef-ficient for ascertainment. As the average latent period, 1.0 days was chosen and for infectiousness, 1.5 days [6-9].
Results Identification and general characteristics of the casesA 23% increase in pneumonias was observed in 2009 from 1 April onwards, compared with 2008; however, this increase was not significant (p=0.159). The first case of pandemic influenza was confirmed on 26 May.
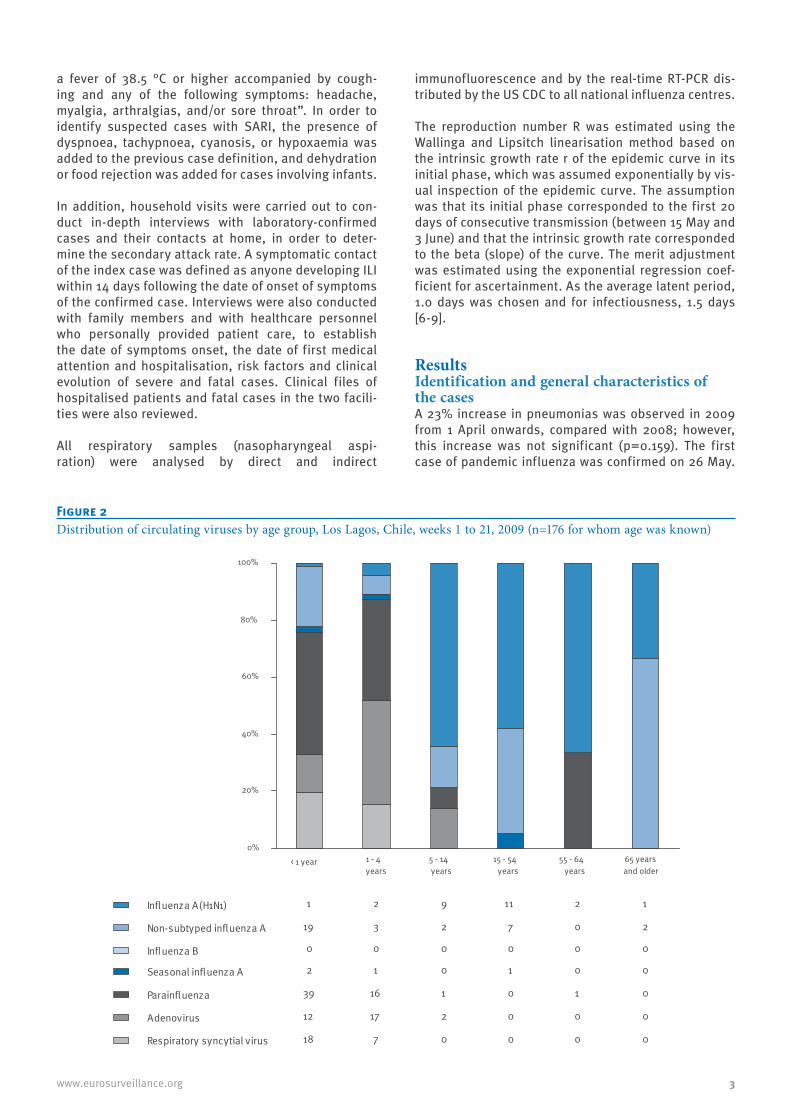
Figure 2Distribution of circulating viruses by age group, Los Lagos, Chile, weeks 1 to 21, 2009 (n=176 for whom age was known)
Seasonal influenza A
Influenza A(H1N1)
Non-subtyped influenza A
Influenza B
Parainfluenza
Adenovirus
Respiratory syncytial virus
0%
20%
40%
60%
80%
100%
1 2 9 11 2 1
19 3 2 7 0 2
0 0 0 0 0 0
2 1 0 1 0 0
39 16 1 0 1 0
12 17 2 0 0 0
18 7 0 0 0 0
< 1 year 1 - 4 years
5 - 14 years
15 - 54 years
55 - 64 years
65 years and older

4 www.eurosurveillance.org
However, the retrospective study showed that the first case had occurred on 28 April. After that date, the comparative analysis of 2008 and 2009 showed a significantly higher number in 2009 of common colds (p<0.001), ILI and influenza (p<0.001), pneumonia (p=0.008), obstructive bronchial syndrome (p<0.001), and febrile syndrome (p<0.001). This increase was first observed in emergency rooms during week 19 (10-16 May), reaching its peak by week 23 (7-13 June). The age groups in which the increase in pneumonias was observed were school children (5-19 years), young adults (20-29 years) and the elderly (over 65 years). From 1 April to 27 June, a total of 14,559 clinical cases of pandemic influenza were identified, 301 (2.1%) of them were laboratory-confirmed for pandemic influenza. Also, 190 (1.3%) of the clinical cases had SARI labo-ratory-confirmed for pandemic influenza, including 10 deaths (0.06%). From 26 May, the date of confirmation of the first case in Los Lagos and its notification, an abrupt increase in the number of cases was observed, according to the date of onset of symptoms and consul-tation (Figure 1). For the cases observed before 26 May, the average period between the date of onset of symp-toms and the first consultation was three days. After that date, the average period fell to 0.91 days.
The most affected age groups were the 5–19-year-olds (12.6 per 100,000 inhabitants) and the 20–29-year-olds (11.9 per 100,000 inhabitants). No significant differences were observed by sex. The main clinical
characteristics were fever (96.2%), cough (78.0%), myalgia (69.8%), sore throat (57.4%), vomiting (35.0%), diarrhoea (28.2%) and conjunctivitis (21.4%).
Laboratory surveillanceOf a total of 473 respiratory samples (nasopharyngeal aspiration) processed by the Chilean Institute of Public Health (Instituto de Salud Pública), 297 (62.79%) were positive for pandemic influenza A(H1N1), five (1.06%) were positive for seasonal influenza (H1 and H3), and 171 (36.15%) were negative for both. The highest per-centage of pandemic influenza infections was found in the age groups between five and 29 years (Table 1).
The viral surveillance (Figures 2: weeks 1-21 and Figure 3: weeks 1-25) showed an increase in the circulation of pandemic influenza and untyped influenza over week 21, especially in children under five (from 18.25% to 37.05%). Also observed was an increase in the circula-tion of respiratory syncytial virus (RSV, 32%), affecting in particular children under the age of one year.
Geographical spreadThe first cases were detected in week 17 in the city of Puerto Montt (where the airport is located), spread-ing at a rate between one and two new communes per week during the first three weeks (from one commune in week 17 to six communes in week 19) and between six and seven new communes per week during the fol-lowing three weeks (from six communes in week 20 to 26 in week 23). Six weeks after the first case detection
Figure 3Distribution of circulating viruses by age group, Los Lagos, Chile, weeks 1 to 25 2009 (n=646 for whom age was known)
0%
20%
40%
60%
80%
100%
Seasonal influenza A 3 3 1 5 0 0
Influenza A(H1N1) 20 44 61 132 17 13
Non-subtyped influenza A 26 24 39 56 10 5
Influenza B 0 0 0 0 0 0
Parainfluenza 41 19 2 0 1 0
Adenovirus 17 20 3 0 0 0
Respiratory syncytial virus 59 23 2 0 0 0
< 1 year 1 - 4 years
5 - 14 years
15 - 54 years
55 - 64 years
65 and older

5www.eurosurveillance.org
Figu
re 4
Geo
grap
hica
l spr
ead
of p
ande
mic
influ
enza
, Los
Lag
os R
egio
n, C
hile
, wee
ks 1
6 to
wee
k 23
, 200
9
Sour
ce: C
entr
o Na
cion
al d
e En
lace
, Dep
to. E
pide
mio
logí
a, M
inis
terio
de
Salu
d –
2009
.

6 www.eurosurveillance.org
(week 23), 26 of the 30 communes had been affected. Those with the highest rates per 100,000 inhabitants were Hualaihué (27.3), Osorno (7.8), Puyehue (6.2), Río Negro (4.5) and Llanquihue (4.6), while the over-all rate for the region was 1.2. The communes that did not present any cases up to week 23 were Futaleufú, Chaitén, Queilén, and Quinchao (the latter two on the island of Chiloé), see Figure 4.
Analysis of transmission Initial estimate of transmission reproduction number R)The exploratory analysis for a complete series of 20 days (15 May–3 June) showed an effective reproduction number (R) equal to 1.8 (confidence interval (CI):1.6–2.0); for 15 days (20 May–3 June) the R was 1.9 (CI:1.7–2.2), for 10 days (24 May–3 June) R was 2.0 (CI:1.7–2.3),
and for the last five days (30 May–3 June) R fell to 1.6 (CI: 1.5–1.8).
Transmission among household contacts On 3 June, the field team started interviewing confirmed cases and their household contacts. At that point, 59 cases were laboratory-confirmed for pandemic influ-enza. From those, 57 cases were interviewed and only two cases could not be contacted. For the 57 inter-viewed cases, 245 persons living in the same house-holds were identified (average: 3.3 household contacts per case; range: 0–8), with an average age of 29 years (ranging from 0 to 76 years) and 54.8% female cases (134 of 245). Besides the 57 interviewed cases, 89 of their household contacts presented ILI (complying with the case definition) from 24 April onwards, repre-senting a household prevalence of 59.6% (146 of 245 cases).
Figu
re 4
Con
tinu
edG
eogr
aphi
cal s
prea
d of
pan
dem
ic in
fluen
za, L
os L
agos
Reg
ion,
Chi
le, w
eeks
16
to w
eek
23, 2
009
Sour
ce: C
entr
o Na
cion
al d
e En
lace
, Dep
to. E
pide
mio
logí
a, M
inis
terio
de
Salu
d –
2009
.

7www.eurosurveillance.org
Of all 89 symptomatic contacts studied, 35 presented symptoms before the household index case and 54 were classified as secondary cases of the index case, representing a secondary attack rate of 35.0% (54 out of 146).
With the available information on the 54 secondary cases, the average time between the date of onset of
symptoms of the index case and the date of onset of symptoms of the contact (generation interval) was 3.61 days (median: three days, ranging from less than 24 hours to nine days).
Transmission among healthcare workers Forty-one healthcare personnel were interviewed, 20 presented respiratory symptoms within the four weeks prior to interview (48.7%); and 34 (82.9%) staff
Table 2Symptoms, interventions and laboratory results for hospitalised cases of pandemic influenza A(H1N1), Los Lagos, Chile, 1 May-27 June 2009 (n=20)
Signs and symptoms n ProportionDyspnoea 17 85.00%Tachypnoea 13 65.00%Crepitations 12 60.00%Tachycardia 10 50.00%Cyanosis 5 25.00%Wheezing 5 25.00%Hypotension 4 20.00%Seizures 2 10.00%Confusion 2 10.00%Interventions n ProportionNeeded oxygen upon admission 11 55.00%Needed mechanical ventilation during hospitalisation 5 25.00%Were admitted to ICU 8 40.00%Received antibiotic therapy 16 80.00%Received steroid therapy 9 45.00%Laboratory results upon admission Mean Minimum Maximum Normal valuesTotal white blood cell count/mm3 9,168 4,100 22,800 4,000-10,000% Neutrophils 69.16 6.7 91 55-65% Lymphocytes 18.29 5.3 43 25-35Haemoglobin (g/dl) 13.74 10.4 20.4 12 - 17% Haematocrit 41.27 33.1 57.3 37-52Platelets/mm3 262,706 123,000 533,000 150,000-450,000Erythrocyte sedimentation rate (mm) 31 6 84 1-15C-reactive protein (mg/dl) 8.8 1.2 26.5 < 1Na+ (meq/l) 135.1 130.7 140 135 a 146K+ (meq/l) 4.04 3.2 4.63 3.5 a 5Cl- (meq/l) 101.2 98.6 106 98 a 106Urine urea nitrogen (mg/dl) 19.5 8.4 49 7 a 18Creatinine (mg/dl) 1.34 0.5 4.6 0.6 a 1.4Glucose (mg/dl) 130.4 90 234 70 a 105SGOT(U/l) 321.5 60 583 up to 37SGPT (U/l) 104.7 19 354 up to 41Creatine kinase (U/l) 189.5 122 257 38 a 210PT (%) 74 51 89 70 a 100PTT(seg) 47 42 52 25 a 38pH 7.29 6.79 7.46 7.35 a 7.45pCO2 (mmHg) 47.6 27.5 131.3 35 a 45HCO3
- (meq/l) 18.9 2.6 30.6 22 a 26paO2 (mmHg) 73.9 45.6 111.5 80 a 100FiO2 (%) 51.6 28 100 21
Meq: milliequivalents; PT: prothrombin time; PTT: partial thromboplastin time; SGOT: serum glutamic oxaloacetic transaminase; SGPT: serum glutamic pyruvic transaminase.

8 www.eurosurveillance.org
members indicated that they had had contact with sus-pected or confirmed cases in the community. Of the symptomatic healthcare workers, 47.2% had been vac-cinated, but only 25% of the asymptomatic healthcare workers. An evaluation of the compliance with treat-ment guidelines for symptomatic healthcare workers (with oseltamivir) showed that only two cases received treatment with oseltamivir.
Severity analysis General characteristicsThe proportion of cases who developed a SARI and required hospitalisation was 1.3% (190 of all 14,559 cases). The first cases with SARI were hospitalised from the middle of May (week 22) onwards, 20 days after the first case had been detected in the retro-spective search, and eight days before the first case in Puerto Montt’s (index case) had been detected (see Figure 1). A gradual increase in hospitalised cases was observed up to 23 June, when the number of cases with SARI rose to twelve on that day alone.
Among the 190 cases of SARI with a confirmed diag-nosis, the median age was 27 years (0–85), 47.4% being male (90 of 190). The age group most affected were children under five years (73 per 100,000 inhabit-ants), followed by those over 60 years of age (22 per 100,000), 40-59 years (20.3 per 100,000), 20-39 years (18 per 100,000), and finally those between five and 19 years of age (17 per 100,000 inhabitants). As of 27 June 2009, 10 deaths have been reported (a fatality rate of 0.19%) eight male and two female: a six-year-old boy, seven young adults between 18 and 64 years of age, and two elderly adults aged between 65 and 85.
Co-morbidity in severe casesOf the 190 cases with confirmed SARI, 71 (37.4%) pre-sented an underlying risk condition or illness. The interviews with the 57 confirmed cases (37 mild cases and 20 cases with SARI) and the review of the clinical files showed that presenting some underlying evidence of co-morbidity increased the risk of pre-senting SARI (14.3% in the mild cases versus 57.9% in the cases with SARI (odds ratio (OR)=8.25; CI: 2.22 to 30.60; p=0.0013). The underlying risk factors in the acute cases were pulmonary disease (six), obesity (three), heart disease (three), diabetes (one), alcohol-ism (one) and smoking (two). Of these cases, three presented two or more underlying conditions. Of the 10 deaths, five showed between one and three risk fac-tors: obesity (two), heart disease (three), hypertension (one), diabetes (one), chronic obstructive pulmonary disease (one), pulmonary fibrosis (one), and heavy smoking (two).
Clinical and laboratory characteristics in severe casesThe main results from the 20 hospitalised cases stud-ied in depth are shown in Table 2. The characteristics
at the beginning of the clinical profile did not differ between the group of people with mild disease and those with severe disease. With respect to chest X-rays performed at the time of admission, seven presented images compatible with pneumonia, 11 presented inter-stitial infiltrate, and in two cases the X-rays were not available.
Of the severe cases, 11 were admitted with evidence of hypoxia, for which they required oxygen at that time; however, all patients required oxygen at some point during their hospitalisation.
The serum glutamic oxaloacetic and glutamic pyruvic transaminases at the time of admission reached aver-age values of 321 U/L (range: 60–583) and 105 U/L (range: 19–354), respectively. The rest of the labora-tory tests performed at the time of admission were found to fall within the reference values.
DiscussionAs a result of this study, it was possible to determine that the outbreak of pandemic influenza A(H1N1) in Los Lagos started on 28 April 2009 (week 17), before the confirmation of the first case in the country (17 May, week 20). It probably originated due to the high level of international commercial activity in that region. By week 23, the virus had spread to 26 of 30 communes in Los Lagos, reaching a total of 14,559 cases. Regarding transmission, the preliminary reproduction number for the initial phase (1.6–2.0) was higher than estimated for the outbreak in Mexico (1.4–1.6) and lower than estimated for the outbreak in Japan (2.0–2.6) [7,8]. Household prevalence was higher, at 59.2%, probably due to lifestyle factors related to the low temperatures during the period of investigation; while the secondary attack rate (35.0%) and the generation interval (3.61 days) were similar to the values found in Mexico (31% and 3.9 days, respectively (10). Although high levels of transmission were found among healthcare personnel (48.7%), no link with hospitalised patients could be established, because 83% of the staff had had contact with suspected or confirmed cases in the community.
The highest rates of SARI were in small children and elderly people, while mild disease was more frequent in school children and young adults.
One of the main limitations of this study was the small number of patients with SARI who were studied in depth. Further analysis will include all cases that occurred in Los Lagos during the winter season, which will give us more information on the clinical presenta-tion and serious risk factors.

9www.eurosurveillance.org
References1. World Health Organization. Human infection with new
influenza A (H1N1) virus: clinical observations from Mexico and other affected countries, May 2009. Wkly Epidemiol Rec 2009; 84(21):185-9.
2. Centers for Disease Control and Prevention (CDC). Update: swine influenza A (H1N1) infections — California and Texas, April 2009. MMWR Morb Mortal Wkly Rep. 2009;58(16):435-7.
3. Centers for Disease Control and Prevention (CDC). Update: novel influenza A (H1N1) Virus infections — Mexico, March 2009. MMWR Morb Mortal Wkly Rep. 2009;58(21):585-9.
4. Dirección General Adjunta de Epidemiología. [Epidemiology Direction]. Brote de influenza A H1N1 México. [Influenza A H1N1 Outbreak in Mexico]. Bulletin Nº 13 (8 May 2009). [Spanish]. Available from: http://www.dgepi.salud.gob.mx/influenza/AH1N12009/ah1n1_boletines.html
5. Dirección General Adjunta de Epidemiología. [Epidemiology Direction]. Brote de influenza A H1N1 México. [Influenza A H1N1 Outbreak in Mexico]. Bulletin Nº53 (3 july 2009). [Spanish]. Available from: http://www.dgepi.salud.gob.mx/influenza/AH1N12009/ah1n1_boletines.html
6. Wallinga J, Lipsitch M. How generation intervals shape the relationship between growth rates and reproductive numbers. Proc Biol Sci 2007;274(1609):599-604.
7. Fraser C, Donnelly CA, Cauchemez S, Hanage WP, Van Kerkhove MD, Hollingsworth TD,,et al. Pandemic potential of a strain of influenza A (H1N1). Science. 2009;324(5934): 1557-61.
8. Nishiura H, Castillo-Chavez C, Safan M, Chowell G. Transmission potential of the new influenza A(H1N1) virus and its age-specificity in Japan. Euro Surveill. 2009;14(22):pii=19227. Available from: http://www.eurosurveillance.org/ViewArticle.aspx?ArticleId=19227
9. Cowling BJ, Fang VJ, Riley S, Malik Peiris JS, Leung GM. Estimation of the serial interval of influenza. Epidemiology. 2009;20(3):344-7.
10. Personal communication. Pan American Health Organization (PAHO) contributions to the Mexican report submitted to the World Health Organization (WHO).