surface deformation of alpine terrain … deformation of alpine terrain derived by ps-insar...
TRANSCRIPT

SURFACE DEFORMATION OF ALPINE TERRAIN DERIVED BY PS-INSARTECHNIQUE ON THE SIACHEN GLACIER
Junchao Shi and Ling Chang
Department of Remote Sensing, Delft University of Technology, the Netherlands.
ABSTRACT
Accumulation gain is essential for mass balance of valleyglaciers in the Karakoram Himalayas. The higher eleva-tion of this area received snowfall(>1000 cm · yr−1)annually, while the snowfall occupies 95% of total pre-cipitation (75-150 cm · yr−1). Meanwhile, the air tem-perature ranging from -20 to -40 °C, during December-February, is also very suitable for accumulation of glaciermass. We choose ALOS/PALSAR L-band data fromApril, 2007, to September, 2009, in the Siachen glacierto generate the interferograms and calculate their dis-placements spatially and temporally. In this study, thesurface deformation of upper part of the Siachen glacierlocated in central Karakoram is estimated by using PS-InSAR technique. Here, we implement the PS method,which uses spatial correlation of interferogram phase tofind pixels with low-phase variance in the terrain. Priorknowledge of temporal variations in the deformation rateis not required for their identification. Through times se-ries analysis of the interferograms we were able to reducethe impact of digital elevation model errors and extractthe real surface change signal.
Key words: surface deformation; PS-InSAR; SiachenGlacier.
1. INTRODUCTION
The Karakoram is situated at the western end of the trans-Himalaya and is one of the largest glaciated areas out-sides the polar regions, of which over 37% is covered byglaciers[1].The aggregate amount of glaciers was investi-gated 16.6× 10³km2 approximately. This study focuseson the upper part of Siachen Glacier(35.6°N 77.3°E),the eastern part of Karakoram range, it includes TeramShehr Glacier, Lolofond Glacier and several other tribu-taries. Despite, the Siachen Glacier is about 74 km long,and width varying from 1 to 8 km approximately, as thelongest glacier in the Karakoram and second longest inthe worlds non-polar areas, the average winter snowfallis 10.5 m and temperatures can reach to -50°C. Includingall tributary glaciers, the Sianchen glacier system covers700 km2. Therefore, the observation of its glaciological
process is limited by high attitude, remote and sophisti-cated meteorological conditions. Given these complex
70° E 80° E 90° E 100° E
10° N
20° N
30° N
40° N
Karakoram
Figure 1: The general geolocation of our studyarea.(adapted from the imagery of Andy Proehl March,2007.)
restraints, SAR data is an efficient source of this typeglacier flow velocity estimation in general. The inter-ferometric phase is as noted sensitive to both surface to-pography and coherent displacement of scatters along theradar look direction in the time between the acquisitions
_____________________________________________________ Proc. ‘Fringe 2011 Workshop’, Frascati, Italy, 19–23 September 2011 (ESA SP-697, January 2012)

of the interferometric image pairs. For glacier surface,the coherence is affected by both meteorological condi-tions and glacier flow velocity and generally decreasesrapidly with increasing time between the acquisitions oftwo SAR images. Meteorological causes of decorrela-tion involve ice and snow melting, snowfall and wind re-distribution of snow and ice. Moderate snowfall on theglaciated surface, extremely reduce temperatures and in-tense wind conditions give to harsh weather and climaticconditions over this region[2].
Table 1: The critical baseline of ALOS PALSAR com-pared with ERS/ENVISAT. ALOS −altitude = 700 km,wavelength = 23.6 cm;ERS/ENVISAT−altitude = 790km, wavelength = 5.6 cm. Adapted from [3].
Look angle 23° 34° 41°ALOS FBD 3.6 km 6.5km 9.6 km(14 MHz)
ALOS FBS 7.3 km 13.1km 18.6 km(28 MHz)
ERS/ENVISAT 1.1km 2.0 km 2.9 km(16 MHz)
2. DATASETS AND SPATIAL DECORRELATIONANALYSIS
Repeated-pass InSAR system has been proven as highaccuracy level for detecting the deformation of glaciersurface[4]. To estimate the deformation of glacier sur-face based on the spacebrone interferometry, we choosethe upper part of Siachen glacier with a high relief inKarakoram. But the the longer temporal interval betweenselected master and slave images will result in the shiftsof backscatter characteristics of surface targets; on theother hand, it is worth to keep in mind that larger spa-tial baseline or small the distance from antenna to surfacecan make phase unwrapping difficult, and exaggerate theeffect of topography. Both of these factors will decor-relate the coherence during the generation of interfero-grams dominantly.
To obtain higher accuracy of deformation results, we im-plemented 12 scenes of ALOS PALSAR FBS and FBDmode for interferograms produce to monitor the ice mo-tion from April 2007 to September of 2009 in our study.All the 12 scenes are involved in track 523, frame 0700,ascending pass (more details of all scences shown in Ta-ble.2). The usage of the L-band (236-mm wavelength)PALSAR in this case study over C-band (56-mm wave-length) are summaried as: deeper penetration of surfacein less temporal decorrelation, enabling interferogramsto have longer time separation[3]. Due to heavy snowcover attenuation in winter, the coherence of interfero-metric pairs was always not so perfect. Compared withC-band, the longer wavelength of L-band PALSAR datacan be more suitable in this situation. Moreover, the
critical baseline is extended by the longer wavelength(see Table.1), so that we could produce more moderatequality interferograms. In addition to these fundamentalwavelength-dependent issues, PALSAR is operated in anumber of different modes that could both enhance anddetract from its interferometric capabilities[5]. In partic-ular, the fine-beam dual polarization (FBD−HH ⁄HV, 14MHz) has 2× worse range resolution than the FBS mode.While, the fine-beam single polarization (FBS−HH, 28MHz ) has 2× better range resolution than most previousInSAR instruments, which further increases the criticalbaseline and could improve the spatial resolution of theinterferograms. To make sense of the decorrelation byspatial effect, we check their relation by the function[6].
ρspatial = 1− 2 cos θRyB⊥
λr(1)
whereθ––incident angleλ––wavelength of the radarB⊥––perpendicular baselineRy––ground range resolution
If we assumed that the local surface slope α is upwardfrom horizontal plane, away from the slant direction; θ0is nominal incident angle away from the normal line ofthe local surface(calculated as 39.1°for ALOS-PALSARmodes here). Thus, we get the ground range resolution isrelated to the local slope by
Ry =c
2Bw| sin(θ0 − α)|(2)
where c is the speed of light, and Bw is the frequencybandwidth of the the transmitted chirp signal. We can in-terpret that the correlation is inversely proportional to theground range resolution from Eq.1. In each slant rangeresolution cell of a SAR image, the total scattered field isa coherent summation of radar backscattering from manyscatterers within the ground range resolution cell. As theground range resolution cell increases, the width of themain lobe of the impulse response function broaden andthus, the correlation between two SAR signals diminishesas shown in Eq.1.
Combined Eq.1 with Eq.2, we can get the obvious re-lation between spatial decorrelation and perpendicularbaseline, surface slope
ρspatial = 1−A ·B⊥| cot(θ0 − α)| (3)
where A = c/(λrB), a constant for a certain SAR sys-tem. As shown in Fig. 2, the correlation decreases withlocal slope until it approaches to the nominal incident an-gle, meanwhile, the increment of perpendicular baselineaccelerates the reduction of the correlation.
Melting season of Siachen glacier starts beginning ofMay and culminates in July. There are 5 acquired scenesdistributed in the melting season. We need to address that
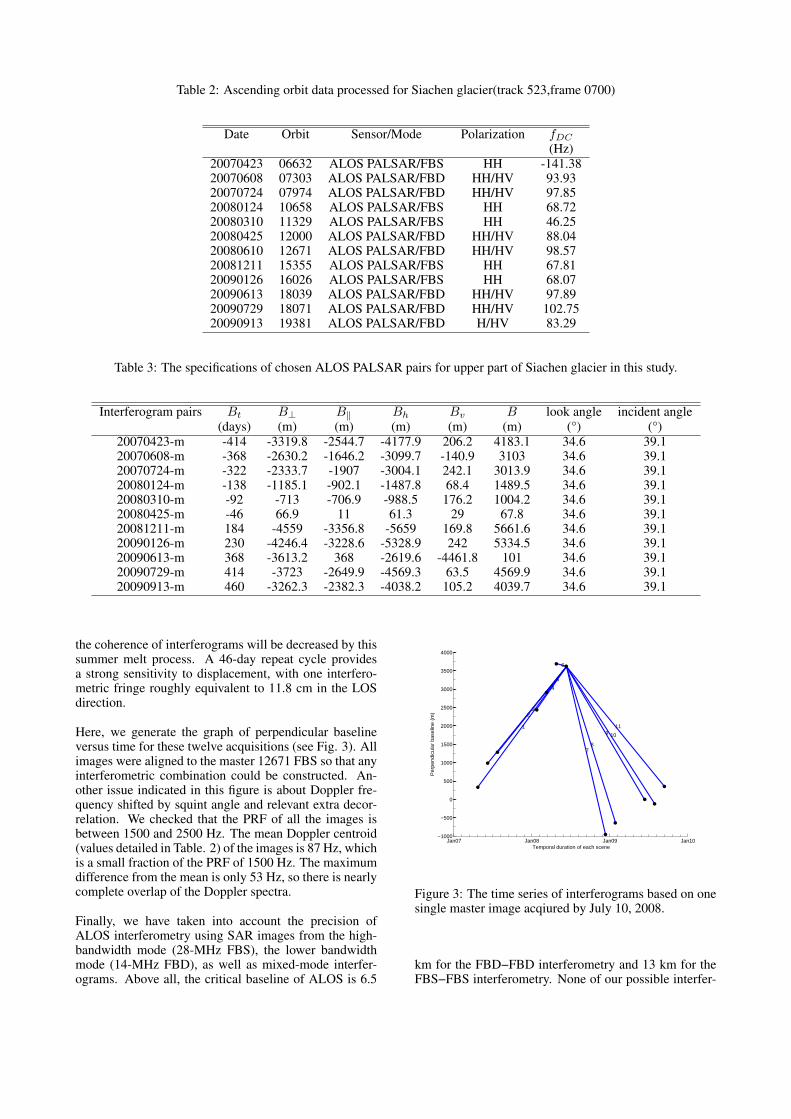
Table 2: Ascending orbit data processed for Siachen glacier(track 523,frame 0700)
Date Orbit Sensor/Mode Polarization fDC
(Hz)20070423 06632 ALOS PALSAR/FBS HH -141.3820070608 07303 ALOS PALSAR/FBD HH/HV 93.9320070724 07974 ALOS PALSAR/FBD HH/HV 97.8520080124 10658 ALOS PALSAR/FBS HH 68.7220080310 11329 ALOS PALSAR/FBS HH 46.2520080425 12000 ALOS PALSAR/FBD HH/HV 88.0420080610 12671 ALOS PALSAR/FBD HH/HV 98.5720081211 15355 ALOS PALSAR/FBS HH 67.8120090126 16026 ALOS PALSAR/FBS HH 68.0720090613 18039 ALOS PALSAR/FBD HH/HV 97.8920090729 18071 ALOS PALSAR/FBD HH/HV 102.7520090913 19381 ALOS PALSAR/FBD H/HV 83.29
Table 3: The specifications of chosen ALOS PALSAR pairs for upper part of Siachen glacier in this study.
Interferogram pairs Bt B⊥ B‖ Bh Bv B look angle incident angle(days) (m) (m) (m) (m) (m) (°) (°)
20070423-m -414 -3319.8 -2544.7 -4177.9 206.2 4183.1 34.6 39.120070608-m -368 -2630.2 -1646.2 -3099.7 -140.9 3103 34.6 39.120070724-m -322 -2333.7 -1907 -3004.1 242.1 3013.9 34.6 39.120080124-m -138 -1185.1 -902.1 -1487.8 68.4 1489.5 34.6 39.120080310-m -92 -713 -706.9 -988.5 176.2 1004.2 34.6 39.120080425-m -46 66.9 11 61.3 29 67.8 34.6 39.120081211-m 184 -4559 -3356.8 -5659 169.8 5661.6 34.6 39.120090126-m 230 -4246.4 -3228.6 -5328.9 242 5334.5 34.6 39.120090613-m 368 -3613.2 368 -2619.6 -4461.8 101 34.6 39.120090729-m 414 -3723 -2649.9 -4569.3 63.5 4569.9 34.6 39.120090913-m 460 -3262.3 -2382.3 -4038.2 105.2 4039.7 34.6 39.1
the coherence of interferograms will be decreased by thissummer melt process. A 46-day repeat cycle providesa strong sensitivity to displacement, with one interfero-metric fringe roughly equivalent to 11.8 cm in the LOSdirection.
Here, we generate the graph of perpendicular baselineversus time for these twelve acquisitions (see Fig. 3). Allimages were aligned to the master 12671 FBS so that anyinterferometric combination could be constructed. An-other issue indicated in this figure is about Doppler fre-quency shifted by squint angle and relevant extra decor-relation. We checked that the PRF of all the images isbetween 1500 and 2500 Hz. The mean Doppler centroid(values detailed in Table. 2) of the images is 87 Hz, whichis a small fraction of the PRF of 1500 Hz. The maximumdifference from the mean is only 53 Hz, so there is nearlycomplete overlap of the Doppler spectra.
Finally, we have taken into account the precision ofALOS interferometry using SAR images from the high-bandwidth mode (28-MHz FBS), the lower bandwidthmode (14-MHz FBD), as well as mixed-mode interfer-ograms. Above all, the critical baseline of ALOS is 6.5
Jan07 Jan08 Jan09 Jan10−1000
−500
0
500
1000
1500
2000
2500
3000
3500
4000
1
23
4
5
6
78
9 10
11
Temporal duration of each scene
Per
pend
icul
ar b
asel
ine
(m)
Figure 3: The time series of interferograms based on onesingle master image acqiured by July 10, 2008.
km for the FBD−FBD interferometry and 13 km for theFBS−FBS interferometry. None of our possible interfer-

−80 −60 −40 −20 0 20 40 60 800
0.1
0.2
0.3
0.4
0.5
0.6
0.7
0.8
0.9
1
The slope of local surface (degree)
The
spa
tial c
orre
latio
n of
the
inte
rfer
ogra
ms
100 m
1000 m
2000 m
3000 m
4000 m
5000 m
Figure 2: Spatial decorrelation with a sequence of perpendicular baselines variate with local surface slope.
ometric baselines exceeded these ranges, even one datahave baseline less than 100 m. Therefore, baseline decor-relation is not an issue with ALOS. However, errors dueto inaccurate topographic phase can dominate interfer-ometric pairs with baselines longer than about 0.2 km.Therefore, either a shorter baseline must be used for mea-suring deformation or the accuracy of the global topo-graphic grids must be improved. Moderate-baseline (1km) ALOS interferograms could be used to improve theaccuracy of SRTM topography.
3. DEFORMATION ESTIMATES OF THEGLACIER SURFACE IN LOS DIRECTION
Considering these factors above, we analyzed the perpen-dicular baseline before the co-registration and unwrappedphase generation. Then, we utilize the Persistent scat-terers (PS) InSAR method, which considered the phaseof the one pixel was determined by one consistent pointscatterer. The principle improvement of Persistent scat-terers (PS) InSAR is that it overcomes the decorrelationproblem by identifying resolution elements whose echois dominated by a single scatterer within the resolutionpixel in a series of interferograms. Finally, the decorrela-tion of each pixel could be decreased relatively after thisprocedure. In practice, we select the scene of 20080610as the only main master image, considering the Dopplercentroid differences and spatial baseline, temporal base-line synthetically. Furthermore, pixels are multi-looked 5
0.65 0.7 0.75 0.8 0.85 0.9 0.95 10
500
1000
1500
2000
2500
3000
3500
4000
4500
Coherence of the PS points
Cou
nts
of P
S p
oint
s
Figure 4: The quality of the final selected PS points aftersubtract these noise items.
times in range and 15 times in azimuth. Given, the limita-tion of spatial baseline, temporal separation and relevantbackscatter characteristics changes of the glacier surface,we set criteria the performance of interferograms whosecoherence is greater than 0.3. This may also result inmore possible PS pixels for all the 11 interferograms cor-related slave with masters matched in the PS selectionstep. Another issue in the coregistration is to avoid thesome interferograms failed if only used the old cross-

relation of amplitude method. When we processed thecoregistration, the amplitude based algorithm was usedto estimate the offsets in position between pairs of im-ages with good correlation.
Then, we concentrated on preparing for the PS pixelsgeneration using the phase stabilities calculation and am-plitude. Through this way, we remained identified prob-able PS pixels and rejected those pixels that tended to beprevalent only in certain interferograms and that may bedominated by scatterers in neighbor pixels.In Fig. 4, wesummarize the the quality of the final PS points. Most oftheir coherences are greater than 0.6 to confirm the im-provement of the series procedures for the conventionalInSAR failed case. So, we processed the unwrapping de-pending on the optimization routines of SNAPHU[7]. Af-ter the unwrapping procedure, we diminish such as lookangle error, squint angle error, and extract the displace-ment in LOS direction by participated PS pixels for eachinterferogram[8]. Consequently, we calculate the LOS(line of sight) velocity maps based on the master imageduring 2007-2009.(see in Fig.5)
4. INTERPRETATION OF VELOCITIES COU-PLED WITH GLACIER DYNAMICS
After a series of processing, such as, interferograms pro-duce and pixel phase stability estimates and PS selection,achieved in the previous section, the LOS velocity mapwas established. If assumed the phase information in-volved in each PS pixel of one interferogram, we cangenerally project the slant range differences in verticaldirection like this(see Fig. 6).
− λ
4πφ cos θ = V⊥ + ε (4)
where λ is the radar wavelength, which is 23.6 cm forALOS-PALSAR L-band radar;θ is radar incidence angle,φ is the unwrapped interferometric phase; V⊥ is the ver-tical velocity;ε is all the related error caused by residualtopographic contribution due to errors in DEM, look an-gle error, squint angle error, atmospheric delay and so on.This results has subtracted the phase information due totopography and other noise factors. Currently, we intendto interpret this velocity result with specific glacier dy-namics.
Initially, we determine the average equilibrium line(ELA)around the altitudes betwee 5400 m and 5600m, then di-vide the accumulation zone from the entire glacier. It in-dicates that most debris-covered area of Siachen Glacierbelow this level is retreating rapidlyReasonable correla-tion levels can usually be obtained in low accumulationarea(e.g.75~150 cm·yr−1), while in many high accumu-lation areas (e.g.1000cm · yr−1)[9].
In terms of the glacial mechanism, the steady-state ofglacier exhibits uplift (v⊥ > 0) in its ablation area andsubsidence in its accumulation area (v⊥ < 0) to compen-sate for local mass balance. In general v⊥ is expected to
Figure 6: The geometry projecting LOS displacement toglacier surface
be larger than v‖ for valley glaciers than for ice streams.In such a steady state, the surface in the accumulationarea must everywhere be sinking at a rate that balancesaccumulation, and conversely in the ablation zone. Thus,the vertical velocity at the surface v⊥, is clearly related tothe net balance rate This is due to the higher mass-balancegradients and associated larger longitudinal strain rates ofvalley glaciers. Therefore αG can differ from αV by asmuch as 2-3°for valley glaciers.
5. CONCLUSIONS
Here, PS-InSAR calculation shows its high accuracy(mm level) to determine ice movement in the slant-rangedirection and vertical direction. We produced the localmaps of glacier surface deformation in time series overupper area of Sianchen glacier. It is clear that the esti-mated area of the Siachen Glacier and its tributaries areactive, even over their upper regions where the temper-ature is considerably low in winter. In general, ALOS-PASAR L-band SAR data combined PS-InSAR methodovercomes the lower coherence decreased by snow coverin winter, which is very potential to describe the charac-teristics of glacier dynamics.
Obviously, the submergence and emergence velocitiesare defined for any point on a glacier surface. Due tothe net balance rate bn fluctuates from year to year, theyequal bn only in the idealized steady-state situation thatwe have specified. In other words, if the accumulationrate consistently exceeds the submergence velocity andthe ablation rate consistently. For the next step, it is po-tential to merge the high precise velocities results for cal-culating the net balance rate.

LOS-Velocity (mm/yr)
-81.82 - -28.5
-28.5 - -13.86
-13.86 - -2.86
-2.86 - 8.7
8.7 - 24.09
24.09 - 69.81
7.5 0 7.53.75 Kilometers
Figure 5: Mean LOS velocity map in Siachen glacier between spring, 2007 and winter, 2009 from ascending orbit ofALOS PALSAR. The velocity are related to the mean velocity of PS pixels on the upper part of Siachen glacier.

Vertical velocity (mm/yr)
-62.65 - -33.86
-33.86 - -17.53
-17.53 - -4.12
-4.12 - 9.10
9.10 - 23.99
23.99 - 54.20
7.5 0 7.53.75 Kilometers
Figure 7: The mean vertical velocities of Siachen Glacier during 2007-2009.
ACKNOWLEDGEMENTS
We thank that Andy Hooper gives quite constructive com-ments on the processing of StaMPS method. This re-search was founded by the European Commission (CallFP7-ENV-2007-1 grant 212921) as part of the CEOP-AEGIS project (www.ceop-aegis.org/) coordinated by theUniversit de Strasbourg. All the ALOS-PALSAR datawere provided by ESA.
REFERENCES
[1] L. Copland, S. Pope, M.P. Bishop, J.F. Shroder,P. Clendon, A. Bush, U. Kamp, Y.B. Seong, and L.A.Owen. Glacier velocities across the central karako-ram. Annals of Glaciology, 50(52):41–49, 2009.
[2] AP Dimri and SK Dash. Winter temperature and pre-cipitation trends in the siachen glacier. Current sci-ence, 98(12):1620, 2010.
[3] D.T. Sandwell, D. Myer, R. Mellors, M. Shimada,B. Brooks, and J. Foster. Accuracy and resolution of
alos interferometry: Vector deformation maps of thefather’s day intrusion at kilauea. Geoscience and Re-mote Sensing, IEEE Transactions on, 46(11):3524–3534, 2008.
[4] I. Joughin, R. Kwok, and M. Fahnestock. Estimationof ice-sheet motion using satellite radar interferom-etry: method and error analysis with application tohumboldt glacier, greenland. Journal of Glaciology,42(142):564–575, 1996.
[5] M. Shimada, O. Isoguchi, T. Tadono, R. Higuchi,and K. Isono. Palsar calval summary and update2007. In Geoscience and Remote Sensing Sympo-sium, 2007. IGARSS 2007. IEEE International, pages3593–3596. IEEE, 2007.
[6] H.A. Zebker and J. Villasenor. Decorrelation ininterferometric radar echoes. Geoscience and Re-mote Sensing, IEEE Transactions on, 30(5):950–959,1992.
[7] CW Chen and HA Zebker. Two-dimensional phaseunwrapping with statistical models for nonlinear op-timization. In Geoscience and Remote Sensing Sym-posium, 2000. Proceedings. IGARSS 2000. IEEE

2000 International, volume 7, pages 3213–3215.IEEE, 2000.
[8] A. Hooper, H. Zebker, P. Segall, and B. Kampes.A new method for measuring deformation on volca-noes and other natural terrains using insar persistentscatterers. Geophysical Research Letters, 31(23):5,2004.
[9] MR Bhutiyani. Mass-balance studies on siachenglacier in the nubra valley, karakorum himalaya, in-dia. Journal of Glaciology, 45(149):112–118, 1999.