surface and interface analysis citation for the or …1452344/...outer membrane in gram-negative...
TRANSCRIPT

http://www.diva-portal.org
This is the published version of a paper published in Surface and Interface Analysis.
Citation for the original published paper (version of record):
Hagberg, A., Rzhepishevska, O I., Semenets, A., Cisneros, D A., Ramstedt, M. (2020)Surface analysis of bacterial systems using cryo-X-ray photoelectron spectroscopySurface and Interface Analysishttps://doi.org/10.1002/sia.6854
Access to the published version may require subscription.
N.B. When citing this work, cite the original published paper.
Permanent link to this version:http://urn.kb.se/resolve?urn=urn:nbn:se:umu:diva-173400

E C A S I A S P E C I A L I S S U E P A P E R
Surface analysis of bacterial systems using cryo-X-rayphotoelectron spectroscopy
Aleksandra Hagberg1 | Olena Rzhepishevska1 | Anastasiia Semenets1,2 |
David A. Cisneros3 | Madeleine Ramstedt1
1Department of Chemistry, UCMR, Umeå
University, Umeå, Sweden
2Department of Microbiology, Virology and
Biotechnology, Odessa National I.I.Mechnikov
University, Odessa, Ukraine
3Department of Molecular Biology, UCMR,
Umeå University, Umeå, Sweden
Correspondence
Madeleine Ramstedt, Department of
Chemistry, UCMR, Umeå University, 901 87.
Umeå, Sweden.
Email: [email protected]
Funding information
Formas, Grant/Award Number: 2017-00403;
Kempe Foundation, Grant/Award Number:
JCK-1720
Surface analysis of biological systems using XPS often requires dehydration of the
sample for it to be compatible with the ultrahigh vacuum of the spectrometer. How-
ever, if samples are frozen to liquid-nitrogen temperature prior to and during analysis,
water can be retained in the sample and the organization of the sample surface
should be preserved to a higher degree than in desiccated samples. This article pre-
sents recent developments of cryo-X-ray photoelectron spectroscopy (cryo-XPS) for
analyses of hydrated biological samples at liquid nitrogen temperature. We describe
experiments on bacterial cells, bacterial biofilms, and bacterial outer membrane vesi-
cles using a variety of bacterial species. Differences and similarities in surface chemis-
try are monitored depending on growth in liquid culture, on culture plates, as well as
in biofilms, and are discussed. Two data treatment methods providing decomposition
of the C 1s spectra into lipid, polysaccharide, and peptide/peptidoglycan content are
used and compared.
1 | INTRODUCTION
Bacterial interactions with their surrounding environment are medi-
ated through their cell envelope, as well as other bacterial surface
structures such as flagella and fimbriae.1 These interactions are com-
plex and rely on several factors including physicochemical interactions
and specific molecular recognition mechanisms mediated through
receptors.2–4 To investigate these complex systems, analyses of the
surface chemistry can be a useful tool in order to better understand
and interpret processes involving the cell surface. For example, an
increase in protein concentration at the surface of some bacteria, may
indicate spore formation,5 increased amounts of membrane proteins,
or other types of adaptations. Differences in polysaccharide content
may indicate changes in the lipopolysaccharide composition of the
outer membrane in Gram-negative bacteria,6 or be a result of altered
expression of capsules or surface-bound extracellular substances. In
this context, X-ray photoelectron spectroscopy (XPS) is an attractive
analysis technique, as its surface sensitivity enables analyses of only
the outermost part of the cell envelope of bacteria and/or surface
appendages and coatings,6 thereby enabling characterization of the
cell envelope without influence from the cytoplasmic content of the
bacterial cell. However, this is only valid if sample pretreatment
methods keep the cells intact (i.e., does not rupture or beak them
exposing their interior or causing building blocks to migrate in the
cell-envelope structure).
Bacteria have several “lifestyles” (free-swimming planktonic cells,
sessile cells, etc.) depending on factors such as stress levels, nutrient
supply, and interactions with other (micro) organisms. Often these
lifestyles can be correlated to metabolic differences.7,8 Thus, plank-
tonic cells cultivated in liquid broth may differ in surface composition
compared with cells growing on a solid nutrient medium such as an
nutrient agar plate or cells growing inside a biofilm.9 Biofilms are coat-
ings formed by bacterial cells embedded in a matrix of substances that
they have secreted, so-called extracellular polymeric substances
(EPS).7 Bacteria inside biofilms display lower susceptibility to antibi-
otics and biocides as a result of several factors including changes in
Received: 3 October 2019 Revised: 5 June 2020 Accepted: 8 June 2020
DOI: 10.1002/sia.6854
This is an open access article under the terms of the Creative Commons Attribution License, which permits use, distribution and reproduction in any medium,
provided the original work is properly cited.
© 2020 The Authors. Surface and Interface Analysis published by John Wiley & Sons Ltd
Surf Interface Anal. 2020;1–10. wileyonlinelibrary.com/journal/sia 1

metabolic activity and that they are shielded from the environment by
the EPS.7,8 Bacterial cells, both in planktonic form and in biofilms, can
release small parts of their cell membranes forming membrane vesicles
(that also can be analyzed using XPS). These have been suggested to
play a range of roles including cell-cell communication, nutrient
uptake, scavenging of toxins, and as toxin-delivery vehicles.10 In
Gram-negative bacteria, these vesicles are called outer-membrane
vesicles (OMVs) as they mainly originate from the outer membrane
that buds and forms vesicles.10,11 Also, Gram-positive bacteria form
membrane vesicles, but the mechanism behind that process is less
understood, although well documented.11,12
1.1 | Short historic perspective on data treatment
Bacterial cells have been analyzed using XPS for several decades using
freeze-dried or dehydrated samples to enable compatibility with high-
vacuum XPS systems.13,14 These analyses have provided useful bio-
chemical characterization of the cell envelope. The building blocks of
the bacterial cell envelope mainly consist of different types of carbon-
based substances, such as lipids, polysaccharides, proteins, and pepti-
doglycans, which are all contributing to the C 1s spectrum of a bacte-
rial sample. In order to estimate the surface composition based on
these substance groups, Rouxhet and Genet15 developed two equa-
tion systems based on (1) the elemental ratio of C, N, and O
(Equations 1a-1c) and (2) ratios between different components within
the C 1s spectrum (Equations 2a-2c).
Equations 1:
N=C½ �obs = 0:279 CPr=Cð Þ ð1aÞ
O=C½ �obs = 0:325 CPr=Cð Þ+0:833 CPS=Cð Þ ð1bÞ
C=C½ �obs = 1 = CPr=Cð Þ+ CPS=Cð Þ+ CHC=Cð Þ ð1cÞ
Equations 2:
C288:2=C½ �obs = 0:279 CPr=Cð Þ+ 0:167 CPS=Cð Þ ð2aÞ
C286:4=C½ �obs = 0:293 CPr=Cð Þ+ 0:833 CPS=Cð Þ ð2bÞ
C285:0=C½ �obs = 0:428 CPr=Cð Þ+1 CHC=Cð Þ ð2cÞ
where obs is observed, CPS is polysaccharide, CPr is prot-
ein/peptidoglycan, and CHC is hydrocarbon.
The first equation system (Equations 1a-1c) is not applicable for
biological cryo-XPS data, as O 1s spectra of frozen hydrated cells will
contain large amounts of water that is not well correlated to the sub-
stance composition of the bacterial cell. Therefore, in 2011, we devel-
oped a method using three mathematically derived components to fit
the C 1s spectra of bacteria in order to predict the amounts of lipid,
polysaccharide, and peptide (protein + peptidoglycan).6 These compo-
nents were constructed through the use of multivariate curve
resolution of 42 samples (35 Gram-negative Escherichia coli bacterial
samples with differences in cell envelope composition as well as seven
standards) where we found that three components could reproduce
99.7% of the variance observed in the dataset.6 These mathematical
components (here called spectral components) were later used to pre-
dict the surface composition of a set of Gram-positive bacterial sam-
ples, showing that cryo-XPS could be used to monitor changes in the
cell wall of Bacillus subtilis bacteria exposed to different growth envi-
ronments (changes in solution pH and metal content). The substance
composition obtained using this new method was, furthermore, com-
pared with the two equation systems showing that the two different
data treatment methods give similar albeit not identical results.5,16
However, for hydrated fast-frozen samples, only Equations 2a to 2c
and the model with spectral components are applicable.
For analysis of bacterial samples, cryo-XPS analyses are here
suggested as preferable to analysis of dried specimens as the fast-
frozen sample surface should maintain a structural arrangement more
similar to what would be encountered in a hydrated situation.5,17 The
removal of water during dehydration of bacterial samples may induce
cell rupture and/or reorganization of cell envelope constituents. This
hypothesis was previously supported by analyses performed on bacte-
rial samples that were first analyzed frozen and thereafter left to
slowly dehydrate in vacuum before a second analysis of the
dehydrated cell. In some samples (but not all) very large changes could
be observed in the carbon composition, suggesting increased amount
of lipid-like substances after dehydration.5
In this paper, we describe how we have applied the method of
cryo-XPS to different types of (hydrated and frozen) bacterial systems
and discuss sample preparation and data treatment.
2 | MATERIALS AND METHODS
Bacterial strains from the species Rahnella aquatilis, Pseudomonas flu-
orescens, Pseudomonas aeruginosa, and E. coli (Table 1) were individu-
ally defrosted from −80�C glycerol stocks and cultivated separately
on agar plates. All bacteria were cultivated on Luria-broth
(LB) medium except the river isolate R. aquatilis that was cultivated on
R2A medium, ie, a medium for microorganisms emulating nutrient-
poor fresh water.22 This strain was isolated from immersed plant
material in the Knivstån, Sweden (coordinates from Google: lat 59.72;
long 17.79) in June 2018 downstream from the outlet of a sewage
treatment plant (the strain was included here for its visibly large EPS
production).
For analyses of morphology by regular SEM, R. aquatilis colonies
grown on R2A agar plates were cut into small pieces and fixed with
2.5% glutaraldehyde in sodium cacodylate buffer and left overnight at
4�C. The samples were dehydrated in a series of graded ethanol (70%,
80%, 90%, 95%, and 100%) 10 minutes in each bath. Thereafter, the
samples were critical-point dried and coated with 5 nm iridium. Mor-
phology was analyzed by field-emission scanning electron microscopy
(SEM; Carl Zeiss Merlin) using secondary electron detector at acceler-
ating voltage of 5 kV and probe current of 120 pA. For cryo-SEM
2 HAGBERG ET AL.

analysis, colonies were deposited onto carbon adhesive tape mounted
on a copper holder. Samples were subsequently vitrified in liquid
nitrogen slush. Prior to imaging, the frozen sample was sublimated in
vacuum for up to 30 minutes at −90�C. Imaging was performed on a
Carl Zeiss Merlin field-emission cryogenic scanning electron micro-
scope (cryo-FESEM), fitted with a Quorum Technologies PP3000T
cryo preparation system. Images were collected at temperatures
below 193 K using secondary electron detector (ETD) at an accelerat-
ing voltage of 2 kV and probe current of 50 pA. For AFM imaging, a
bacterial colony from an agar plate was suspended in 100 μL miliQ
water. A volume of 10 μL of the suspension was immobilized on
freshly cleaved mica while gently drying in air. In a measurement
where EPS was removed, a colony from an agar plate was washed
twice in 1 mL miliQ water and centrifuged at 4000 RPM for 5 minutes
and the supernatant discarded. Thereafter, the bacterial pellet was
resuspended in 100 μL miliQ water and the bacteria were immobilized
on freshly cleaved mica as described above. AFM analysis was done in
a multimode 8 using with ScanAsyst (Bruker) in peak force tapping
mode in air.
Cryo-XPS analyses, data treatment, and sample pretreatment
were done according to previously published procedures.5,6,23 Ana-
lyses were performed on a Kratos Axis Ultra DLD electron spectrome-
ter using a monochromatic Al Kα source operated at 150 W. Spectra
were analyzed using a hybrid lens system with a magnetic lens. Angle
between the incident X-ray photon beam and analyzer was 57.4�,
photoelectron takeoff angle 90�, and collection angle of the analyzer
±15�. Maximum photoemission from sample was at 90�. The analysis
area was 0.3 × 0.7 mm (slot). An analyzer pass energy of 160 and
20 eV was used for survey spectra and high-resolution spectra,
respectively. The sample introduction chamber and analysis chamber
were both pre-cooled to liquid nitrogen temperature before sample
introduction and analysis, and were kept cold throughout the mea-
surement. Sample charging during measurements was compensated
using the built-in spectrometer charge-neutralizing system. The C 1s
hydrocarbon peak at 285.0 eV was thereafter used for calibration of
the binding energy scale. Chemical constituents giving rise to intensity
in the C 1s peak were predicted using three mathematical compo-
nents describing lipids, polysaccharides, and peptide (protein + peptido-
glycan), here called spectral components, ie, independently from
classical curve fitting of C 1s spectra using Gaussian–Lorentzian peak
shapes.6 For comparison, substance compositions were also calcu-
lated using Equations 2a to 2c after peak fitting using CasaXPS. Statis-
tics were calculated using the Student'sT test in Excel.
Adaptations in sample treatment for cryo-XPS measurements
were made for each of the five sample groups: bacterial cells from liq-
uid culture (1), culture plates (2 and 3), OMVs (4), and biofilms (5) as
described below. All samples were measured at least as two biological
replicates and all, except biofilms, were measured “fast-frozen”, ie,
were applied onto a sample holder at room temperature, frozen
instantaneously on the sample stage in the sample introduction cham-
ber of the spectrometer, and analyzed in hydrated frozen form, as pre-
viously described.17,23 The sample was maintained at liquid nitrogen
temperature throughout the analysis time, and the vacuum in the
analysis chamber carefully was monitored (generally 3–5 × 10⁻⁷ Pa).
Bacterial cells were analyzed both from liquid culture (1) and from cul-
ture plates (2 and 3). Culture plates were freshly streaked with bacte-
ria and incubated overnight at 37�C for E. coli or P. aeruginosa and for
2 days at room temperature (21�C) for R. aquatilis and P. fluorescens.
(1) For liquid cultures, one or a few colonies were taken from a culture
plate and inoculated into appropriate liquid medium. The culture was
grown overnight under shaking (for slowly growing R. aquatilis and
P. fluorescens 24 h). Thereafter, the suspension was centrifuged; the
pellet was washed using phosphate-buffered saline (PBS) and once
more centrifuged. A volume of �20 μL of the resulting pellet was used
for XPS analyses. For XPS analysis of bacterial cells grown in liquid
medium, this washing step is important so that C-containing sub-
stances from the growth medium are removed that else would end up
in XPS spectra. The washing was performed using a buffer in order to
maintain the same pH between all samples, as it has been shown that
the bacterial surface composition may be altered depending on pH.5
TABLE 1 Bacterial strains used for studies of planktonic cells, biofilms, and OMVs
Species Strain Ref Number Characteristic Reference
Study of Planktonic Cells From Different Cultivation Modes
R. aquatilis River isolate AH0123 EPS producer This study
P. fluorescens DSM50090 Reference strain
P. fluorescens CIP69.13 Reference strain
Study of Biofilms vs Planktonic Cells
P. aeruginosa PAO1 Reference strain 18
P. aeruginosa PAO1 ΔpelA Polysaccharide (pel A) mutant 19
P. aeruginosa PAO1 ΔpJN2133 Low c-di-GMP 20
P. aeruginosa PAO1 ΔwspF1 High c-di-GMP 20
Study of OMVs vs Planktonic Cells
E. coli BW25113 ΔflhD RN110 Flagella mutant 21
E. coli BW25113 ΔwaaL ΔflhD RN115 Double mutant in LPS and of flagella 6
HAGBERG ET AL. 3

PBS was chosen to avoid introducing any C-containing substance that
would “contaminate” the C 1s spectrum. (2) Bacteria analyzed directly
from plates were collected from freshly cultivated plates using a loop
and the collected biomass was directly applied onto the sample holder
or (3) suspended in 2 mL PBS, vortexed, centrifuged, and the washed
pellet used for XPS analyses. OMVs (4) were isolated from bacterial
cultures using previously described methods.21,24 Bacterial strains
without flagella were chosen to avoid having parts of broken flagella
in the OMV preparation. The OMVs were suspended into PBS. Before
analysis, this suspension was centrifuged and 20 μL of the pellet was
transferred to the sample holder for XPS analysis. For samples where
the vesicle pellet was too small to transfer from the test tube to the
sample holder, the pellet was resuspended in a small volume of PBS,
and a 20 μL drop of this vesicle-containing PBS solution was instead
placed on a precooled sample holder inside the sample introduction
chamber where it immediately froze (this latter procedure was used
for the OMVs from ΔflhD). Biofilms (5) were cultivated on small glass
cover slides by immersing glass slides sterilized for 30 minutes in 70%
ethanol into LB culture medium and adding an aliquot of bacteria
(0.5 × 10⁶ cells/mL), thereafter incubating (static) for 12 or 15 hours
at 37�C in 24-well plates (with cavities of appropriate size to contain
the glass slides). The following day, the slides covered with biofilm
were very gently rinsed in 0.9% NaCl and thereafter frozen and stored
at −80�C. Freezing samples to −80�C directly after preparation
enabled several samples to be prepared in parallel using identical con-
ditions and thereafter conserved, for subsequent cryo-XPS analyses.
On the day of analysis, the frozen sample was brought to the XPS in a
sterile Petri dish on dry ice. A piece of the biofilm-covered glass was
placed, still frozen, onto a sample holder precooled with liquid nitro-
gen. Thereafter, the sample holder was inserted into the analysis
chamber as soon as possible (to limit water condensation on the cold
metal). To take into account any spatial heterogeneities, three points
were analyzed on each biofilm sample. After each analysis, sample and
sample holder were sonicated in ethanol twice to clean, sterilize, and
avoid sample contamination or carry-over.
3 | RESULTS AND DISCUSSION
3.1 | Planktonic cells
Bacterial cells grown in liquid culture or on a solid nutrient agar are
sometimes both considered as planktonic cells, and may therefore dis-
play similar surface composition.25 Consequently, XPS spectra of
these two growth-forms may be similar, unless secretion of extracellu-
lar substances have taken place. To investigate this, we analyzed bac-
teria grown on culture plates and in liquid culture. We analyzed two
different bacterial species: P. fluorescens (two reference strains
DSM50090 and CIP69.13) and a Swedish river isolate (AH0123) of
the species R. aquatilis. This river isolate was included as we observed
that it produced very large quantities of EPS that was clearly visible
by eye on culture plates as well as in liquid culture. This species is also
known to have production of organic acids as well as extracellular
polysaccharides of interest to industrial applications.26–28 In cryo-
SEM images, the secreted EPS is clearly observed as a layer in which
the cells are dispersed (Figure 1A,B). Using regular SEM, the EPS layer
dehydrates, collapses, and forms peculiar features (Figure 1C,D). AFM
analyses showed that the EPS observed to cover the cells in the SEM
analyses was removed to a large extent by washing, uncovering
smooth rod-shaped bacteria with flagella (Figure 1E,F).
Cryo-XPS analyses of planktonic cells of R. aquatilis showed dif-
ferences in C 1s spectra between replicates of nonwashed bacteria,
giving rise to large error bars in Figure 2. We hypothesize that these
differences result from sample variations in the ratio of EPS to bacte-
ria, which is very difficult to control during sample transfer from the
culture plate. Visual inspection of the culture plates showed individual
colonies surrounded by large amounts of highly hydrated EPS. Bacte-
ria grown in liquid culture (always washed) and the bacteria cultivated
on plates and thereafter washed had similar surface compositions
(Figure 2). AFM imaging of cells before and after wash (Figure 1E,F)
indicates at least partial removal of EPS during washing. The differ-
ences observed between nonwashed and washed cells seemed to
mainly involve the peptide and lipid components suggesting that the
contents of these substances differ between cells and EPS. The
washed cells appeared to display larger percentages of peptide, which
may indicate an EPS with relatively high percentage of polysaccharide
and lipid-like substances compared with the bacterial cell, in line with
previous reports.26
The two strains of P. fluorescens (DSM50090 and CIP69.13) were
significantly different in surface composition from each other
(p < 0.01). Neither of them appeared to form large quantities of EPS
by visual inspection of culture plates. Thus, the same chemical surface
composition was obtained between bacteria grown in liquid culture
and on culture plate or between washed and not washed cells
(Figure 2 and Table 2). As an example, the DSM50090 strain analyzed
directly from plate gave a composition of 67 ± 3% peptide, 7 ± 2%
lipid, and 26 ± 2% polysaccharide, whereas the rinsed showed
65 ± 4% peptide, 9 ± 2% lipid, and 26 ± 2% polysaccharide.
3.2 | Hydrophobicity
Hydrophobicity of the bacterial cell surface can be assumed to origi-
nate from nonpolar hydrocarbon functionalities in different types of
macromolecules that build up the cell envelope. We previously com-
pared data from cryo-XPS C 1s spectra to results from the traditional
MATH assay (representing a partitioning of cells between an aqueous
phase and an organic phase; Figure 3) for a range of planktonic bacte-
rial cells grown on culture plates (E. coli lipopolysaccharide mutants).21
This comparison showed that the ratio between nonpolar C (with
bonds to other C and/or H) and total carbon in C 1s spectra follow
the same trend as data obtained from the MATH assay for all strains
except one (RN106).21
Based on the results from the XPS analyses, the planktonic strains
mentioned in this article increase in hydrophobicity in the order: River iso-
late R. aquatilis ≤ P. fluorescens (DSM50090) < ΔpJN2133 < P. fluorescens
4 HAGBERG ET AL.

(CIP69.13) < ΔpelA = ΔwspF < PAO1 (Table 3). This comparison indicates
that the first two strains were more hydrophilic than the previously
described E. coli strains, whereas the PAO1 strains would be of similar
hydrophobicity as the E. coli strains reported by Nakao et al.21
3.3 | Bacterial biofilms
To study how differences in EPS influence XPS data of biofilms, we
selected four different strains from P. aeruginosa, ie, the lab strain
PAO1 (wild type, here labeled PAO1) and three mutants of PAO1 that
were expected to have differences in EPS secretion. The ΔpelA mutant
is deficient in the synthesis of an EPS polysaccharide involved in bio-
film formation for nonmucoid strains (ie, does also not produce algi-
nate) of P. aerugionsa.19,29 The remaining two mutants were chosen as
they express low (ΔpJN2133) or high (ΔwspF) levels of a signaling mol-
ecule (c-di-GMP) known to influence many pathways in the bacterial
cell including EPS secretion as well as biofilm formation.20 In order to
differentiate between the signal from the bacterial cell and EPS, we
compared biofilm data to data from planktonic cells grown on culture
plates. A significant difference (p < 0.05) in peptide and lipid
F IGURE 2 Surface composition as predicted from cryo-XPS C 1sspectra of bacteria grown on nutrient agar (pl) as well as in liquidbroth (liq). Cells in liquid broth were always rinsed with phosphatebuffered saline. Samples from plates were measured both washed(pl w) and nonwashed (pl). Pf = P. fluorescens, Ra = R. aquatilis. Eachbar represent at least two biological replicates (n = 2–5). Data frommodel with spectral components
F IGURE 1 R. aquatilis imagedusing cryo-SEM (A and B), regularSEM (C and D), and atomic forcemicroscopy (AFM) (E and F). Scalebars represent 2 μm in A, C, D,and F, as well as 1 μm in B andD. AFM imaging of R. aquatilis(E) before and (F) after washing.AFM images show that
extracellular polymericsubstances observed in SEM isremoved to a large extent bywashing to uncover rod-shapedcells with flagella. (The clusteringof cells in AFM images is mostlikely a consequence ofcentrifugation being part of thewashing procedure.)
HAGBERG ET AL. 5

concentration was observed for three of the strains between the bio-
films and the planktonic cells, ie, PAO1, ΔpelA, and ΔwspF (Figure 4
and Table 2). However, the difference was less significant for the
ΔpJN2133 strain. No significant difference between data points after
12 and 15 h of growth was observed except for ΔpelA. Neither did
the thickness of the biofilms (as reflected in signal form the glass sub-
strate, ie, Si 2p) appear to change significantly (p > 0.2 for all samples)
between 12 and 15 h. The difference observed between planktonic
cells and biofilms are interpreted as caused by increased EPS produc-
tion in the biofilm compared with in growth on culture plates. The
ΔpJN2133 strain has been reported to have low c-di-GMP and be a
weak biofilm former, which could explain the closer resemblance
between biofilms and planktonic cells for this strain.20 The peptide
component appears to be dominating at the biofilm surface whereas
the amount of lipid-like substances is higher for cells grown on culture
plates. Future studies, for example, using confocal microscopy and
staining may explain these observed compositional changes at the sur-
face of biofilms.
3.4 | Bacterial outer-membrane vesicles
Small membrane structures such as OMVs can be analyzed with cryo-
XPS and their composition compared with that of their parent strain.
To this aim, we analyzed OMVs and parent bacteria from two E. coli
strains.21 In Figure 5, it can clearly be seen that the OMVs consist of
relatively higher amounts of lipids (p < 0.05) for both strains. The
ΔflhD ΔwaaL OMVs also showed reduced peptide content, which may
represent a reduction in protein and/or peptidoglycan. This may either
represent a reduction in outer membrane proteins caused by some
TABLE 2 Statistical comparisons between sample groups and p-values from the students T test
Sample Peptide Lipid Polysaccharide
R. aquatilis a
pl vs pl w 0.115 0.121 0.364
pl vs liq 0.062 0.106 0.250
pl w vs liq 0.945 0.960 0.892
P. fluorescens (DSM50090)a
pl vs pl w 0.574 0.261 0.873
pl vs liq 0.966 0.233 0.346
liq vs pl w 0.745 0.639 0.356
P. fluorescens (CIP69.13)a
pl vs pl w 0.233 0.247 0.661
pl vs liq 0.056 0.022 0.363
liq vs pl w 0.156 0.126 0.676
Strain comparison
DSM50090 vs CIP69.13 0.000 0.000 0.003
DSM50090 vs R. aquatilis 0.015 0.440 0.000
CIP69.13 vs R. aquatilis 0.661 0.021 0.000
Biofilms after 12 h vs 15 h
PAO1 0.408 0.180 0.133
ΔpelA 0.005 0.021 0.969
ΔpJN2133 0.898 0.552 0.157
ΔwspF 0.094 0.180 0.050
15 h biofilm vs planktonic
PAO1 0.001 0.003 0.163
ΔpelA 0.001 0.003 0.075
ΔpJN2133 0.059 0.077 0.044
ΔwspF 0.001 0.001 0.286
12 h biofilm vs planktonic
PAO1 0.005 0.031 0.005
ΔpelA 0.001 0.002 0.013
ΔpJN2133 0.136 0.070 0.660
ΔwspF 0.042 0.025 0.126
aBacteria grown in liquid broth (liq), on culture plates (pl), bacteria on culture plate that were subsequently washed (pl w).
6 HAGBERG ET AL.

sorting mechanisms during vesicle budding or that the budding leaves
behind some of the peptidoglycan layer that is probed when the
entire cell is analyzed.6,10 It is worth noting, though, that peptidogly-
can has been detected inside OMVs in some bacteria.30 Previous
work have shown that in order to separate the contribution of protein
and peptidoglycan, XPS analyses can be combined with separate pro-
tein quantification using the Bradford assay.30,31 These data suggest
that cryo-XPS may be used as a tool to study compositional changes
between the cell membrane and vesicles during vesicle genesis.
4 | COMPARISON BETWEEN DATA-TREATMENT METHODS
Decomposition of C 1s spectra from cryo-XPS analyses of fast-frozen
bacterial systems can be performed using either Equation 2a to 2c,
F IGURE 3 Comparison of surface hydrophobicity using(A) partitioning of cells between hexadecane and water (MATH assay)and (B) ratio of nonpolar carbon to total carbon, for eight strains ofEscherichia coli. The black bar represents wild-type BW25113, and thecolored bars represent different mutants in the lipopolysaccharidesynthesis. Copyright 2012 Nakao et al21 reprinted under CreativeCommons Attribution License
TABLE 3 Percentage of nonpolar C of total C in C1s of XPS spectra of planktonic bacterial strains
Species Strain % Nonpolar C of Total C Standard Deviation (Number of Replicates)
R. aquatilis AH0123 33 4 (9)
P. fluorescens DSM50090 37 2 (11)
P. fluorescens CIP69.13 45 2 (8)
P. aeruginosa PAO1 ΔpJN2133 43 1 (2)
P. aeruginosa PAO1 ΔpelA 53 2 (2)
P. aeruginosa PAO1 ΔwspF 53 0.4 (2)
P. aeruginosa PAO1 55 2 (2)
F IGURE 4 Average constituent concentration for the surface ofbiofilms grown for 12 and 15 h (average of six points distributed ontwo biological replicates (12 and 15 h), n = 6) as well as planktoniccells (from culture plates, two biological replicates, n = 2) for fourP. aeruginosa strains. The prediction is based on fitting the C 1s peakusing three spectral components representing peptide (protein andpeptidoglycan), lipid, and polysaccharide6
F IGURE 5 Average constituent concentration based on C 1sspectra from E. coli bacteria and outer-membrane vesicles (OMVs).Significant difference between parent strain (p < 0.05) and OMV was
found only for the lipid and polysaccharide component in the ΔflhDmutant and for the peptide and lipid components for the ΔflhD ΔwaaLdouble mutant shown above (n = 3 for both ΔflhD samples, n = 2 forboth ΔflhD ΔwaaL samples). Data from model with spectralcomponents
HAGBERG ET AL. 7
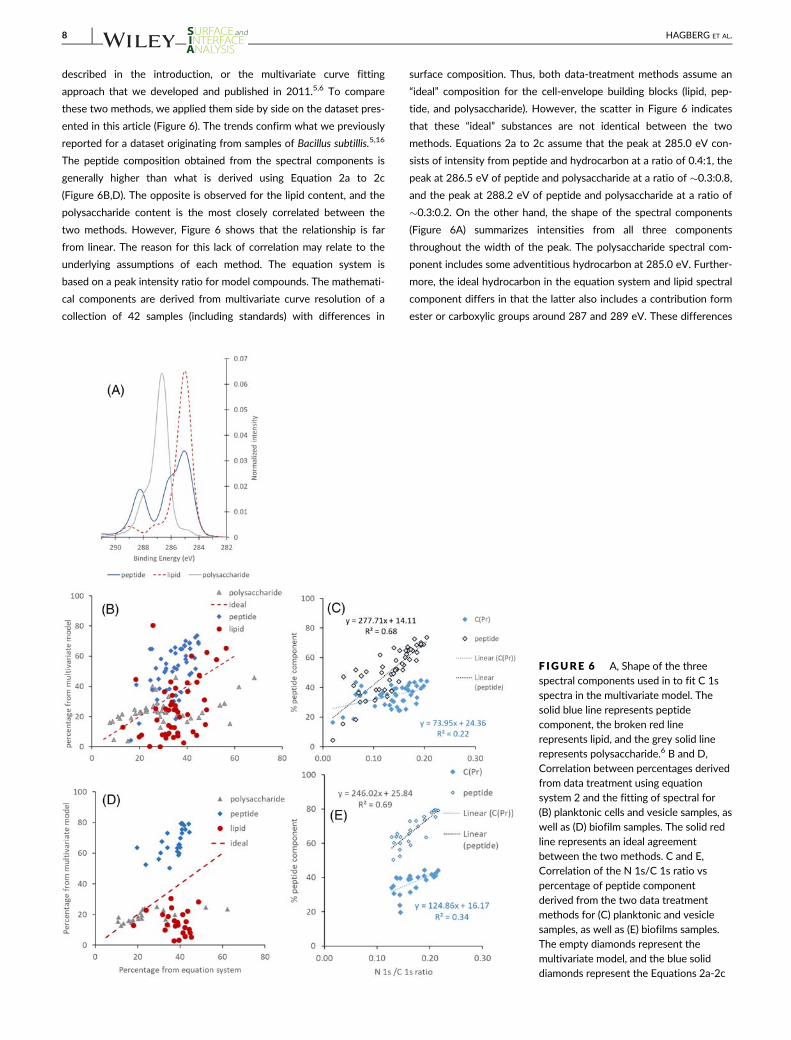
described in the introduction, or the multivariate curve fitting
approach that we developed and published in 2011.5,6 To compare
these two methods, we applied them side by side on the dataset pres-
ented in this article (Figure 6). The trends confirm what we previously
reported for a dataset originating from samples of Bacillus subtillis.5,16
The peptide composition obtained from the spectral components is
generally higher than what is derived using Equation 2a to 2c
(Figure 6B,D). The opposite is observed for the lipid content, and the
polysaccharide content is the most closely correlated between the
two methods. However, Figure 6 shows that the relationship is far
from linear. The reason for this lack of correlation may relate to the
underlying assumptions of each method. The equation system is
based on a peak intensity ratio for model compounds. The mathemati-
cal components are derived from multivariate curve resolution of a
collection of 42 samples (including standards) with differences in
surface composition. Thus, both data-treatment methods assume an
“ideal” composition for the cell-envelope building blocks (lipid, pep-
tide, and polysaccharide). However, the scatter in Figure 6 indicates
that these “ideal” substances are not identical between the two
methods. Equations 2a to 2c assume that the peak at 285.0 eV con-
sists of intensity from peptide and hydrocarbon at a ratio of 0.4:1, the
peak at 286.5 eV of peptide and polysaccharide at a ratio of �0.3:0.8,
and the peak at 288.2 eV of peptide and polysaccharide at a ratio of
�0.3:0.2. On the other hand, the shape of the spectral components
(Figure 6A) summarizes intensities from all three components
throughout the width of the peak. The polysaccharide spectral com-
ponent includes some adventitious hydrocarbon at 285.0 eV. Further-
more, the ideal hydrocarbon in the equation system and lipid spectral
component differs in that the latter also includes a contribution form
ester or carboxylic groups around 287 and 289 eV. These differences
F IGURE 6 A, Shape of the threespectral components used in to fit C 1sspectra in the multivariate model. Thesolid blue line represents peptidecomponent, the broken red linerepresents lipid, and the grey solid linerepresents polysaccharide.6 B and D,Correlation between percentages derivedfrom data treatment using equationsystem 2 and the fitting of spectral for(B) planktonic cells and vesicle samples, aswell as (D) biofilm samples. The solid redline represents an ideal agreementbetween the two methods. C and E,Correlation of the N 1s/C 1s ratio vs
percentage of peptide componentderived from the two data treatmentmethods for (C) planktonic and vesiclesamples, as well as (E) biofilms samples.The empty diamonds represent themultivariate model, and the blue soliddiamonds represent the Equations 2a-2c
8 HAGBERG ET AL.

probably can account for some of the nonlinear correlation observed
between these two data-treatment methods. The higher peptide con-
tent that is generally obtained using the spectral components may be
due to carbon atoms with a neighboring N being more readily cap-
tured using the spectral components, than they would be from fitting
the C 1s spectrum with single Gaussian-Lorentzian peaks at 285.0
and 286.5 eV and thereafter using Equations 2a to 2c. Due to the
large overlap of the peptide and lipid components in both data-
treatment method, it is not surprising that as the relative content of
peptide increases, the lipid component decreases. The spectral pep-
tide component has previously been shown to correlate well with the
N content of the sample surface, and it was suggested that this could
be used as an “independent” validation of the peptide composition at
the surface.6 Also, in this dataset, we observe that the content of N
(represented by the N1s/C1s ratio) correlates to peptide content from
both data-treatment methods. However, the peptide data seem to
spread over a larger range giving rise to a more steep slope and the
obtained R2 was found to be higher for the method using spectral
components (R2 = 0.68 or 0.69 vs R2 = 0.22 or 0.34 for planktonic and
vesicle, or biofilm samples) than for Equations 2a to 2c (Figure 6C,E).
The fact that these two data treatment methods assume slightly dif-
ferent “ideal” building blocks suggests that they are complementary
but not directly comparable. In some bacterial systems, a number of
substances may be present at the surface of the sample that are far
from the ideal building blocks used in the two models, for example,
extracellular DNA. These are not estimated in any of the models but
may influence the obtained percentages from the two models differ-
ently. In this current dataset, we did not observe differences between
the correlation data from biofilms and planktonic cells (Figure 6).
However, this may well be the case for other systems. Thus, it may be
advisable to use both data treatment methods in combination.
5 | CONCLUSIONS
Cryo-XPS can successfully be used to study the surface chemistry of a
range of bacterial systems using a similar methodological approach.
We have shown that the C 1s spectrum can give a measure of the
hydrophobicity of the bacterial cell surface, as well as information
about surface composition of lipids, polysaccharides, and peptides
(protein and/or peptidoglycan). From the methodological perspective,
we observed that bacterial cells grown in liquid medium and on cul-
ture plates give rise to similar chemical composition, unless strains
produce large amounts of EPS. Differences in surface composition
were observed between planktonic cells, OMVs, and biofilms, show-
ing that cryo-XPS can be a valuable tool to investigate, eg, production
of EPS from bacterial cells, the composition of biofilm matrix in differ-
ent types of biofilm, and membrane processes connected to OMV for-
mation. Furthermore, we compared two published data treatment
methods applicable to cryo-XPS data. We conclude that they are not
correlated but give roughly similar estimates of surface composition.
In general, the obtained polysaccharide content corresponded fairly
well between the data-treatment methods, but the peptide content
was higher when using spectral components than when using Equa-
tions 2a to 2c. The opposite was found for the lipid content. Indepen-
dent validation using the N 1s/C 1s ratio and the peptide component
suggests a higher correlation with the spectral components compared
with Equations 2a to 2c. However, the two methods are complemen-
tary and depending on research question one may be preferred over
the other.
Cryo-XPS is a powerful method to study surface compositional
changes of biological systems as it maintains water within the cell
structure. This fast-frozen water plays an important role to preserve
the structural organization of the bacterial sample enabling analyses
at conditions more close to what is observed in ambient conditions.5
Recently, near-ambient pressure–XPS has been applied to bacterial
cells.32 We hypothesize that this method and cryo-XPS should give
comparable data. However, to investigate this, future work should be
undertaken to show to what extent data from cryo-XPS and NAP-XPS
overlap.
ACKNOWLEDGEMENTS
The authors would like to acknowledge the Kempe Foundation (JCK-
1720) and Formas (2017-00403) for funding parts of this study.
Fabienne Quilés at LCPME in Nancy, France, and Marit Kjaervik at
BAM in Berlin, Germany, are acknowledged for generously providing
P. fluorescens strains. PAO1 mutants were generously provided by
Caroline Harwoods lab, University of Washington, USA. Bernt Eric
Uhlin generously provided the E. coli strains. Ryoma Nakao, National
Institute of Infectious Disease, Tokyo, Japan, Sun Nyunt Wai and
Bernt Eric Uhlin, Umeå University, Sweden, are greatly acknowledged
for the initial cryo-XPS collaborations including a large library of E. coli
mutants as well as fruitful discussions throughout the years. We are
grateful to the anonymous reviewers for insightful comments helping
us to improve the manuscript. The National Microscopy Infrastruc-
ture, NMI (VR-RFI 2016-00968), and Nikki Lee is acknowledged for
SEM analyses. XPS analyses were performed at the XPS platform at
Umeå University, Sweden.
ORCID
Olena Rzhepishevska https://orcid.org/0000-0002-7912-7447
Anastasiia Semenets https://orcid.org/0000-0002-6223-9506
David A. Cisneros https://orcid.org/0000-0001-9919-0075
Madeleine Ramstedt https://orcid.org/0000-0003-2646-8501
REFERENCES
1. Berne C, Ellison CK, Ducret A, Brun YV. Bacterial adhesion at the
single-cell level. Nat Rev Microbiol. 2018;16(10):616-627.
2. Karatan E, Watnick P. Signals, regulatory networks, and materials that
build and break bacterial biofilms. In. Microbiol Mol Biol Rev. 2009;73.
United States(2):310-347.
3. Moriarty T, Poulsson A, Rochford ETJ, Richards RG. Bacterial adhe-
sion and biomaterial surfaces. In: Ducheyne P, ed. Comprehensive Bio-
materials. 1st ed. Vol.4 Amsterdam, Netherlands: Elsevier Science;
2011:75-100.
4. Ploux L, Ponche A, Anselme K. Bacteria/material interfaces: role of
the material and cell wall properties. J Adhes Sci Technol. 2010;24
(13–14):2165-2201.
HAGBERG ET AL. 9

5. Ramstedt M, Leone L, Persson P, Shchukarev A. Cell wall composition
of Bacillus subtilis changes as a function of pH and Zn2+ exposure:
insights from cryo-XPS measurements. Langmuir. 2014;30(15):4367-
4374.
6. Ramstedt M, Nakao R, Wai S, Uhlin B, Boily J. Monitoring surface
chemical changes in the bacterial cell wall—multivariate analysis of
cryo-X-ray photoelectron spectroscopy data. J Biol Chem. 2011;286
(14):12389-12396.
7. Flemming H-C, Wingender J, Szewzyk U, Steinberg P, Rice SA,
Kjelleberg S. Biofilms: an emergent form of bacterial life. Nat Rev
Microbiol. 2016;14(9):563-575.
8. Hall-Stoodley L, Costerton JW, Stoodley P. Bacterial biofilms: from
the natural environment to infectious diseases. Nat Rev Microbiol.
2004;2(2):95-108.
9. Jeanson S, Floury J, Gagnaire V, Lortal S, Thierry A. Bacterial colonies
in solid media and foods: a review on their growth and interactions
with the micro-environment. Front Microbiol. 2015;6:1284-1284.
10. Schwechheimer C, Kuehn MJ. Outer-membrane vesicles from Gram-
negative bacteria: biogenesis and functions. Nat Rev Microbiol. 2015;
13(10):605-619.
11. Kim JH, Lee J, Park J, Gho YS. Gram-negative and Gram-positive bac-
terial extracellular vesicles. Semin Cell Dev Biol. 2015;40:97-104.
12. Liu Y, Defourny KAY, Smid EJ, Abee T. Gram-positive bacterial extra-
cellular vesicles and their impact on health and disease. Front
Microbiol. 2018;9:1502. https://doi.org/10.3389/fmicb.2018.01502
13. Millard MM, Scherrer R, Thomas RS. Surface analysis and depth pro-
file composition of bacterial cells by x-ray photoelectron spectros-
copy and oxygen plasma etching. Biochem Biophys Res Commun.
1976;72(3):1209-1217.
14. van der Mei H, de Vries J, Busscher H. X-ray photoelectron spectros-
copy for the study of microbial cell surfaces. Surf Sci Rep. 2000;39(1):
3-24.
15. Rouxhet P, Genet M. XPS analysis of bio-organic systems. Surf Inter-
face Anal. 2011;43(12):1453-1470.
16. Ramstedt M, Leone L, Shchukarev A. Bacterial surfaces in
geochemistry—How can X-ray photoelectron spectroscopy help? In:
Alessi DS, Veeramani H, Kenney JPL, eds. Analytical Geomicrobiology:
A Handbook of Instrumental Techniques. Cambridge: Cambridge Uni-
versity Press; 2019:262-287.
17. Shchukarev A, Ramstedt M. Cryo-XPS: probing intact interfaces in
nature and life. Surf Interface Anal. 2017;49(4):349-356.
18. Güvener ZT, Harwood CS. Subcellular location characteristics of the
Pseudomonas aeruginosa GGDEF protein, WspR, indicate that it pro-
duces cyclic-di-GMP in response to growth on surfaces. Mol
Microbiol. 2007;66(6):1459-1473.
19. Starkey M, Hickman JH, Ma L, et al. Pseudomonas aeruginosa Rugose
small-Colony variants have adaptations that likely promote persis-
tence in the cystic fibrosis lung. J Bacteriol. 2009;191(11):3492-3503.
20. Hickman JW, Tifrea DF, Harwood CS. A chemosensory system that
regulates biofilm formation through modulation of cyclic diguanylate
levels. Proc Natl Acad Sci U S A. 2005;102(40):14422-14427.
21. Nakao R, Ramstedt M, Wai SN, Uhlin BE. Enhanced biofilm formation
by Escherichia coli LPS mutants defective in Hep biosynthesis. PLoS
ONE. 2012;7. United States(12):e51241. https://doi.irg/10.1371/
journal.pone.0051241
22. Reasoner DJ, Geldreich EE. A new medium for the enumeration and
subculture of bacteria from potable water. Appl Environ Microbiol.
1985;49(1):1-7.
23. Ramstedt M, Shchukarev A. Analysis of bacterial cell surface chemical
composition using cryogenic X-ray photoelectron spectroscopy. In:
Hong H-J, ed. Bacterial Cell Wall Homeostasis: Methods and Protocols.
New York, NY: Springer New York; 2016:215-223.
24. Wai SN, Takade A, Amako K, The release of outermembrane vesicles
from the strains of enterotoxigenic Escherichia coli. Microbiol.
Immunol. 1995;3:451-456.
25. Mikkelsen H, Duck Z, Lilley KS, Welch M. Interrelationships between
colonies, biofilms, and planktonic cells of Pseudomonas aeruginosa.
J Bacteriol. 2007;189(6):2411-2416.
26. Pintado ME, Pintado AIE, Malcata FX. Production of polysaccharide
by Rahnella aquatilis with whey feedstock. J Food Sci. 1999;64(2):
348-352.
27. Vyas P, Joshi R, Sharma K, Rahi P, Gulati A, Gulati A. Cold-adapted
and Rhizosphere-competent strain of Rahnella sp. with broad-
spectrum plant growth-promotion potential. J Microbiol Biotechnol.
2010;20(12):1724-1734.
28. Kim KY, Jordan D, Krishnan HB. Expression of genes from Rahnella
aquatilis that are necessary for mineral phosphate solubilization in
Escherichia coli. FEMS Microbiol Lett. 1998;159(1):121-127.
29. Colvin KM, Irie Y, Tart CS, et al. The Pel and Psl polysaccharides pro-
vide Pseudomonas aeruginosa structural redundancy within the biofilm
matrix. Environ Microbiol. 2012;14(8):1913-1928.
30. Bielig H, Rompikuntal P, Dongre M, et al. NOD-like receptor activa-
tion by outer membrane vesicles from Vibrio cholerae non-O1 non-
O139 strains is modulated by the quorum-sensing regulator HapR.
Infect Immun. 2011;79(4):1418-1427.
31. Bradford MM. A rapid and sensitive method for the quantitation of
microgram quantities of protein utilizing the principle of protein-dye
binding. Anal Biochem. 1976;72(1):248-254.
32. Kjærvik M, Schwibbert K, Dietrich P, Thissen A, Unger WES. Surface
characterisation of Escherichia coli under various conditions by near-
ambient pressure XPS. Surf Interface Anal. 2018;50(11):996-1000.
How to cite this article: Hagberg A, Rzhepishevska O,
Semenets A, Cisneros DA, Ramstedt M. Surface analysis of
bacterial systems using cryo-X-ray photoelectron
spectroscopy. Surf Interface Anal. 2020;1–10. https://doi.org/
10.1002/sia.6854
10 HAGBERG ET AL.