surface adsorption and phase separation of oppositely charged polyion−surfactant ion complexes: 3....
TRANSCRIPT

DOI: 10.1021/la1003353 9357Langmuir 2010, 26(12), 9357–9367 Published on Web 03/24/2010
pubs.acs.org/Langmuir
© 2010 American Chemical Society
Surface Adsorption and Phase Separation of Oppositely Charged
Polyion-Surfactant Ion Complexes: 3. Effects of Polyion Hydrophobicity
Olga Santos,*,† Eric S. Johnson,‡ Tommy Nylander,† Rajan K. Panandiker,§ Mark R. Sivik,§
and Lennart Piculell†
†Division of Physical Chemistry 1, Center for Chemistry and Chemical Engineering, Lund University, POB 124,SE-221 00 Lund, Sweden, ‡P&G Beauty & Grooming, Sharon Woods Technical Center, 11511 Reed HartmanHighway, Cincinnati, Ohio 45241-2422, and §Procter & Gamble Company, Miami Valley Innovation Center,
11810 East Miami River Road, Cincinnati, Ohio 45253-8707
Received January 24, 2010. Revised Manuscript Received March 15, 2010
The adsorption to hydrophilic silica surfaces in relation to the bulk phase behavior was investigated by in situ nullellipsometry and bulk turbidity measurements for four cationic copolymers of varying hydrophobicity in mixtures withanionic surfactant sodium dodecylsulfate (SDS). The purpose was to reveal the effect of polyion hydrophobicity on theassociation with surfactant at surfaces and in the bulk. All polyelectrolytes contained 20 wt % cationic units and hadsimilar molecular weights. An increase in surfactant concentration by the stepwise addition of SDS to a dilutepolyelectrolyte solution led to an increase in both the adsorbed amount and bulk turbidity, starting at a defined SDSconcentration, as a result of the formation of insoluble polyion-surfactant ion complexes. At some higher SDSconcentration, the formed aggregates started to redissolve gradually in the bulk and desorb from the surface because ofthe overcharging of the complexes. The SDS concentration at which the maxima in adsorption and turbidity occurredincreased with decreasing polyion hydrophobicity; the more hydrophobic polyions bound excess SDSmore readily, andthe aggregates therefore redissolved at a lower SDS concentration. The adsorption frompolyelectrolyte-SDS solutions,premixed at SDS concentrations above the adsorption maximum, which occurred on diluting the solution by “rinsing”the ellipsometer cuvette with 1 mM NaCl, was also investigated. On dilution, both the turbidity and the adsorbedamount increased as the excess surfactant in the polyion-surfactant ion complexes progressively decreased. Moreefficient deposition was achieved if the initial SDS concentration was close to the adsorption maximum. The lattersituation could be achieved either by adjusting the SDS concentration or, at a fixed SDS concentration, by choosing apolyion with the appropriate hydrophobicity.
I. Introduction
The interaction of ionic surfactants with oppositely chargedpolymers typically gives rise to an associative phase separationwhere a concentrated precipitate (solid) or a coacervate (liquid) ofsurfactant-polymer complexes separates out from a dilute solu-tion. The details of the phase separation depend on parameterssuch as the molecular weight, flexibility, charge density, andhydrophobicity of the polyion and on the self-assembly of thesurfactant ion.1-3 For many but not all polyion-surfactant ionpairs, a further increase in the surfactant concentration eventuallyleads to a second cooperative binding step at a second criticalassociation concentration, cac(2), and a concomitant redissolu-tion of the complexes.4 The present study focuses on the con-sequences of the hydrophobic interaction between the polyionand the surfactant, which is thought to be essential for the secondcooperative binding step at cac(2).4
In common applied formulations such as hair-care products,fabric detergents, and pharmaceutical products, associating mix-
tures of cationic polymers and anionic surfactants are essentialingredients.5-7 The deposition of the complexes formed by suchoppositely charged pairs at the solid-liquid interface plays a keyrole in these applications, and a close correlation between bulkassociation/phase separation and efficient surface deposition istypically assumed. Indeed, such a correlation is implied by theexperimental findings.8,9 However, a number of issues that areimportant both fundamentally and in applications remain to beresolved regarding the deposition of polyion-surfactant ioncomplexes at surfaces. These include a molecular understandingof the quantitative aspects of deposition, such as optimizing theamount of deposited material and the mixing range where thematerial deposits. Another challenging issue concerns the typicalobservation of history-dependent nonequilibrium depositionprocesses.10-19 Moreover, the interactions between polyions
*Corresponding author. Present address: Biomedical Laboratory Science& Biomedical Technology, Faculty ofHealth and Society,Malm€oUniversity,Malm€o SE- 205 06, Sweden. E-mail: [email protected].(1) Thalberg, K.; Lindman, B. Polymer-Surfactant Interactions: Recent Deve-
lopments. In Interactions of Surfactants with Polymers and Proteins; Goddard,E. D.,Ananthapadmanabhan, K. P., Eds.; CRC Press: Boca Raton, FL, 1993; p 203.(2) Langevin, D. Adv. Colloid Interface Sci. 2009, 147-148, 170–177.(3) Claesson, P. M.; Dedinaite, A.; Meszaros, R.; Varga, I. In Colloid Stability
and Application in Pharmacy; Colloids and Interface Science Series; Tadros,T. F., Ed.;Wiley-VCH: Weinheim, Germany, 2007; Vol. 3, pp 337-395.(4) Lynch, I.; Sjostrom, J.; Piculell, L. J. Phys. Chem. B 2005, 109, 4258–4262.
(5) Marchioretto, S.; Blakely, J. SOFW J. 1997, 123, 811–818.(6) Rodrıguez, R.; Alvarez-Lorenzo, C.; Concheiro, A.Eur. J. Pharm. Sci. 2003,
20, 429–438.(7) Bronich, T. K.; Nehls, A.; Eisenberg, A.; Kabanov, V. A.; Kabanov, A. V.
Colloids Surf., B 1999, 16, 243–251.(8) Piculell, L.; Guillemet, F.; Thuresson, K.; Shubin, V.; Ericsson, O. Adv.
Colloid Interface Sci. 1996, 63, 1–21.(9) Anthony, O.; Marques, C. M.; Richetti, P. Langmuir 1998, 14, 6086–6095.(10) Dedinaite, A.; Claesson, P. M.; Bergstrom, M. Langmuir 2000, 16(), 5257–
5266.(11) Shubin, V. Langmuir 1994, 10, 1093–1100.(12) Terada, E.; Samoshina, Y.; Nylander, T.; Lindman, B. Langmuir 2004, 20,
1753–1762.(13) Terada, E.; Samoshina, Y.; Nylander, T.; Lindman, B. Langmuir 2004, 20,
6692–6701.(14) Rojas, O. J.; Claesson, P. M.; Berglund, K. D.; Tilton, R. D. Langmuir
2004, 20, 3221–3230.
9358 DOI: 10.1021/la1003353 Langmuir 2010, 26(12), 9357–9367
Article Santos et al.
and surfactant ions at interfaces are controlled not only by theconditions of the bulk solution (pH, ionic strength, temperature,etc.) but also by the properties of the surface such as its surfacecharge density and hydrophobicity.10,20-22
A polyion-surfactant ion formulation as used in hair care andfabric care normally has an initial free surfactant concentrationthat is much higher than cac(2) so that the polyion-surfactantcomplexes contain a sufficient excess of surfactant to be soluble.Phase separation is then achieved by the dilution inherent in thedifferent steps in the washing process. The dilution leads to adecrease in the free surfactant concentration and a concomitantdecrease in the surfactant ion content in the complex, whicheventually leads to a loss of solubility and, typically, an increase insurface deposition.
In a series of joint studies in our laboratories, we systematicallyinvestigated surface deposition from aqueous mixtures of oppo-sitely charged polymers and surfactants. In the first of thesestudies,23 Svensson et al. investigated the adsorption and phasebehavior of two cationically modified polysaccharides that arewidely used in applications, namely, cationic guar (cat-guar) andhydroxyethyl cellulose (cat-HEC), when mixed with anionicsurfactants. The study demonstrated a strong correlation betweenbulk phase separation (turbidity increase) and the maxima in theadsorbed amount on hydrophilic silica and showed that cat-guarproduced phase separation over a wider range of surfactantconcentrationandwas less prone tobind excess anionic surfactantcompared to cat-HEC. Further studies showed that this differ-ence in excess surfactant binding also had important quantitativeconsequences for surface deposition accomplished by dilution.24
The proposed molecular explanation of the observed differenceswas that cat-guar is less hydrophobic than cat-HEC. Thesefindings inspired us to conduct a more systematic study on theeffect of polyion hydrophobicity on adsorption in relation to thephase behavior of the polyion-anionic surfactant system. Forthis purpose, here we use a series of synthetic cationic polyionswith similar charge and molecular weight but with varyinghydrophobicity. In situ ellipsometry allows us to follow theadsorption/deposition aswell as the effect of diluting the solution.The obtained results are correlated with the bulk phase behavior,as obtained by simple turbidity measurements. The focus of thisstudy is to provide a mechanistic understanding of the effect ofdilution on deposition. In spite of its practical importance, thisphenomena is not very well understood.
II. Experimental Section
Materials. Surface Preparation. The substrates for theadsorption studies were silicon wafers (p-type, boron-doped,resistivity 1-20 Ω cm) that had been oxidized in an oxygenatmosphere at 920 �C for about 1 h (giving an oxide layer
thickness of about 300 A, annealed and cooled under a flow ofargon and cut into slides with dimensions of 30 mm�12 mm; BoThuner, Department of Chemistry, IFM, Link€oping University,Sweden). These slides were cleaned in 25% NH3 (pro analysi,Merck), 30% H2O2 (pro analysi, Merck), and H2O (1:1:5 byvolume) at 80 �C for 5 min, followed by a mixture of 32% HCl(pro analysi, Merck), 30% H2O2 (pro analysi, Merck), and H2O(1:1:5 by volume) at 80 �C for 10 min as described earlier.25 Thecleaned surfaces were then stored in ethanol (99.5%). Prior to theexperiments, the surfaces were dried under a flow of nitrogen andcleaned with rf plasma for 5 min (Harrick Scientific Corp., modelPDC-3XG) in residual air at 0.03 mbar at a power of 30 W.
The hydrophobized silica surfaces were prepared by gas-phasesilanization. The cleaned and plasma-treatedwafers were exposedto dimethyloctylchlorosilane (purity >95%, Sigma-Aldrich) andallowed to react overnight under vacuum at room temperature.The hydrophobized silica surfaces were then sonicated for 20minfirst in tetrahydrofuran and then in ethanol for a total of threecycles and finally stored in ethanol. These surfaces exhibited awater contact angle of 96 ( 2� (measured by the sessile dropmethod with a goniometer from Kruss).
Chemicals. Acrylamide/methacrylamidopropyl trimethylam-monium chloride (AA/MAPTAC), hydroxyethyl acrylate/metha-crylamidopropyl trimethylammonium chloride (HEA/MAPTAC),acrylomorpholine/methacrylamidopropyl trimethylammoniumchloride (AMP/MAPTAC), and hydroxypropyl acrylate/dime-thylaminoethyl methacrylate (HPA/DMAM) copolymers weresynthesized using the following procedure. A flask was chargedwith argon and equipped with an overhead stirrer, a heatingmantle, and a thermometer. Water (600 mL, 50 �C) was added tothe flask, followed by the addition of the cationic monomer (e.g.,DMAM), 2 N HCl (38.5 mL), and neutral monomer (e.g.,HPA).2,20-Azobis(2-methylpropionamidine) dihydrochloride (0.30 g,0.001 mol) as a 10 wt %/volume solution (3 mL) was added tothe reaction mixture. The contents of the flask were kept warmand were allowed to mix for 18 h. The cooled reaction mixturesyielded the desired polymer solution.
The monomer weight ratio at synthesis was 80:20 (neutral/cation) for all copolymers. NMR measurements did not detectany residual unreactedmonomers after synthesis. Thismeans thatthe mass/charge ratio was the same for all MAPTAC-containingpolyions (925 g/equiv) and slightly lower for HPA/DMAM(786 g/equiv). However, as a consequence of the different molarmasses of the various neutral units, the molar ratio of neutral/cationic units and therefore also the average distance betweencharges along the polymer chain varied for the copolymers(Table 1).
Results from molecular weight characterizations by gel per-meation chromatography are also given in Table 1, and thechemical structures of the polyions are given in Figure 1. Thepolyions were obtained as stock solutions at a concentration ofaround 6.5% and were used without purification. The polyionsweredissolved in1mMNaCl toa concentrationof 1000ppm.Thesurfactant used was SDS from BDH (critical micelle concentra-tion in water at room temperature of 8.3 mM).
Table 1. Polyelectrolyte Characteristicsa
polymersMw
(g/mol)nonionic/cationic
molar ratiopolydispersity
Mw/Mn
AA/MAPTAC 699 000 92:8 8.8HEA/MAPTAC 935 000 88:12 5.9AMP/MAPTAC 625 000 86:14 3.2HPA/DMAM 525 000 83:17 2.2
aData obtained at Procter & Gamble. Molecular weight averageswere obtained by gel permeation chromatography using poly(ethyleneoxide) standards for calibration.
(15) Berglund, K. D.; Przybycien, T.M.; Tilton, R. D.Langmuir 2003, 19, 2705–2713.(16) Braem, A. D.; Biggs, S.; Prieve, D. C.; Tilton, R. D. Langmuir 2003, 19,
2736–2744.(17) Penfold, J.; Tucker, I.; Staples, E.; Thomas, R. K.Langmuir 2004, 20, 7177–
7182.(18) Penfold, J.; Tucker, I.; Thomas, R. K. Langmuir 2005, 21, 11757–11764.(19) Tonigold, K.; Varga, I.; Nylander, T.; Campbell, R. A. Langmuir 2009, 25,
4036–4046.(20) Dedinaite, A.; Claesson, P. M. Langmuir 2000, 16, 1951–1959.(21) J€onsson, B.; Lindman, B.; Holmberg, K.; Kronberg, B. Surfactants and
Polymers in Aqueous Solution; Wiley & Sons Ltd: Chichester, U.K., 1998.(22) Samoshina, Y.; Nylander, T.; Shubin, V.; Bauer, R.; Eskilsson, K.
Langmuir 2005, 21, 5872–5881.(23) Svensson, A. V.; Huang, L.; Johnson, E. S.; Nylander, T.; Piculell, L. ACS
Appl. Mater. Interfaces 2009, 1, 2431–2442.(24) Svensson, A. V.; Johnson, E. S.; Nylander, T.; Piculell, L.ACSAppl.Mater.
Interfaces 2010, 2, 143–156. (25) Tiberg, F. J. Chem. Soc., Faraday Trans. 1996, 92, 531–538.

DOI: 10.1021/la1003353 9359Langmuir 2010, 26(12), 9357–9367
Santos et al. Article
Experimental Setup. Turbidity Measurements. The tur-bidity of the bulk solutions was determined by absorbance mea-surements in the visible-light region (λ=500nm). Polystyrene cu-vettes with a path length of 1 cm were used. The conditions in thecuvette during the turbiditymeasurementswere similar to those inthe ellipsometry measurements, with the subsequent addition ofsurfactant to a polymer solution and stirring between measure-ments. The concentration of NaCl was 1 mM. The absorbancewas measured 5 min after the surfactant addition and repeatedafter 10, 20, and 30 min of stirring. The temperature during themeasurements was 25-30 �C. Representative experiments fromduplicatemeasurements are shown.Thedeviations fromthemeanwere less than 3%.
Ellipsometry. The adsorbed amount and adsorbed layer thick-ness of the surfactants onto the hydrophobic silica surfaces weremeasured in situ by null ellipsometry. Ellipsometry is an opticaltechnique based on the fact that polarized light changes its state ofpolarizationwhen reflected against a surface. In null ellipsometry,the polarizer and analyzer positions corresponding to the mini-mum transmission of light to the detector are measured and thecorresponding values Δ and Ψ are the relative phase shift andamplitude change, respectively, that characterize the change instate of polarization of the reflected light. Because measurementsare made every 3 s, the method allows dynamic studies of filmgrowth/removal with a time resolution that is relevant for manyprocesses.Amodified, automatedRudolph thin filmellipsometer,type 43 603-200E (Rudolph Research, Fairfield, N.J.) was used,with polarized xenon light of wavelength 4015 A, incident at anangle of 68.23� to a plane normal to the surface. A detaileddescription of the theory, instrumentation, and applications ofellipsometry is given byAzzam and Bashara.26 The relative errorsin refractive index and thickness are high for small adsorbedamounts (<0.5 mg/m2) but decrease rapidly to values of around5-10% for adsorbed amounts >1 mg/m2. The relative error inthe adsorbed amount is much smaller, 15% at 0.1 mg/m2 and lessthan 1% for 1 mg/m2.25 The ellipsometer angles, Δ and Ψ, weremeasured in two different media, air and solvent, as described byTiberg and Landgren.27 In this way, the refractive index of thesilicon wafer and the thickness and refractive index of the siliconoxide layer can be determined. After adding the polyelectrolyte-surfactant solution, the refractive index and thickness of theadsorbed film can be calculated from the ellipsometer angles ifone assumes an optical model with four homogeneous layers withplanar interfaces, namely, the solvent, the film, the silicon oxidelayer, and the silicon wafer. In practice, the thickness obtainedfrom the ellipsometer measurements represents an average thick-ness and not the full extension of, say, a layer of expandedpolymer molecules adsorbed on the surface. The mass per surface
area (Γ) was then calculated from the following equation:
Γðmg=m2Þ ¼ df ðnf - n0Þdn=dc
ð1Þ
where df is the thickness of the film (A), nf is the refractive index ofthe film, n0 is the refractive index of the solvent in the film, and dn/dc is the refractive index increment as a function of the bulkconcentration. A dn/dc value of 0.15 has been used in this studyfor the polymers and the surfactant.11,12 The hydrophilic silicasurfaces are negatively charged in water because of the deproto-nation of the Si-OH groups. The surface charge density of silicaat pH 6.5 in 1mMelectrolyte solution (KCl) has been determinedto be ca.-0.3 μC/cm2.22 This corresponds to a molar quantity ofanionic charges of ca. 3 � 10-9 mequiv/cm2 or a surface area of5000 A2/charge.
When hydrophobic silica surfaces were used, ethanol waspumped through the cuvette before the aqueous solution wasadded to reduce air/gas trapped on the surfaces.
After characterization of the silica surface in air and aqueoussolution, the adsorption experiments were started by adding0.5 mL of a 1000 ppm polymer solution to the cuvette filled with4.5mLof 1mMNaCl, resulting in a polymer concentration in thecuvette of 100 ppm.The solution in the cuvettewas agitatedwith amagnetic stirrer at a stirring speedof 700 rpm.The increase inSDSconcentration was achieved by the stepwise addition of a smallvolume of a 10, 100, or 500 mM (as appropriate) SDS stocksolution. In the experiments where the effect of the dilution of thepolymer/surfactant mixture was studied, 0.5 mL of a premixedpolymer-surfactant solution containing 1000 ppm polymer andvarying concentrations of surfactant was added to a cuvette filledwith 4.5 mL of 1 mM NaCl. Dilution was achieved by “rinsing”with 1 mM NaCl, using a circuit with tubes in and out of thecuvette. The pumping rate during rinsing was approximately5 mL/min. Representative experiments from duplicate measure-ments are shown. Deviations from the mean were less than 10%for the adsorbed amount and less than 3% for the adsorbed layerthickness.
III. Results
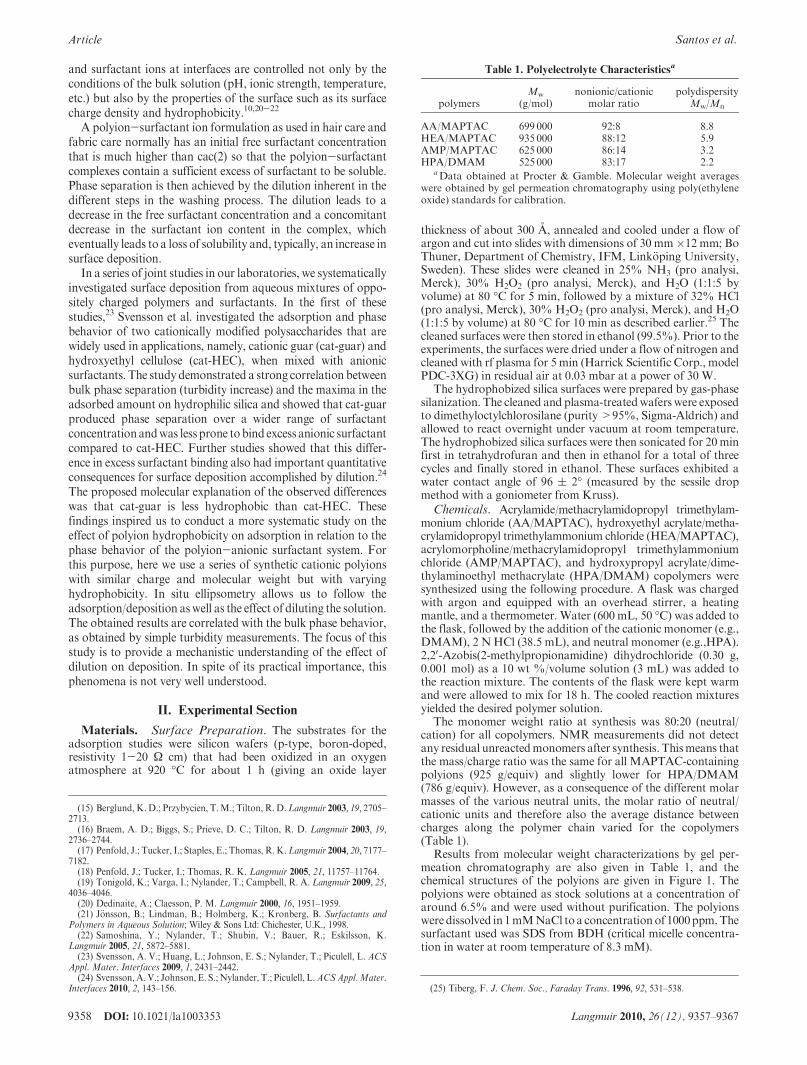
Polyion Adsorption atHydrophobized Silica.Aconvenientway to assess the relative hydrophobicities in a set of polycations isto compare their adsorption to that of hydrophobized silica.23
Because themass per unit charge is the same for the polyions used inthe present work except for HPA/DMAM, one may assume that itis mainly the difference in hydrophobicity that controls possibledifferences in the extent of adsorption. The adsorbed amount at theplateau level for the different polyions is shown in Figure 2, indicat-ing that the hydrophobicity of the polyions follows the order HPA/DMAM>AMP/MAPTAC=HEA/MAPTAC>AA/MAPTAC.
Figure 1. Structures of the investigated polyions. (a) AA/MAPTAC, (b) HEA/MAPTAC, (c) AMP/MAPTAC, and (d) HPA/DMAM.
(26) Azzam, R. M. A.; Bashara, N. M. Ellipsometry and Polarized Light; North-Holland: Amsterdam, 1977.(27) Tiberg, F.; Landgren, M. Langmuir 1993, 9, 927–932.
9360 DOI: 10.1021/la1003353 Langmuir 2010, 26(12), 9357–9367
Article Santos et al.
This conclusion is supported by the fact that the adsorption of thevarious polyions at nonmodified hydrophilic silica follows thereverse trend. (See the next section.)
The deduced order of decreasing hydrophobicity would also beinferred from the chemical structures of the neutral co-monomers(Figure 1), and in the following text, we will simply refer to thisorder as the order of decreasing hydrophobicity of the polyions.The thickness data (Figure 2b) indicate that polyions HPA/DMAM, AMP/MAPTAC, and HEA/MAPTAC adsorb flatlyon the surface. The low adsorbed amount of AA/MAPTACmakes it difficult to resolve the thickness and refractive indexof the film independently, and a large amount of scatter in thethickness data was observed (not shown), which makes it hazar-dous to draw any conclusion regarding the layer structure of thispolyion.Sequential Addition of Surfactant Ions to Polyions. A
convenient, efficient protocol for studying either the phasebehavior or the surface adsorption of polyion-surfactant ionmixtures at different ratios of surfactant ion to polyion is thestepwise addition of surfactant to a dilute polyion solution in a“titration experiment”. The results of such titration experimentsare shown in Figure 3. For some polyions, the solutions appearedto be slightly turbid at an SDS concentration of 0.01 mM(Figure 3a), indicating some polyion-surfactant association. Atan SDS concentration of around 0.1 mM, the turbidity of theHPA/DMAM solution increased sharply, indicating massiveaggregation of the polyion-DS complexes. For the less hydro-phobic polyions, the initial increase in turbidity wasmore gradualand the sharp increase came at higher SDS concentrations. Thepolyions gave turbiditymaxima at increasing SDS concentrationsin the order HPA/DMAM (0.2 mM) < AMP/MAPTAC =HEA/MAPTAC (0.4 mM) < AA/MAPTAC (2 mM). At evenhigher SDS concentrations, the turbidity decreased because of thedissolution of the aggregates, and at surfactant concentrationswell above the maximum, the turbidity leveled off to a value thatwas similar for all of the polyions but higher than that of thesurfactant-free polyelectrolyte solution. Turbidity measurementswere performed after 5, 10, 20, and 30 min, and we noted that theturbidity decreased with time at conditions corresponding to therecorded maximum in turbidity (Figure 3a). This decrease could
not be attributed to a redissolution of the complexes. Rather, agradual coarsening of the phase-separated particles was observedso that the system changed from a uniformly turbid dispersion toa suspension of macroscopic flocs in a transparent medium.
The interfacial behavior of the polyions upon sequentialSDS addition is presented in Figure 3b,c. All of the polyionsadsorbed readily to the hydrophilic silica (Figure 3b), but thevariation in the adsorbed amount among the polyions was muchless pronounced than for the adsorption at hydrophobized silica(Figure 2). The largest adsorbed amount was obtained for AA/MAPTAC (1.4 mg/m2) and AMP/MAPTAC (1.3 mg/m2), fol-lowed by HEA/MAPTAC (1 mg/m2) and finally HPA/DMAM(0.85 mg/m2) (Figure 3b). As pointed out above, this trend is thereverse of that observed inFigure 2a, that is, the adsorbed amounton hydrophilic silica decreases with increasing polyion hydro-phobicity. With the addition of SDS, a very sharp increase in theadsorbed amount was observed at a surfactant concentrationthat increased with decreasing polyion hydrophobicity. Furtheraddition of SDS eventually led to a decrease in the adsorbedamount (maximum in adsorbed amount versus SDS con-centration). For each polyion, this maximum was reached atSDS concentrations slightly higher than the corresponding tur-bidity maximum, except for AA/MAPTAC where the maxima inturbidity and the adsorbed amount coincided.
Except for AA/MAPTAC, the thickness of the adsorbed layerof polyions in the absence of SDS was very small, indicating thatthe polyions adsorbed in a flat configuration (Figure 3c). Again,with the exception of AA/MAPTAC, the thickness of the ad-sorbed layer showed a local maximum at an SDS concentrationcorresponding to the adsorptionmaximum (Figure 3c). A furtherincrease in the SDS concentration caused an initial decrease in thethickness. Above ca. 1 mM SDS, there was a sudden increase inthickness, followedbya levelingoff at higher SDS concentrations.As for AA/MAPTAC in the present investigation, no thicknessmaximum was observed in similar titration experiments whenSDS was added to a solution of cat-guar or cat-HEC in contactwith hydrophilic silica.23A comparisonwith the data on adsorbedamounts for the various systems (Figure 3b) immediately suggeststhat the maximum in thickness appears only when the peak in theadsorbed amount is very pronounced (high and narrow).
Figure 2. Adsorbed amount (a) and thickness of the adsorbed layer (b) at hydrophobic silica for HPA/DMAM (�), AMP/MAPTAC (0),HEA/MAPTAC (O), and AA/MAPTAC (4) as a function of time. The polyelectrolyte concentration was 100 ppm.

DOI: 10.1021/la1003353 9361Langmuir 2010, 26(12), 9357–9367
Santos et al. Article
Effect of Dilution on Association in Solution and at
Surfaces. Premixed mixtures of polyion and SDS at differentSDS concentrations were prepared to study dilution-inducedphase separation and surface deposition, as described in theIntroduction. The dilution of the mixture by a gradual rinsingof the ellipsometer cuvette with 1 mM NaCl was followed byellipsometry (Experimental Section). Similar dilution experimentswere performed while monitoring the turbidity.
TurbidityMeasurements. Turbidity measurements (Support-ing Information) confirmed that a phase separation of an ini-tially monophasic mixture at high surfactant concentration couldbe induced by dilution. Generally, the turbidity varied in anonmonotonic fashion on dilution, with an increase followedby a decrease as the surfactant concentration decreased. Natu-rally, themaximum turbidity was lower if the initial mixture had ahigher surfactant concentration becausemoreNaCl solution thenhad to be added before the region of phase separation wasreached.Again, a decrease in the turbidity with timewas observedespecially for compositions in the vicinity of the turbidity max-imum. When solutions of different polyions, for instance, AA/MAPTAC and HEA/MAPTAC, were diluted from the same
initial SDS concentration, the solution with the more hydropho-bic polyion (HEA/MAPTAC) had to be diluted the most beforephase separation occurred and the turbidity increased. This isconsistent with the results in Figure 3a.
Adsorption at a Hydrophilic Surface. Adsorption from thepolyelectrolyte-SDS mixtures on rinsing was followed by ellip-sometry; see the Experimental Section. A premixed polyelectro-lyte-SDS solution containing excess SDS was injected into thecuvette, and after equilibration was achieved, rinsing with 1 mMNaCl was started (at time= 0). This gave rise to a dilution of themixture in the cuvette. From the titration experiments in Figure 3,four different initial SDS concentrations, that is, 0.5, 2, 5, and50 mM, were selected. Thus, the effects of rinsing could bemonitored for different initial conditions ranging from samplesclose to the conditions of maximum turbidity or adsorption tosamples with surfactant concentrations far above the redissolu-tion boundary to the two-phase region. Three polyions wereselected for these rather time-consuming experiments, includingthe most (HPA/DMAM) and the least (AA/MAPTAC) hydro-phobic polyions andone intermediate (HEA/MAPTAC) polyion.For AA/MAPTAC, where the adsorption and turbidity maxima
Figure 3. Turbidity in the bulk (a), adsorbed amount at hydrophilic silica (b), and thickness of the adsorbed layer (c) for AMP/MAPTAC(0), HEA/MAPTAC (O), HPA/DMAM (�), and AA/MAPTAC (4) as functions of the SDS concentration. The polyelectrolyteconcentration was 100 ppm, and SDS was added in steps.
9362 DOI: 10.1021/la1003353 Langmuir 2010, 26(12), 9357–9367
Article Santos et al.
occurred at relatively high surfactant concentrations, only the twohighest initial surfactant concentrations were used.
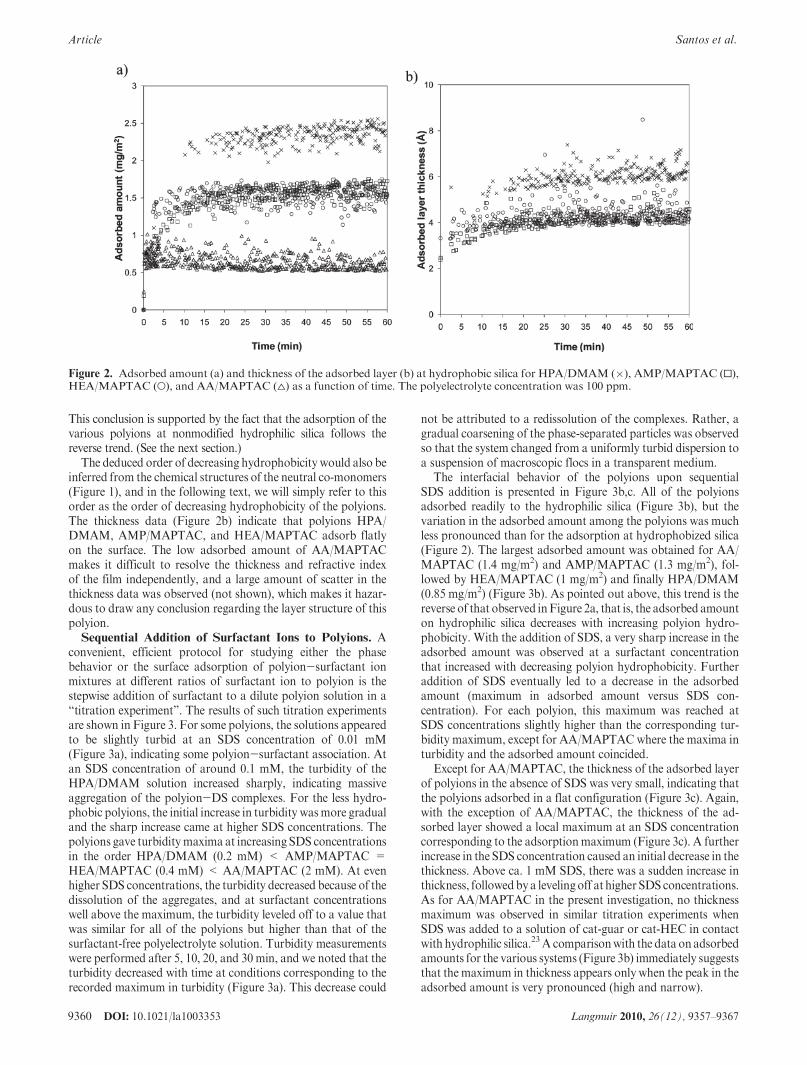
In 0.5 mM SDS, both HEA/MAPTAC and HPA/DMAMcomplexes were adsorbed directly after injection in very highamounts (>3 mg/m2) (Figure 4). The adsorbed layer of HEA/MAPTAC-DSwas thicker, 181 A compared to 66 A for theHPA/DMAM-DS complex.
When the bulk solution was diluted by rinsing, the adsorbedamount ultimately decreased to the same value for both mixtures(0.73 mg/m2). However, the adsorbed layers rapidly swelled to amore expanded conformation, which then contracted very slowlyduring the rinsing process. The largest changes recorded byellipsometry occurred during a transition interval that lasted forless than 10 min. The changes recorded during this transitioninterval were monotonic for HEA/MAPTAC, but a small tran-sient maximum was observed in both the adsorbed amount andthe layer thickness for HPA/DMAM.
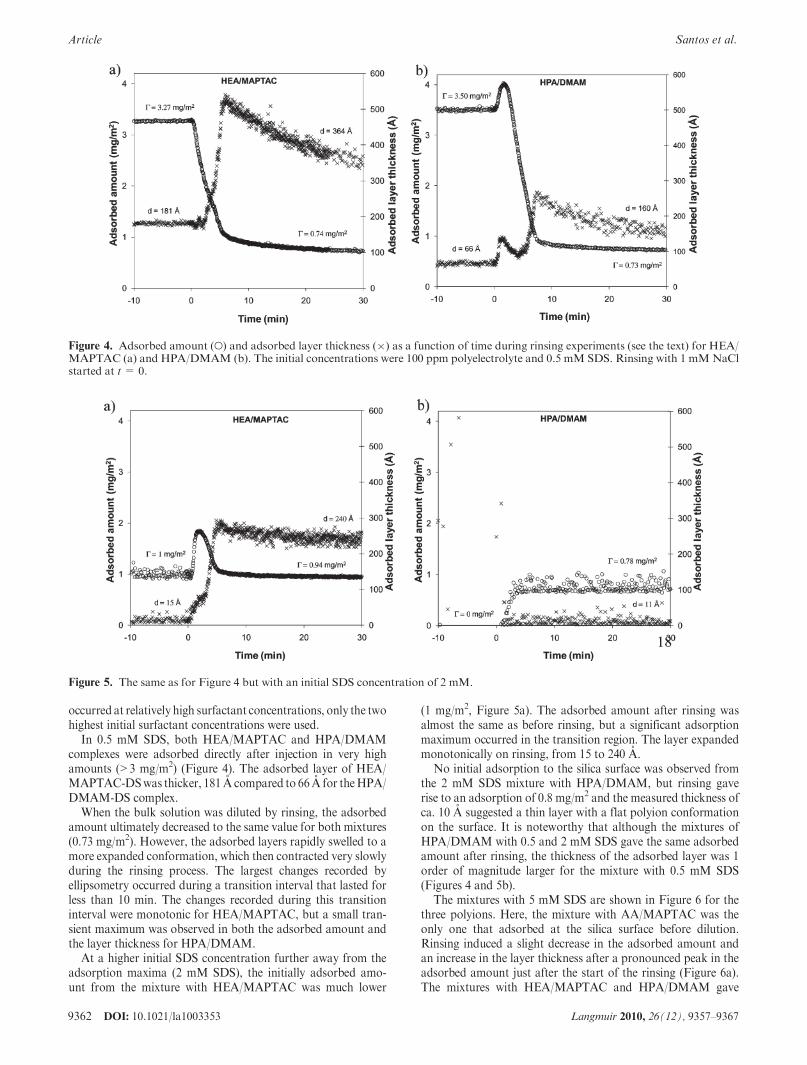
At a higher initial SDS concentration further away from theadsorption maxima (2 mM SDS), the initially adsorbed amo-unt from the mixture with HEA/MAPTAC was much lower
(1 mg/m2, Figure 5a). The adsorbed amount after rinsing wasalmost the same as before rinsing, but a significant adsorptionmaximum occurred in the transition region. The layer expandedmonotonically on rinsing, from 15 to 240 A.
No initial adsorption to the silica surface was observed fromthe 2 mM SDS mixture with HPA/DMAM, but rinsing gaverise to an adsorption of 0.8 mg/m2 and the measured thickness ofca. 10 A suggested a thin layer with a flat polyion conformationon the surface. It is noteworthy that although the mixtures ofHPA/DMAM with 0.5 and 2 mM SDS gave the same adsorbedamount after rinsing, the thickness of the adsorbed layer was 1order of magnitude larger for the mixture with 0.5 mM SDS(Figures 4 and 5b).
The mixtures with 5 mM SDS are shown in Figure 6 for thethree polyions. Here, the mixture with AA/MAPTAC was theonly one that adsorbed at the silica surface before dilution.Rinsing induced a slight decrease in the adsorbed amount andan increase in the layer thickness after a pronounced peak in theadsorbed amount just after the start of the rinsing (Figure 6a).The mixtures with HEA/MAPTAC and HPA/DMAM gave
Figure 4. Adsorbed amount (O) and adsorbed layer thickness (�) as a function of time during rinsing experiments (see the text) for HEA/MAPTAC (a) and HPA/DMAM (b). The initial concentrations were 100 ppm polyelectrolyte and 0.5 mM SDS. Rinsing with 1 mMNaClstarted at t= 0.
Figure 5. The same as for Figure 4 but with an initial SDS concentration of 2 mM.

DOI: 10.1021/la1003353 9363Langmuir 2010, 26(12), 9357–9367
Santos et al. Article
surface depositions only after rinsing, with HEA/MAPTACgiving a slightly higher adsorbed amount (Figure 6b,c). InFigure 6c, the layer thickness obtained for the HPA/DMAMmixture is not shown because the low adsorbed amount (<0.5mg/m2) prevented the unambiguous determination of the thick-ness (df and nf are coupled).
At the highest initial SDS concentration (50mM), the adsorbedamount determined for the mixture with AA/MAPTAC beforerinsing was too low to be considered significant (Figure 7a). Afterrinsing, the adsorbed amount increased and no maximum ap-peared in the transition region. The mixtures with HEA/MAP-TAC or HPA/DMAM adsorbed only after rinsing, giving thesame adsorbed amount (0.3 mg/m2) (Figure 7b,c). Again, thethickness data for the latter mixtures are not presented becausethey could not be resolved as a result of the low adsorbedamounts.
IV. Discussion
Adsorption of the Polyion Alone Is Sensitive to Surface
and Polyion Hydrophobicity. The adsorption to both hydro-philic and, especially, hydrophobized silicawas clearly sensitive tothe variation of the neutral repeating units in the polyions(Figures 2 and 3). The adsorbed amount increasedwith increasing
hydrophobicity of the neutral units on hydrophobized silica, andthe order was reversed on hydrophilic silica. On both surfaces,most polyions adsorbed in a flat conformation, as can be inferredfrom the small layer thickness. Thin layers of adsorbed polyionson oppositely charged surfaces in dilute electrolyte solutions havepreviously been observed by surface force measurements20 andellipsometry.12,13,22 The greatest thickness on hydrophilic silicawas obtained for the AA/MAPTAC polyion, compared to thatfor the other polyions (Figure 3c). This result is consistentwith thefact that AA/MAPTAC is the most hydrophilic polyion, whichalso gives the highest adsorbed amount on the hydrophilic silica.The high adsorbed amount could give rise to excess positivecharge relative to the negatively charged substrate and, hence, anexpansion of the adsorbed layer.Responses to Added Surfactant Reflect the Surfactant-
Binding Isotherm. Addition of surfactant to the various poly-ions in the titration experiments caused changes in the solutionturbidity that were mirrored in the adsorbed amount of poly-ion-surfactant ion complexes. This strong correlation confirmsthat the general features of the schematic binding isotherm, shownin Figure 8, are valid both in the bulk and at surfaces. This type ofbinding isotherm for oppositely charged polymer-surfactantpairs has previously been inferred from gel swelling experiments4
Figure 6. Adsorbed amount (O) and adsorbed layer thickness (�) as a function of time during rinsing experiments (see the text) for HEA/MAPTAC (a), HPA/DMAM (b), and HPA/DMAM (c). The initial concentrations were 100 ppm polyelectrolyte and 5 mM SDS. Rinsingwith 1 mMNaCl started at t= 0.

9364 DOI: 10.1021/la1003353 Langmuir 2010, 26(12), 9357–9367
Article Santos et al.
and from similar surface titration experiments as in the presentstudy, which was performed on cationic polysaccharides.12,13,23
Surfactant ion micelles are formed as the polyion sets in at cac,leading to cooperative surfactant binding. This binding step levelsoff when the polyion-surfactant ion complex has become stoi-chiometric or net neutral. At this point, the complexes aretypically insoluble and also show a maximum adsorption to solidsurfaces. A second cooperative binding step commences at cac(2).For ionic-neutral copolymers, this second step has been shownto occur only when the neutral co-monomers are also able to bindsurfactant ions, owing to a sufficiently strong hydrophobic
attraction.4 As a result of the additional binding at cac(2), thecomplexes gradually become more and more overcharged andgradually redissolve and desorb from the surface adlayers.
We recall in this context thatDedinaite andClaessonmeasuredthe turbidity and electrophoretic mobility of aggregates of apositively charge polyelectrolyte and SDS.20 They observed thatat low SDS concentrations the aggregates were positively chargedand at higher SDS concentrations the aggregates carried anegative charge. Notably, the point of zero charge occurred atthe same SDS concentration as the turbidity maximum. Thus,these previous measurements confirm the scenario describedabove.Returning to the present investigation, we find that, withinthe resolution of our experiments, the two surfactant bindingsteps commence at the same surfactant concentrations in the bulkand at the surface. Thus, we can confirm the previous conclu-sion23 that simple turbidity measurements on dilute systems areuseful guides to the variation in the adsorbed number of poly-ion-surfactant ion complexes at solid surfaces in titration experi-ments.
We will now discuss the surface adsorption results obtained inthe titration experiments inmore detail. The general features werethe same as those previously observed in similar titration experi-ments on cationic polysaccharide derivatives.12,13,23 The initialsharp increase in the adsorbed amount and layer thickness withthe addition of SDS (Figure 3b,c) could, in principle, be due to
Figure 7. The same as for Figure 6 but with an initial SDS concentration of 50 mM.
Figure 8. Schematic surfactant binding isotherm.

DOI: 10.1021/la1003353 9365Langmuir 2010, 26(12), 9357–9367
Santos et al. Article
either DS ions binding onto the adsorbed polyion layer or to theadsorption of additional polyion-DS complexes formed in thebulk. Terada et al.12 compared the effects of adding SDS topreadsorbed layers of cat-HEC on silica with and withoutpolyelectrolyte present in the bulk and found a much largeradsorption when the polyelectrolyte was present. These observa-tions from similar experiments would thus suggest that theincrease in the adsorbed amount seen in Figure 3b is due to theadditional adsorption of both polyions and DS ions. Regardingthe chemical composition of adsorbed layers from mixtures ofpositively charged polyions and SDS, we note that Dedinaite andClaesson previously found (albeit for somewhat different experi-mental conditions) that, at low SDS concentrations (far from theturbidity maximum), a very low proportion of DS was present inthe adsorbed layer whereas at SDS concentrations correspondingto the turbidity maximum aggregates containing both DS andpolyions were adsorbed to the surface.20
Turning to the thickness of the adsorbed layer, we observe that,immediately above the maximum, the layer thickness decreases,just like the adsorbed amount, for most polyions. This reflects thedesorption of the complex. At still higher SDS concentrations,however, the thickness increases, although the adsorbed amountstill decreases (Figure 3b,c). This indicates that the complexes stillremaining at the surface are highly swollen by excess bound SDS(charge reversal of the cationic polymer), as has previously beenfound in a corresponding study on cationically modified poly-saccharides.23
Polyion Hydrophobicity Affects the Peak in Turbidity/
Deposition on Adding Surfactant. The most significant ob-servation in the present study is that the hydrophobicity of thepolyion strongly affects the surfactant concentration range whereboth phase separation and a significant adsorption of poly-ion-surfactant ion complexes occur. On the basis of the locationof the onsets and maxima of the adsorption peaks in Figure 3b,we may conclude that not only cac but also cac(2) decreaseswith increasing polyion hydrophobicity. The locations of the endpoints of the turbidity peaks and adsorption peaks in Figure 3b,c,signifying the complete redissolution of the aggregates, also varywith the polyion hydrophobicity in the same fashion. It is clearthat if an enhanced deposition or phase separation is desired overa wide interval of surfactant concentrations then only a moder-ately hydrophobic polyion should be chosen.
We note that most previous evidence on the effect of polyionhydrophobicity on surfactant binding concerns only the onset ofinitial binding at the cac rather than the second binding step,which is responsible for redissolution. Magny et al.28 studied theassociation of a cationic surfactant (DTAC) to negatively chargedhydrophobically modified poly(sodium acrylate, and they ob-served the onset of binding at a lower surfactant concentration ifthe polymer was more hydrophobic. Benrraou et al.29 found thatas the hydrophobicity of the polyion was increased the bindingbecame less cooperative but stronger (the binding took place at alower surfactant concentration). Wallin and Linse30 found, usingmean-field lattice calculations, that the surfactant cac decreasedwith increasing hydrophobicity of the polyion.
In addition to the width and position of the adsorption peak inthe adsorption isotherm, another parameter of obvious interest isthe maximumadsorbed amount. Here we observed no clear trendamong the various copolymers. All copolymers except AMP/
MAPTACgave similar peak amplitudes.Wehave no explanationof why the adsorption of the complex with AMP/MAPTAC wassignificantly higher; this is an intermediate polyion in terms ofboth hydrophobicity and the molar content of charged units(Figure 1 and Table 1).
Up to this point, we have not discussed possible consequencesof the fact that not only the hydrophobicity but also the molefraction of cationic monomers varies among the studied polyions(Table 1) because the mass percentage of cationic monomers waskept constant in the synthesis and themolarmasses of the variousneutral co-monomers are significantly different. Onemight there-fore wonder whether differences in linear charge density (averagecharge-charge separation along the chain) could provide analternative explanation of the observed variations in surfactantbinding observed in our study. We discard this possibility on thebasis of the considerations given below.
The main concern for us here is to understand why theredissolution of the polyion-surfactant ion complex due toovercharging by excess bound surfactant occurs at differentsurfactant concentrations (different cac(2) values) for differentcopolymers.Whereas the initial binding of surfactant at the cac isknown to be influenced by the linear charge density of thepolyion, it is not a priori clear how the linear charge densitywould affect the excess binding of surfactant to a net neutralcomplex.However, previous experiments give a consistent answerto this question. Experiments on cat-guar9 and on cat-HEC,23
where the degrees of cationic substitution were varied over quitewide ranges (a factor of 7.5 or 3, respectively), showed that thesurfactant concentration required for the redissolution of thepolyelectrolyte was insensitive to the polyion charge density.The same result was reached for the reswelling, by added cationicsurfactant, of copolymer gels of sodium acrylate and N-isopro-pylacrylamide; the reswelling commenced at the same cac(2) valuefor gels with 20 and 50% charged units.4 By contrast, we find inthe collective results from this and previous23 studies that thecac(2) values, as obtained from the maxima in the adsorption orturbidity data, can vary by an order of magnitude betweenchemically different polyions with similar linear charge densities.In Figure 3b, the positions of the adsorption maxima varybetween 0.3 and 2 mM SDS; for cat-HEC and cat-guar withsimilar charge densities, the adsorption maxima occurred at ca. 2and 5 mM SDS, respectively.23 Thus, the available evidence isconsistent with our conclusion that nonelectrostatic, presumablyhydrophobic, attractive interactions between the polyions and thesurfactant molecules are responsible for the redissolution phe-nomenonand that the differences in cac(2) values and theultimateredissolution behavior between different polyions may be attri-buted to differing strengths of these interactions.
In this context, we should also consider the possible conse-quences of polydispersity (i.e., variations in linear charge densityand/ormolecular weight among the molecules in a given sample).On the basis of the evidence presented above, we conclude that avariation of the charge densities among the polyions in a sampleshould not result in a significant distribution of cac(2) values.With regard to molecular weight, previous investigations on cat-HECs with the same charge densities but different lengths gavevery similar shapes of the adsorption (or turbidity) peaks,including their cac(2) values.24 A consequence of the insensitivityof the surfactant binding isotherm to the polydispersity of apolyion sample is that a possible surface enrichment of certainpolyion fractions, based on the molecular weight or chargedensity, will have little or no effect on the shape of the adsorptionisotherm (the amplitudemaybe affected24) with added surfactant.This could be a clue to the striking correspondence between the
(28) Magny, B.; Iliopoulos, I.; Zana, R.; Audebert, R. Langmuir 1994, 10, 3180–3187.(29) Benrraou, M.; Zana, R.; Varoqui, R.; Pefferkorn, E. J. Phys. Chem. 1992,
96, 1468–1475.(30) Wallin, T.; Linse, P. Langmuir 1998, 14, 2940–2949.
9366 DOI: 10.1021/la1003353 Langmuir 2010, 26(12), 9357–9367
Article Santos et al.
bulk phase behavior and the adsorption isotherm observed forpolydisperse polyions of technical quality in the present as well asprevious23,24 investigations.Polyion Hydrophobicity and Surfactant Concentration
Affect the Deposition by Dilution. In typical applied contexts,the surface deposition of polyion-surfactant ion complexes isachieved by dilution or rinsing, as described above. Essentially,the rinsing process means that the systemmoves from high to lowsurfactant concentration along the surfactant binding isotherm(Figure 8).
Before discussing the results of the dilution experiments, weshould comment on the fact that the adsorbed amount of thepolyion-DS complexes obtained prior to dilution in the rinsingexperiments was lower than in the experiments when the sameSDS concentration had been added to systems with preadsorbedpolyions. This history-dependent adsorption was especially evi-dent at high surfactant concentrations, where no adsorption at allwas found prior to rinsing. Similar findings were previouslymadeby Terada et al.12,13 and Svensson et al.23 Our results are also inagreement with the study ofDedinaite et al.,10 who suggested thatthe adsorption of polymer-surfactant aggregates leads to loweradsorbed amounts and forms a more heterogeneous adsorbedlayer containing larger aggregates than when the polymer isadsorbed first and then the surfactant is added.
FromFigures 5-7, it is quite obvious that the adsorption froma mixed polyion-surfactant formulation at a fixed surfactantcontent is strongly dependent on the hydrophobicity of thepolyion: a less hydrophobic polyion generally yields a greaterdeposition. This is especially true before rinsing but also afterrinsing. This is clear from the result of the titration experimentsand the surfactant binding isotherm: the less hydrophobic polyionhas a lower tendency to bind excess surfactant ions (a highercac(2)); therefore, the complex has a stronger tendency to phaseseparate. In fact, general trends for all systems are found ifwe look at the series of rinsing experiments (Figures 4-7), wherethe initial surfactant concentration is increased progressively,and consider where the initial concentration is situated in relationto the adsorption peak observed in the titration experiments(Figure 3b). When the initial surfactant concentration is atthe cac(2), which we may identify as the concentration at thesurface adsorption maximum, rinsing results in a monotonicdecrease in the adsorbed amount. This is seen for HEA/MAP-TAC in Figure 4a. Starting from an initial surfactant concentra-tion slightly above cac(2), as for HPA/DMAM in Figure 4b, wesee an initial increase in adsorption before the decrease ondilution. This is in line with the titration results and suggests thatthe adsorption maximum is traversed on dilution, giving a peakon dilution. On starting from a concentration at the high-surfactant end of the adsorption peak, as for HEA/MAPTACinFigure 5a andAA/MAPTAC inFigure 6a,we observe an initialmodest adsorption followed by a transient peak on rinsing beforea leveling off. Again, this agrees with the adsorption isotherm onchanging the surfactant concentration. Finally, if the initialsurfactant concentration is far above the adsorption peak, wherethe complexes should contain a large excess of surfactant ions, no(or very little) initial adsorption is observed and there is notransient peak on rinsing, only a monotonic increase to the finalplateau value. This behavior is seen in Figure 6b,c and for allpolyions at the high surfactant concentration in Figure 7.
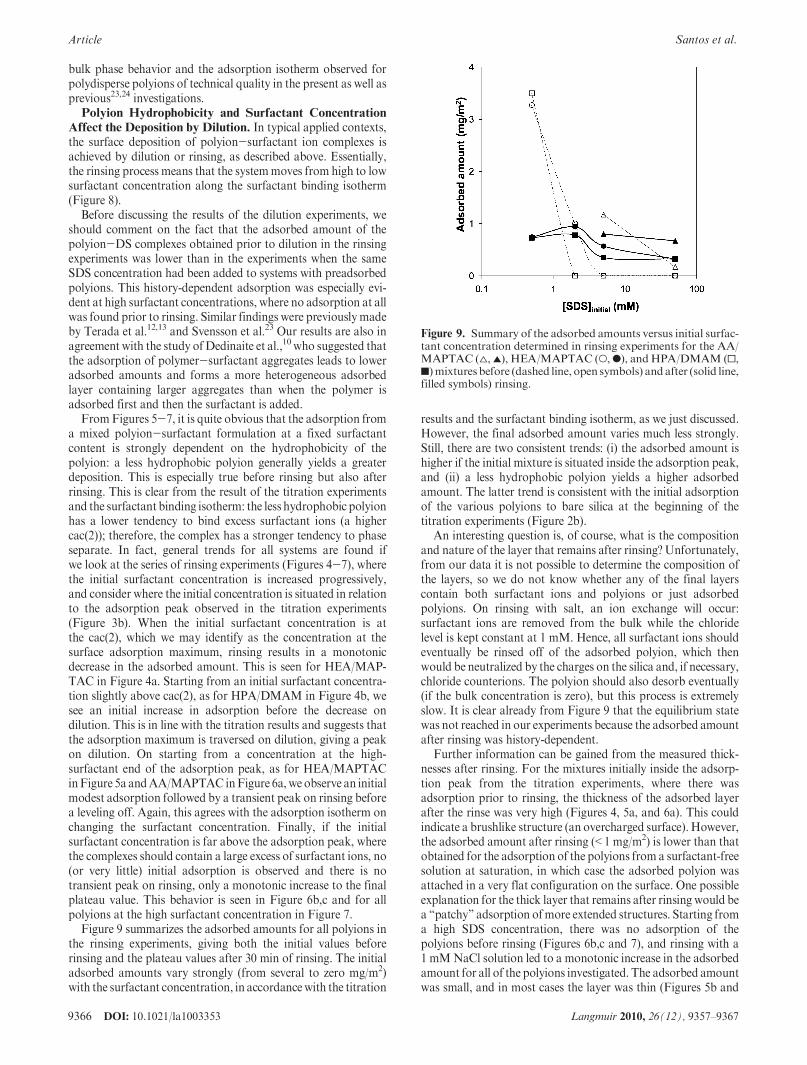
Figure 9 summarizes the adsorbed amounts for all polyions inthe rinsing experiments, giving both the initial values beforerinsing and the plateau values after 30 min of rinsing. The initialadsorbed amounts vary strongly (from several to zero mg/m2)with the surfactant concentration, in accordancewith the titration
results and the surfactant binding isotherm, as we just discussed.However, the final adsorbed amount varies much less strongly.Still, there are two consistent trends: (i) the adsorbed amount ishigher if the initial mixture is situated inside the adsorption peak,and (ii) a less hydrophobic polyion yields a higher adsorbedamount. The latter trend is consistent with the initial adsorptionof the various polyions to bare silica at the beginning of thetitration experiments (Figure 2b).
An interesting question is, of course, what is the compositionand nature of the layer that remains after rinsing? Unfortunately,from our data it is not possible to determine the composition ofthe layers, so we do not know whether any of the final layerscontain both surfactant ions and polyions or just adsorbedpolyions. On rinsing with salt, an ion exchange will occur:surfactant ions are removed from the bulk while the chloridelevel is kept constant at 1 mM. Hence, all surfactant ions shouldeventually be rinsed off of the adsorbed polyion, which thenwould be neutralized by the charges on the silica and, if necessary,chloride counterions. The polyion should also desorb eventually(if the bulk concentration is zero), but this process is extremelyslow. It is clear already from Figure 9 that the equilibrium statewas not reached in our experiments because the adsorbed amountafter rinsing was history-dependent.
Further information can be gained from the measured thick-nesses after rinsing. For the mixtures initially inside the adsorp-tion peak from the titration experiments, where there wasadsorption prior to rinsing, the thickness of the adsorbed layerafter the rinse was very high (Figures 4, 5a, and 6a). This couldindicate a brushlike structure (an overcharged surface). However,the adsorbed amount after rinsing (<1 mg/m2) is lower than thatobtained for the adsorption of the polyions from a surfactant-freesolution at saturation, in which case the adsorbed polyion wasattached in a very flat configuration on the surface. One possibleexplanation for the thick layer that remains after rinsing would bea “patchy” adsorption ofmore extended structures. Starting froma high SDS concentration, there was no adsorption of thepolyions before rinsing (Figures 6b,c and 7), and rinsing with a1 mMNaCl solution led to a monotonic increase in the adsorbedamount for all of the polyions investigated. The adsorbed amountwas small, and in most cases the layer was thin (Figures 5b and
Figure 9. Summary of the adsorbed amounts versus initial surfac-tant concentration determined in rinsing experiments for the AA/MAPTAC (4,2), HEA/MAPTAC (O,b), andHPA/DMAM (0,9)mixturesbefore (dashed line, open symbols) andafter (solid line,filled symbols) rinsing.

DOI: 10.1021/la1003353 9367Langmuir 2010, 26(12), 9357–9367
Santos et al. Article
6b). This can be the result of only the polyion adsorbing orcomplexed surfactant ions leaving the polyion as it adsorbsbecause the silica surface can neutralize the polyion charges.
V. Conclusions
Our experiments on a series of model cationic copolymers withsystematically varying hydrophobicity made it possible to firmlyestablish important conclusions regarding the deposition ofoppositely charged polyion-surfactant ion complexes on solidsurfaces.
(1) The level of adsorption on hydrophobic silicareflects the polyion hydrophobicity.A larger hydro-phobicity gives a larger number of adsorbed poly-ions on hydrophobic silica.
(2) The strong correlation between phase separationand enhanced adsorption of polyion-surfactantcomplexes is verified.Both phenomena occur withinthe same range of surfactant concentrations, andboth phenomena reflect the surfactant binding iso-therm.
(3) The surfactant concentration range of enhancedpolyion-surfactant ion coadsorption is affected bythe polyion hydrophobicity. In mixtures with oppo-
sitely charged surfactants, the concentration rangeof enhanced complex adsorption decreases withincreasing polyion hydrophobicity.
(4) The deposition of complexes can occur during thedilution of a polyion mixed with a high concentra-tion of surfactant. To achieve a maximum precipita-tion of polyion-surfactant ion complexes, theformulation should contain a reasonably hydrophi-lic polyion and a not-too-high initial surfactantconcentration. Stronger polyion hydrophobicityleads to a smaller adsorbed amount when the com-plex is deposited upon dilution of initially surfac-tant-rich solutions.
Acknowledgment. This project was funded by Procter &Gamble. L.P. and T.N. acknowledge support from the SwedishResearch Council.
Supporting Information Available: Results and discussionof the turbidity measurements for the HEA/MAPTAC/SDSand AA/MAPTAC/SDS mixtures at different SDS concen-trations. This material is available free of charge via theInternet at http://pubs.acs.org.