sure passive income
TRANSCRIPT

Return to Top 10 List
Sure Passive Income
Rising Passive Income From Buy & Hold Forever Securities
December 2020 Edition
By Ben Reynolds, Bob Ciura, Josh Arnold, and Eli Inkrot
Edited by Brad Beams
Published on December 20th, 2020

2
Table of Contents
Opening Thoughts - Warren Buffett On Long-Term Investing - ............................................ 3
Sure Passive Income Top 10 - December 2020 ........................................................................... 4
Analysis of Top 10 Securities ....................................................................................................... 5
Archer-Daniels-Midland Co. (ADM) ......................................................................................... 5
General Dynamics Corp. (GD) ................................................................................................... 9
3M Co. (MMM) ........................................................................................................................ 13
Hormel Foods Corp. (HRL) ...................................................................................................... 17
Amgen Inc. (AMGN) ................................................................................................................ 21
The Home Depot Inc. (HD) ...................................................................................................... 25
The Travelers Companies Inc. (TRV) ...................................................................................... 29
Comcast Corp. (CMCSA) ......................................................................................................... 33
American Tower Corp. (AMT) ................................................................................................. 37
A. O. Smith Corp. (AOS) ......................................................................................................... 41
Closing Thoughts - Not All Sectors Are Equal - ...................................................................... 45
Buying & Ranking Criteria ....................................................................................................... 46
Portfolio Building Guide ............................................................................................................ 47
Examples ................................................................................................................................... 47
Past Recommendations & Performance ................................................................................... 48
List of Securities by Dividend Risk Score ................................................................................. 49

3
Opening Thoughts - Warren Buffett On Long-Term Investing -
Warren Buffett has put together one of the greatest long-term investment records in history. He is also an advocate of long-term investing. Several of Buffett’s quotes on long-term investing are analyzed below.
“I never attempt to make money on the stock market. I buy on the assumption that they could
close the market the next day and not reopen it for five years.”
&
“If you aren’t willing to own a stock for ten years, don’t even think about owning it for ten
minutes.”
Long-term investing means investing in the business via the stock market, not investing in a stock and hoping the price goes up in the short run.
“Time is the friend of the wonderful company, the enemy of the mediocre.”
&
“When we own portions of outstanding businesses with outstanding managements, our favorite
holding period is forever.”
&
“Our approach is very much profiting from lack of change rather than from change. With
Wrigley chewing gum, it’s the lack of change that appeals to me.”
Not all companies are suitable for long-term buy and hold investing. Quality businesses that have
stood the test of time and are likely to continue growing far into the future are the type of
businesses worth holding for the long run. Being in a slow changing industry is helpful as well
because the competitive backdrop in which the business operates is more stable.
“You only have to do a very few things right in your life so long as you don’t do too many things
wrong.”
&
“It is not necessary to do extraordinary things to get extraordinary results.”
&
“There seems to be some perverse human characteristic that likes to make easy things difficult.”
People in general – and especially highly intelligent people – tend to overcomplicate things. Long-
term investing isn’t particularly complicated. This leads to a temptation to ‘not leave a good thing
alone’ and seek to buy and sell more frequently than is necessary or desirable.
Once you invest in a great business that’s likely to pay rising dividends over the long run, there’s
not much else to be done. Please keep reading The December 2020 edition of The Sure Passive
Income Newsletter to see our Top 10 recommendations now for rising passive income over the long
run.

4
Sure Passive Income Top 10 - December 2020
Name & Ticker Div. Risk
Score
Stock Price
# Years Div.
Increases
10- Yr. Avg. Div.
Yld.
Div. Yield
Exp. Growth
Exp. Growth + Div. Yield
Archer-Daniels-Mid. (ADM) A $49 45 2.6% 2.9% 6.0% 8.9%
General Dynamics (GD) A $152 28 2.3% 2.9% 6.0% 8.9%
3M (MMM) A $176 62 2.6% 3.3% 5.0% 8.3%
Hormel Foods (HRL) A $48 55 1.7% 2.0% 6.0% 8.0%
Amgen (AMGN) B $231 10 2.2% 3.1% 9.0% 12.1%
Home Depot (HD) B $273 11 2.1% 2.2% 9.0% 11.2%
Travelers (TRV) B $138 15 2.4% 2.4% 8.0% 10.4%
Comcast (CMCSA) B $51 12 1.7% 1.8% 7.0% 8.8%
American Tower (AMT) B $223 10 1.7% 2.1% 6.0% 8.1%
A. O. Smith (AOS) B $55 27 1.3% 1.9% 6.0% 7.9%
Notes: Data for the table above is from a spreadsheet during the past week of our Sure Analysis Research
Database and general data over the same week. ‘Div.’ stands for ‘Dividend.’ ‘# Years Div. Increases’
shows the consecutive years of dividend growth. ‘Exp. Growth’ means expected annualized growth rate
over the next five years. Data in the table above might be slightly different than individual company
analysis pages due to writing the company reports throughout the past week.
Disclosures: Ben Reynolds is long AMGN, & TRV from this month’s Top 10.
National Fuel Gas (NFG), Coca-Cola (KO), and J.M. Smucker (SJM) were replaced by Archer-
Daniels-Midland (ADM), 3M (MMM), and A. O. Smith (AOS). As a reminder, securities that fall out
of the Top 10 are holds, not sells.
An equally weighted portfolio of the Top 10 has the following dividend yield and expected gowth rate
characteristics:
Sure Passive Income Top 10 S&P 500
Dividend Yield: 2.4% 1.6%
Growth Rate: 6.8% 5.5%
Note: Data for this newsletter is from 12/15/20 through 12/18/20.

Return to Top 10 List
5
Analysis of Top 10 Securities Archer-Daniels-Midland Co. (ADM)
Overview & Current Events
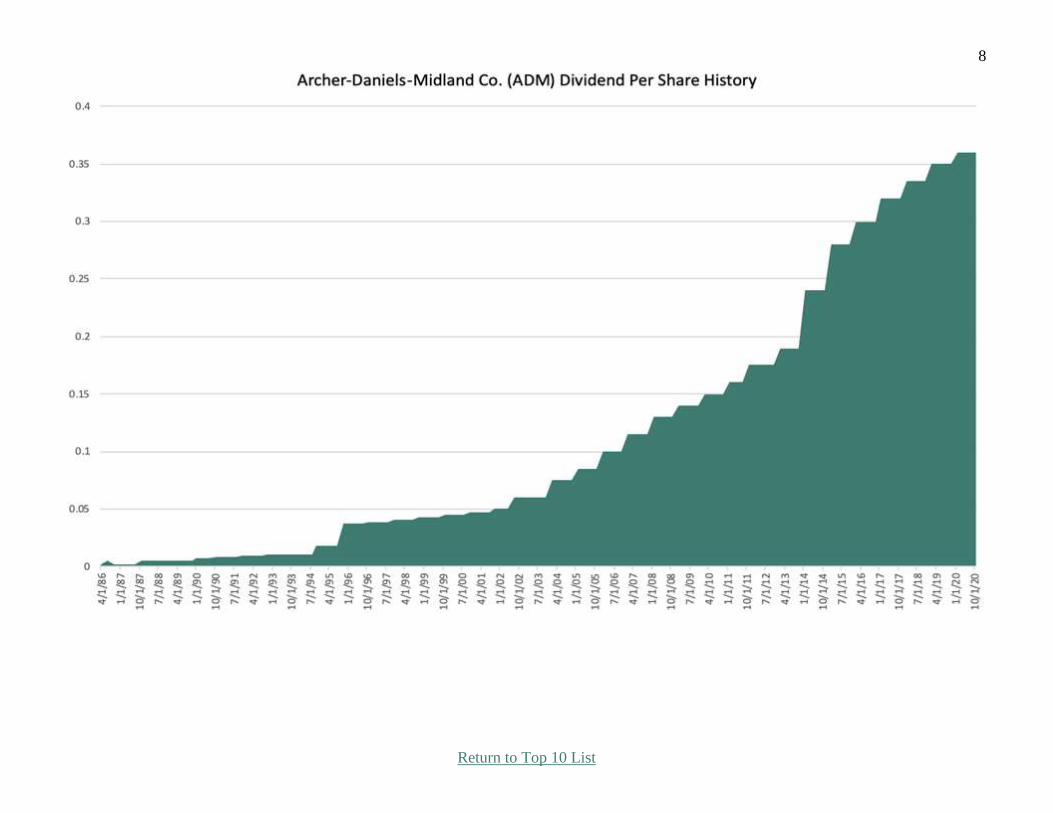
Archer-Daniels-Midland, founded in 1902, is the largest publicly traded farmland product company in
the United States. ADM is a global leader in human and animal nutrition and the world’s premier
agricultural origination and processing company. Archer-Daniels-Midland's businesses include the
processing of cereal grains and oilseeds, and agricultural storage and transportation. Last year the $28
billion market cap company generated $65 billion in sales and $1.4 billion in net profit.
Archer-Daniels-Midland reported its Q3 earnings results on October 29th, 2020. The company
generated revenue of $15.1 billion, representing a 9.5% decline compared to Q3 2019. However,
adjusted earnings-per-share equaled $0.89 compared to $0.77 in the prior year quarter. For the first
nine months of 2020, Archer-Daniels-Midland has generated revenue of $46.4 billion, down 4.0%
compared to the first nine months of 2019. Meanwhile, earnings-per-share have grown from $1.83 for
the first nine months of 2019 to $2.38 per share in the first nine months of 2020.
During Q3 2020 the Nutrition segment delivered its fifth consecutive quarter of 20%+ year-over-year
profit growth. The Nutrition businesses include flavors, specialty ingredients, and health & wellness.
Meanwhile the Ag Services and Oilseeds segment saw 4.6% profit growth.
Safety
Archer-Daniels-Midland’s business is resilient since the demand for food products is not cyclical. The
company is one of the most significant players in its industry and has competitive advantages due to its
scale and geographical reach.
To this point, Archer-Daniels-Midland’s recession performance is noteworthy. During the last
downturn, the company posted earnings-per-share of $2.84, $3.06, $3.06 and $3.13 through the 2008 to
2011 stretch. Moreover, the dividend kept increasing during this time as well. Indeed, Archer-Daniels-
Midland’s dividend record is enviable. The company has paid a dividend for 356 consecutive quarters,
a record of 89 years of uninterrupted payments, to go along with increasing its payout for 45 straight
years. The current payout ratio is roughly 45%, with a 2.9% starting dividend yield.
Growth Prospects
On the one hand, Archer-Daniels-Midland is very resistant to recessions, as people have to eat even
during an economic downturn. On the other hand, a strong economy is not a significant tailwind for
the company as the amount of food sold does not rise quickly during good times.
In the 2010 through 2019 stretch, revenue increased by less than 1% per year, while earnings-per-share
have actually declined. Still, the company can find growth avenues such as the Ziegler Group
acquisition, the nutrition flavor research and customer center opening, and share repurchases. Archer-
Daniels-Midland has reduced its share count by 2.8% per year dating back to 2010. We are forecasting
6% yearly growth over the intermediate term. While this is not a robust forecast, we are impressed by
the company’s recession resilience, solid balance sheet, geographic diversification and dividend
history.
Key Statistics, Ratios, & Metrics Years of Dividend Increases: 45 5-Year Growth Estimate: 6.0%
Dividend Yield: 2.9% Most Recent Dividend Increase: 2.9%
Dividend Risk Score: A Stock Price: $49

Return to Top 10 List
6
Income Statement Metrics Year 2010 2011 2012 2013 2014 2015 2016 2017 2018 2019
Revenue 61682 80676 89038 89804 81201 67702 62346 60828 64341 64656
Gross Profit 3843 4300 3668 3889 4768 3966 3618 3518 4181 4147
Gross Margin 6.2% 5.3% 4.1% 4.3% 5.9% 5.9% 5.8% 5.8% 6.5% 6.4%
SG&A Exp. 1398 1611 1626 1759 1933 1985 1981 1978 2165 2493
D&A Exp. 912 877 848 909 894 882 900 924 941 993
Operating Profit 2445 2689 2042 2130 2835 1981 1637 1540 2016 1654
Op. Margin 4.0% 3.3% 2.3% 2.4% 3.5% 2.9% 2.6% 2.5% 3.1% 2.6%
Net Profit 1930 2036 1223 1342 2248 1849 1279 1595 1810 1379
Net Margin 3.1% 2.5% 1.4% 1.5% 2.8% 2.7% 2.1% 2.6% 2.8% 2.1%
Free Cash Flow 1077 -3587 1418 4313 4049 580 -7390 -7015 -5626 -6280
Income Tax 666 997 523 670 877 438 534 7 245 209
Balance Sheet Metrics Year 2010 2011 2012 2013 2014 2015 2016 2017 2018 2019
Total Assets 31808 42352 41771 43752 43997 40157 39769 39963 40833 43997
Cash & Equivalents 1046 615 1291 3121 1099 910 619 804 1997 852
Acc. Receivable N/A 4808 3439 4522 4236 2886 2426 2424 2683 3281
Inventories 7871 12055 12192 11441 9374 8243 8831 9173 8813 9170
Goodwill & Int. 523 602 603 561 3392 3688 3703 3918 4041 5476
Total Liabilities 17177 23514 23602 23558 24367 22242 22588 21641 21837 24772
Accounts Payable 5538 2581 2474 4513 4326 3474 3606 3894 3545 3746
Long-Term Debt 7548 10319 10320 6870 5660 5877 6931 7493 8388 8881
Total Equity 14609 18808 17969 20156 19575 17899 17173 18313 18981 19208
D/E Ratio 0.52 0.55 0.57 0.34 0.29 0.33 0.40 0.41 0.44 0.46
Profitability & Per Share Metrics Year 2010 2011 2012 2013 2014 2015 2016 2017 2018 2019
Return on Assets 6.1% 5.5% N/A 3.0% 5.1% 4.4% 3.2% 4.0% 4.5% 3.3%
Return on Equity 13.7% 12.2% 6.7% 6.9% 11.3% 9.9% 7.3% 9.0% 9.7% 7.2%
ROIC 8.8% 7.9% N/A 4.8% 8.6% 7.5% 5.3% 6.4% 6.8% 5.0%
Shares Out. 644.0 654.0 666.0 663.0 656.0 621.0 591.0 572.0 567.0 565.0
Revenue/Share 95.78 123.36 133.69 135.45 123.78 109.02 105.49 106.34 113.48 113.48
FCF/Share 1.67 -5.48 2.13 6.51 6.17 0.93 -12.50 -12.26 -9.92 -11.12
Note: All figures in millions of U.S. Dollars unless per share or indicated otherwise.

Return to Top 10 List
7
Return to Top 10 List
8

Return to Top 10 List
9
General Dynamics Corp. (GD)
Overview & Current Events
General Dynamics is an aerospace & defense company that operates five business segments:
Aerospace (23% of sales), Combat Systems (17%), Marine Systems (23%), Information Technology
(23%), and Mission Systems (13%). The company makes the M1 Abrams tank, Stryker vehicle,
Virginia-class submarine, Columbia-class submarine, and Gulfstream business jets. General Dynamics
had revenue of nearly $40 billion last year.
The company reported third-quarter results on October 28th. Total revenue declined 3.4% year-over-
year, while diluted earnings-per-share declined 7.6%. Declines resulted from weakness in Aerospace,
Information Technology, and Mission Systems. Net debt is declining and is now 3.2% lower than last
quarter at $11.9 billion. The total backlog now stands at $81.5 billion, up 21% from the same quarter
last year. Revenue increased 3.5% for Combat Systems and 7.6% for Marine Systems. Information
Technology revenue declined 2% while Mission Systems was flat for the quarter.
Safety
General Dynamics is an entrenched military contractor. It has ground and marine platforms that serve
as the backbone for the U.S. Army, U.S. Navy, and militaries around the world. This leads to a
competitive advantage as these platforms have decades-long life cycles.
These characteristics lead to a reasonable degree of recession resistance. For example, from 2008-2010
during the Great Recession, General Dynamics increased its earnings-per-share by 11%. General
Dynamics also has a secure payout ratio at just 40% of expected fiscal 2020 adjusted earnings-per-
share.
Growth Prospects
We expect 6% annual earnings-per-share growth over the next five years. This earnings-per-share
growth will be achieved through a combination of rising revenue as well as share repurchases. General
Dynamics’ growth is due to increasing U.S. defense spending and international sales. The business jet
market is being negatively impacted due to COVID-19 and travel restrictions, but defense remains a
much bigger portion of General Dynamics’ revenue and earnings. General Dynamics has established
naval and ground platforms that support maintenance and modernization contracts, as well as future
prime contract wins.
General Dynamics has increased its dividend for 28 consecutive years, which makes it a Dividend
Aristocrat. Continued dividend growth is very likely due to the company’s durable competitive
advantages and market leadership. We expect 8% compound annual dividend growth over the next
five years.
Key Statistics, Ratios, & Metrics Years of Dividend Increases: 28 5-Year Growth Estimate: 6.0%
Dividend Yield: 2.9% Most Recent Dividend Increase: 7.8%
Dividend Risk Score: A Stock Price: $152

Return to Top 10 List
10
Income Statement Metrics Year 2010 2011 2012 2013 2014 2015 2016 2017 2018 2019
Revenue 32466 32677 30992 30930 30852 31781 30561 30973 36193 39350 Gross Profit 5909 5856 4980 5728 5873 6232 5665 6242 6715 7059
Gross Margin 18.2% 17.9% 16.1% 18.5% 19.0% 19.6% 18.5% 20.2% 18.6% 17.9% SG&A Exp. 1964 2030 2221 2039 1984 1937 1921 2006 2258 2411 D&A Exp. 569 592 590 525 496 481 453 441 763 829
Operating Profit 3945 3826 2759 3689 3889 4295 3744 4236 4457 4648 Op. Margin 12.2% 11.7% 8.9% 11.9% 12.6% 13.5% 12.3% 13.7% 12.3% 11.8% Net Profit 2624 2526 -332 2357 2533 3036 2572 2912 3345 3484
Net Margin 8.1% 7.7% -1.1% 7.6% 8.2% 9.6% 8.4% 9.4% 9.2% 8.9% Free Cash Flow 2616 2780 2170 2675 3307 2038 1771 3448 2458 1994
Income Tax 1162 1166 854 1125 1129 1183 977 1165 727 718
Balance Sheet Metrics Year 2010 2011 2012 2013 2014 2015 2016 2017 2018 2019
Total Assets 32545 34883 34309 35494 35337 31997 33172 35046 45408 48841 Cash & Equivalents 2613 2649 3296 5301 4388 2785 2334 2983 963 902
Acc. Receivable 3848 4429 4204 4370 4050 3446 3399 3617 3759 3544 Inventories 2158 7478 7740 7670 7812 7723 5118 5303 5977 6306
Goodwill & Int. 14641 15389 13431 12976 12643 12206 12123 12616 22179 21992 Total Liabilities 19229 21651 22919 20993 23508 21259 22871 23611 33676 35264
Accounts Payable 2736 2895 2469 2216 2057 1964 2538 3207 3179 3162 Long-Term Debt 3203 3907 3908 3909 3893 3399 3888 3982 12417 11930
Total Equity 13316 13232 11390 14501 11829 10738 10301 11435 11732 13577 D/E Ratio 0.24 0.30 0.34 0.27 0.33 0.32 0.38 0.35 1.06 0.88
Profitability & Per Share Metrics Year 2010 2011 2012 2013 2014 2015 2016 2017 2018 2019
Return on Assets 8.2% 7.5% -1.0% 6.8% 7.2% 9.0% 7.9% 8.5% 8.3% 7.4% Return on Equity 20.4% 19.0% -2.7% 18.2% 19.2% 26.9% 24.4% 26.8% 28.9% 27.5%
ROIC 16.0% 15.0% -2.0% 14.0% 14.8% 20.3% 18.2% 19.7% 16.9% 14.0% Shares Out. 372 356 354 353 332 311 302 297 289 290
Revenue/Share 84.28 88.91 87.71 87.50 90.39 97.29 98.46 101.67 120.98 135.3 FCF/Share 6.79 7.56 6.14 7.57 9.69 6.24 5.71 11.32 8.22 6.86
Note: All figures in millions of U.S. Dollars unless per share or indicated otherwise.

Return to Top 10 List
11

Return to Top 10 List
12
Note: General Dynamics has paid large special dividends in the past, two of which are truncated in this image for better readability of the
normal quartlerly dividend.

13
Return to Top 10 List
3M Co. (MMM)
Overview & Current Events
The 3M Company is an industrial conglomerate that sells more than 60,000 products that are used in a
variety of settings, including offices, schools, residences, and hospitals. The company produces
products that are consumable, and are therefore purchased on a recurring basis, creating relatively
stable revenue over time. 3M has nearly 100,000 employees globally and produces about $32 billion in
annual revenue. The company is organized into four operating segments: Safety & Industrial,
Healthcare, Transportation & Electrics, and Consumer. 3M’s market capitalization is $101 billion.
3M reported third quarter earnings on October 27th, with results coming in better than expectations.
Revenue was up 5.1% year-over-year to $8.4 billion, although local-currency organic growth was just
0.9%, with the balance made up from acquisitions. North America saw organic sales climb by 3.4%,
although this strength was offset by weakness in other geographic areas. Safety & Industrial sales grew
nearly 7% in Q3, Transportation & Electric revenue was down by 7%, Healthcare rose 8%, and
Consumer sales rose more than 5%.
Adjusted free cash flow, which is critical for 3M considering how much capital it returns to
shareholders via share repurchases and dividends, rose 13% year-over-year to $2.2 billion. For the first
three quarters of the year, adjusted free cash flow was up 19% to $4.6 billion. 3M used some of that to
retire $1.3 billion in debt in the third quarter, in addition to paying its dividend. Adjusted earnings-per-
share fell 6% year-over-year to $2.43 in Q3. We now expect full-year adjusted earnings-per-share of
$8.35, which would be 3M’s weakest performance since 2016.
Safety
3M’s greatest competitive advantage is in its constant pursuit of innovation. 3M’s catalog is full of
products it developed in-house over the years, and it has been willing and able to acquire businesses
that fit its long-term plans for stability and growth. Decades of executing this strategy have left 3M in
a strong competitive position, offering tens of thousands of products people all over the world use
every day. The company also boasts a portfolio of more than 100,000 unique patents, and that list is
growing constantly.
3M isn’t necessarily safe from recessions given its wide and deep product portfolio, but it did cope
with the Great Recession well, seeing a swift rebound in earnings once it ended. The COVID recession
has harmed earnings, but we see 3M as rebounding rather quickly from 2021 forward.
3M has a 62-year streak of dividend increases, putting it in extremely rare company with the rest of the
Dividend Kings. Given that the projected payout ratio for this year is 70% during a year when earnings
are being depressed by a negative shock from COVID, we see 3M’s dividend safety as outstanding.
We do not see a scenario where 3M would be forced to cut its dividend.
Growth Prospects
3M has a decades-long history of producing higher dividends for shareholders. It is able to do this
through a deep and wide product catalog that offers diversification for a variety of customers.
Although growth can be choppy, we see the payout rising for many years to come.
Key Statistics, Ratios, & Metrics Years of Dividend Increases: 62 5-Year Growth Estimate: 5.0%
Dividend Yield: 3.3% Most Recent Dividend Increase: 2.0%
Dividend Risk Score: A Stock Price: $176

Return to Top 10 List
14
Income Statement Metrics Year 2010 2011 2012 2013 2014 2015 2016 2017 2018 2019
Revenue 26662 29611 29904 30871 31821 30274 30109 31657 32765 32136
Gross Profit 12831 13918 14219 14765 15374 14891 14991 15602 16083 15000
Gross Margin 48.1% 47.0% 47.5% 47.8% 48.3% 49.2% 49.8% 49.3% 49.1% 46.7%
SG&A Exp. 5479 6170 6102 6384 6469 6229 6311 6626 7602 7029
Operating Profit 1120 1236 1288 1371 1408 1435 1474 1544 1488 1593
Op. Margin 22.2% 20.9% 21.7% 21.6% 22.4% 22.8% 23.0% 22.4% 20.3% 18.9%
Net Profit 4085 4283 4444 4659 4956 4833 5050 4858 5349 4570
Net Margin 15.3% 14.5% 14.9% 15.1% 15.6% 16.0% 16.8% 15.3% 16.3% 14.2%
Free Cash Flow 4083 3905 3816 4152 5133 4959 5242 4867 4862 5371
Income Tax 1592 1674 1840 1841 2028 1982 1995 2679 1637 1130
Balance Sheet Metrics Year 2010 2011 2012 2013 2014 2015 2016 2017 2018 2019
Total Assets 30156 31616 33876 33550 31209 32883 32906 37987 36500 44659
Cash & Equivalents 3377 2219 2883 2581 1897 1798 2398 3053 2853 2353
Acc. Receivable 3615 3867 4061 4253 4238 4154 4392 4911 5020 4791
Inventories 3155 3416 3837 3864 3706 3518 3385 4034 4366 4134
Goodwill & Int. 8640 8963 9310 9033 8485 11850 11486 13449 12708 19823
Total Liabilities 14139 15754 15836 15602 18067 21415 22563 26365 26652 34533
Accounts Payable 1662 2159 2278 2346 2340 2260 1798 1945 2266 2228
Long-Term Debt 5452 5166 6001 6009 6811 10797 11650 13949 14622 20313
Total Equity 15663 15420 17575 17502 13109 11429 10298 11563 9796 10063
D/E Ratio 0.35 0.34 0.34 0.34 0.52 0.94 1.13 1.21 1.49 2.02
Profitability & Per Share Metrics Year 2010 2011 2012 2013 2014 2015 2016 2017 2018 2019
Return on Assets 14.2% 13.9% 13.6% 13.8% 15.3% 15.1% 15.4% 13.7% 14.4% 11.3%
Return on Equity 28.7% 27.6% 26.9% 26.6% 32.4% 39.4% 46.5% 44.4% 50.1% 46.0%
ROIC 20.2% 20.2% 19.7% 19.4% 22.6% 22.9% 22.8% 20.4% 21.4% 16.6%
Shares Out. 712 695 687 663 635 609 597 595 585 582
Revenue/Share 36.75 41.18 42.52 44.51 48.07 47.51 48.66 51.67 54.43 54.92
FCF/Share 5.63 5.43 5.43 5.99 7.75 7.78 8.47 7.94 8.08 9.18
Note: All figures in millions of U.S. Dollars unless per share or indicated otherwise.

15
Return to Top 10 List

Return to Top 10 List
16

17
Return to Top 10 List
Hormel Foods Corp. (HRL)
Overview & Current Events
Hormel Foods was founded all the way back in 1891. Since that time, it has grown into a juggernaut in
the food products industry, with ~$10 billion in annual revenue. It has broadened its product line over
the years with multiple acquisitions. Today, Hormel sells its products in 80 countries. Some of its core
brands include Skippy, SPAM, Applegate, Justin’s, Jennie-O, and more than 30 others.
Hormel reported fourth-quarter and full-year earnings on November 24th, 2020 with results coming in
weaker than expected on both the top and bottom lines. For the fourth fiscal quarter, total revenue
declined 3% to $2.4 billion. Organic volume fell 3% and organic sales dropped 4%, with the additional
decline from weak pricing and an unfavorable mix. By operating segment, Grocery Products revenue
fell 1%, Refrigerated Foods fell 5%, and Jennie-O Turkey Store declined 6%. Helping to offset these
declines was the International & Other segment, which grew sales by 8% for the quarter. Retail sales
in the U.S. increased 7% as more consumers stayed at home, but foodservice revenue declined 23% for
the quarter due to widespread restaurant closures amid the coronavirus pandemic.
Safety
Hormel’s main competitive advantage is its strong brands. It has approximately 40 products that are
either #1 or #2 in their category. Hormel has brands that are proven, and that leadership position is
difficult for competitors to supplant. In addition, Hormel has a global network of distributors that few
food companies can rival.
Hormel’s earnings-per-share actually grew during the Great Recession while most of the world was in
rather dire straits, a testament to the stock’s defensive nature. With an expected dividend payout ratio
of approximately 55% for fiscal 2021, we view the dividend as highly secure.
Growth Prospects
Hormel has an impressive history of generating long-term growth. The company’s recession-resilience
and growth has allowed it to increase its dividend for 55 consecutive years. Hormel is on the exclusive
list of Dividend Kings. It has also paid 369 consecutive quarterly dividends.
We expect 6% annual earnings-per-share growth for Hormel over the next five years. Organic growth
through price increases, as well as external growth through acquisitions, are the main drivers of future
sales growth. Share buybacks will incrementally boost earnings-per-share growth as well.
We expect Hormel to increase its dividend by 5% per year over the next five years. This would be in-
line with the company’s recent dividend increases, including its most recent 5.4% raise on November
23rd.
Key Statistics, Ratios, & Metrics Years of Dividend Increases: 55 5-Year Growth Estimate: 6.0%
Dividend Yield: 2.0% Most Recent Dividend Increase: 5.4%
Dividend Risk Score: A Stock Price: $48

18
Return to Top 10 List
Income Statement Metrics Year 2011 2012 2013 2014 2015 2016 2017 2018 2019 2020
Revenue 7895 8231 8752 9316 9264 9523 9168 9546 9497 9,608
Gross Profit 1334 1332 1413 1565 1809 2158 1997 1979 1885 1,826
Gross Margin 16.9% 16.2% 16.1% 16.8% 19.5% 22.7% 21.8% 20.7% 19.8% 19.0%
SG&A Exp. 619 606 627 651 744 872 759 841 728 761
D&A Exp. 124 119 125 130 133 132 131 162 165 206
Operating Profit 716 726 785 914 1065 1286 1237 1138 1157 1,065
Operating Margin 9.1% 8.8% 9.0% 9.8% 11.5% 13.5% 13.5% 11.9% 12.2% 11.1%
Net Profit 474 500 526 603 686 890 847 1012 979 908
Net Margin 6.0% 6.1% 6.0% 6.5% 7.4% 9.3% 9.2% 10.6% 10.3% 9.5%
Free Cash Flow 394 385 531 588 848 784 813 852 629 761
Income Tax 240 253 268 316 370 427 432 169 231 206
Balance Sheet Metrics Year 2011 2012 2013 2014 2015 2016 2017 2018 2019 2020
Total Assets 4244 4564 4916 5456 6140 6370 6976 8142 8109 9,908
Cash & Equivalents 463 682 434 334 347 415 444 459 673 1,714
Accounts Receivable 461 507 552 610 606 591 618 600 574 702
Inventories 886 951 968 1055 993 986 921 964 1042 1,073
Goodwill & Int. Ass. 763 754 1313 1781 2527 2738 3147 3921 3516 3,689
Total Liabilities 1585 1739 1599 1844 2138 1919 2036 2537 2183 3,478
Accounts Payable 390 386 387 484 495 482 553 619 590 645
Long-Term Debt 250 250 250 250 435 250 250 625 250 1,304
Shareholder’s Equity 2657 2819 3311 3606 3998 4448 4936 5601 5921 6,426
D/E Ratio 0.09 0.09 0.08 0.07 0.11 0.06 0.05 0.11 0.04 0.20
Profitability & Per Share Metrics Year 2011 2012 2013 2014 2015 2016 2017 2018 2019 2020
Return on Assets 11.4% 11.4% 11.1% 11.6% 11.8% 14.2% 12.7% 13.4% 12.0% 10.1%
Return on Equity 18.8% 18.3% 17.2% 17.4% 18.0% 21.1% 18.0% 19.2% 17.0% 14.7%
ROIC 16.7% 16.7% 15.8% 16.2% 16.5% 19.5% 17.1% 17.7% 15.8% 13.1%
Shares Out. 532 528 526 527 527 528 528 529 544 548
Revenue/Share 14.52 15.30 16.19 17.24 17.12 17.56 17.00 17.55 17.42 17.58
FCF/Share 0.72 0.72 0.98 1.09 1.57 1.45 1.51 1.57 1.15 1.39
Note: All figures in millions of U.S. Dollars unless per share or indicated otherwise.

19
Return to Top 10 List

20
Return to Top 10 List

21
Return to Top 10 List
Amgen Inc. (AMGN)
Overview & Current Events
Amgen is the largest independent biotech company in the world. Amgen discovers, develops,
manufactures, and sells medicines that treat serious illnesses. The company focuses on six therapeutic
areas: cardiovascular disease, oncology, bone health, neuroscience, nephrology, and inflammation.
Amgen announced earnings results for the third quarter on 10/28/20. Revenue increased 12% to $6.4
billion, while adjusted earnings-per-share (EPS) increased 19.4% to $4.37. Revenue and EPS both beat
consensus estimates. The company had volume growth of 18%, which was partially offset by lower
net selling prices. Sales for Enbrel, which treats rheumatoid arthritis and remains Amgen’s top
grossing product, were down 3%. Enbrel lost market share in the quarter and was also impacted by
lower growth in the rheumatology sector as a whole due to COVID-19. Offsetting this decline was the
bone health drug, Prolia, which grew sales by 11%, due mostly to volume gains.
The company also revised its guidance for the year, narrowing its revenue forecast but raising its
earnings forecast. Amgen expects revenue of $25.1 billion to $25.5 billion, from $25 billion to $25.6
billion previously. Adjusted EPS is now expected in a range of $15.80 to $16.15 for 2020, up from
$15.10 to $15.75 previously.
Safety
Amgen’s competitive advantages include its strong pharmaceutical assets as well as its robust pipeline.
Amgen spent 18.1% of its 2019 sales on research and development. As a result, it has a well-stocked
pipeline to fuel its future growth.
The company has also demonstrated resilience during recessions, as people will seek treatment for their
health issues regardless of economic conditions. The company has a reasonably low payout ratio of
40% expected for 2020, which will allow it to continue to raise its dividend going forward, even in a
prolonged recession.
Growth Prospects
We expect 9% annual earnings-per-share growth over the next five years for Amgen. This earnings-
per-share growth will be achieved through a combination of rising revenue as well as share
repurchases.
While Amgen is struggling with falling sales for legacy products such as Neulasta and Enbrel, new
products are generating growth for Amgen. For example, Repatha, which is used to control
cholesterol, grew sales by 22% in large part from a 60% increase in volume. Separately, Otezla, which
is used to treat inflammatory diseases, generated 11% year-over-year sales growth. Lastly, share
buybacks will boost earnings-per-share growth. Amgen repurchased 3 million shares at an average
share price of $251 during the third quarter (~0.5% of shares outstanding), and it still has $4.2 billion
remaining on its share repurchase authorization.
Key Statistics, Ratios, & Metrics Years of Dividend Increases: 10 5-Year Growth Estimate: 9.0%
Dividend Yield: 3.1% Most Recent Dividend Increase: 10.0%
Dividend Risk Score: B Stock Price: $231

22
Return to Top 10 List
Income Statement Metrics Year 2010 2011 2012 2013 2014 2015 2016 2017 2018 2019
Revenue 15,053 15,582 17,265 18,676 20,063 21,662 22,991 22,849 23,747 23,362
Gross Profit 12,833 12,874 14,066 15,330 15,641 17,435 18,829 18,780 19,646 19,006
Gross Margin 85.3% 82.6% 81.5% 82.1% 78.0% 80.5% 81.9% 82.2% 82.7% 81.4%
SG&A Exp. 3,983 4,499 4,814 5,184 4,699 4,846 5,062 4,870 5,332 5,150
D&A Exp. 1,017 1,060 1,088 1,286 2,092 2,108 2,105 1,955 1,946 2,206
Operating Profit 5,545 4,312 5,577 5,867 6,191 8,470 9,794 9,973 10,263 9,674
Op. Margin 36.8% 27.7% 32.3% 31.4% 30.9% 39.1% 42.6% 43.6% 43.2% 41.4%
Net Profit 4,627 3,683 4,345 5,081 5,158 6,939 7,722 1,979 8,394 7,842
Net Margin 30.7% 23.6% 25.2% 27.2% 25.7% 32.0% 33.6% 8.7% 35.3% 33.6%
Free Cash Flow 5,207 4,552 5,168 5,598 7,949 9,137 9,616 10,513 10,558 9,150
Income Tax 690 467 664 184 427 1,039 1,441 7,618 1,151 1,296
Balance Sheet Metrics Year 2010 2011 2012 2013 2014 2015 2016 2017 2018 2019
Total Assets 43,486 48,871 54,298 66,125 69,009 71,449 77,626 79,954 66,416 59,707
Cash & Equivalents 3,287 6,946 3,257 3,805 3,731 4,144 3,241 3,800 6,945 6,037
Acc. Receivable 2,335 2,896 2,518 2,697 2,546 2,995 3,165 3,237 3,580 4,057
Inventories 2,022 2,484 2,744 3,019 2,647 2,435 2,745 2,834 2,940 3,584
Goodwill & Int. 13,564 14,334 16,630 28,230 27,481 26,428 25,030 23,370 22,142 34,116
Total Liabilities 19,542 29,842 35,238 44,029 43,231 43,366 47,751 54,713 53,916 50,034
Accounts Payable 716 642 905 787 995 965 917 1,352 1,207 1,371
Long-Term Debt 13,362 21,428 26,529 32,128 30,715 31,429 34,596 35,342 33,929 29,903
Total Equity 23,944 19,029 19,060 22,096 25,778 28,083 29,875 25,241 12,500 9,673
D/E Ratio 0.56 1.13 1.39 1.45 1.19 1.12 1.16 1.40 2.71 3.09
Profitability & Per Share Metrics Year 2010 2011 2012 2013 2014 2015 2016 2017 2018 2019
Return on Assets 11.1% 8.0% 8.4% 8.4% 7.6% 9.9% 10.4% 2.5% 11.5% 12.4%
Return on Equity 19.9% 17.1% 22.8% 24.7% 21.5% 25.8% 26.6% 7.2% 44.5% 70.7%
ROIC 13.1% 9.5% 10.1% 10.2% 9.3% 12.0% 12.5% 3.2% 15.7% 18.2%
Shares Out. 932 796 756 755 760 754 738 720 640 598
Revenue/Share 15.60 17.09 21.94 24.41 26.06 28.28 30.49 31.09 35.71 38.36
FCF/Share 5.40 4.99 6.57 7.32 10.32 11.93 12.75 14.30 15.88 15.02
Note: All figures in millions of U.S. Dollars unless per share or indicated otherwise.

23
Return to Top 10 List

24
Return to Top 10 List

Return to Top 10 List
25
The Home Depot Inc. (HD)
Overview & Current Events
Home Depot was founded in 1978, and since that time has grown into the leading home improvement
retailer with almost 2,300 stores in the U.S., Canada, and Mexico. In all, Home Depot generates
annual revenue of approximately $110 billion.
Home Depot reported excellent third-quarter financial results on November 17th. Revenue of $33.5
billion increased 23% year-over-year. Sales per retail square foot increased by 23% to $553, from
$449 in the same quarter last year. Comparable sales increased 24%, including 25% growth in the U.S.
Net earnings of $3.4 billion for the quarter were up 24%, and on a per-share basis earnings rose 26% to
$3.18 per share. In addition to revenue growth, share repurchases boosted earnings-per-share (EPS)
growth as the company reduced its diluted share count by 2.0% year-over-year. Liquidity remains very
healthy as the company ended the third quarter with cash and cash equivalents equal to $15 billion.
Safety
Home Depot’s most compelling competitive advantage is its leadership position in the home
improvement industry. Not only is demand for home improvement products growing at a high rate in
the U.S., but the industry is highly concentrated with just two major operators (Home Depot and
Lowe’s) taking the bulk of market share.
Home Depot has also proven to be resilient to recessions, including the coronavirus pandemic, which
has arguably helped Home Depot as consumers spend much more time at home. Home Depot has a
projected 2020 dividend payout ratio just above 53%, which indicates a safe dividend.
Growth Prospects
Home Depot’s earnings growth has been strong in the past decade as it has successfully capitalized on
the housing and construction boom that ensued following the Great Recession of 2008-2010. E-
commerce is another growth catalyst for Home Depot, as the company has invested heavily to expand
its digital footprint. Home Depot stated that sales leveraging its digital platforms increased
approximately 80% last quarter. We see five-year annual earnings growth of 9.0%, consisting of
comparable sales in the mid-single-digits, a low single-digit tailwind from buybacks, and a steady,
boost from operating margin expansion.
Home Depot has paid 135 consecutive quarterly dividends. The company’s streak of meaningful
dividend growth should continue, as we see the payout rising at the rate of EPS growth in the next five
years. The company has room to continue raising the dividend in the years to come. Further, as Home
Depot matures it may allow for a higher payout ratio for the dividend, which would further boost its
dividend growth prospects.
Key Statistics, Ratios, & Metrics Years of Dividend Increases: 11 5-Year Growth Estimate: 9.0%
Dividend Yield: 2.2% Most Recent Dividend Increase: 10.3%
Dividend Risk Score: B Stock Price: $273

26
Return to Top 10 List
Income Statement Metrics Year 2011 2012 2013 2014 2015 2016 2017 2018 2019 2020
Revenue ($B) 68.00 70.40 74.75 78.81 83.18 88.52 94.60 100.90 108.20 110.2
Gross Profit 23304 24262 25842 26915 28389 30265 32313 34356 37160 37572
Gross Margin 34.3% 34.5% 34.6% 34.2% 34.1% 34.2% 34.2% 34.0% 34.3% 34.1%
SG&A Exp. 15849 16028 16508 16122 16280 16801 17132 17864 19513 19740
D&A Exp. 1718 1682 1684 1757 1786 1863 1973 2062 2152 2296
Operating Profit 5839 6661 7766 9166 10469 11774 13427 14681 15777 15843
Op. Margin 8.6% 9.5% 10.4% 11.6% 12.6% 13.3% 14.2% 14.5% 14.6% 14.4%
Net Profit 3338 3883 4535 5385 6345 7009 7957 8630 11121 11242
Net Margin 4.9% 5.5% 6.1% 6.8% 7.6% 7.9% 8.4% 8.6% 10.3% 10.2%
Free Cash Flow 3489 5430 5663 6239 6800 7870 8162 10134 10596 11045
Income Tax 1935 2185 2686 3082 3631 4012 4534 5068 3435 3473
Balance Sheet Metrics Year 2011 2012 2013 2014 2015 2016 2017 2018 2019 2020
Total Assets 40125 40518 41084 40518 39946 41973 42966 44529 44003 51236
Cash & Equivalents 545 1987 2494 1929 1723 2216 2538 3595 1778 2133
Acc. Receivable 1245 1395 1398 1484 1890 1570 1604 1936 1738
Inventories 10625 10325 10710 11057 11079 11809 12549 12748 13925 14531
Goodwill & Int. 1187 1120 1170 1289 1353 2102 2093 2275 2252 2254
Total Liabilities 21236 22620 23307 27996 30624 35657 38633 43075 45881 54352
Accounts Payable 4717 4856 5376 5797 5807 6565 7000 7244 7755 7787
Long-Term Debt 9749 10788 10796 14724 17197 21216 23601 27028 29202 31483
Total Equity 18889 17898 17777 12522 9322 6316 4333 1454 N/A -3116
D/E Ratio 0.52 0.60 0.61 1.18 1.84 3.36 5.45 18.59 N/A -10.10
Profitability & Per Share Metrics Year 2011 2012 2013 2014 2015 2016 2017 2018 2019 2020
Return on Assets 8.2% 9.6% 11.1% 13.2% 15.8% 17.1% 18.7% 19.7% 25.1% N/A
Return on Equity 17.4% 21.1% 25.4% 35.5% 58.1% 89.6% 149% 298% N/A 23.6%
ROIC 11.6% 13.5% 15.8% 19.3% 23.6% 25.9% 28.7% 30.6% N/A N/A
Shares Out. 1,623 1,537 1,484 1,380 1,307 1,252 1,203 1,158 1,121 1,088
Revenue/Share 41.01 44.84 49.47 54.96 61.79 68.99 76.66 85.22 94.67 100.5
FCF/Share 2.10 3.46 3.75 4.35 5.05 6.13 6.61 8.56 9.27 10.07
Note: All figures in millions of U.S. Dollars unless per share or indicated otherwise.

27
Return to Top 10 List

28
Return to Top 10 List

29
Return to Top 10 List
The Travelers Companies Inc. (TRV)
Overview & Current Events
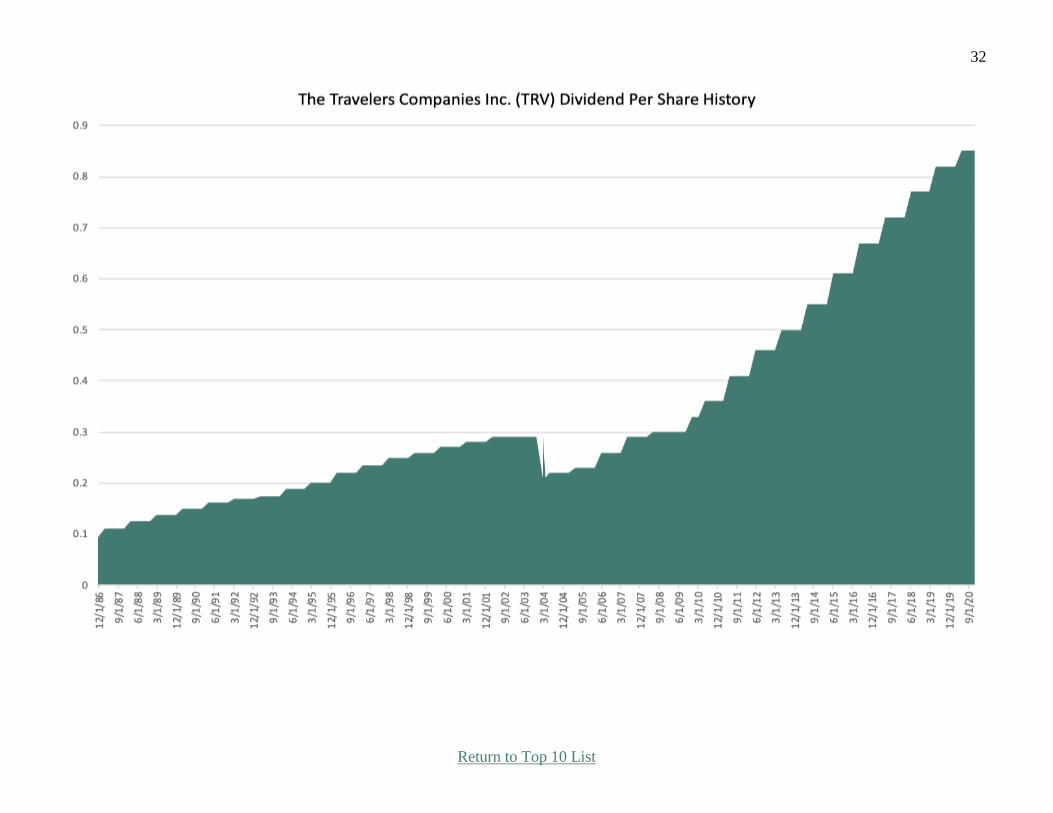
The Travelers Companies was founded in 1864 in Connecticut by two businessmen. It began with life
insurance and accident insurance and has expanded into all different kinds of property and casualty
insurance, becoming a leader in the space. Travelers offers protection products for consumers, auto
insurance, home insurance, and various types of commercial products. Today, the company produces
around $29 billion in annual revenue and the stock trades with a market capitalization of $35 billion.
Travelers released its third-quarter earnings report on October 20th, and results were slightly better than
expected on the top and bottom lines. Core earnings-per-share came to $3.12 in Q3, five cents above
expectations. Travelers saw a favorable development on its prior year reserves, higher underlying
underwriting gains, and higher net investment income. The company once again suffered from
relatively high catastrophe losses, but it wasn’t enough to offset the good news elsewhere. Travelers
saw relative strength in auto insurance as miles driven continues to be quite low due to COVID-19
restrictions, and renewal rates were up more than 8% year-over-year as strong pricing continues.
Net written premiums were up from $7.57 billion to $7.77 billion year-over-year, while the combined
ratio fell from 94.1% to 91.5%; combined ratios are expenses including claims divided by premium
revenue, so the lower, the better. This helped core return on equity more than double year-over-year,
ending the third quarter at 13.5%.
Adjusted book value was $94.89 per share at the end of the period versus $90.09 in the same quarter
last year. We estimate $8.70 in earnings-per-share for 2020 following Q3 results.
Safety
Travelers’ primary competitive advantages are its scale and its brand, both of which have been built
steadily in the past century and a half. Travelers has a globally recognizable brand that stands for
stability, and its scale affords it the ability to diversify in different types of products, not only
diversifying risk away via differing revenue streams, but also allowing for cross-selling to customers,
maximizing customer value.
Travelers isn’t necessarily susceptible to economic slowdowns, as its policies are tied to specific
events, like catastrophes, rather than economic weakness. This gives Travelers a diversifying attribute
for an investor’s portfolio.
Travelers’ dividend ranks highly for safety as the payout ratio is just 39% on this year’s earnings. We
see Travelers as having the capacity to raise the payout for years to come.
Growth Prospects
We expect Travelers to grow at 8% annually in the coming years, primarily from higher underwritten
premium growth, better margins, and its well-funded buyback program. We note that unforeseen
catastrophe losses could temporarily derail our bullish expectations.
Key Statistics, Ratios, & Metrics Years of Dividend Increases: 15 5-Year Growth Estimate: 8.0%
Dividend Yield: 2.4% Most Recent Dividend Increase: 3.7%
Dividend Risk Score: B Stock Price: $138

30
Return to Top 10 List
Income Statement Metrics Year 2010 2011 2012 2013 2014 2015 2016 2017 2018 2019
Revenue 25112 25446 25740 26191 27174 26815 27625 28902 30282 31581
SG&A Exp. 3406 3556 3610 3757 3964 4094 4154 4170 4297 4365
D&A Exp. 812 802 827 867 864 818 826 813 803 763
Net Profit 3216 1426 2473 3673 3692 3439 3014 2056 2523 2622
Net Margin 12.8% 5.6% 9.6% 14.0% 13.6% 12.8% 10.9% 7.1% 8.3% 8.3%
Free Cash Flow 3054 2169 3230 3816 3693 3434 4469 4148 4380 5205
Income Tax 1090 -74 693 1272 1397 1301 1039 674 438 516
Balance Sheet Metrics Year 2010 2011 2012 2013 2014 2015 2016 2017 2018 2019
Total Assets ($B) 105.66 104.58 104.94 103.81 103.08 100.18 100.25 103.48 104.23 110.1
Cash & Equivalents 200 214 330 294 374 380 307 344 373 494
Acc. Receivable 5497 22071 21390 20166 19920 19721 19618 20228 20661 20763
Goodwill & Int. 3867 3798 3746 3985 3915 3852 3848 4293 4282 4291
Total Liabilities 80181 80098 79533 79016 78242 76586 77024 79752 81339 84179
Accounts Payable 407 5575 5152 4626 4698 4670 4882 5049 5074 4982
Long-Term Debt 6611 6605 6350 6346 6349 6344 6437 6571 6564 6558
Total Equity 25407 24477 25405 24796 24836 23598 23221 23731 22894 25943
D/E Ratio 0.26 0.27 0.25 0.26 0.26 0.27 0.28 0.28 0.29 0.25
Profitability & Per Share Metrics Year 2010 2011 2012 2013 2014 2015 2016 2017 2018 2019
Return on Assets 3.0% 1.4% 2.4% 3.5% 3.6% 3.4% 3.0% 2.0% 2.4% 2.4%
Return on Equity 12.2% 5.7% 9.9% 14.6% 14.9% 14.2% 12.9% 8.8% 10.8% 10.7%
ROIC 9.7% 4.5% 7.9% 11.7% 11.8% 11.3% 10.1% 6.9% 8.4% 8.5%
Shares Out. 435 393 377 354 322 296 280 271 264 259
Revenue/Share 52.05 60.51 66.03 69.97 79.34 85.43 94.93 103.74 112.24 120.40
FCF/Share 6.33 5.16 8.29 10.20 10.78 10.94 15.36 14.89 16.23 19.84
Note: All figures in millions of U.S. Dollars unless per share or indicated otherwise.

31
Return to Top 10 List
32
Return to Top 10 List

33
Return to Top 10 List
Comcast Corp. (CMCSA)
Overview & Current Events
Comcast Corporation is a media, communications, and entertainment conglomerate. Its operating
segments include Cable Communications, NBCUniversal, Theme Parks, Broadcast TV, and Sky.
Collectively, through these segments, Comcast offers high-speed Internet, video, voice, wireless, cable
networks, filmed TV, and other services. Comcast was founded in 1963, has $109 billion in annual
revenue, and trades for a market capitalization of $233 billion.
Comcast reported its third-quarter earnings results on 10/29/20. For the quarter, the company’s
revenues declined 4.8% to $25.5 billion, adjusted EBITDA declined 11.3% to $7.6 billion, and
adjusted earnings-per-share (EPS) declined 17.7%. However, free cash flow rose 10.5% to nearly $2.3
billion. Comcast experienced record net additions of 556,000 Cable Communications customers in the
quarter, and also added 633,000 High-Speed Internet customers and 187,000 wireless lines.
NBCUniversal revenue fell 19%.
Safety
Comcast is one of the largest companies in the telecommunications and entertainment industry. The
whole cable industry is impacted by the cord-cutting trend, as some customers are ditching traditional
pay-TV entirely in favor of streaming services. Fortunately, consumers still need Internet service for
streaming, and Comcast has so far been able to withstand this trend through growth from its other
businesses.
We expect COVID-19 to be a temporary drag on Comcast. Another factor improving Comcast’s safety
is its balance sheet, as the company focused on deleveraging following the Sky takeover. Comcast’s
consolidated net-debt-to-adjusted-EBITDA ratio fell from 2.9x to 2.8x from Q3 2019.
Growth Prospects
We expect 7% annual earnings-per-share growth over the next five years. The company has a long
history of growth. From 2010 to 2019, its EPS grew yearly, by an average of 19% per year. We expect
a recovery as soon as the COVID-19 pandemic ends. Over the next five years, as the economy
normalizes, we see several drivers for the company’s earnings growth. Revenue growth will be driven
primarily by a higher customer count and rate increases. Although video revenue is struggling with
cord-cutting, higher revenues in the high-speed internet business have more than offset this headwind.
Comcast has had 12 consecutive annual dividend increases. The per share dividend has grown from
$0.19 in 2010 to $0.84 in 2019. The current payout ratio using expected fiscal 2020 adjusted earnings
is just 37%. The company’s dividend is well-covered by both earnings and cash flows and has room to
grow faster than earnings-per-share through payout ratio increases moving forward.
Key Statistics, Ratios, & Metrics Years of Dividend Increases: 12 5-Year Growth Estimate: 7.0%
Dividend Yield: 1.8% Most Recent Dividend Increase: 9.5%
Dividend Risk Score: B Stock Price: $51

34
Return to Top 10 List
Income Statement Metrics Year 2010 2011 2012 2013 2014 2015 2016 2017 2018 2019
Revenue 37937 55842 62570 64657 68775 74510 80736 85029 94507 108942 Gross Profit 29,400 39,246 42,641 44,987 47,863 51,960 56,388 59,674 64,815 74,502
Gross Margin 77.5% 70.3% 68.1% 69.6% 69.6% 69.7% 69.8% 70.2% 68.6% 68.4% SG&A Exp. 14,804 20,889 22,664 23,553 24,940 27,282 30,131 31,968 5,130 40,424 D&A Exp. 6,803 14,423 7,798 7,871 8,019 8,680 9,426 9,688 10,676 12,953
Operating Profit 7,980 10,721 12,179 13,563 14,904 15,998 16,831 18,018 19,009 21,125 Operating Margin 21.0% 19.2% 19.5% 21.0% 21.7% 21.5% 20.8% 21.2% 20.1% 19.4%
Net Profit 3,635 4,160 6,203 6,816 8,380 8,163 8,678 22,735 11,731 13,057 Net Margin 9.6% 7.4% 9.9% 10.5% 12.2% 11.0% 10.7% 26.7% 12.4% 12.0%
Free Cash Flow 5,682 8,084 8,217 6,555 8,403 9,616 9,004 10,106 12,588 13,269 Income Tax 2,436 3,050 3,744 3,980 3,873 4,959 5,298 -7,569 3,380 3,673
Balance Sheet Metrics Year 2010 2011 2012 2013 2014 2015 2016 2017 2018 2019
Total Assets (B) 119 158 165 159 159 167 119 158 165 159 Cash & Equivalents 5,984 1,620 10,951 1,718 3,910 2,295 5,984 1,620 10,951 1,718
Accounts Receivable 1,855 4,652 5,521 6,376 6,321 6,896 1,855 4,652 5,521 6,376 Good. & Int. Ass. (B) 78 110 109 109 109 115 78 110 109 109 Total Liabilities (B) 74 110 115 108 106 113 74 110 115 108 Accounts Payable --- 5,705 6,206 5,528 5,638 6,215 --- 5,705 6,206 5,528 Long-Term Debt 31415 39309 40,458 47,847 48,081 52,621 31,415 39,309 40,458 47,847
Shareholder’s Equity 44354 47274 49356 50694 52711 52269 44354 47274 49356 50694 D/E Ratio 0.71 0.83 0.82 0.94 0.91 1.01 0.71 0.83 0.82 0.94
Profitability & Per Share Metrics Year 2010 2011 2012 2013 2014 2015 2016 2017 2018 2019
Return on Assets 3.1% 3.0% 3.8% 4.2% 5.3% 5.0% 3.1% 3.0% 3.8% 4.2% Return on Equity 8.3% 9.1% 12.8% 13.6% 16.2% 15.6% 8.3% 9.1% 12.8% 13.6%
ROIC 4.9% 5.1% 7.0% 7.2% 8.4% 7.9% 4.9% 5.1% 7.0% 7.2% Shares Out. 5.55 5.41 5.26 5.19 5.06 4.88 4.75 4.64 4.60 4.62
Revenue/Share 6.73 10.05 11.51 12.13 13.13 14.80 6.73 10.05 11.51 12.13 FCF/Share 1.01 1.46 1.51 1.23 1.60 1.91 1.01 1.46 1.51 1.23
Note: All figures in millions of U.S. Dollars unless per share or indicated otherwise.

35
Return to Top 10 List

36
Return to Top 10 List

37
Return to Top 10 List
American Tower Corp. (AMT)
Overview & Current Events
American Tower, founded in 1995, is one of the world’s largest global Real Estate Investment Trusts
(REITs). The company specializes in owning, operating and developing multitenant communications
real estate, with a portfolio of approximately 181,000 communications sites in the United States and
internationally. Last year the $98 billion company generated $3.5 billion in Adjusted Funds From
Operations (AFFO) attributable to stockholders.
On October 29th, 2020 American Tower reported Q3 2020 results for the period ending September 30th,
2020. For the quarter total revenue increased 3.0% to $2.013 billion. Net income declined 8.4% to
$463 million. Consolidated AFFO increased 14.7% to $1.022 billion or $2.29 per share, as results
continue to prove resilient amid the pandemic.
On November 5th, 2020 American Tower announced an agreement to acquire InSite Wireless Group,
which manages approximately 3,000 communication sites (including more than 1,400 towers in the
U.S.) for $3.5 billion. This deal is expected to contribute $150 million in revenue.
Safety
American Tower enjoys a competitive advantage in its leadership in the U.S market. Not only is the
company entrenched in the space but switching costs for the company’s customers (once equipment is
installed) are quite high. Meanwhile, American Tower enjoys economies of scale as it grows larger,
with the cost to add additional tenants to a tower being effectively negligible. Further, unlike its U.S.
counterparts, American Tower is geographically diversified around the globe. This can increase risk
somewhat – for instance with currency translation and working in different operating environments –
but it insulates the firm from relying on a single country.
As of the most recent report, American Tower had long-term obligations of $24 billion, with net-debt-
to-adjusted-EBITDA of 4.5x. This leverage is moderately elevated but is offset by the company’s
long-term leases. The dividend also warrants special mention. Despite the yield not being particularly
impressive, especially for a REIT, American Tower has raised its payout every quarter dating back to
2012. The current quarterly payout is $1.21, a 19.8% increase compared to last year.
Growth Prospects
American Tower has put together an exceptional record in the last decade, growing AFFO by nearly
16% per year dating back to 2011. Moreover, many of the growth drivers of the past remain today.
The company is rooted as a leader in the U.S. market and also has been significantly expanding into
international markets. The continued increase in data usage, especially as it relates to international
countries “catching up,” will be a trend for some time. Moreover, with long-term leases in place,
American Tower has good visibility into the future.
There are a variety of risks that could formulate in the years to come including carrier consolidation,
5G disrupting the company’s macro tower business and growing off such a large base. Weighing the
positives and negatives, we are somewhat cautious with our assumption of 6% annual growth.
Key Statistics, Ratios, & Metrics Years of Dividend Increases: 10 5-Year Growth Estimate: 6.0%
Dividend Yield: 2.1% Most Recent Dividend Increase: 19.8%
Dividend Risk Score: B Stock Price: $223

38
Return to Top 10 List
Income Statement Metrics Year 2010 2011 2012 2013 2014 2015 2016 2017 2018 2019
Revenue 1985 2444 2876 3361 4100 4772 5786 6664 7440 7580
Gross Profit 1511 1823 2153 2502 3006 3463 3995 4607 5262 5364
Gross Margin 76.1% 74.6% 74.9% 74.4% 73.3% 72.6% 69.1% 69.1% 70.7% 70.8%
SG&A Exp. 230 289 327 416 447 498 543 637 733 730
D&A Exp. 461 556 644 800 1004 1285 1526 1716 2111 1778
Operating Profit 784 920 1120 1214 1487 1613 1853 1998 1905 2688
Operating Margin 39.5% 37.7% 38.9% 36.1% 36.3% 33.8% 32.0% 30.0% 25.6% 35.5%
Net Profit 373 396 637 551 825 685 956 1239 1236 1888
Net Margin 18.8% 16.2% 22.2% 16.4% 20.1% 14.4% 16.5% 18.6% 16.6% 24.9%
Free Cash Flow 674 643 846 875 1160 1438 2019 2122 2835 2761.3
Income Tax 182 125 107 60 63 158 156 31 -110 -0.2
Balance Sheet Metrics Year 2010 2011 2012 2013 2014 2015 2016 2017 2018 2019
Total Assets 10368 12242 14089 20284 21264 26904 30879 33214 33010 42802
Cash & Equivalents 884 330 369 294 313 321 787 802 1209 1501
Accounts Receivable 81 101 144 151 199 227 308 514 459 462
Goodwill & Int. Ass. 4476 5171 6049 10425 10856 13930 16345 17422 16676 18497
Total Liabilities 6863 8832 10405 16694 17210 20191 23903 26386 27111 37311
Accounts Payable 293 216 90 173 90 97 119 143 131 148
Long-Term Debt 5587 7236 8753 14478 14540 17119 18534 20205 21160 24055
Shareholder’s Equity 3501 3287 3573 3534 3954 6652 6764 6242 5336 5055
D/E Ratio 1.60 2.20 2.45 4.10 3.68 2.57 2.74 3.24 3.97 4.76
Profitability & Per Share Metrics Year 2010 2011 2012 2013 2014 2015 2016 2017 2018 2019
Return on Assets 3.9% 3.5% 4.8% 3.2% 4.0% 2.8% 3.3% 3.9% 3.7% 5.0%
Return on Equity 10.9% 11.7% 18.6% 15.5% 22.0% 12.9% 14.3% 19.1% 21.4% 36.3%
ROIC 4.5% 4.0% 5.5% 3.6% 4.5% 3.2% 3.9% 4.7% 4.6% 6.7%
Shares Out. 399 394 395 395 397 424 427 429 441 446
Revenue/Share 4.91 6.11 7.20 8.42 10.25 11.28 13.48 15.44 16.80 17.01
FCF/Share 1.67 1.61 2.12 2.19 2.90 3.40 4.70 4.92 6.40 6.20
Note: All figures in millions of U.S. Dollars unless per share or indicated otherwise.

39
Return to Top 10 List

40
Return to Top 10 List
41
Return to Top 10 List
A. O. Smith Corp. (AOS)
Overview & Current Events
A. O. Smith is a manufacturer that specializes in water heaters, boilers, and water treatment products
for commercial and residential customers. The company accrues about two-thirds of its sales from
North America, with most of the balance coming from China. A. O. Smith is a Dividend Aristocrat,
having raised its payout for 27 consecutive years. It was founded in 1874, produces $2.8 billion in
annual revenue, and trades with a market capitalization of $9.0 billion.
A. O. Smith reported third-quarter earnings on October 29th, with the company showing some
resilience in the face of COVID-related headwinds. Total revenue was up 4.4% year-over-year, with
North America leading the way with a 6% increase. Outside of the US, sales were flat, although China
did post a 4% growth rate, which was offset by weakness everywhere else.
Earnings-per-share were $0.66 during the quarter, up from $0.53 in the year-ago period. A. O. Smith
once again showed it can generate operating leverage as revenue rises.
A. O. Smith guided for earnings-per-share of $1.95 to $1.98 for the full year, which, if achieved, would
represent a 10% decline from last year. However, we see reduced demand for the company’s products
as a temporary condition from COVID-related shutdowns, and therefore believe we’ll see a meaningful
rebound in 2021 and beyond. We see long-term earnings power at $2.30 per share for this reason.
Safety
A. O. Smith’s competitive advantage is its specialized knowledge in a niche market. Water heaters and
treatment products are a relatively small market, but A. O. Smith has developed a brand advantage over
time that resonates with customers. It is leveraged to new construction and remodeling of both
residences and commercial properties, so the COVID-related shutdowns we’ve seen have reduced the
market opportunity for A. O. Smith and its competitors temporarily. We see A. O. Smith’s position
within that market as remaining intact when growth, particularly in China, does return.
A. O. Smith isn’t necessarily safe during a recession given its leverage to construction and housing
markets. When these industries face downturns, the demand for new water heaters and treatment
products declines. However, A. O. Smith has managed to raise its payout during very difficult
economic times, including three recessions, so while it has some exposure to economic conditions, it
has been able to weather the storm in the past, and we believe it will again in the future.
A. O. Smith’s dividend safety is quite strong given that its payout ratio for this year is just over half of
projected earnings, even in a down year. Under normalized conditions, we see the payout at less than
half of earnings, which gives A. O. Smith the flexibility to continue to raise the payout even when
earnings decline, as projected for 2020.
Growth Prospects
We see A. O. Smith as producing 6% annual earnings-per-share growth, although if another
recessionary period strikes, that growth may be uneven. We see China as a primary growth driver for
the company as it continues to build its brand in that enormous and growing market.
Key Statistics, Ratios, & Metrics Years of Dividend Increases: 27 5-Year Growth Estimate: 6.0%
Dividend Yield: 1.9% Most Recent Dividend Increase: 8.3%
Dividend Risk Score: B Stock Price: $55

42
Return to Top 10 List
Income Statement Metrics Year 2010 2011 2012 2013 2014 2015 2016 2017 2018 2019
Revenue 1,489 1,711 1,939 2,154 2,356 2,537 2,686 2,997 3,188 2,993
Gross Profit 446 513 652 774 859 1,010 1,114 1,232 1,306 1,181
Gross Margin 29.9% 30.0% 33.6% 35.9% 36.5% 39.8% 41.5% 41.1% 41.0% 39.5%
SG&A Exp. 329 373 451 525 572 611 663 723 754 716
D&A Exp. 41 47 55 60 60 63 65 70 72 78
Operating Profit 117 140 202 249 287 399 452 510 552 465
Operating Margin 7.9% 8.2% 10.4% 11.6% 12.2% 15.7% 16.8% 17.0% 17.3% 15.5%
Net Profit 112 306 159 170 208 283 327 297 444 370
Net Margin 7.5% 17.9% 8.2% 7.9% 8.8% 11.2% 12.2% 9.9% 13.9% 12.4%
Free Cash Flow 71 5 74 182 178 279 366 232 364 392
Income Tax 17 50 71 67 79 120 136 224 114 102
Balance Sheet Metrics Year 2010 2011 2012 2013 2014 2015 2016 2017 2018 2019
Total Assets 2,112 2,349 2,279 2,392 2,515 2,629 2,891 3,197 3,072 3,058
Cash & Equivalents 119 463 267 381 319 324 330 347 260 374
Accounts Receivable 368 425 459 475 501 519 593 647 590
Inventories 147 168 163 193 208 223 251 297 305 303
Goodwill & Int. Ass. 430 787 774 758 737 712 800 825 806 884
Total Liabilities 1,231 1,263 1,085 1,063 1,134 1,187 1,376 1,553 1,355 1,391
Accounts Payable 263 303 329 387 394 425 529 535 544 510
Long-Term Debt 261 462 244 192 224 249 324 410 221 284
Shareholder’s Equity 881 1,086 1,194 1,329 1,381 1,442 1,515 1,645 1,717 1,667
D/E Ratio 0.30 0.43 0.20 0.14 0.16 0.17 0.21 0.25 0.13 0.17
Profitability & Per Share Metrics Year 2010 2011 2012 2013 2014 2015 2016 2017 2018 2019
Return on Assets 5.5% 13.7% 6.9% 7.3% 8.5% 11.0% 11.8% 9.7% 14.2% 12.1%
Return on Equity 13.5% 31.1% 13.9% 13.5% 15.3% 20.0% 22.1% 18.8% 26.4% 21.9%
ROIC 10.2% 22.7% 10.6% 11.5% 13.3% 17.2% 18.5% 15.2% 22.2% 19.0%
Shares Out. 183 184 185 182 179 176 173 172 171 164
Revenue/Share 8.07 9.18 10.41 11.61 12.95 14.17 15.19 17.16 18.51 17.95
FCF/Share 0.39 0.03 0.40 0.98 0.98 1.56 2.07 1.33 2.11 2.35
Note: All figures in millions of U.S. Dollars unless per share or indicated otherwise.

43
Return to Top 10 List

44
Return to Top 10 List

45
Disclaimer
Nothing presented herein is, or is intended to constitute, specific investment advice. Nothing in this newsletter should be construed as a recommendation to follow any investment strategy or allocation. Any forward-looking statements or forecasts are based on assumptions and actual results are expected to vary from any such statements
or forecasts. No reliance should be placed on any such statements or forecasts when making any investment decision. While Sure Dividend has used reasonable efforts
to obtain information from reliable sources, we make no representations or warranties as to the accuracy, reliability or completeness of third-party information presented herein. No guarantee of investment performance is being provided and no inference to the contrary should be made. There is a risk of loss from an investment in
securities. Past performance is not a guarantee of future performance.
Closing Thoughts - Not All Sectors Are Equal -
There are currently only 30 securities that have increased their per share dividend payments for 50 or more consecutive years. Collectively, these 30 securities are called the ‘Dividend Kings.’ They represent the ultimate in historical long-term dividend growth.
The sector breakdown for The Dividend Kings is decidedly not equal.
Source: Data from Sure Dividend
The consumer defensive and industrials sectors dominate the Dividend Kings list. Together, these two sectors account for more than half of the Dividend Kings.
This month’s Top 10 is similar to the Dividend Kings constituent breakdown in that 5 of the Top 10 are either industrials (GD, MMM, AOS) or consumer defensive (ADM, HRL) securities.
The consumer defensive sector clearly changes slower than most other sectors. Snacks, beverages, and disposable paper products haven’t changed all that much in decades. And they are very likely not to change significantly for decades to come.
The Dividend Kings in the industrial sector tend to be diversified manufacturers. They are companies that continuously improve and innovate. This corporate know-how and longevity, which results in more money to spend on research and development, create a durable advantage.
Thanks,
Ben Reynolds
The next Sure Passive Income Newsletter publishes on Sunday, January 17th, 2021

46
Buying & Ranking Criteria The method we use to come up with the Top 10 list for The Sure Passive Income Newsletter is as follows: Note: Ranking data is from the preceding Wednesday’s Sure Analysis data update.
1. Filter our Sure Analysis Research Database universe of securities for: - Dividend yield greater than or equal to the S&P 500’s - A & B Dividend Risk Scores - Dividend yield greater than or equal to the security’s 10-year historical dividend yield - U.S. securities only (no international securities)
2. Rank securities by 5-year forward dividend growth rate and 5-year historical price standard deviation
3. Sort securities by their average ranking between standard deviation and expected growth rate
4. No more than three companies per sector
5. Veto any securities from the Top 10 as necessary after qualitative analysis
6. The Top 10 is the 10 highest ranked securities from steps 1 through 5
7. “A” Dividend Risk Score securities rank ahead of “B” Dividend Risk Score securities within the Top 10. Within each Dividend Risk Score category, the Top 10 order will be sorted by dividend yield + expected 5-year growth rate (the higher the better).
To receive an “A” Dividend Risk Score, a security must be in the top 20% for dividend safety. To receive a “B” Dividend Risk Score, a security must be in the top 40% for dividend safety. The formula for the Dividend Risk Score is below: Dividend Risk Score (Raw) = Payout Ratio x 100 – # Years of Rising Dividends + 50 if deemed risky during a recession We view securities with “A” and “B” Dividend Risk Scores as generally having secure dividends that are very unlikely to be reduced in the near future. Note that the Dividend Risk Score factors in dividend history also. The combination of quality (low price standard deviation and our Dividend Risk Score), with ‘fair or better price’ dividend yield (yield greater than the S&P 500 and the security’s 10-year historical average), and growth (5-year expected growth rate) creates a compelling system to find buy and hold forever securities for rising passive income.

47
Portfolio Building Guide
The process of building a buy and hold rising passive income portfolio is outlined on this page.
Each month invest in the top-ranked security in which you own the smallest dollar amount out of
the Top 10. If you already have 25% or more of your equity portfolio in a specific sector, avoid
purchasing additional securities from that sector until a purchase would not push your allocation in the
sector above 25%.
Over time, you will build a diversified portfolio of high-quality securities likely to pay you rising
income over time.
Alternatively, the Top 10 list is also useful as an idea generation tool for those with a different portfolio
allocation plan.
Examples Portfolio 1 Portfolio 2
Ticker Name Amount Ticker Name Amount
ADM Archer-Daniels-Midland $ 1,002 ADM Archer-Daniels-Midland $ 4,374
GD General Dynamics $ - GD General Dynamics $ 4,878
MMM 3M $ - MMM 3M $ 4,353
HRL Hormel $ - HRL Hormel $ 7,428
AMGN Amgen $ - AMGN Amgen $ 3,309
HD Home Depot $ - HD Home Depot $ 8,099
TRV Travelers $ - TRV Travelers $ 5,629
CMCSA Comcast $ - CMCSA Comcast $ 2,176
AMT American Tower $ - AMT American Tower $ 1,079
AOS A. O. Smith $ - AOS A. O. Smith $ 4,864
- If you had portfolio 1, you would buy GD, the top-ranked security you own least.
- If you had portfolio 2, you would buy AMT, the top-ranked security you own least.
If you have an existing portfolio or a large lump sum to invest, you may wish to switch over to the Sure
Passive Income strategy over a 30-month period. Each month take 1/30 of your initial portfolio value
and buy the top-ranked security you own the least out of the Top 10, subject to the 25% sector
allocation rule discussed earlier. A portfolio with 30 securities purchased with equal dollar amounts
will have a high level of firm-specific diversification.
There’s no upper limit to the number of securities that can be held in a buy and hold portfolio because
securities need not be monitored as closely after purchasing. As a result, investors still in the
accumulation phase can further diversify by adding a greater number of securities over time.
If you are not ready to use the dividend income from your portfolio, set your securities to reinvest
dividends so that your portfolio automatically reinvests its dividend proceeds. This will have the effect
of compounding your portfolio’s dividend income stream faster, as you benefit from having more
shares in the companies and will likely be getting rising dividends from each share as well.
This simple investing process will build a diversified portfolio very likely to generate rising passive
income over time.

48
Past Recommendations & Performance
Every past recommendation in The Sure Passive Income Newsletter is shown below, along with the
date it would’ve been first purchased1, and total returns since the initial recommendation.
Name Ticker First Purchase Date Total Return
Honeywell HON 10/19/2020 23.9%
Colgate-Palmolive CL 10/19/2020 8.0%
Coca-Cola KO 10/19/2020 7.3%
Medtronic MDT 10/19/2020 6.3%
Atmos Energy ATO 10/19/2020 6.2%
Johnson & Johnson JNJ 10/19/2020 6.1%
Republic Services RSG 10/19/2020 5.4%
Mondelez MDLZ 10/19/2020 1.5%
NextEra Energy NEE 10/19/2020 0.6%
Lockheed Martin LMT 10/19/2020 -7.2%
Comcast CMCSA 11/16/2020 3.4%
National Fuel Gas NFG 11/16/2020 3.0%
Travelers TRV 11/16/2020 2.4%
General Dynamics GD 11/16/2020 -0.2%
Home Depot HD 11/16/2020 -1.3%
Amgen AMGN 11/16/2020 -2.9%
J.M. Smucker SJM 11/16/2020 -4.3%
American Tower AMT 11/16/2020 -7.9%
Hormel Foods HRL 11/16/2020 -9.0%
Archer Daniels Midland ADM 12/21/2020 N/A
A.O. Smith AOS 12/21/2020 N/A
3M MMM 12/21/2020 N/A
Note: Performance data is through the morning of December 18th, 2020.
1 This is the closing price from the first trading day after The Sure Passive Income Newsletter publishes.

49
List of Securities by Dividend Risk Score
Each of the securities in the Sure Analysis Research Database are grouped according to Dividend
Risk Score and sorted (from highest to lowest) by expected 5-year growth rate. Dividend or
distribution yield is included next to each security’s ticker symbol. The Dividend Risk Score uses
payout ratio, dividend history, and recession resiliency to measure a company’s dividend safety.
You can learn more about how the score is calculated in the Sure Analysis Glossary. See our
‘Buying and Ranking Criteria’ for more information.
A-Rated Dividend Risk Securities 1. Tencent Holdings Ltd. (TCEHY): 0%
2. Ecolab, Inc. (ECL): 0.8%
3. Stryker Corp. (SYK): 1%
4. H.B. Fuller Company (FUL): 0.9%
5. CSX Corp. (CSX): 1.1%
6. Visa Inc (V): 0.6%
7. Northrop Grumman Corp. (NOC): 1.9%
8. Thermo Fisher Scientific Inc. (TMO): 0.2%
9. L3Harris Technologies Inc (LHX): 1.8%
10. Becton, Dickinson And Co. (BDX): 1.3%
11. Dollar General Corp. (DG): 0.7%
12. Parker-Hannifin Corp. (PH): 1.3%
13. Nike, Inc. (NKE): 0.7%
14. Jack Henry & Associates, Inc. (JKHY): 1.1%
15. Donaldson Co. Inc. (DCI): 1.5%
16. Costco Wholesale Corp (COST): 3.4%
17. Franklin Electric Co., Inc. (FELE): 0.9%
18. Apple Inc (AAPL): 0.6%
19. Albemarle Corp. (ALB): 1.1%
20. West Pharmaceutical Services, Inc. (WST): 0.2%
21. Roper Technologies Inc (ROP): 0.5%
22. McCormick & Co., Inc. (MKC): 1.3%
23. Oracle Corp. (ORCL): 1.5%
24. S&P Global Inc (SPGI): 0.8%
25. Tennant Co. (TNC): 1.3%
26. Ameriprise Financial Inc (AMP): 2.1%
27. SEI Investments Co. (SEIC): 1.2%
28. Moody`s Corp. (MCO): 0.8%
29. Applied Materials Inc. (AMAT): 1%
30. Dover Corp. (DOV): 1.6%
31. Stanley Black & Decker Inc (SWK): 1.6%
32. PPG Industries, Inc. (PPG): 1.4%
33. Microsoft Corporation (MSFT): 1%
34. Medtronic Plc (MDT): 1.9%
35. Computer Services, Inc. (CSVI): 0%
36. Cintas Corporation (CTAS): 1%
37. SJW Group (SJW): 1.8%
38. W.W. Grainger Inc. (GWW): 1.5%
39. Ping AN Insurance (Group) Co. of China, Ltd. (PNGAY): 0%
40. Enterprise Bancorp, Inc. (EBTC): 1.9%
41. Lowe`s Cos., Inc. (LOW): 1.4%
42. Silgan Holdings Inc. (SLGN): 1.3%
43. Atmos Energy Corp. (ATO): 2.3%
44. Carlisle Companies Inc. (CSL): 1.3%
45. Church & Dwight Co., Inc. (CHD): 1.1%
46. Sherwin-Williams Co. (SHW): 0.7%
47. Abbott Laboratories (ABT): 1.3%
48. Canadian National Railway Co. (CNI): 1.2%
49. Otis Worldwide Corp (OTIS): 0.9%
50. MSA Safety Inc (MSA): 1.1%
51. Brown-Forman Corp. (BF.B): 0.9%
52. Pentair plc (PNR): 1.4%
53. Polaris Inc (PII): 2.6%
54. Mckesson Corporation (MCK): 1%
55. General Dynamics Corp. (GD): 2.8%
56. Archer-Daniels-Midland Co. (ADM): 2.9%
57. Fresenius Medical Care AG & Co. KGaA (FMS): 1.7%
58. Assurant Inc (AIZ): 1.9%
59. Johnson & Johnson (JNJ): 2.6%
60. Hormel Foods Corp. (HRL): 2%
61. Advance Auto Parts Inc (AAP): 0.5%
62. Brown & Brown, Inc. (BRO): 0.5%
63. Eaton Vance Corp. (EV): 8.6%
64. Nordson Corp. (NDSN): 0.8%
65. Textron Inc. (TXT): 0.2%
66. Carrier Global Corp (CARR): 0.4%
67. Brookfield Asset Management Inc. (BAM): 1%
68. Eagle Financial Services, Inc. (EFSI): 0%
69. Walgreens Boots Alliance Inc (WBA): 4.4%
70. Perrigo Company plc (PRGO): 1.8%
71. Farmers & Merchants Bancorp (FMCB): 0%
72. Amerisource Bergen Corp. (ABC): 1.7%
73. Genuine Parts Co. (GPC): 3.2%
74. 3M Co. (MMM): 3.3%
75. Target Corp (TGT): 1.6%
76. Brady Corp. (BRC): 1.8%
77. Sonoco Products Co. (SON): 2.8%
78. ABM Industries Inc. (ABM): 1.8%
79. RenaissanceRe Holdings Ltd (RNR): 0.8%
80. Chubb Limited (CB): 2%
81. T. Rowe Price Group Inc. (TROW): 2.4%
82. Colgate-Palmolive Co. (CL): 2%
83. Walmart Inc (WMT): 1.5%
84. Emerson Electric Co. (EMR): 2.4%
85. Stepan Co. (SCL): 0.7%
86. Expeditors International of Washington, Inc. (EXPD): 1.2%
87. RPM International, Inc. (RPM): 1.7%
88. California Water Service Group (CWT): 1.6%
89. Clorox Co. (CLX): 2.1%
90. Tractor Supply Co. (TSCO): 1.1%

50
91. Black Hills Corporation (BKH): 3.5%
92. Community Trust Bancorp, Inc. (CTBI): 4%
93. PSB Holdings Inc (WI) (PSBQ): 0%
94. Franklin Resources, Inc. (BEN): 4.3%
95. Kimberly-Clark Corp. (KMB): 3.1%
96. Gorman-Rupp Co. (GRC): 1.7%
97. Lancaster Colony Corp. (LANC): 1.6%
98. AptarGroup Inc. (ATR): 1.1%
99. Kroger Co. (KR): 2.2%
100. Matthews International Corp. (MATW): 2.9%
101. AbbVie Inc (ABBV): 4.5%
102. Northeast Indiana Bancorp Inc. (NIDB): 0%
103. Cardinal Health, Inc. (CAH): 3.5%
104. Aflac Inc. (AFL): 2.5%
105. McGrath RentCorp (MGRC): 2.5%
106. Tootsie Roll Industries, Inc. (TR): 1.2%
107. RLI Corp. (RLI): 1.9%
108. MGE Energy, Inc. (MGEE): 2%
109. UGI Corp. (UGI): 3.6%
110. American States Water Co. (AWR): 1.6%
111. Nucor Corp. (NUE): 2.8%
112. Unum Group (UNM): 4.9%
113. National Fuel Gas Co. (NFG): 4%
114. Chesapeake Financial Shares Inc (CPKF): 0%
115. Arrow Financial Corp. (AROW): 3.2%
116. Procter & Gamble Co. (PG): 2.3%
117. Middlesex Water Co. (MSEX): 1.4%
118. First Financial Corp. - Indiana (THFF): 2.6%
119. Tompkins Financial Corp (TMP): 2.9%
120. United Bankshares, Inc. (UBSI): 4.4%
B-Rated Dividend Risk Securities 1. America Móvil S.A.B.DE C.V. (AMX): 0%
2. Ritchie Bros Auctioneers Inc (RBA): 1.5%
3. ResMed Inc. (RMD): 0.7%
4. Toro Co. (TTC): 1.1%
5. Lockheed Martin Corp. (LMT): 2.7%
6. CyrusOne Inc (CONE): 2.9%
7. UnitedHealth Group Inc (UNH): 1.4%
8. Keurig Dr Pepper Inc (KDP): 3.4%
9. Skyworks Solutions, Inc. (SWKS): 1.6%
10. Home Depot, Inc. (HD): 2.2%
11. AMGEN Inc. (AMGN): 2.7%
12. Blackrock Inc. (BLK): 2.1%
13. Intercontinental Exchange Inc (ICE): 1.1%
14. Intuit Inc (INTU): 0.6%
15. Domino’s Pizza Inc (DPZ): 0.8%
16. Xylem Inc (XYL): 1%
17. Honeywell International Inc (HON): 1.7%
18. Morningstar Inc (MORN): 0.6%
19. Republic Services, Inc. (RSG): 1.7%
20. Sap SE (SAP): 1.4%
21. Cummins Inc. (CMI): 2.3%
22. Travelers Companies Inc. (TRV): 2.4%
23. Booz Allen Hamilton Holding Corp (BAH): 1.4%
24. Automatic Data Processing Inc. (ADP): 2.1%
25. Cognizant Technology Solutions Corp. (CTSH): 1.1%
26. Canadian Pacific Railway Ltd (CP): 1%
27. Coca-Cola Co (KO): 3%
28. Sun Life Financial, Inc. (SLF): 4.8%
29. American Express Co. (AXP): 1.4%
30. Raytheon Technologies Corporation (RTX): 3%
31. Mondelez International Inc. (MDLZ): 2%
32. Comcast Corp (CMCSA): 1.7%
33. United Parcel Service, Inc. (UPS): 2.4%
34. Qualcomm, Inc. (QCOM): 1.7%
35. Lincoln Electric Holdings, Inc. (LECO): 1.6%
36. Illinois Tool Works, Inc. (ITW): 2.1%
37. Union Pacific Corp. (UNP): 1.9%
38. NextEra Energy Inc (NEE): 1.9%
39. Essential Utilities Inc (WTRG): 2%
40. Norfolk Southern Corp. (NSC): 1.6%
41. Rockwell Automation Inc (ROK): 1.7%
42. NextEra Energy Partners LP (NEP): 3.5%
43. Sempra Energy (SRE): 3.1%
44. Hanesbrands Inc (HBI): 4.2%
45. Cisco Systems, Inc. (CSCO): 3.2%
46. Tyson Foods, Inc. (TSN): 2.5%
47. FedEx Corp (FDX): 0.9%
48. DTE Energy Co. (DTE): 2.4%
49. American Tower Corp. (AMT): 2%
50. Hershey Company (HSY): 2.1%
51. Novo Nordisk (NVO): 1.9%
52. Best Buy Co. Inc. (BBY): 2.1%
53. A. O. Smith Corp. (AOS): 1.7%
54. McDonald`s Corp (MCD): 2.3%
55. Linde Plc (LIN): 1.5%
56. Commerce Bancshares, Inc. (CBSH): 1.6%
57. Infosys Ltd (INFY): 1.8%
58. Air Products & Chemicals Inc. (APD): 1.9%
59. Federal Realty Investment Trust (FRT): 4.4%
60. M & T Bank Corp (MTB): 3.4%
61. Edison International (EIX): 3.9%
62. Enterprise Products Partners LP (EPD): 8%
63. Alliant Energy Corp. (LNT): 2.9%
64. PepsiCo Inc. (PEP): 2.7%
65. Erie Indemnity Co. (ERIE): 1.6%
66. Sysco Corp. (SYY): 2.4%
67. Gilead Sciences, Inc. (GILD): 4.5%
68. Huntington Ingalls Industries Inc (HII): 2.4%
69. First of Long Island Corp. (FLIC): 3.9%
70. Intel Corp. (INTC): 2.6%
71. CVS Health Corp (CVS): 2.8%
72. Flowers Foods, Inc. (FLO): 3.4%
73. Merck & Co Inc (MRK): 3%
74. Red Eléctrica Corporación S.A. (RDEIY): 0%
75. Leggett & Platt, Inc. (LEG): 3.8%
76. Fortis Inc. (FTS): 4%
77. Everest Re Group Ltd (RE): 2.6%
78. Eastman Chemical Co (EMN): 2.6%
79. Arthur J. Gallagher & Co. (AJG): 1.4%
80. Waste Management, Inc. (WM): 1.9%
81. Deere & Co. (DE): 1.2%
82. eBay Inc. (EBAY): 1.2%
83. Bristol-Myers Squibb Co. (BMY): 2.8%
84. Prosperity Bancshares Inc. (PB): 2.7%

51
85. Verizon Communications Inc (VZ): 8%
86. International Business Machines Corp. (IBM): 5.1%
87. MetLife Inc (MET): 3.9%
88. Novartis AG (NVS): 3.4%
89. J.M. Smucker Co. (SJM): 3.1%
90. John Wiley & Sons Inc. (JW.A): 3%
91. International Flavors & Fragrances Inc. (IFF): 2.7%
92. Snap-on, Inc. (SNA): 2.5%
93. Williams-Sonoma, Inc. (WSM): 1.8%
94. Cullen Frost Bankers Inc. (CFR): 3.2%
95. Xcel Energy, Inc. (XEL): 2.5%
96. C.H. Robinson Worldwide, Inc. (CHRW): 2.2%
97. Lilly (Eli) & Co (LLY): 1.8%
98. Northwest Natural Holding Co (NWN): 3.6%
99. Bayer AG (BAYRY): 0%
100. Consolidated Edison, Inc. (ED): 4.1%
101. Entergy Corp. (ETR): 3.6%
102. Badger Meter Inc. (BMI): 0.8%
103. AT&T, Inc. (T): 6.6%
104. People`s United Financial Inc (PBCT): 4%
105. Altria Group Inc. (MO): 7.8%
106. Whirlpool Corp. (WHR): 2.5%
107. Bank OZK (OZK): 2.5%
108. National Bank of Canada (NTIOF): 0%
109. Southside Bancshares Inc (SBSI): 4%
110. BancFirst Corp. (BANF): 2.2%
111. H&R Block Inc. (HRB): 6.3%
112. Artesian Resources Corp. (ARTNA): 2.5%
113. MDU Resources Group Inc (MDU): 3.2%
114. Westamerica Bancorporation (WABC): 3%
115. Telephone and Data Systems, Inc. (TDS): 3.5%
116. Fox Corporation (FOXA): 1.6%
117. Kellogg Co (K): 3.7%
118. Western Union Company (WU): 3%
119. Cincinnati Financial Corp. (CINF): 3.6%
120. Community Bank System, Inc. (CBU): 2.5%
C-Rated Dividend Risk Securities 1. Marvell Technology Group Ltd (MRVL): 0.5%
2. Mastercard Incorporated (MA): 0.5%
3. NVIDIA Corp (NVDA): 0.1%
4. Lam Research Corp. (LRCX): 1%
5. ASML Holding NV (ASML): 0.6%
6. Yum Brands Inc. (YUM): 1.7%
7. Morgan Stanley (MS): 2.2%
8. Aon plc. (AON): 0.6%
9. Collectors Universe Inc (CLCT): 0.9%
10. Telefonaktiebolaget L M Ericsson (ERIC): 1.3%
11. Starbucks Corp. (SBUX): 1.6%
12. Trane Technologies plc (TT): 1.5%
13. Brookfield Infrastructure Partners L.P (BIP): 3.7%
14. KLA Corp. (KLAC): 1.3%
15. Diageo plc (DEO): 2.2%
16. Caterpillar Inc. (CAT): 2.2%
17. Texas Instruments Inc. (TXN): 2.3%
18. Paccar Inc. (PCAR): 4.4%
19. Kansas City Southern (KSU): 0.8%
20. Darden Restaurants, Inc. (DRI): 1%
21. New Jersey Resources Corporation (NJR): 4.5%
22. Rogers Communications Inc. (RCI): 4.2%
23. Logitech International SA (LOGI): 0.9%
24. Digital Realty Trust Inc (DLR): 3.4%
25. Brookfield Renewable Partners LP (BEP): 3%
26. Calvin b. Taylor Bankshares, Inc. (TYCB): 0%
27. Crown Castle International Corp (CCI): 3.1%
28. RELX Plc (RELX): 2.4%
29. WestRock Co (WRK): 2.4%
30. Paychex Inc. (PAYX): 2.6%
31. Fastenal Co. (FAST): 2.8%
32. Tiffany & Co. (TIF): 2.2%
33. SK Telecom Co Ltd (SKM): 3.6%
34. MSC Industrial Direct Co., Inc. (MSM): 12.1%
35. HNI Corp. (HNI): 3.2%
36. WEC Energy Group Inc (WEC): 2.7%
37. Hewlett Packard Enterprise Co (HPE): 3.9%
38. Jack In The Box, Inc. (JACK): 1.3%
39. HP Inc (HPQ): 3%
40. Campbell Soup Co. (CPB): 3%
41. Lazard Ltd. (LAZ): 4.5%
42. Unilever plc (UL): 3.9%
43. Chorus Aviation, Inc. (CHRRF): 0%
44. Aegon N. V. (AEG): 0.3%
45. Nestle SA (NSRGY): 0%
46. Constellation Brands Inc (STZ): 1.1%
47. Tapestry Inc (TPR): 1.1%
48. Marriott International, Inc. (MAR): 0.4%
49. Duke Energy Corp. (DUK): 4.1%
50. Sampo Plc (SAXPY): 0%
51. Enbridge Inc (ENB): 7.6%
52. Enerplus Corporation (ERF): 3.1%
53. Siemens AG (SIEGY): 0%
54. Magellan Midstream Partners L.P. (MMP): 8.6%
55. Old Republic International Corp. (ORI): 4.3%
56. Sanofi (SNY): 3.7%
57. Great-West Lifeco, Inc. (GWLIF): 0%
58. Bank Of New York Mellon Corp (BK): 3%
59. Realty Income Corp. (O): 4.4%
60. Goldman Sachs Group, Inc. (GS): 2%
61. Southern Company (SO): 4.1%
62. American Electric Power Company Inc. (AEP): 3.3%
63. Oshkosh Corp (OSK): 1.4%
64. UMB Financial Corp. (UMBF): 1.8%
65. Patterson Companies Inc. (PDCO): 3.2%
66. Otter Tail Corporation (OTTR): 3.3%
67. Public Storage (PSA): 3.5%
68. Harley-Davidson, Inc. (HOG): 1.2%
69. AvalonBay Communities Inc. (AVB): 3.8%
70. Omnicom Group, Inc. (OMC): 4%
71. Allstate Corp (The) (ALL): 2%
72. W. P. Carey Inc (WPC): 5.7%
73. Thomson-Reuters Corp (TRI): 2.2%
74. TransAlta Renewables, Inc. (TRSWF): 0%
75. ONEOK Inc. (OKE): 8.6%
76. Inter Pipeline Ltd. (IPPLF): 0%
77. British American Tobacco Plc (BTI): 6.9%
78. ViacomCBS Inc (VIAC): 3.4%
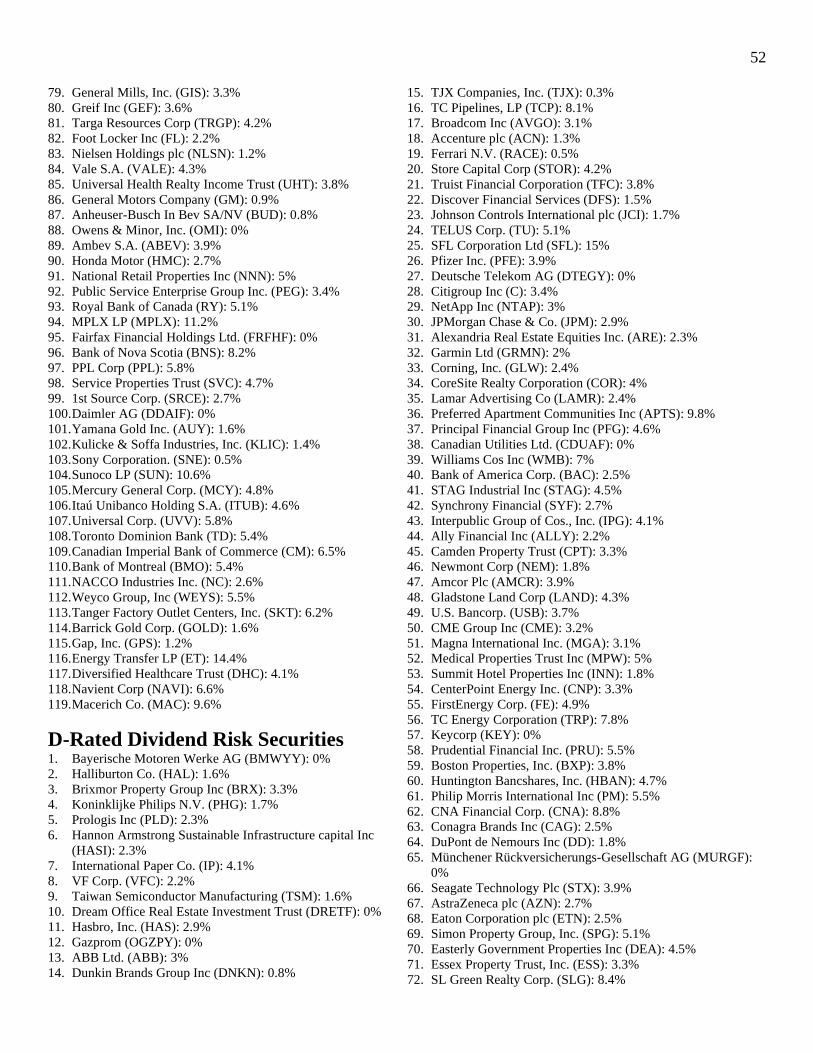
52
79. General Mills, Inc. (GIS): 3.3%
80. Greif Inc (GEF): 3.6%
81. Targa Resources Corp (TRGP): 4.2%
82. Foot Locker Inc (FL): 2.2%
83. Nielsen Holdings plc (NLSN): 1.2%
84. Vale S.A. (VALE): 4.3%
85. Universal Health Realty Income Trust (UHT): 3.8%
86. General Motors Company (GM): 0.9%
87. Anheuser-Busch In Bev SA/NV (BUD): 0.8%
88. Owens & Minor, Inc. (OMI): 0%
89. Ambev S.A. (ABEV): 3.9%
90. Honda Motor (HMC): 2.7%
91. National Retail Properties Inc (NNN): 5%
92. Public Service Enterprise Group Inc. (PEG): 3.4%
93. Royal Bank of Canada (RY): 5.1%
94. MPLX LP (MPLX): 11.2%
95. Fairfax Financial Holdings Ltd. (FRFHF): 0%
96. Bank of Nova Scotia (BNS): 8.2%
97. PPL Corp (PPL): 5.8%
98. Service Properties Trust (SVC): 4.7%
99. 1st Source Corp. (SRCE): 2.7%
100. Daimler AG (DDAIF): 0%
101. Yamana Gold Inc. (AUY): 1.6%
102. Kulicke & Soffa Industries, Inc. (KLIC): 1.4%
103. Sony Corporation. (SNE): 0.5%
104. Sunoco LP (SUN): 10.6%
105. Mercury General Corp. (MCY): 4.8%
106. Itaú Unibanco Holding S.A. (ITUB): 4.6%
107. Universal Corp. (UVV): 5.8%
108. Toronto Dominion Bank (TD): 5.4%
109. Canadian Imperial Bank of Commerce (CM): 6.5%
110. Bank of Montreal (BMO): 5.4%
111. NACCO Industries Inc. (NC): 2.6%
112. Weyco Group, Inc (WEYS): 5.5%
113. Tanger Factory Outlet Centers, Inc. (SKT): 6.2%
114. Barrick Gold Corp. (GOLD): 1.6%
115. Gap, Inc. (GPS): 1.2%
116. Energy Transfer LP (ET): 14.4%
117. Diversified Healthcare Trust (DHC): 4.1%
118. Navient Corp (NAVI): 6.6%
119. Macerich Co. (MAC): 9.6%
D-Rated Dividend Risk Securities 1. Bayerische Motoren Werke AG (BMWYY): 0%
2. Halliburton Co. (HAL): 1.6%
3. Brixmor Property Group Inc (BRX): 3.3%
4. Koninklijke Philips N.V. (PHG): 1.7%
5. Prologis Inc (PLD): 2.3%
6. Hannon Armstrong Sustainable Infrastructure capital Inc
(HASI): 2.3%
7. International Paper Co. (IP): 4.1%
8. VF Corp. (VFC): 2.2%
9. Taiwan Semiconductor Manufacturing (TSM): 1.6%
10. Dream Office Real Estate Investment Trust (DRETF): 0%
11. Hasbro, Inc. (HAS): 2.9%
12. Gazprom (OGZPY): 0%
13. ABB Ltd. (ABB): 3%
14. Dunkin Brands Group Inc (DNKN): 0.8%
15. TJX Companies, Inc. (TJX): 0.3%
16. TC Pipelines, LP (TCP): 8.1%
17. Broadcom Inc (AVGO): 3.1%
18. Accenture plc (ACN): 1.3%
19. Ferrari N.V. (RACE): 0.5%
20. Store Capital Corp (STOR): 4.2%
21. Truist Financial Corporation (TFC): 3.8%
22. Discover Financial Services (DFS): 1.5%
23. Johnson Controls International plc (JCI): 1.7%
24. TELUS Corp. (TU): 5.1%
25. SFL Corporation Ltd (SFL): 15%
26. Pfizer Inc. (PFE): 3.9%
27. Deutsche Telekom AG (DTEGY): 0%
28. Citigroup Inc (C): 3.4%
29. NetApp Inc (NTAP): 3%
30. JPMorgan Chase & Co. (JPM): 2.9%
31. Alexandria Real Estate Equities Inc. (ARE): 2.3%
32. Garmin Ltd (GRMN): 2%
33. Corning, Inc. (GLW): 2.4%
34. CoreSite Realty Corporation (COR): 4%
35. Lamar Advertising Co (LAMR): 2.4%
36. Preferred Apartment Communities Inc (APTS): 9.8%
37. Principal Financial Group Inc (PFG): 4.6%
38. Canadian Utilities Ltd. (CDUAF): 0%
39. Williams Cos Inc (WMB): 7%
40. Bank of America Corp. (BAC): 2.5%
41. STAG Industrial Inc (STAG): 4.5%
42. Synchrony Financial (SYF): 2.7%
43. Interpublic Group of Cos., Inc. (IPG): 4.1%
44. Ally Financial Inc (ALLY): 2.2%
45. Camden Property Trust (CPT): 3.3%
46. Newmont Corp (NEM): 1.8%
47. Amcor Plc (AMCR): 3.9%
48. Gladstone Land Corp (LAND): 4.3%
49. U.S. Bancorp. (USB): 3.7%
50. CME Group Inc (CME): 3.2%
51. Magna International Inc. (MGA): 3.1%
52. Medical Properties Trust Inc (MPW): 5%
53. Summit Hotel Properties Inc (INN): 1.8%
54. CenterPoint Energy Inc. (CNP): 3.3%
55. FirstEnergy Corp. (FE): 4.9%
56. TC Energy Corporation (TRP): 7.8%
57. Keycorp (KEY): 0%
58. Prudential Financial Inc. (PRU): 5.5%
59. Boston Properties, Inc. (BXP): 3.8%
60. Huntington Bancshares, Inc. (HBAN): 4.7%
61. Philip Morris International Inc (PM): 5.5%
62. CNA Financial Corp. (CNA): 8.8%
63. Conagra Brands Inc (CAG): 2.5%
64. DuPont de Nemours Inc (DD): 1.8%
65. Münchener Rückversicherungs-Gesellschaft AG (MURGF):
0%
66. Seagate Technology Plc (STX): 3.9%
67. AstraZeneca plc (AZN): 2.7%
68. Eaton Corporation plc (ETN): 2.5%
69. Simon Property Group, Inc. (SPG): 5.1%
70. Easterly Government Properties Inc (DEA): 4.5%
71. Essex Property Trust, Inc. (ESS): 3.3%
72. SL Green Realty Corp. (SLG): 8.4%
53
73. Genesis Energy L.P. (GEL): 13.7%
74. GlaxoSmithKline plc (GSK): 5.4%
75. LTC Properties, Inc. (LTC): 5.6%
76. Healthcare Trust of America Inc (HTA): 4.6%
77. Imperial Brands Plc (IMBBY): 0%
78. Kraft Heinz Co (KHC): 4.6%
79. FBL Financial Group, Inc. (FFG): 6.4%
80. WPP Plc. (WPP): 5.7%
81. Kontoor Brands Inc (KTB): 2.2%
82. Chemours Company (CC): 3.6%
83. Equity Residential Properties Trust (EQR): 3.9%
84. Sabra Healthcare REIT Inc (SBRA): 7.3%
85. Holly Energy Partners L.P. (HEP): 11.6%
86. Kinder Morgan Inc (KMI): 6.8%
87. Telefonica S.A (TEF): 15.1%
88. Iron Mountain Inc. (IRM): 8.2%
89. New Residential Investment Corp (NRZ): 8.1%
90. Omega Healthcare Investors, Inc. (OHI): 6.7%
91. Exelon Corp. (EXC): 3.5%
92. Invesco Ltd (IVZ): 4.3%
93. Ventas Inc (VTR): 4.9%
94. Wheaton Precious Metals Corp (WPM): 1%
95. China Mobile Limited (CHL): 7.3%
96. Physicians Realty Trust (DOC): 4.9%
97. Dream Industrial Real Estate Investment Trust (DREUF): 0%
98. Weyerhaeuser Co. (WY): 1.5%
99. Wendy`s Co (WEN): 1.3%
100. Lumen Technologies Inc (LUMN): 9.4%
101. Suburban Propane Partners LP (SPH): 11.1%
102. Office Properties Income Trust (OPI): 8.6%
103. UBS Group AG (UBS): 2.5%
104. Newell Brands Inc (NWL): 4.5%
105. Rio Tinto plc (RIO): 5%
106. BHP Group Limited (BHP): 3.7%
107. Kimco Realty Corp. (KIM): 5.2%
108. Gaming and Leisure Properties Inc (GLPI): 3.2%
109. DHT Holdings Inc (DHT): 22.7%
110. Superior Plus Corp. (SUUIF): 0%
111. Whitestone REIT (WSR): 7.1%
112. Sienna Senior Living, Inc. (LWSCF): 0%
113. PacWest Bancorp (PACW): 5.2%
114. VEREIT Inc (VER): 5.4%
115. CF Industries Holdings Inc (CF): 3.1%
116. Xerox Holdings Corp (XRX): 4.1%
117. Urstadt Biddle Properties, Inc. (UBA): 5%
118. Geo Group, Inc. (GEO): 17.6%
119. AGNC Investment Corp (AGNC): 9.8%
120. Vermilion Energy Inc (VET): 15.6%
F-Rated Dividend Risk Securities 1. Gold Resource Corporation (GORO): 1.2%
2. Innovative Industrial Properties Inc (IIPR): 2.4%
3. CNOOC Ltd. (CEO): 9.2%
4. Apache Corp. (APA): 7.6%
5. Helmerich & Payne, Inc. (HP): 7.4%
6. Restaurant Brands International Inc (QSR): 3.3%
7. Chevron Corp. (CVX): 5.7%
8. Cheesecake Factory Inc. (CAKE): 1%
9. Baker Hughes Co (BKR): 3.2%
10. Royal Dutch Shell Plc (RDS.B): 5.2%
11. Canadian Natural Resources Ltd. (CNQ): 8.2%
12. Blackstone Group Inc (The) (BX): 2.9%
13. General Electric Co. (GE): 0.4%
14. Suncor Energy, Inc. (SU): 6%
15. Exxon Mobil Corp. (XOM): 7.8%
16. Apollo Global Management Inc (APO): 4.7%
17. Industria De Diseño Textil SA (IDEXY): 0%
18. Dominion Energy Inc (D): 4.5%
19. Covanta Holding Corporation (CVA): 4.9%
20. PetroChina Co. Ltd. (PTR): 6.9%
21. Conoco Phillips (COP): 3.9%
22. Algonquin Power & Utilities Corp (AQN): 4.3%
23. Two Harbors Investment Corp (TWO): 10.5%
24. Total SE (TOT): 4.9%
25. New York Community Bancorp Inc. (NYCB): 6.5%
26. Chatham Lodging Trust (CLDT): 2.8%
27. Permian Basin Royalty Trust (PBT): 7%
28. Sabine Royalty Trust (SBR): 7.5%
29. Eni Spa (E): 5.7%
30. Global Water Resources Inc (GWRS): 1.9%
31. Tenaris S.A. (TS): 0.8%
32. LyondellBasell Industries NV (LYB): 4.6%
33. Arbor Realty Trust Inc. (ABR): 8.2%
34. Global Net Lease Inc (GNL): 7.2%
35. Shaw Communications Inc. (SJR): 6.9%
36. Axis Capital Holdings Ltd (AXS): 3.1%
37. Swiss Re Ltd (SSREY): 0%
38. Schlumberger Ltd. (SLB): 3.8%
39. Pembina Pipeline Corporation (PBA): 10%
40. Cedar Fair L.P. (FUN): 2.4%
41. Dow Inc (DOW): 5.1%
42. Scholastic Corp. (SCHL): 2.2%
43. Nutrien Ltd (NTR): 3.6%
44. Ryder System, Inc. (R): 2.6%
45. MGM Resorts International (MGM): 0.5%
46. Consolidated Water Co. Ltd. (CWCO): 2.8%
47. Choice Properties Real Estate Investment Trust (PPRQF): 0%
48. BP plc (BP): 8.3%
49. Brookfield Property Partners L.P. (BPY): 10.2%
50. Exchange Income Corp. (EIFZF): 0%
51. Cross Timbers Royalty Trust (CRT): 8.5%
52. Spirit Realty Capital Inc (SRC): 5.9%
53. Compass Diversified Holdings (CODI): 5.1%
54. Wynn Resorts Ltd. (WYNN): 0.9%
55. Ares Capital Corp (ARCC): 9.3%
56. China Petroleum & Chemical Corp (SNP): 8.3%
57. Phillips 66 (PSX): 5.2%
58. Valero Energy Corp. (VLO): 6.6%
59. Comerica, Inc. (CMA): 5%
60. B&G Foods, Inc (BGS): 6.3%
61. Gladstone Investment Corporation (GAIN): 8.7%
62. Imperial Oil Ltd. (IMO): 2.8%
63. BCE Inc (BCE): 5%
64. Vector Group Ltd (VGR): 4.6%
65. Broadmark Realty Capital Inc (BRMK): 7.7%
66. Artisan Partners Asset Management Inc (APAM): 5.6%

54
67. Healthpeak Properties Inc (PEAK): 4.8%
68. Wells Fargo & Co. (WFC): 4%
69. Olin Corp. (OLN): 3.3%
70. Dillard`s Inc. (DDS): 1.2%
71. Landmark Infrastructure Partners LP (LMRK): 8.4%
72. HollyFrontier Corp (HFC): 5.2%
73. Newtek Business Services Corp (NEWT): 8.1%
74. KNOT Offshore Partners LP (KNOP): 12.7%
75. Sixth Street Specialty Lending Inc (TSLX): 10.7%
76. Alaris Equity Partners Income Trust (ALARF): 0%
77. MGM Growth Properties LLC (MGP): 5.7%
78. Main Street Capital Corporation (MAIN): 7.4%
79. Pearson plc (PSO): 2.7%
80. Equinor ASA (EQNR): 4.1%
81. Ladder Capital Corp (LADR): 7.4%
82. Occidental Petroleum Corp. (OXY): 4.1%
83. Vodafone Group plc (VOD): 3%
84. Canon Inc (CAJ): 5.6%
85. Welltower Inc (WELL): 4%
86. HSBC Holdings plc (HSBC): 3.9%
87. CorEnergy Infrastructure Trust Inc (CORR): 11.4%
88. USA Compression Partners LP (USAC): 15.4%
89. Marathon Petroleum Corp (MPC): 5.4%
90. PermRock Royalty Trust (PRT): 5.1%
91. Starwood Property Trust Inc (STWD): 9.4%
92. Icahn Enterprises LP (IEP): 10.9%
93. Höegh LNG Partners LP (HMLP): 11.3%
94. Chimera Investment Corp (CIM): 13.9%
95. TriplePoint Venture Growth BDC Corp (TPVG): 11%
96. Prospect Capital Corp (PSEC): 12.3%
97. New York Mortgage Trust Inc (NYMT): 8.2%
98. Horizon Technology Finance Corp (HRZN): 9%
99. Gladstone Capital Corp. (GLAD): 8.6%
100. Solar Senior Capital Ltd (SUNS): 8.5%
101. Blackstone Mortgage Trust Inc (BXMT): 8.4%
102. Gladstone Commercial Corp (GOOD): 7.7%
103. Spark Energy Inc (SPKE): 7.3%
104. Harvest Capital Credit Corp (HCAP): 11.1%
105. Compass Minerals International Inc (CMP): 4.6%
106. AllianceBernstein Holding LP (AB): 8.3%
107. PennantPark Floating Rate Capital Ltd (PFLT): 9.9%
108. Apollo Commercial Real Estate Finance Inc (ARI): 12.5%
109. ARMOUR Residential REIT Inc (ARR): 10.5%
110. Ellington Financial Inc (EFC): 8.1%
111. Stellus Capital Investment Corp (SCM): 10.9%
112. Waddell & Reed Financial, Inc. (WDR): 3.9%
113. Dynex Capital, Inc. (DX): 8.7%
114. Annaly Capital Management Inc (NLY): 10.6%
115. Orchid Island Capital Inc (ORC): 13.8%
116. New Mountain Finance Corp (NMFC): 12.7%
117. Hercules Capital Inc (HTGC): 9.5%
118. Antero Midstream Corp (AM): 13.8%
119. Oxford Square Capital Corp (OXSQ): 19.9%
121. Patterson-UTI Energy Inc (PTEN): 1.7%