supraspecific taxa as terminals in cladistic analysis: implicit
TRANSCRIPT

Biological Journal of the Linnean Society (1998), 64: 101–133 With 12 figures
Article ID: bj980215
Supraspecific taxa as terminals in cladisticanalysis: implicit assumptions of monophylyand a comparison of methods
OLAF R. P. BININDA-EMONDS
Department of Zoology, University of Oxford, Oxford OX1 3PS
HAROLD N. BRYANT1
Provincial Museum of Alberta, 12845 102 Avenue, Edmonton, Alberta T5N 0M6, Canada
ANTHONY P. RUSSELL FLS
Vertebrate Morphology Research Group, Department of Biological Sciences, University of Calgary,Calgary, Alberta T2N 1N4, Canada
Received 10 April 1997; accepted for publication 5 February 1998
The use of supraspecific terminal taxa to represent groups of species in phylogenetic analysescan result in changes to inferred relationships as compared to a complete species levelanalysis. These changes in topology result from interactions among (1) the cladistic status ofthe supraspecific taxa; (2) the method used to represent the taxa as single terminals, and (3)incongruence in the data set. We examine the effects of using supraspecific terminal taxausing a parallel analysis of hypothetical examples and an actual data matrix for the trueseals (Mammalia: Phocidae). Incongruence among characters can produce changes in topologyby shifting the ‘balance of power’ among groups of characters when supraspecific taxa arerepresented as single terminals. In the absence of homoplasy, the correct topology ismaintained. Of the three methods for representing supraspecific taxa, the ‘ancestral’ method,which explicitly infers the common ancestor of the group corresponding to the taxon,performed the best, always maintaining the correct topology when monophyletic taxa wererepresented. This agrees with theoretical predictions. The ‘democratic’ and ‘exemplar’methods, which represent the higher level taxon through a survey of all or one of its extantconstituent species, respectively, were not as effective in maintaining the correct topology.Although both occasionally provided correct answers, their occurrences were largely un-predictable. The success of the exemplar method varies with the species selected. Thesimultaneous representation of two or more higher level taxa produced interactive effectswhere the resultant topology included different clades than when the taxa were collapsedindividually. Interactive effects occurred with all three methods, albeit to a lesser degree forthe ancestral method. Changes in topology were observed regardless of whether the higher
1 Correspondence to: Dr H. N. Bryant. Present address: Royal Saskatchewan Museum, 2340 AlbertSt, Regina, Saskatchewan SB4 3V7, Canada
1010024–4066/98/050101+33 $25.00/0 1998 The Linnean Society of London

O. R. P. BININDA-EMONDS ET AL.102
group was monophyletic or not, but were more prevalent when it was paraphyletic.Unfortunately, there does not seem to be a reliable way to determine when a paraphyleticgroup has been included in the analysis (e.g. through bootstrap values or indices measuringhomoplasy). The implications of these findings for phylogenetic analyses of molecular dataare also discussed.
1998 The Linnean Society of London
ADDITIONAL KEY WORDS:—phylogenetic inference – species – groundplan – paraphyly– homoplasy – ancestor – exemplar – Phocidae – consistency indices – molecular systematics.
CONTENTS
Introduction . . . . . . . . . . . . . . . . . . . . . . . 102The issues . . . . . . . . . . . . . . . . . . . . . . . 103
Assumptions of monophyly . . . . . . . . . . . . . . . . 104Representing supraspecific taxa . . . . . . . . . . . . . . . 104
Analysis . . . . . . . . . . . . . . . . . . . . . . . . 106Hypothetical examples . . . . . . . . . . . . . . . . . . 106Phocid examples . . . . . . . . . . . . . . . . . . . . 112
Discussion . . . . . . . . . . . . . . . . . . . . . . . 121Underlying causes: character identities . . . . . . . . . . . . . 121Multiple taxa and interactive effects . . . . . . . . . . . . . 124Problems with paraphyly . . . . . . . . . . . . . . . . . 125Assessment of representation methods . . . . . . . . . . . . . 125Implications for molecular studies . . . . . . . . . . . . . . 128
Conclusions . . . . . . . . . . . . . . . . . . . . . . . 129Acknowledgements . . . . . . . . . . . . . . . . . . . . 130References . . . . . . . . . . . . . . . . . . . . . . . 130Appendix . . . . . . . . . . . . . . . . . . . . . . . . 133
INTRODUCTION
Although the species is the fundamental unit of our taxonomic system, oursystematic questions often involve more inclusive levels, necessitating that at leastsome of the terminal branches be represented by supraspecific taxa. Despite theadvantages of including as many taxa as possible within an analysis (see Arnold,1981; Donoghue et al., 1989; Hendy & Penny, 1989; Lecointre et al., 1993), includingall or many of the constituent species in analyses that attempt to resolve relationshipsat higher levels (i.e. higher taxonomic levels in the Linnaean hierarchy or moreinclusive levels in cladistic hierarchies) is impractical. The inclusion of large numbersof terminal taxa entails more complex analyses that require heuristic searches thatcannot guarantee optimal solutions, or, in extreme cases, are simply not tractableusing current computer technology (see Soltis & Soltis, 1996; Rice, Donoghue &Olmstead, 1997). The judicious use of supraspecific terminal taxa in higher levelanalyses allows for the use of exact searches or, for more expansive studies, heuristicsearches that obtain results in a reasonable length of time.
The correct use of supraspecific taxa in phylogenetic analysis, however, has tworequirements: (1) the taxa are monophyletic (sensu Hennig, 1966; but note that weuse ‘taxon’ in the traditional Linnaean sense and not necessarily as the equivalentof ‘clade’) and (2) we can represent them as single terminals in a way that maintainstheir positions on a cladogram with respect to a solution including all species. Inmany instances, the monophyletic status of taxa is assumed without being stronglytested, often because of the long taxonomic history of the group. However, because

SUPRASPECIFIC TAXA 103
our current taxonomic and classificatory schemes predate cladistics (and even theacceptance of evolution via natural selection), monophyly was not a criterion in theestablishment of many older taxa. Even reasonably ‘safe’ (or at least commonlyaccepted) assumptions of monophyly may be erroneous, as has been argued recentlyfor various taxa including rodents (Graur, Hide & Li, 1991), mustelids (Wayne etal., 1989; Vrana et al., 1994; Ledje & Arnason, 1996), the blackbird genus Agelaius(Lanyon, 1994), and numerous supraspecific seed plant taxa (Chase et al., 1993).Although the cladistic status of many long-standing taxa is continually being tested,it should be realized that in many other cases their status is best regarded asuncertain. A related issue is the prevalence of including taxa whose monophyly isknown to be questionable in phylogenetic analyses (e.g. as noted for Carnivora byBininda-Emonds, Gittleman & Purvis [in review]), with the apparent assumptionthat any associated errors will be minimal.
The second requirement involves identifying a suitable method to generate thecharacter states for the single terminals that represent the supraspecific taxa in thehigher level analysis. Methods used to date include (1) estimating the primitive statesof the taxon (e.g. Bryant, Russell & Fitch, 1993; Wyss & Flynn, 1993), using eitherfossil or ontogenetic evidence and/or by reconstructing a hypothetical ancestor onthe basis of previous phylogenetic analyses (e.g. compartmentalization; Mishler,1994); (2) choosing an extant member of the clade to represent the taxon as a whole(e.g. Chase et al., 1993; Krettek, Gullberg & Arnason, 1995); or (3) generatingcharacter states for the taxon from a sample of its constituent species, much asspecies traits are delimited from a sample of individual specimens (e.g. Bininda-Emonds & Russell, 1996). We refer to these three methods as the ancestral, exemplar(Mishler, 1994; Yeates, 1995: 344), and democratic methods, respectively.
We herein explore the effects of assumptions of monophyly and methods ofrepresenting higher level taxa, two factors which may confound the use of supra-specific terminal taxa in phylogenetic analysis. The problem is addressed initiallyusing simple hypothetical examples, which allow us to isolate some of the factorsthat impinge on the use of supraspecific taxa. We follow this with a more complexreal life example to illustrate the interactions of these effects in larger data sets. Thegroup chosen here is the family of true seals (Mammalia: Carnivora: Phocidae), amanageably sized group for which the first complete species-level phylogeny hasrecently been estimated (Bininda-Emonds & Russell, 1996). Use of the data matrixfrom this study provides examples of historically accepted supraspecific taxa thatare monophyletic and non-monophyletic.
THE ISSUES
A subtheme throughout this study is the importance of the assumptions we makein phylogenetic analyses where our analyses largely take the form of ‘if–then’statements. Given a set of raw character data, the assumptions we make in theanalysis (e.g. character coding, choice of computer algorithm) will have a markedeffect on the topology of the resulting trees. The danger is that the assumptions weare making may result in incorrect phylogenies, something that becomes crucial dueto the increasing role that phylogenetics plays within biology today. Numerous fieldsof study, ranging from biogeography to conservation biology to comparative biology

O. R. P. BININDA-EMONDS ET AL.104
and character evolution now routinely incorporate systematic information. Giventhat assumptions must be made in our analyses and that those concerning the useof supraspecific taxa are only one of many, can we identify a set of assumptionsand methods in this one case that will minimize potential errors?
Assumptions of monophyly
Cladistic theory implicitly assumes that the terminal taxa in any analysis aremonophyletic (Gaffney, 1977). Collapsing a non-monophyletic assemblage to a singleterminal must alter the implied relationships of its members (see Representingparaphyletic groups, below), but the broader implications of incorrect assumptionsof monophyly on the outcome of an analysis has not been thoroughly examined.However, there are indications that these assumptions are important. A cogentexample is found in Berta & Wyss (1994). In this study, which examined relationshipsamong all fossil and extant pinniped genera or tribes, the genus of monk seals,Monachus, was reluctantly taken to be monophyletic (or at least entered as asingle terminal taxon), contrary to previous accepted findings (Wyss, 1988). Severalanomalous inferred relationships within the subfamily containing Monachus weretraced to this assumption of monophyly, with the authors going so far as to questionthe validity of all the observed relationships within this subfamily, including itsapparent monophyletic status (Berta & Wyss, 1994: 43). We show that the errorsintroduced by improper assumptions of monophyly may occasionally reach widerthan was suspected to be the case in Berta & Wyss (1994).
Representing supraspecific taxa
Yeates (1995) recently examined two methods of representing supraspecific taxaas terminals (the exemplar method and ‘intuitive groundplan analysis’) and theassumptions behind them. As he noted, the character states that best represent asupraspecific taxon (i.e. maintain its position in a cladogram compared to a completespecies-level solution) are those that are primitive for the group corresponding to it;in other words, those of the common ancestor. Yeates referred to these states as the‘groundplan’ of the higher taxon. We add that the superiority of the groundplanapproach follows from first principles: the common ancestor possesses all theapomorphies necessary to correctly infer the position of the group it represents, butlacks those that have subsequently evolved among only some of its descendants andare either uninformative at the higher level (autapomorphies) or suggest an erroneousplacement for the group when taken to be representative of it (homoplasies). Intheory, a greater proportion of characters remain phylogenetically informativeand accurate, thus allowing the correct position of the supraspecific taxon to bedetermined.
Of the methods we mentioned above, only the ‘ancestral method,’ which attemptsto directly estimate the ancestral states of the supraspecific taxon, accords with thistheoretical ideal. But, although theoretically sound, use of the method is oftenproblematic. For example, Yeates (1995) rightly criticizes the often ad hoc nature of‘intuitive groundplan analysis’, whereby the reasons behind the assignment of thestates to the groundplan are never clearly articulated. The following criteria make
SUPRASPECIFIC TAXA 105
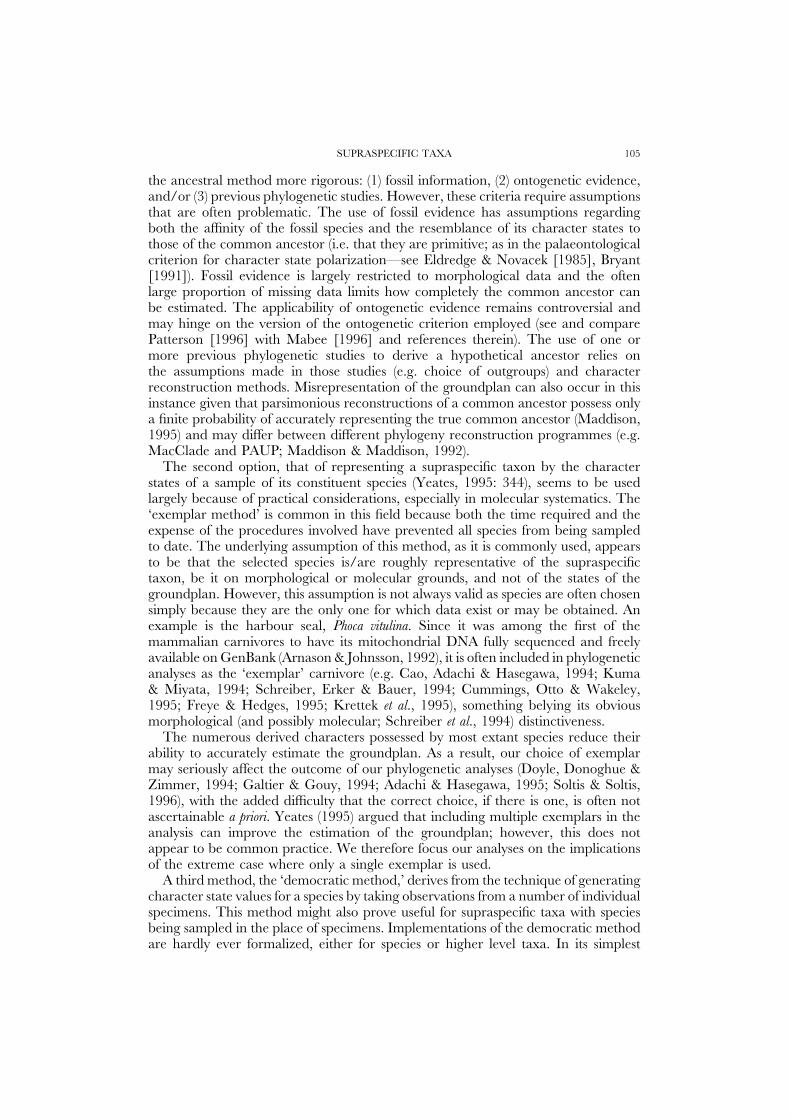
the ancestral method more rigorous: (1) fossil information, (2) ontogenetic evidence,and/or (3) previous phylogenetic studies. However, these criteria require assumptionsthat are often problematic. The use of fossil evidence has assumptions regardingboth the affinity of the fossil species and the resemblance of its character states tothose of the common ancestor (i.e. that they are primitive; as in the palaeontologicalcriterion for character state polarization—see Eldredge & Novacek [1985], Bryant[1991]). Fossil evidence is largely restricted to morphological data and the oftenlarge proportion of missing data limits how completely the common ancestor canbe estimated. The applicability of ontogenetic evidence remains controversial andmay hinge on the version of the ontogenetic criterion employed (see and comparePatterson [1996] with Mabee [1996] and references therein). The use of one ormore previous phylogenetic studies to derive a hypothetical ancestor relies onthe assumptions made in those studies (e.g. choice of outgroups) and characterreconstruction methods. Misrepresentation of the groundplan can also occur in thisinstance given that parsimonious reconstructions of a common ancestor possess onlya finite probability of accurately representing the true common ancestor (Maddison,1995) and may differ between different phylogeny reconstruction programmes (e.g.MacClade and PAUP; Maddison & Maddison, 1992).
The second option, that of representing a supraspecific taxon by the characterstates of a sample of its constituent species (Yeates, 1995: 344), seems to be usedlargely because of practical considerations, especially in molecular systematics. The‘exemplar method’ is common in this field because both the time required and theexpense of the procedures involved have prevented all species from being sampledto date. The underlying assumption of this method, as it is commonly used, appearsto be that the selected species is/are roughly representative of the supraspecifictaxon, be it on morphological or molecular grounds, and not of the states of thegroundplan. However, this assumption is not always valid as species are often chosensimply because they are the only one for which data exist or may be obtained. Anexample is the harbour seal, Phoca vitulina. Since it was among the first of themammalian carnivores to have its mitochondrial DNA fully sequenced and freelyavailable on GenBank (Arnason & Johnsson, 1992), it is often included in phylogeneticanalyses as the ‘exemplar’ carnivore (e.g. Cao, Adachi & Hasegawa, 1994; Kuma& Miyata, 1994; Schreiber, Erker & Bauer, 1994; Cummings, Otto & Wakeley,1995; Freye & Hedges, 1995; Krettek et al., 1995), something belying its obviousmorphological (and possibly molecular; Schreiber et al., 1994) distinctiveness.
The numerous derived characters possessed by most extant species reduce theirability to accurately estimate the groundplan. As a result, our choice of exemplarmay seriously affect the outcome of our phylogenetic analyses (Doyle, Donoghue &Zimmer, 1994; Galtier & Gouy, 1994; Adachi & Hasegawa, 1995; Soltis & Soltis,1996), with the added difficulty that the correct choice, if there is one, is often notascertainable a priori. Yeates (1995) argued that including multiple exemplars in theanalysis can improve the estimation of the groundplan; however, this does notappear to be common practice. We therefore focus our analyses on the implicationsof the extreme case where only a single exemplar is used.
A third method, the ‘democratic method,’ derives from the technique of generatingcharacter state values for a species by taking observations from a number of individualspecimens. This method might also prove useful for supraspecific taxa with speciesbeing sampled in the place of specimens. Implementations of the democratic methodare hardly ever formalized, either for species or higher level taxa. In its simplest

O. R. P. BININDA-EMONDS ET AL.106
form, the democratic state is the most frequent state in the sample, although someform of frequency-dependent coding might be envisaged (see Wiens, 1995). Althoughthe democratic method avoids the oft-times arbitrariness of the exemplar method,it possesses theoretical and practical liabilities. Given that we ideally want to estimatethe primitive states for the higher level taxon, the method is equivalent to the‘common equals primitive’ criterion for determining character state polarity. Thiscriterion is unreliable (Watrous & Wheeler, 1981); however, it is still used infrequentlyand was one mechanism cited by Yeates (1995) as having been used to estimate thegroundplan via ‘intuitive groundplan analysis’ (although, as with the exemplarmethod, the presence of derived features reduces the ability of the democraticmethod in this regard). Also, the common equals primitive criterion has been shownso far to be incompatible with only one class of tree topology (the Hennigian comb;Watrous & Wheeler, 1981); thus, it has the potential to give correct answers inmany instances, something we wanted to test in the current context. Methodologicalshortcomings include the necessity of a mechanism to resolve the expected highlevels of polymorphism in character state values as supraspecific taxa are less likelyto be phenotypically or genetically homogeneous than species, particularly atincreasingly inclusive levels. The method is also labour intensive. Given that areasonable number of the constituent species need to be sampled, it would besimpler, albeit more computationally intensive, to merely include the sampled speciesdirectly in the analysis or select a limited number as exemplars.
ANALYSIS
We explore the problems associated with the use of supraspecific terminal taxain phylogenetic analyses through a parallel analysis of hypothetical examples and areal data set for the phocid seals (from Bininda-Emonds & Russell, 1996). This dualapproach has many advantages. The hypothetical examples permit us to identifythe interactions between assumptions of monophyly and the choice of the methodused to represent higher level taxa. An additional important factor, incongruencein the data, is also introduced here. The examples involving the phocid seals illustratethe magnitude of the errors these factors may contribute to under ‘actual’ and morecomplex conditions, and also how they can interact to engender additional errors.As well, by virtue of this ‘real life example,’ we hope that the practical consequencesof using supraspecific terminal taxa will be more apparent. In the end, the use ofboth types of examples permits a determination of the strengths and weaknesses ofthe various representation methods.
Hypothetical examples
The hypothetical examples (Figs 1–6) involve clades of five to seven terminal taxa(a through g). Relationships within the clade are based on the presence/absence ofcharacters as indicated by bars on the cladograms; in all instances, absence of acharacter is plesiomorphic for the entire clade (i.e. trees are rooted using an outgroup[not shown] that lacks all characters). In each example, three terminal taxa arecollapsed into a single terminal (m) using the representation methods described above

SUPRASPECIFIC TAXA 107
A
B
a b c d e
m
3
21
2a b m
1
Figure 1. Representation of a monophyletic group (c,d,e) as a single terminal taxon (m) and the effecton topology in the absence of homoplasy. A, the original tree including c, d, and e. B, the simplifiedtree in which (c,d,e) is replaced by m. Characters supporting the nodes are indicated with bars. Seetext for explanation.
to determine the effect on the inferred topology. Although we implicitly use priorphylogenetic analyses to derive states for the ancestral method, the ancestor canalso be inferred using fossil or ontogenetic information. Ancestral states for collapsedgroups were derived from the least inclusive node that subsumes all members of thegroup. Because the character coding for m may differ depending on which methodis used, the relationships between m and the other taxa within the clade may alsodiffer. In addition, the relationships of m are influenced by the monophyletic orparaphyletic status of the collapsed group and the presence of homoplasy in thedata matrix.
Representing monophyletic groupsIn the absence of homoplasy, the replacement of a monophyletic group by a
terminal taxon using any of the representation methods does not alter the inferredrelationships. Nonetheless, when the clade (c,d,e) (Fig. 1) is replaced by a singleterminal taxon, m, its characters differ depending on which representation methodis used. Taxon m lacks character 3 using both the ancestral method and using c asthe exemplar; in contrast, m has character 3 using either d or e as the exemplar, orusing the democratic method. In all instances m has characters 1 and 2. Despite thedifferences in coding for character 3, the relationships among a, b, and m are notaffected because character 3 occurs only within clade (c,d,e) and is therefore notrelevant to relationships with a and b. Regardless of which method is used, m hascharacter 1 and therefore is inferred correctly as more closely related to b than to a.
The exemplar and democratic methods of representing clades as terminal taxacan result in incorrect inferences of relationship when particular members of theclade share apomorphies (i.e. have homoplasies) with taxa outside the clade. InFigure 2A, if e is chosen as the exemplar of (c,d,e), m (=e) clusters with a rather thanb because characters 4 and 5, which are shared by a and e, outweigh character 1which supports the correct relationship, a(b,m) (Fig. 2B). Characters 2 and 3, thattogether with character 1 outweighed characters 4 and 5 in the original matrix, are

O. R. P. BININDA-EMONDS ET AL.108
A
B
a b c d e
m
3
21
1
a m b1
4, 5
4, 5
4, 5
C
a b c d e
m
1
4, 54, 5
2, 3
Figure 2. Representation of a monophyletic group (c,d,e) as a single terminal taxon (m) and the effecton topology in the presence of homoplasy. A, C, two original trees including c, d, and e with differentdistributions of characters 1–5. B, simplified tree in which m groups with a rather than b; this patternresults from using e as the exemplar in A, and using the democratic method with C. In both instancesthe homoplasy in characters 4 and 5 results in a simplified tree with an incorrect topology. Theancestral method results in the correct topology in both cases.
no longer informative in the condensed matrix. In Figure 2C, if (c,d,e) is representedby m using the democratic method, m has characters 4 and 5 because these charactersoccur in two of the three constituent taxa. As a result, m clusters with a, where thesetwo characters also occur, rather than b (Fig. 2B). As in the previous example,characters 2 and 3, which supported the tree based on the original matrix, are nolonger informative when (c,d,e) is considered a single terminal taxon.
The ancestral method is immune to homoplasy in the data because it ignoresapomorphies shared by some members of the clade and outside taxa. Using theancestral method in both of the above examples (Fig. 2), m would have onlycharacters 1 and 2, and would therefore cluster with b, as in the original cladogram.Character state inferences at the ancestral node are equivocal when more than onecharacter optimization is equally parsimonious. On the tree in Figure 3A and B,two optimizations for character 5 at the ancestral node of (c,d,e) are equallyparsimonious. If character 5 evolved independently in a, c, and d (Fig. 3A), theancestral node lacks character 5; as a result, m clusters correctly with b. If theancestor of (c,d,e) had character 5, which was then lost in e (Fig. 3B), the relationshipsamong a, b, and m will be unresolved; character 1 supports a(b,m), whereas character5 supports b(a,m). However, this ambiguity regarding the relationships between a, b,and m is present in the original matrix which is equally congruent with a secondshortest tree (Fig. 3C) in which a is more closely related to (c,d,e) than b is. We have

SUPRASPECIFIC TAXA 109
A
a b c d e
m
5
21
3, 45
5
5 absent
B
a b c d e
m
2, 51
3, 45
5 present
C
b a c d e
5
3, 41
5 lost
5 lost
1, 2
Figure 3. Equivocal inference of the character states of a hypothetical ancestor due to equallyparsimonious optimizations at the ancestral node (indicated by a solid circle). A, absence of character5 using DELTRAN (delayed transformation). B, presence of character 5 using ACCTRAN (acceleratedtransformation). C, equally parsimonious tree to those in A and B in which the positions of a and bare reversed.
a b c d e
m
32
4
a b m f
1
2
f
1
Figure 4. Representation of a paraphyletic group—c,d,e—as a single terminal taxon (m) and the effecton topology in the absence of homoplasy. A, original tree. B, simplified tree generated by all threerepresentation methods on which f is the sister taxon of m, rather than its actual sister taxon, e.
been unable to find an example in which the ancestral method generates ambiguityregarding relationships that is not already present in the original data matrix.
Representing paraphyletic groupsEven in the absence of homoplasy, the replacement of a taxon that is not
monophyletic by a single terminal taxon must misrepresent relationships because ofthe implicit assumption that terminal taxa are monophyletic. If the paraphyleticassemblage c,d,e in Figure 4A is replaced by m, the relationships among the remainingtaxa are unchanged (Fig. 4B); however, Figure 4B suggests that m and f are sister

O. R. P. BININDA-EMONDS ET AL.110
b c d e f
m
32
4
b c m g
g
1
a
A
5
a
B
Method 1 2 3 4 5Character
ancestral 1 1 0 0 0democratic 1 1 1 0 0
exemplar (d) 1 1 0 0 1
C
b c m gaD
b c m gaE
Figure 5. Representation of a paraphyletic group—d,e,f—as a single terminal taxon (m) and the effecton topology in the absence of homoplasy. A, original tree. B, character matrix illustrating the differentcharacter states of m using the three representation methods. C, simplified tree using the ancestralmethod. D, simplified tree using the democratic method. E, simplified tree using d as the exemplar.
taxa when, in fact, f is the sister taxon of only a portion of m, taxon e. In thisexample all three representation methods produce the ‘correct’ result. However,this is not always the case in more complex examples. If the assemblage d,e,f inFigure 5A is replaced by m, each method produces a different character distributionfor m (Fig. 5B) and the relationship of m to the remaining taxa is different in eachinstance (Fig. 5C–E). Nonetheless, in the absence of homoplasy, m always clusterswith one or both of c and g, the taxa with which the members of the paraphyleticassemblage share closest common ancestry.
When homoplasy is present, the representation of paraphyletic assemblages usingthe democratic and exemplar methods can result in the same errors in inferredrelationships that occur with monophyletic groups (see Fig. 2), but now the ancestralmethod is affected as well because of homoplasies shared by taxa outside of theparaphyletic assemblage. Given the relationships and character distribution in Figure

SUPRASPECIFIC TAXA 111
A
a b c d e
m
32
4
B
C
a b m f
2, 3, 4
5, 6, 7
1
5, 6, 7
a f b m
21 lost 2
5, 6, 7
1
5, 6, 7
f
5, 6, 7
Figure 6. Representation of a paraphyletic group—c,d,e—as a single terminal taxon (m) and the effecton topology in the presence of homoplasy. A, original tree. B, consensus of three equally parsimonioussimplified trees using the ancestral method or using c as the exemplar. C, simplified tree using e as theexemplar.
6A, replacement of the paraphyletic assemblage c,d,e by m using either the ancestralmethod or using c as the exemplar changes the inferred relationship of f (Fig. 6B).On the original tree the three characters shared by a and f are interpreted ashomoplasies because characters 1–4 determine the topology of the tree. On Figure6B characters 3 and 4 are not informative and characters 5–7 outweigh characters1 and 2, causing f to cluster with a on all three equally parsimonious trees. Incontrast, if e is chosen as the exemplar, characters 3 and 4 are still informative andthe correct pattern is inferred (Fig. 6C). Using either d as the exemplar or thedemocratic method produces equivocal results.
OverviewThese hypothetical examples demonstrate that incorrect assumptions of mono-
phyly, the method used to represent a group of taxa as single terminals, andhomoplasy in the data all contribute to errors in inferred relationships. Withmonophyletic groups, homoplasy can result in errors using the democratic andexemplar methods. With paraphyletic assemblages errors can occur with all rep-resentation methods. By representing clades or other assemblages of taxa as singleterminals, some characters become uninformative; this can change the ‘balance ofpower’ among incongruent groups of characters, resulting in changes to the re-lationships on the tree. The ancestral method is immune to this phenomenon withmonophyletic groups because it ignores derived characters (potential homoplasies)that occur in only some members of the clade. However, with paraphyletic groups

O. R. P. BININDA-EMONDS ET AL.112
the loss of derived characters can result in errors in inferred relationships; thesecharacters contribute to the support for the relationship between the paraphyleticgroup and taxa that share the same most recent common ancestry, but have beenexcluded from the group (e.g. taxon f in Fig. 6). In summary, these examples suggestthat with real data matrices (which almost invariably contain homoplasy) the inclusionof supraspecific terminal taxa can compromise the outcome of the analysis if (1) thegroups being represented are not monophyletic, and/or (2) the democratic orexemplar methods are used. Errors using the ancestral method can occur if theinferences at the ancestral node are incorrect, a situation that was not addressed inthe examples considered here.
Phocid examples
Background and methodologyEighteen extant and one presumably extinct species of true seal are recognized
and included in this study. This number includes the larga seal (Phoca largha), forwhich species status is debatable, and the Caribbean monk seal (Monachus tropicalis),which is believed to have gone extinct in the early 1950s (Kenyon, 1977). Thefamily is typically divided into two presumably monophyletic subfamilies (followingKing, 1966) corresponding roughly to seals of the northern hemisphere (the Phocinae)and to those of the southern hemisphere plus the sub-tropical northern monk seals(the Monachinae).
Despite its long history in the systematic literature, the first cladistic analysis ofall the extant species of the family was performed only recently (Bininda-Emonds& Russell, 1996) and the monophyly of most higher level phocid taxa has not beenstrongly tested to date. The monophyly of four such taxa below the subfamily levelhas been assumed historically: the genera Mirounga (elephant seals), Monachus (monkseals), and Phoca (sensu Burns & Fay, 1970; harbour seals and close relatives), andthe tribe Lobodontini (Antarctic seals). Of these taxa, suggestions of non-monophylyhave been raised for Monachus (Wyss, 1988; not demonstrated, but endorsed byBerta & Wyss [1994]), Phoca (Chapskii, 1955; de Muizon, 1982; Wyss, 1988; Arnasonet al., 1993, 1995; Mouchaty, Cook & Shields, 1995; Perry et al., 1995; Bininda-Emonds & Russell, 1996), and the Lobodontini (Bininda-Emonds & Russell, 1996).The evidence against the monophyly of Phoca is overwhelming and virtually uni-versally accepted; however, this taxon, like the other two, continues to be recognized.To our knowledge, the non-monophyly of only Mirounga has never been suggested.
We demonstrate the effects of imposed monophyly of higher taxa on phocidphylogeny by representing the above four taxa (Mirounga, Monachus, Phoca, and theLobodontini) individually and collectively as single terminals in an analysis with allremaining phocid species and eight outgroup taxa representing all major caniformlineages. Character states for all taxa were taken from (or derived from in the caseof higher taxa) the 168 morphological characters used by Bininda-Emonds & Russell(1996). Use of this matrix ensured that both monophyletic (Mirounga and Monachus)and paraphyletic (Lobodontini and Phoca) taxa were collapsed.
The exemplars for the four higher level taxa were Leptonychotes weddelli for theLobodontini, and Mirounga leonina, Monachus schauinslandi, and Phoca vitulina for theirrespective genera. We selected these species because they are the best studied withintheir respective taxa, and therefore the most likely to be chosen as exemplars. Both

SUPRASPECIFIC TAXA 113
fossil information and ontogenetic evidence for phocids is largely lacking; therefore,ancestral traits were reconstructed solely from the species-level solution of Bininda-Emonds & Russell (1996) using both accelerated (ACCTRAN) and delayed trans-formation (DELTRAN) optimizations in PAUP 3.1.1 (Swofford, 1993). Ancestralstates for paraphyletic taxa were determined in the same manner as in the hypotheticalexamples. Democratic character states were determined according to an algorithmtaken from Bininda-Emonds and Russell (1996) that attempts to preserve the mostfrequent state(s). Less frequent states were retained (creating a polymorphic taxon)if they occurred with a frequency of one count less than the most frequent one (seeAppendix for a complete description of the algorithm, particularly its handling ofpolymorphic source species). Of these three representation methods, only theancestral method did not create polymorphic higher taxa because PAUP will notgenerate polymorphic ancestral character states (Swofford, 1993).
The condensed matrices were analysed using PAUP’s heuristic search option,with taxa added according to the RANDOM algorithm (with 25 repetitions), TBRbranch swapping on minimal trees only (with steepest descent on), collapsed zerolength branches, and unlimited MAXTREES. When all four supraspecific taxa werecondensed simultaneously, it was possible to employ PAUP’s branch-and-boundsearch option (with collapsed zero length branches), thereby guaranteeing an optimalsolution. Characters were inversely weighted (base weight=100) according to thenumber of character states each possessed and polymorphic taxa were analysedusing the ‘polymorphism’ option. All characters were unordered, with inapplicablecharacter states coded as a discrete state (state 9) rather than as missing. Thereasoning behind this choice of options can be found in Bininda-Emonds & Russell(1996); however, because all trees, including the full species tree, were generatedusing the same assumptions, the appropriateness of the methods used should beirrelevant to the effects of cladistic status and representation method on topology.
Results were compared to the species-level solution of Bininda-Emonds & Russell(1996) (Fig. 7), which, for the purposes of this study, was considered to be correct.We focus primarily on changes in topology; however, we also examined threegoodness-of-fit statistics (CI, RI, and RC) to ascertain changes in the level ofhomoplasy. As CI is known to vary with the size of the data set (Farris, 1989;Sanderson & Donoghue, 1989), CI values were compared to the values expectedfor a matrix of the same size (as calculated from Sanderson & Donoghue [1989]).Comparisons of RI and RC were made to their values in the complete speciessolution because possible relationships between these indices and the size of the datamatrix have not been investigated (RC) or appear to be insignificant (RI; Hauser &Boyajian, 1997). Autapomorphies were ignored in the calculation of CI and RC.Bootstrap frequencies (Felsenstein, 1985) were calculated for each matrix based on1000 bootstrap replicates using a heuristic search with taxa added according to theCLOSE algorithm (with HOLD=10), TBR branch swapping on minimal trees only(with steepest descent off ), collapsed zero length branches, and MAXTREES=100. Characters were sampled with equal probability, with their weights appliedsubsequently.
Monophyly examplesAs in the hypothetical examples, the ancestral method performed demonstrably
better with monophyletic taxa, giving correct answers for both Mirounga and Monachus

O. R. P. BININDA-EMONDS ET AL.114
4
Erignathus barbatus
Phoca fasciata
Phoca groenlandica
Phoca hispida
Phoca sibirica
Phoca caspica
Phoca vitulina
Phoca largha
Halichoerus grypus
Cystophora cristata
Monachus schauinslandi
Monachus tropicalis
Monachus monachus
Lobodon carcinophagus
Ommatophoca rossi
Leptonychotes weddelli
Hydrurga leptonyx
Mirounga angustirostris
Mirounga leonina
outgroups
2
3
1
16 44
24
61
33
62
62
94
82
19
14
27
37
61
98
90
Figure 7. Majority rule consensus solution with bootstrap frequencies (1000 replications) of all extantspecies of phocid seals (plus Monachus tropicalis) and outgroup taxa from Bininda-Emonds & Russell(1996). All nodes were found in both of the two equally most parsimonious solutions. Supraspecifictaxa of interest here indicated as follows: (1) Mirounga, (2) Monachus, (3) Lobodontini, and (4) Phoca (sensuBurns & Fay, 1970). Exemplars for these taxa are in bold face.
(Figs 8 and 9, respectively), regardless of character optimization. The only othercorrect result was obtained using the democratic method with Monachus. On theincorrect topologies, widespread changes were evident, with one subfamily alwaysbeing rendered paraphyletic. For Mirounga, one (Fig. 8C) or both (Fig. 8B) of thephocines Cystophora and Erignathus became sister taxa to the monachines, with furtherchanges within this latter subfamily arising from Ommatophoca being pulled to a morebasal position. With Monachus, only the exemplar method generated a wrong answer,creating a paraphyletic Monachinae with the movement of Monachus from its terminalposition within the monachines to become the sister taxon to all remaining phocids(Fig. 9B). Other changes include the creation of a monophyletic Lobodontini dueto the exclusion of Monachus, and numerous alterations within the phocines (most

SUPRASPECIFIC TAXA 115
Erignathus
P. fasciata
P. groenlandica
P. hispida
P. sibiricaP. caspica
P. vitulina
P. largha
Halichoerus Cystophora
M. schauinslandi
M. tropicalis
M. monachusLobodon
Ommatophoca
Leptonychotes
Hydrurga
Mirounga spp.outgroups
A 60/6021/24
43/4315/17
33/37
63/69
61/70
95/9487/90
25/34
20/28
35/50
42/62
72/66
93/91
Erignathus
P. fasciata
P. groenlandica
P. hispida
P. sibirica
P. caspica
P. vitulina
P. largha
Halichoerus
Cystophora
M. schauinslandi
M. tropicalis
M. monachus
Lobodon
Ommatophoca
Leptonychotes
Hydrurga
Mirounga spp.
outgroups
B19
23
59
6
23
9782
20
95
56
74
41
31
31
74
43
Erignathus
P. fasciata
P. groenlandica
P. hispida
P. sibirica
P. caspicaP. vitulina
P. largha
Halichoerus
Cystophora
M. schauinslandi
M. tropicalis
M. monachus
Lobodon
Ommatophoca
Leptonychotes
Hydrurga
Mirounga spp.
outgroups
C 60
81
48
94
71
40
29
26
72
96
22< 1
< 1
28
46
1943
Figure 8. Ingroup topologies with bootstrap frequencies (1000 replications) resulting from assuming amonophyletic Mirounga as represented using the following methods: (A) ancestral (both ACCTRANand DELTRAN optimization—bootstrap frequencies in that order), (B) democratic, and (C) exemplar(using M. angustirostris). All trees are majority rule consensus solutions, except (C) which was the singlemost parsimonious solution. All nodes occurred in 100% of the equally most parsimonious solutions.Full species names can be found in Figure 7.

O. R. P. BININDA-EMONDS ET AL.116
Erignathus
P. fasciata
P. groenlandica
P. hispida
P. sibirica
P. caspica
P. vitulina
P. largha
Halichoerus
Cystophora
M. angustirostris
M. leonina
Monachus spp.
Lobodon
Ommatophoca
Leptonychotes
Hydrurga
outgroups
A 63/61/60
91/90/90
26/27/21
15/17/16
37/40/31
65/68/62
59/62/66
98/98/98
67/72/52
50/56/36
45/54/28
25/40/1342/66/25
Erignathus
P. fasciata
P. groenlandica
P. hispida
P. sibirica
P. caspica
P. vitulina
P. largha
Halichoerus
Cystophora
M. angustirostris
M. leonina
Monachus spp.
Lobodon
Ommatophoca
Leptonychotes
Hydrurga
outgroups
B 4615
28
29
69
73
6016
7326
14
30
30
89
98
Figure 9. Ingroup topologies with bootstrap frequencies (1000 replications) resulting from assuming amonophyletic Monachus as represented using the following methods: (A) ancestral (both ACCTRANand DELTRAN optimization) and democratic (bootstrap frequencies in that order) and (B) exemplar(using M. schauinslandi). All trees are majority rule consensus solutions with all nodes occurring in 100%of the equally most parsimonious solutions. Full species names can be found in Figure 7.
notably a basal shift for Erignathus). However, this distinctive topology results fromthe choice of Monachus schauinslandi as the exemplar. M. schauinslandi possesses anumber of undoubtedly primitive phocid features that are absent in other monkseals (see Wyss, 1988), which with their removal are sufficient to drag M. schauinslandito a more basal position relative to the remaining phocids (see below also). Use ofeither of the other two monk seals as the exemplar yields the correct or a nearlycorrect topology (results not shown). Clearly, the choice of exemplar for representinga supraspecific taxon is critical.
Paraphyly examplesUnlike the situation for the monophyletic taxa, the exemplar method appears to
be most proficient at maintaining the topology of the full species solution whenparaphyletic taxa are collapsed (within the constraints of collapsing such taxa).Although this method obtained the correct answer when either the Lobodontini orPhoca was collapsed (Figs 10D and 11C, respectively), the dependence of the resultanttopology on the choice of exemplar for Monachus (see above) suggests that thesechoices might simply have been fortuitous. This is true for the Lobodontini in whichthe choice of any other species resulted in disruptions within the phocines and oftena paraphyletic Monachinae as well (results not shown). However, this was not thecase for Phoca, in which six of the seven species retained the correct answer; onlyPhoca largha generated an altered topology (identical to Fig. 11B).
The only other correct answer for the paraphyletic taxa was obtained using thedemocratic method for Phoca (Fig. 11C), while the ancestral method failed in bothinstances, even generating different answers for each optimization (compare Figs

SUPRASPECIFIC TAXA 117
Erignathus
P. fasciata
P. groenlandica
P. hispida
P. sibirica
P. caspica
P. vitulina
P. largha
Halichoerus
Cystophora
Mo. schauinslandi
Mo. tropicalis
Mo. monachus
Lobodontini
Mi. leonina
outgroups
C 41
Mi. angustirostris
13
26
24
52
66
1360
2595
76
50
95
85
Erignathus
P. fasciata
P. groenlandica
P. hispida
P. sibirica
P. caspica
P. vitulina
P. largha
Halichoerus
Cystophora
Mo. schauinslandi
Mo. tropicalis
Mo. monachus
Lobodontini
Mi. leonina
outgroups
D 60
Mi. angustirostris
22
4215
28
48
82
80 94
76
45
61
96
Erignathus
P. fasciata
P. groenlandica
P. hispida
P. sibirica
P. caspica
P. vitulina
P. largha
Halichoerus
Cystophora
Mo. schauinslandi
Mo. tropicalis
Mo. monachus
Lobodontini
Mi. leonina
outgroups
A 42
Mi. angustirostris
74
23
9847
96
91
Erignathus
P. fasciata
P. groenlandica
P. hispida
P. sibirica
P. caspica
P. vitulina
P. largha
Halichoerus
Cystophora
Mo. schauinslandi
Mo. tropicalis
Mo. monachus
Lobodontini
Mi. leonina
outgroups
B 44
Mi. angustirostris97
30
30
66 16
59
86
17
30
30
69 16
59
78
27
23
91
88
96
Figure 10. Ingroup topologies with bootstrap frequencies (1000 replications) resulting from assuminga monophyletic Lobodontini as represented using the following methods: (A) ancestral (ACCTRANoptimization), (B) ancestral (DELTRAN optimization), (C) democratic, and (D) exemplar (usingLeptonychotes weddelli). All trees are majority rule consensus solutions with all nodes occurring in 100%of the equally most parsimonious solutions. Full species names can be found in Figure 7.

O. R. P. BININDA-EMONDS ET AL.118
Erignathus
Phoca spp.
Halichoerus
Cystophora
Mo. schauinslandi
Mo. tropicalis
Mo. monachus
Lobodon
Mi. leonina
outgroups
A 79
Mi. angustirostris
Hydrurga
Leptonychotes
Ommatophoca
65
62
94
84
22
15
29
33
64
98
Erignathus
Phoca spp.
Halichoerus
Cystophora
Mo. schauinslandi
Mo. tropicalis
Mo. monachus
Lobodon
Mi. leonina
outgroups
B 11
Mi. angustirostris
Hydrurga
Leptonychotes
Ommatophoca
53
95
83
20
13
26
30
68
99
86
Erignathus
Phoca spp.
Halichoerus
Cystophora
Mo. schauinslandi
Mo. tropicalis
Mo. monachus
Lobodon
Mi. leonina
outgroups
C 66/43
Mi. angustirostris
Hydrurga
Leptonychotes
Ommatophoca
59/56
94/95
85/82
23/23
15/16
30/32
34/40
63/69
98/99
66/41
93/90
Figure 11. Ingroup topologies with bootstrap frequencies (1000 replications) resulting from assuminga monophyletic Phoca (sensu Burns & Fay, 1970) as represented using the following methods: (A)ancestral (ACCTRAN optimization), (B) ancestral (DELTRAN optimization), and (C) democratic andexemplar (using P. vitulina) (bootstrap frequencies in that order). All trees are the single most parsimonioussolution. Full species names can be found in Figure 7.

SUPRASPECIFIC TAXA 119
T 1. Selected parameters describing the species-level phocid tree and trees resulting from therepresentation of four supraspecific phocid taxa as single terminals. Goodness-of-fit indices refer to themost parsimonious solution(s) and not a consensus tree. MPT=number of most parsimonious trees.Expected CI refers to the value expected for a study of n taxa (includes eight outgroup taxa) as
calculated from Sanderson & Donoghue (1989)
ExpectedMatrix Length MPT CI1 CI RI RC
Full species solution (n=27) 69 834 2 0.456 0.461 0.629 0.287
Lobodontini (n=24) 0.495ancestral (ACCTRAN) 60 214 4 0.472 0.642 0.303ancestral (DELTRAN) 59 998 4 0.473 0.644 0.305democratic 62 810 2 0.475 0.638 0.303exemplar 62 228 2 0.472 0.633 0.299
Mirounga (n=26) 0.472ancestral (ACCTRAN) 66 757 2 0.459 0.627 0.288ancestral (DELTRAN) 66 366 2 0.458 0.629 0.288democratic 68 996 2 0.464 0.630 0.292exemplar 67 880 1 0.460 0.623 0.287
Monachus (n=25) 0.483ancestral (ACCTRAN) 63 186 2 0.467 0.637 0.297ancestral (DELTRAN) 62 525 2 0.469 0.646 0.303democratic 66 550 2 0.470 0.634 0.298exemplar 65 036 2 0.463 0.619 0.287
Phoca (n=21) 0.532ancestral (ACCTRAN) 59 878 1 0.469 0.609 0.286ancestral (DELTRAN) 59 618 1 0.471 0.612 0.255democratic 60 309 1 0.470 0.610 0.287exemplar 61 259 1 0.467 0.601 0.281
All groups (n=15) 0.618ancestal (ACCTRAN) 40 331 4 0.509 0.616 0.314ancestral (DELTRAN) 39 602 1 0.514 0.630 0.324democratic 49 058 1 0.518 0.634 0.328exemplar 46 293 2 0.507 0.584 0.296
1 Note that the ‘polymorphism’ option in PAUP inflates CI values compared to the conditions under which theexpected values were derived. Therefore, the relative decreases in CI are actually greater than indicated.
10A and B, and 11A and B). For the Lobodontini, the incorrect phylogeniesall produced a paraphyletic Monachinae (with varying relationships among themonachine taxa) and shifted Erignathus basally within the Phocinae. Changes intopology with Phoca were restricted to the four phocine taxa.
Levels of homoplasy and supportConcomitant with the topological changes noted above, the use of supraspecific
taxa also affected the amount of homoplasy found in the condensed solutions. Theslight absolute rise in the CIs of the condensed solutions (Table 1) points to anoverall decrease in homoplasy associated with collapsing a number of species (whichcan conflict with one another and share homoplasies with species outside of thegroup, thereby lowering the CI) into a single terminal. However, this decrease islocalized and does not translate to the remainder of the tree in any amount to raisethe CIs to the levels expected for the decreased number of terminals.

O. R. P. BININDA-EMONDS ET AL.120
T 2. Results of nonparametric tests examining the influenceof the representation method employed (‘method’), the taxoncollapsed (‘taxon’), the accuracy of the topology (‘accuracy’), andthe cladistic status of the collapsed taxa (‘status’) on the values ofselected goodness-of-fit indices. The former two factors were ana-lysed using a Kruskal–Wallis test (value given is H corrected forties with n=4 for each sample), while the latter two were analysedusing a Mann–Whitney test (value given is Us with n=n′=8).
Significant results (P<0.05) are indicated with an asterisk
FactorMethod Taxon Accuracy Status
CI 0.821 13.386∗ 33.5 63.5∗RI 2.537 11.206∗ 32.0 38.0RC 0.821 11.333∗ 34.0 33.0
Compared to the levels found in the full species solution, only the taxon that wascollapsed significantly influenced the amount of change in RI and RC (Table 1);differences in these values were independent of the representation method, theaccuracy of the topology, or the cladistic status of the supraspecific taxon (Table 2).Differences in CI (relative to the expected value given the number of taxa) wereinfluenced not only by the taxon but also by its cladistic status (Table 2), withparaphyletic taxa showing a greater relative decrease. Although this result couldmean that higher level studies with lower than expected CIs might have includedterminals that represent paraphyletic taxa, we believe that the significant resultobserved here is a size effect. Data matrices with fewer terminals had CIs that wereproportionately smaller than expected (Table 1; note especially when all four taxaare simultaneously condensed). As it happens, collapsing the two paraphyletic taxayields the smallest matrices.
Analyses in which Phoca was represented by a single terminal resulted in thelargest decrease in CI and the only decreases in RI and RC (ignoring that taxonnumber might also influence these two indices). This suggests that Phoca, despiteshowing a reasonably low level of character identity among its constituent species(Table 4; see below), contains relatively few homoplasies, either within the group orwith the other phocid species. The fact that all but one species of Phoca yield thesame result when used as the exemplar supports this suggestion. Thus, collapsingthis genus to a single terminal removes this consistent region from the tree, causingthe RI and RC to decrease because of those relatively more homoplastic groupsthat remain. Similarly, the Lobodontini and Monachus probably contain relativelymore homoplasies (which reduction to a single terminal eliminates, thereby raisingthe RI and RC), whereas Mirounga possesses an average amount of homoplasy(reduction to a single terminal has no effect on RI or RC). In contrast, Bininda-Emonds & Russell (1996) argued that the relationships among monachines weremore stable and robust than for those among phocines.
Bootstrap values were roughly similar between the nodes of the full species andthe various condensed solutions (compare Fig. 7 with Figs 8–12). Despite this generalconsistency in bootstrap values, some clades with bootstrap support above 60% aremissing from one or more of the condensed solutions. The bootstrap cannot recognizeerroneous clades because it can only indicate the support for a particular clade in

SUPRASPECIFIC TAXA 121
Erignathus
Phoca. spp.
Halichoerus
Cystophora
Monachus spp.
Lobodontini
outgroups
A 65*
71*
59
Mirounga spp.
92
79
Erignathus
Phoca. spp.
Halichoerus
Cystophora
Monachus spp.
Lobodontini
outgroups
B
Mirounga spp.
57
23
69
74
76
89
Erignathus
Phoca. spp.
Halichoerus
Cystophora
Monachus spp.
Lobodontini
outgroups
C
39
Mirounga spp.94 46
Erignathus
Phoca. spp.
Halichoerus
Cystophora
Monachus spp.
Lobodontini
outgroups
D
Mirounga spp.52
27
72
60
8224
55
43
Figure 12. Ingroup topologies with bootstrap frequencies (1000 replications) resulting from assumingthe monophyly of the four higher level phocid taxa Lobodontini, Mirounga, Monachus, and Phoca (sensuBurns & Fay, 1970) as represented using the following methods: (A) ancestral (ACCTRAN optimization),(B) ancestral (DELTRAN optimization), (C) democratic, and (D) exemplar. A and D are majority ruleconsensus solutions. All nodes were found in 100% of the equally most parsimonious solutions exceptthose in A marked with an asterisk which were found in 75%. Full species names can be found inFigure 7.
a given data set and cannot, as is commonly believed, determine its historical reality(as pointed out by Hillis & Bull [1993]). In the condensed trees (Figs 8–12), thereduced number of terminals alters the levels of support due to a decreased numberof possible alternative groupings and possibly an increased number of charactersper node. For instance, reducing the Phocinae to four terminals when Phoca iscollapsed dramatically reduces the number of alternative groupings, inflating thesupport for those possibilities that remain. This is another manifestation of thebootstrap only being able to assess support for relationships allowed by the datamatrix (see Bininda-Emonds & Russell, 1996). Thus, bootstrap support for groupson smaller trees may be relatively high even if levels of homoplasy in the data arealso relatively high.
DISCUSSION
Underlying causes: character identities
The hypothetical examples showed that homoplasy in the data can producechanges in topology when supraspecific taxa are replaced by single terminals because

O. R. P. BININDA-EMONDS ET AL.122
T 3. Pairwise matrices of character identities between the different representations of a givenhigher level phocid taxon and between each and the constituent species of the taxon. Presented asnumber of characters (out of 168) with at least one state in common (liberal identity; above thediagonal) and with all states in common (conservative identity; below the diagonal). Asterisks indicate
pairs of methods that produced the same (correct) topology
Lobodontini ancestral ancestral democratic exemplar all species(ACCTRAN) (DELTRAN)
ancestral (ACCTRAN) — 158 160 163 91ancestral (DELTRAN) 158 — 158 144 91democratic 112 111 — 140 91exemplar 112 116 113 — 91all species 66 65 65 66 —
Mirounga ancestral ancestral democratic exemplar all species(ACCTRAN) (DELTRAN)
ancestral (ACCTRAN) — 156∗ 168 168 147ancestral (DELTRAN) 156∗ — 167 159 147democratic 112 111 — 156 140exemplar 137 133 130 — 147all species 115 110 110 115 —
Monachus ancestral ancestral democratic exemplar all species(ACCTRAN) (DELTRAN)
ancestral (ACCTRAN) — 154∗ 167∗ 168 113ancestral (DELTRAN) 154∗ — 161∗ 140 113democratic 102∗ 100∗ — 131 110exemplar 108∗ 124∗ 115 — 113all species 78 78 78 78 —
Phoca ancestral ancestral democratic exemplar all species(ACCTRAN) (DELTRAN)
ancestral (ACCTRAN) — 164 166 159 98ancestral (DELTRAN) 164 — 164 152 98democratic 146 144 — 151∗ 98exemplar 133 135 135∗ — 98all species 85 85 85 85 —
of shifts in the ‘balance of power’ among characters. In the more complex phocidexamples, such changes can often be linked to a small number of key characters.The best example for this is when Monachus schauinslandi was used as the exemplarfor Monachus. M. schauinslandi is characterized by numerous primitive phocid featuresand the basal movement of Monachus in this example to become the sister taxon toall other phocids (see Fig. 9B) can be tied largely to three of them: characters 17,41, and 69 (see Appendix B in Bininda-Emonds & Russell [1996]). In a re-analysiswith these characters either excluded or coded as missing for Monachus, Monachusclusters among the lobodontines, albeit as the sister taxon to Ommatophoca, and theMonachinae is monophyletic. Although this topology is not entirely correct, it ismuch closer to the full species tree and illustrates the large effect that only threecharacters out of 168 can produce.
To provide a more general overview, we quantified the similarity in characterstates (‘character identity’) between the various phocid terminals (representing eithersupraspecific taxa or species) (Tables 3 and 4). Due to the large amount ofpolymorphism, we measured character identities as either ‘liberal,’ where the taxain question share at least one state for a given character, or ‘conservative,’ whereall taxa must possess the identical character state(s) for that character.

SUPRASPECIFIC TAXA 123
T 4. Numbers of characters (out of 168) among the constituentspecies of four higher level phocid taxa with at least one state incommon (liberal identity) and with all states in common (conservative
identity)
Taxon Liberal identity Conservative identity
Lobodontini 91 66Mirounga 147 115Monachus 113 78Phoca 98 85
The character identity among a supraspecific taxon, as represented using anymethod, and its constituent species (Table 3) closely matched the identity betweenthe species themselves (Table 4). However, identities between the representationmethods (Table 3) were generally higher than either of these other two sets ofidentities (although this may relate to the numbers of taxa being compared in eachinstance). Therefore, the various representation methods provide similar ap-proximations of a given supraspecific taxon, but ones that cannot account for thediversity of information present among all the constituent species. The latterobservation explains why changes in topology occur (i.e. by retaining only someinformation, we run the risk of discarding phylogenetically informative charactersand retaining homoplasies, thereby misrepresenting the groundplan states), whilethe former provides further evidence that changes in a few key characters can resultin large changes in topology. Marked diversity among members of a supraspecifictaxon (as observed here) can be problematic for the exemplar method because theresulting terminal taxon is more likely to include character states that misrepresentthe phylogenetic position of the group for a greater number of characters. Thedemocratic method, in constructing the ‘average’ of the constituent members, andespecially the ancestral method, in attempting to reconstruct the hypotheticalancestor, are more immune to this problem.
Beyond this, however, the explanatory power of the character identities is limited;only a few trends are evident in the data. Between representation methods, liberalidentities were typically around 95%, whereas conservative identities ranged from60 to 80% (Table 3). Liberal identities tend to be very similar except those betweenthe exemplar and either of the ancestral (DELTRAN optimization only) or democraticmethods, which are noticeably lower. For conservative identities, there was strongsimilarity (over 90%) between the ACCTRAN and DELTRAN variants of theancestral method. The democratic method may also resemble the exemplar methodmore than it does the ancestral method, but only for monophyletic taxa. Finally,there is no apparent relationship between character identity and changes in topology(as quantified by the symmetric-difference metric; Penny & Hendy, 1985), as onlyMirounga demonstrated a significant (negative) regression (results not shown). Thisalso illustrates the large effect that a few key characters can have on topology.
Given the large amount of polymorphism in the phocid data matrix, it isunsurprising that different representations of a supraspecific taxon with high liberalcharacter identities can yield different topologies. Monachus provides an example:the democratic and exemplar methods show 100% identity (Table 3), but producestrikingly different solutions (compare Figs 9A and B). Similarly, the two species of

O. R. P. BININDA-EMONDS ET AL.124
Mirounga share 87.5% character identity (Table 3), but produce very differentsolutions when each is used as the exemplar of the genus (M. angustirostris obtains asolution reasonably close to the full species tree; results not shown). Large topologicaldifferences can occur despite high conservative identities as well. In the two variantsof the ancestral method for either the Lobodontini or Phoca (Figs 10A,B and 11A,B), the differences in topology arise, at most, due to 10 and four characters,respectively (Table 3).
Multiple taxa and interactive effects
Thus far, we have only examined the outcome when a single supraspecific taxonis collapsed to a single terminal. However, it is likely that more than one such taxonwill be condensed at once, especially in studies aimed at elucidating relationships athigher taxonomic levels. Therefore, to determine the topological changes that the useof multiple supraspecific terminal taxa might induce, we simultaneously condensed allpossible combinations of the four higher level phocid taxa. Clear trends were evident,so we will restrict the detailed presentation of results to instances where all four taxawere condensed.
The inclusion of four supraspecific terminal taxa (Fig. 12) produced similar resultsto analyses involving only one such taxon. Again, the ancestral method arguablyperformed the best. Although no method generated a tree with Erignathus and Phocaas sister taxa (the topology among phocines that would most closely match that inFig. 7), only the ancestral method either preserved the topology for the monachines(Fig. 12B) or did not contradict it (Fig. 12A). Overall, changes were less extremethan when individual taxa were collapsed (possibly due to there being fewer taxain the analysis to be affected), as the only instance of a subfamily being renderedparaphyletic was the monachines using the democratic method (Fig. 12C).
Figure 12 also includes some novel topologies, presumably due to interactiveeffects. The tree obtained using the democratic method (Fig. 12C) contains atopology for the monachines that was not generated when any of the four taxa werecondensed individually using this method. The closest topology is that producedwhen the Lobodontini alone was condensed (Fig. 10A). Similarly for the exemplarmethod (Fig. 12D), the topologies of neither the monachines nor the phocines werefound in the results when single supraspecific taxa were included as terminals. Inboth cases, the closest topology involves the representation of Monachus (Fig. 9B).The ancestral method did not display any novel topologies from interactive effectsin this example.
The 10 other combinations of collapsing the four supraspecific taxa (Table 5)produced similar results to those described above. The correct topology was rarelymaintained, occurring most often using the ancestral method when at least one ofthe taxa is monophyletic. The democratic method retained the correct topologyonly once and the exemplar method not at all. The frequency of novel topologiescreated through interactive effects differed among the representation methods,ranging from rare for the ancestral method (either optimization criterion) to ubi-quitous for the democratic and exemplar methods. The exemplar method, inparticular, often produced novel topologies that were very different from both thefull species solution and those solutions obtained when only one supraspecific taxonwas included in the analysis.

SUPRASPECIFIC TAXA 125
The novel topologies and probable interactive effects highlight the potentialcomplexity of the problem when, as is commonly done, two or more supraspecificterminal taxa are included in phylogenetic analyses. Clearly, this practice increasesthe probability of obtaining a wrong result (although it did lead to a more correctanswer in the case of the democratic method with the Lobodontini and Miroungacollapsed) and it is extremely difficult to identify specific causes for altered topologies.
Problems with paraphyly
In both the hypothetical and phocid examples, topologies consistent with thoseof complete species-level trees were obtained more often when monophyletic, ratherthan paraphyletic, supraspecific taxa were replaced with single terminals. Theproblems with collapsing paraphyletic taxa are emphasized by considering thephocid examples using the ancestral method, in which the ancestral states werederived from the same data as the topology with which the condensed trees werecompared. As a result of this somewhat circular methodology, the ancestral methodmight be expected to generate the correct answer. Nonetheless, incorrect topologieswere obtained when paraphyletic supraspecific taxa were collapsed. These resultsindicate that the representation of paraphyletic groups is the cause of the incorrecttopologies. As the hypothetical examples show, the combination of paraphyleticgroups and homoplasy provides the only situation when correct application of theancestral method goes astray. These examples also demonstrate that the use ofparaphyletic supraspecific taxa contributes to changes in topology using the demo-cratic and exemplar methods; thus, it is clear that the use of such taxa will likelylead to errors in our analyses.
These results highlight the dangers of including supraspecific taxa of uncertaincladistic status as terminals in phylogenetic analyses. If these taxa are paraphyletic,the resultant cladogram is likely to be wrong. On the other hand, a correct resultis probable when the supraspecific taxa are monophyletic and represented asterminals using the ancestral method. However, because we cannot know from theanalysis itself whether the taxa included are monophyletic or not, a key objectiveof systematic analysis should be the elimination of paraphyletic taxa. This emphasizesthe importance of species level analyses: monophyletic taxa at the lower levels needto be identified so that these taxa can be collapsed to allow relationships at a higherlevel to be resolved. This approach contrasts slightly with the viewpoint of Yeates(1995), who stated that neither higher nor lower level analyses should have prioritybecause both interact and depend on one another. Although this reciprocal il-lumination is necessary at least to provide outgroups, especially when higher levelrelationships are poorly known, Yeates did not examine the issue of paraphyly. Forgroups where higher level relationships are more resolved, this problem provides astrong argument for giving priority to a ‘species-up’ approach.
Assessment of representation methods
Both Yeates (1995) and ourselves have argued from first principles that the correctway to represent a monophyletic supraspecific taxon is to infer the character statesof its most recent common ancestor. Of the methods used herein, the ancestral

O. R. P. BININDA-EMONDS ET AL.126
T 5. Summary of analyses in which more than one supraspecific phocid taxon (1=Mirounga, 2=Monachus, 3=Lobodontini, and 4=Phoca) was collapsed at once. Table entries are efficacy at maintainingthe topology of the species-level solution (+=maintained,−=altered, ?=uncertain due to polytomy)/summary of interactive effects giving rise to clades not found when only a single taxon was collapsed(M=in Monachinae only, P=in Phocinae only, B=in both subfamilies, N=in neither subfamily, ?=
uncertain due to polytomy)
Representation methodCollapsed ancestral ancestral democratic examplartaxa (ACCTRAN) (DELTRAN)
1+2 +/N +/N −/M −/M1+2+3 +/N +/N −/M −/N1+2+4 ?/P? −/N −/P? −/M1+3 −/N −/M −/P −/N1+3+4 −/N −/M −/M? −/B1+4 ?/P? −/N −/P? −/B2+3 +/N +/N −/M? −/B2+3+4 −/N −/N −/M? −/B2+4 ?/P? −/N +/N −/N3+4 −/N −/N −/N −/P1+2+3+4 −/M? −/N −/M −/B
T 6. Efficacy of the various representation methods in maintaining the topology of the species-level solution when particular supraspecific terminal taxa are present. Concurrence is indicated by a
plus sign and discordance by a minus sign
Reconstruction Monophyletic taxa Paraphyletic taxamethod Mirounga Monachus Lobodontini Phoca
ancestral (ACCTRAN) + + − −ancestral (DELTRAN) + + − −democratic − + − +exemplar − − + +
method most closely achieves this goal and should produce trees that best matchthe topology of the full species solution. This was borne out in the phocid results(Tables 5 and 6), where the representation of the different supraspecific taxa usingthis method generated topologies that were often the same, or very similar to, thatof the complete species solution. The hypothetical examples showed that the ancestralmethod is particularly sensitive to the cladistic status of the taxa it is representing.Given that the ancestral states are inferred correctly, the ancestral method isextremely robust at representing monophyletic taxa. With paraphyletic taxa, however,homoplastic characters in the excluded members of the corresponding clade cancause this method to err. These findings were confirmed using the phocid examples.
Although the (single) exemplar method occasionally produced correct answers(particularly with the paraphyletic phocid taxa; Table 6), these instances were moreoften the result of good luck. Success using this method often depends on whichspecies is chosen as the exemplar. Unfortunately, we usually lack the knowledge tomake an informed decision and species are often chosen instead on practical grounds.Exemplars for paraphyletic taxa that are more closely related to excluded membersof the least inclusive clade may be more likely to produce more correct topologiesbecause these exemplars share more apomorphies with the excluded taxa (e.g. taxa
SUPRASPECIFIC TAXA 127
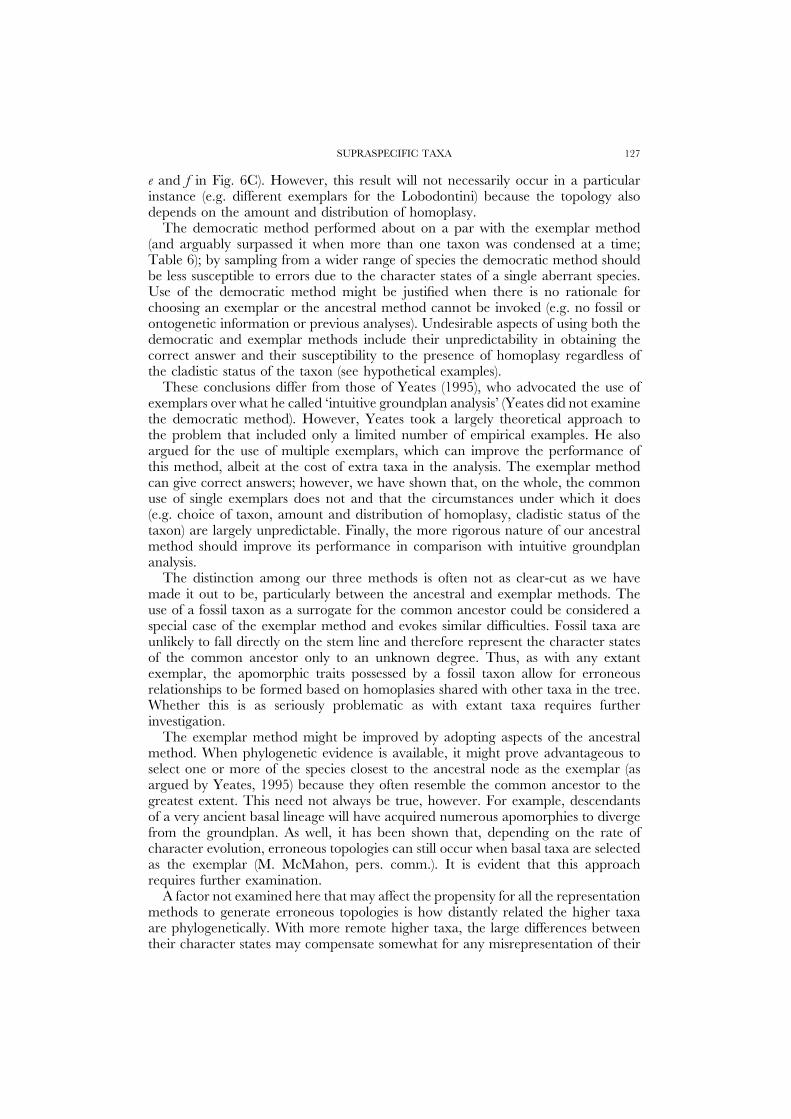
e and f in Fig. 6C). However, this result will not necessarily occur in a particularinstance (e.g. different exemplars for the Lobodontini) because the topology alsodepends on the amount and distribution of homoplasy.
The democratic method performed about on a par with the exemplar method(and arguably surpassed it when more than one taxon was condensed at a time;Table 6); by sampling from a wider range of species the democratic method shouldbe less susceptible to errors due to the character states of a single aberrant species.Use of the democratic method might be justified when there is no rationale forchoosing an exemplar or the ancestral method cannot be invoked (e.g. no fossil orontogenetic information or previous analyses). Undesirable aspects of using both thedemocratic and exemplar methods include their unpredictability in obtaining thecorrect answer and their susceptibility to the presence of homoplasy regardless ofthe cladistic status of the taxon (see hypothetical examples).
These conclusions differ from those of Yeates (1995), who advocated the use ofexemplars over what he called ‘intuitive groundplan analysis’ (Yeates did not examinethe democratic method). However, Yeates took a largely theoretical approach tothe problem that included only a limited number of empirical examples. He alsoargued for the use of multiple exemplars, which can improve the performance ofthis method, albeit at the cost of extra taxa in the analysis. The exemplar methodcan give correct answers; however, we have shown that, on the whole, the commonuse of single exemplars does not and that the circumstances under which it does(e.g. choice of taxon, amount and distribution of homoplasy, cladistic status of thetaxon) are largely unpredictable. Finally, the more rigorous nature of our ancestralmethod should improve its performance in comparison with intuitive groundplananalysis.
The distinction among our three methods is often not as clear-cut as we havemade it out to be, particularly between the ancestral and exemplar methods. Theuse of a fossil taxon as a surrogate for the common ancestor could be considered aspecial case of the exemplar method and evokes similar difficulties. Fossil taxa areunlikely to fall directly on the stem line and therefore represent the character statesof the common ancestor only to an unknown degree. Thus, as with any extantexemplar, the apomorphic traits possessed by a fossil taxon allow for erroneousrelationships to be formed based on homoplasies shared with other taxa in the tree.Whether this is as seriously problematic as with extant taxa requires furtherinvestigation.
The exemplar method might be improved by adopting aspects of the ancestralmethod. When phylogenetic evidence is available, it might prove advantageous toselect one or more of the species closest to the ancestral node as the exemplar (asargued by Yeates, 1995) because they often resemble the common ancestor to thegreatest extent. This need not always be true, however. For example, descendantsof a very ancient basal lineage will have acquired numerous apomorphies to divergefrom the groundplan. As well, it has been shown that, depending on the rate ofcharacter evolution, erroneous topologies can still occur when basal taxa are selectedas the exemplar (M. McMahon, pers. comm.). It is evident that this approachrequires further examination.
A factor not examined here that may affect the propensity for all the representationmethods to generate erroneous topologies is how distantly related the higher taxaare phylogenetically. With more remote higher taxa, the large differences betweentheir character states may compensate somewhat for any misrepresentation of their

O. R. P. BININDA-EMONDS ET AL.128
groundplans, although long edge attraction (see Hendy & Penny, 1989; Soltis &Soltis, 1996) remains a potential problem for molecular data. Situations in whichthe taxa are more closely related, or part of a rapid adaptive radiation in whichfewer phylogenetically informative characters evolve, are of greater concern. In suchcases, it is critical that the character states of supraspecific terminal taxa accuratelyreflect their groundplans. Our evidence suggests that the ancestral method is bestable to achieve this.
Implications for molecular studies
Although the present study is relevant to all types of phylogenetic analysis, theimplications are perhaps the most serious for analyses of molecular data, where theexemplar method is commonly used both for practical reasons and because of thenature of the data themselves. The relatively few species that have been sampled todate for a limited number of biomolecules not only rules out the democratic method,but often the ancestral method as well because there have not been enough studiesto posit a hypothetical common ancestor with any degree of confidence. Estimationof the common ancestor is also hindered by the rapid degeneration of manyphylogenetically useful sources of molecular data, DNA in particular (Lindahl,1993a, b; Logan, Boon & Eglinton, 1993). Thus, we are unlikely to discover fossilmolecular data of sufficient quantity to be useful.
The literature contains numerous molecular studies that include results that mostwould consider incorrect (e.g. Simonsen, 1982; Schreiber et al., 1994; Allard &Carpenter, 1996). Typically, such results are explained away by citing any of anumber of factors: the use of an insufficient amount of data (e.g. Cao et al., 1994;D’Erchia et al., 1996; see also Cummings et al., 1995); a period of anomalousmolecular evolution in one or more of the species and/or rate heterogeneity ingeneral (e.g. Schreiber et al., 1994; Freye & Hedges, 1995); implications of inferiordata (e.g. Ledje & Arnason, 1996); the use of different analytical procedures (e.g.D’Erchia et al., 1996; see also Hillis, Huelsenbeck & Cunningham, 1994); the useof different genes (e.g. Cummings et al., 1995; Allard & Carpenter, 1996); or theuse of an inappropriate or overly simplistic model of molecular evolution (e.g. Caoet al., 1994). Although these factors are frequently important, our results suggestthat the use of the exemplar method is another, not necessarily mutually exclusive,factor which might be causing errors in analyses.
Although the number of exemplars needed in an analysis depends on manyfactors (e.g. size of the group, rate of evolution), we suggest that molecular studiescontaining only a few representatives of the relevant species be treated with somereservation. As we have demonstrated, the single exemplar method is liable toproduce erroneous topologies. Although this is true of the other representationmethods as well, the exemplar method is unpredictable because it is dependent onthe choice of the taxon. The selection of a different set of species may producemarkedly different results (Lecointre et al., 1993). A recent example is the debateconcerning rodent monophyly (specifically, the phylogenetic placement of the guineapig, Cavia porcellus, and other caviomorphs with respect to the remaining rodents).Numerous studies typically using, at most, four of the approximately 1800 rodentspecies, and often different sets of species, are divided between opposite conclusions(e.g. compare Graur et al., 1991; Ma et al., 1993; D’Erchia et al., 1996 with Martignetti

SUPRASPECIFIC TAXA 129
& Brosius, 1993; Cao et al., 1994; Freye & Hedges, 1995). Given our findings, thelack of agreement on this issue is not surprising. Although the factors mentionedabove have all been cited as reasons for the lack of consensus, and no doubtcontribute to the problem, we suggest that any errors are likely exacerbated throughthe use of the exemplar method.
CONCLUSIONS
This study clearly demonstrates the potential dangers of including supraspecificterminal taxa in phylogenetic analyses. However, we do not decry the value of higherlevel analyses in general. Species-level analyses are impractical when attempting toelucidate higher level relationships. But, before conducting such analyses, themonophyly of any higher taxa that will be represented by terminals should becorroborated; we cannot otherwise confidently detect when monophyly has beenforced on non-monophyletic taxa. Likewise, no representation method is able toconsistently produce correct topologies when non-monophyletic supraspecific taxaare represented by single terminals.
Of the three methods discussed herein, the ancestral method is the most likely tomaintain the correct topology because it attempts to infer the character states ofthe groundplan (the ideal scenario from first principles). This was reflected in ourexamples where the ancestral method was demonstrably superior at maintainingthe general topology of the full species solutions, particularly when monophyletictaxa were collapsed. In contrast, reconstructing the groundplan does not appear tobe the explicit aim of either the democratic or (single) exemplar methods and bothproduced a larger proportion of incorrect answers, with little obvious pattern as tothe conditions under which these methods failed. When more than one supraspecifictaxon was represented simultaneously, all three methods, albeit to a lesser extentfor the ancestral method, displayed undesirable interactive effects where the resultanttopology included different clades than when the taxa were collapsed individually.The ancestral and exemplar methods are not always completely separable (e.g. aspecific fossil taxon that is used as a surrogate ancestor could also be considered asan exemplar) and the ancestral method can influence the choice of exemplars (e.g.the use of basal exemplars that are expected to more closely resemble the ancestor).The exemplar method might also be improved through the use of multiple exemplars(see Yeates, 1995). One factor that causes representation methods to fail is homoplasyin the data; the ancestral method is affected less often because, by inferring thegroundplan of the taxon, it ignores homoplasy in individual members of the group.
The superiority of the ancestral method for representing supraspecific taxa hasserious implications for molecular analyses where this method is rarely, if ever,employed. Instead, the predominant use of the exemplar method, together with anoften limited selection of all the potential species, can lead to erroneous topologiesand a lack of agreement among studies. Although numerous other factors have beencited as reasons for these disagreements, we suggest that the use of the exemplarmethod must be included in this list.
In conclusion, we advocate general caution whenever supraspecific taxa arereplaced by terminals in an analysis. Although the ancestral method performed thebest in this study, the issue of how the ancestral states are arrived at (e.g. through

O. R. P. BININDA-EMONDS ET AL.130
fossil data, ontogenetic evidence, or based on previous phylogenetic analyses) mightaffect the outcome of the analysis, requiring more research. In addition, we stressthe errors that might accrue by tacitly assuming the monophyly of higher level taxa.Such assumptions may be causing us to include paraphyletic taxa in our analyses,thus increasing the probability of generating an erroneous topology (beyond thenecessary exclusion of one or more constituent taxa). Supraspecific terminal taxaimply hypotheses of monophyly, but these hypotheses must be tested beforehandbecause they can never be falsified by higher level analyses in which they are tacitlyassumed. Therefore, it is vital that we verify the cladistic status of all supraspecifictaxa that are included in an analysis.
ACKNOWLEDGEMENTS
This paper grew from the Master’s research of the first author. For theirassistance throughout that process, the efforts of Marc Ereshefsky, GordonPritchard, and Herb Rosenberg are gratefully acknowledged. Valuable commentsand other help on later, continually expanding instars of the manuscript wereprovided by Alan Cooper, Paul Harvey, Colleen Kelly, Michelle McMahon,Sean Nee, Rod Page, Andy Purvis, and two anonymous reviewers. Financialsupport was provided by Alberta Heritage, the United Kingdom’s OverseasResearch Scholarship plan, and an NSERC postgraduate scholarship (OBE) andan NSERC operating grant (APR).
REFERENCES
Adachi J, Hasegawa M. 1995. Phylogeny of whales: dependence of inference on species sampling.Molecular Biology and Evolution 12: 177–179.
Allard MW, Carpenter JM. 1996. On weighting and congruence. Cladistics 12: 183–198.Arnason U, Bodin K, Gullberg A, Ledje C, Mouchaty S. 1995. A molecular view of pinniped
relationships with particular emphasis on the true seals. Journal of Molecular Evolution 40: 78–85.Arnason U, Gullberg A, Johnsson E, Ledje C. 1993. The nucleotide sequence of the mitochondrial
DNA molecule of the grey seal, Halichoerus grypus, and a comparison with mitochondrial sequencesof other true seals. Journal of Molecular Evolution 37: 323–330.
Arnason U, Johnsson E. 1992. The complete mitochondrial DNA sequence of the harbor seal,Phoca vitulina. Journal of Molecular Evolution 34: 493–505.
Arnold EN. 1981. Estimating phylogenies at low taxonomic levels. Zeitschrift fur Zoologische Systematikund Evolutionsforschung 19: 1–35.
Berta A, Wyss AR. 1994. Pinniped phylogeny. In: Berta A, Demere TA, eds. Contributions in marinemammal paleontology honoring Frank C. Whitmore, Jr. Proceedings of the San Diego Society of NaturalHistory 29, 33–56.
Bininda-Emonds ORP, Russell AP. 1996. A morphological perspective on the phylogeneticrelationships of the extant phocid seals (Mammalia: Carnivora: Phocidae). Bonner zoologische Mono-graphien 41: 1–256.
Bryant HN. 1991. The polarization of character transformations in phylogenetic systematics: role ofaxiomatic and auxiliary assumptions. Systematic Zoology 40: 433–445.
Bryant HN, Russell AP, Fitch WD. 1993. Phylogenetic relationships within the extant Mustelidae(Carnivora): appraisal of the cladistic status of the Simpsonian subfamilies. Zoological Journal of theLinnean Society 108: 301–334.
Burns JJ, Fay FH. 1970. Comparative morphology of the skull of the Ribbon seal, Histriophoca fasciata,with remarks on systematics of Phocidae. Journal of Zoology, London 161: 363–394.

SUPRASPECIFIC TAXA 131
Cao Y, Adachi J, Hasegawa M. 1994. Eutherian phylogeny as inferred from mitochondrial DNAsequence data. Japanese Journal of Genetics 69: 455–472.
Cao Y, Adachi J, Yano TA, Hasegawa M. 1994. Phylogenetic place of guinea pigs: no support ofthe rodent-polyphyly hypothesis from maximum-likelihood analyses of multiple protein sequences.Molecular Biology and Evolution 11: 593–604.
Chapskii KK. 1955. An attempt at revision of the systematics and diagnostics of seals of the subfamilyPhocinae. Trudy Zoologicheskovo Instituta Akademii Nauk SSSR 17: 160–199. [In Russian. Englishtranslation by Jeletzky TF. 1957. Fisheries Research Board of Canada Translation Series 114]
Chase MW, Soltis DE, Olmstead RG, Morgan D, Les DH, Mishler BD, Duvall MR, PriceRA, Hills HG, Qiu YL, Kron KA, Rettig JH, Conti E, Palmer JD, Manhart JR, SytsmaKJ, Michaels HJ, Kress WJ, Karol KG, Clark WD, Hedren M, Gaut BS, Jansen RK,Kim KJ, Wimpee CF, Smith JF, Furnier GR, Strauss SH, Xiang QY, Plunkett GM, SoltisPS, Swensen SM, Williams SE, Gadek PA, Quinn CJ, Eguiarte LE, Golenberg E, LearnGH, Graham SW, Barrett SCH, Dayanandan S, Albert VA. 1993. Phylogenetics of seedplants: an analysis of nucleotide sequences from the plastid gene rbcL. Annals of the Missouri BotanicalGarden 80: 528–580.
Cummings MP, Otto SP, Wakeley J. 1995. Sampling properties of DNA sequence data inphylogenetic analysis. Molecular Biology and Evolution 12: 814–822.
D’Erchia AM, Gissi C, Pesole G, Saccone C, Arnason U. 1996. The guinea-pig is not a rodent.Nature 381: 597–600.
Donoghue MJ, Doyle JA, Gauthier J, Kluge AG, Rowe T. 1989. The importance of fossils inphylogeny reconstruction. Annual Review of Ecology and Systematics 20: 431–460.
Doyle JA, Donoghue MJ, Zimmer EA. 1994. Integration of morphological and ribosomal RNAdata on the origin of angiosperms. Annals of the Missouri Botanical Garden 81: 419–450.
Eldredge N, Novacek MJ. 1985. Systematics and paleobiology. Paleobiology 11: 65–74.Farris JS. 1989. The retention index and the rescaled consistency index. Cladistics 5: 417–419.Felsenstein J. 1985. Confidence limits on phylogenies: an approach using the bootstrap. Evolution
39: 783–791.Freye MS, Hedges SB. 1995. Monophyly of the order Rodentia inferred from mitochondrial DNA
sequences of the genes for 12S rRNA, 16S rRNA, and tRNA-valine. Molecular Biology and Evolution12: 168–176.
Gaffney ES. 1977. An introduction to the logic of phylogeny reconstruction. In: Cracraft J, EldredgeE, eds. Phylogenetic Analysis and Paleontology. New York: Columbia University Press, 79–111.
Galtier N, Gouy M. 1994. Molecular phylogeny of Eubacteria: a new multiple tree analysis methodapplied to 15 sequence data sets questions the monophyly of Gram-positive bacteria. Research inMicrobiology 145: 531–541.
Graur D, Hide WA, Li W-H. 1991. Is the guinea-pig a rodent? Nature 351: 649–652.Hauser DL, Boyajian G. 1997. Proportional change and patterns of homoplasy: Sanderson and
Donoghue revisited. Cladistics 13: 97–100.Hendy MD, Penny D. 1989. A framework for the quantitative study of evolutionary trees. Systematic
Zoology 38: 297–309.Hennig W. 1966. Phylogenetic systematics. Urbana, Illinois: University of Illinois Press.Hillis DM, Bull JJ. 1993. An empirical test of bootstrapping as a method for assessing confidence
in phylogenetic analysis. Systematic Biology 42: 182–192.Hillis DM, Huelsenbeck JP, Cunningham CW. 1994. Application and accuracy of molecular
phylogenies. Science 264: 671–677.Kenyon KW. 1977. Caribbean monk seal extinct. Journal of Mammalogy 58: 97–98.King JE. 1966. Relationships of the Hooded and Elephant seals (genera Cystophora and Mirounga).
Journal of Zoology, London 148: 385–398.Krettek A, Gullberg A, Arnason U. 1995. Sequence analysis of the complete mitochondrial DNA
molecule of the hedgehog, Erinaceus europaeus, and the phylogenetic position of the Lipotyphla.Journal of Molecular Evolution 41: 952–957.
Kuma KI, Miyata T. 1994. Mammalian phylogeny inferred from multiple protein data. JapaneseJournal of Genetics 69: 555–566.
Lanyon SM. 1994. Polyphyly of the blackbird genus Agelaius and the importance of assumptions ofmonophyly in comparative studies. Evolution 48: 679–693.
Lecointre G, Philippe H, Van Le HL, Le Guyader H. 1993. Species sampling has a major impacton phylogenetic inference. Molecular Phylogenetics and Evolution 2: 205–224.

O. R. P. BININDA-EMONDS ET AL.132
Ledje C, Arnason U. 1996. Phylogenetic analyses of complete cytochrome b genes of the orderCarnivora with particular emphasis on the Caniformia. Journal of Molecular Evolution 42: 135–144.
Lindahl T. 1993a. Instability and decay of the primary structure of DNA. Nature 362: 709–715.Lindahl T. 1993b. Recovery of antediluvian DNA. Nature 365: 700.Logan GA, Boon JJ, Eglinton G. 1993. Structural biopolymer preservation in Miocene leaf fossils
from the Clarkia site, northern Idaho. Proceedings of the National Academy of Sciences of the United Statesof America 90: 2246–2250.
Ma D-P, Zharkikh A, Graur D, VandeBerg JL, Li W-H. 1993. Structure and evolution ofopossum, guinea pig, and porcupine cytochrome b genes. Journal of Molecular Evolution 36: 327–334.
Mabee PM. 1996. Reassessing the ontogenetic criterion: a response to Patterson. Cladistics 12:169–176.
Maddison WP. 1995. Calculating the probability distributions of ancestral states reconstructed byparsimony on phylogenetic trees. Systematic Biology 44: 474–481.
Maddison WP, Maddison DR. 1992. MacClade: analysis of phylogeny and character evolution. Version 3.0.Sunderland, Massachusetts: Sinauer Associates.
Martignetti JA, Brosius J. 1993. Neural BC1 RNA as an evolutionary marker: guinea pig remainsa rodent. Proceedings of the National Academy of Sciences of the United States of America 90: 9698–9702.
Mishler BD. 1994. Cladistic analysis of molecular and morphological data. American Journal of PhysicalAnthropology 94: 143–156.
Mouchaty S, Cook JA, Shields GF. 1995. Phylogenetic analysis of northern hair seals based onnucleotide sequences of the mitochondrial cytochrome b gene. Journal of Mammalogy 76: 1178–1185.
de Muizon Ch. 1982. Phocid phylogeny and dispersal. Annals of the South African Museum 89: 175–213.Patterson C. 1996. Comments on Mabee’s ‘Empirical rejection of the ontogenetic polarity criterion’.
Cladistics 12: 147–168.Penny D, Hendy MD. 1985. The use of tree comparison metrics. Systematic Zoology 34: 75–82.Perry EA, Carr SM, Bartlett SE, Davidson WS. 1995. A phylogenetic perspective on the evolution
of reproductive behavior in pagophilic seals of the Northwest Atlantic as indicated by mitochondrialDNA sequences. Journal of Mammalogy 76: 22–31.
Rice KA, Donoghue MJ, Olmstead RG. 1997. Analyzing large data sets: rbcL 500 revisited.Systematic Biology 46: 554–563.
Sanderson MJ, Donoghue MJ. 1989. Patterns of variation in levels of homoplasy. Evolution 43:1781–1795.
Schreiber A, Erker D, Bauer K. 1994. Eutherian phylogeny from a primate perspective. BiologicalJournal of the Linnean Society 51: 359–376.
Simonsen V. 1982. Electrophoretic variation in large mammals. II. The red fox, Vulpes vulpes, thestoat, Mustela erminea, the weasel, Mustela nivalis, the pole cat, Mustela putorius, the pine marten, Martesmartes, the beech marten, Martes foina, and the badger, Meles meles. Hereditas 96: 299–305.
Soltis PS, Soltis DE. 1996. Phylogenetic analysis of large molecular data sets. Boletın de la SociedadBotanica de Mexico 59: 99–113.
Swofford DL. 1993. PAUP: Phylogenetic Analysis Using Parsimony, Version 3.1.1. Computer programdistributed by the Illinois Natural History Survey, Champaign, Illinois.
Vrana PB, Milinkovitch MC, Powell JR, Wheeler WC. 1994. Higher level relationships of thearctoid Carnivora based on sequence data and ‘total evidence’. Molecular Phylogenetics and Evolution3: 47–58.
Watrous LE, Wheeler QD. 1981. The out-group comparison method of character analysis. SystematicZoology 30: 1–11.
Wayne RK, Benveniste RE, Janczewski DN, O’Brien SJ. 1989. Molecular and biochemicalevolution of the Carnivora. In: Gittleman JL, ed. Carnivore behavior, ecology, and evolution. Ithaca, NewYork: Cornell University Press, 465–494.
Wiens JJ. 1995. Polymorphic characters in phylogenetic systematics. Systematic Biology 44: 482–500.Wyss AR. 1988. On ‘retrogression’ in the evolution of the Phocinae and phylogenetic affinities of
the monk seals. American Museum Novitates #2924: 1–38.Wyss AR, Flynn JJ. 1993. A phylogenetic analysis and definition of the Carnivora. In: Szalay FS,
Novacek MJ, McKenna MC, eds. Mammal Phylogeny: Placentals. New York: Springer-Verlag, 32–52.Yeates DK. 1995. Groundplans and exemplars: paths to the tree of life. Cladistics 11: 343–357.

SUPRASPECIFIC TAXA 133
APPENDIX
The following is a complete description of the algorithm (taken from Bininda-Emonds & Russell,1996: 19–20) used to determine the democratic character states in the phocid examples. It was usedby Bininda-Emonds & Russell (1996) to account for the high level of variation among phocidspecimens when generating species’ states. Since higher taxa are even less likely to be morphologicallyhomogeneous, we similarly applied it when reconstructing the supraspecific phocid taxa.
For a given supraspecific taxon, the democratic state for each character was ordinarily the mostfrequent state among all the constituent species. Polymorphic data, such as when a species possessedboth states 0 and 1, were treated as a discrete state (the state ‘01’), rather than independent occurrencesof the singular states. If the next most frequent state(s) possessed the same frequency or the samefrequency minus one observation, then the democratic state was a combination of these ‘equally’ mostfrequent states and the taxon was polymorphic for that character.
An exception to the above formula occurred when at least one of the ‘equally’ most frequent stateswas polymorphic. In such cases, the species’ polymorphisms were ‘broken,’ the frequencies for eachsingular state were counted, and the above algorithm was reapplied. This was necessary because thedemocratic state of the ‘equally’ most frequent states 0 and 01, for instance, is meaningless (i.e. thestate ‘001’), and probably reflects a greater preponderance of state 0 in that particular taxon.Polymorphic democratic states could still result if two or more singular states happened to be ‘equally’frequent.