supramolecular selection in molecular and … · supramolecular selection in molecular and...
TRANSCRIPT

SUPRAMOLECULAR SELECTION IN
MOLECULAR AND FRAMEWORK
CO-CRYSTALS
Jocelyne Bouzaid
Bachelor of Applied Science Honours I (Chemistry)
Bachelor of Business (Management/Marketing)
Submitted in partial fulfilment of the requirements for the degree of
Doctor of Philosophy
School of Chemistry, Physics and Mechanical Engineering
Faculty of Science and Engineering
Queensland University of Technology
2014
Supramolecular Selection in Molecular and Framework Co-crystals
i
Keywords
Co-crystal, co-crystallisation, composite crystal, coordination framework,
coordination network, coordination polymer, crystal engineering, crystalline solid
solution, epitaxial growth crystals, framework alloy, heteromolecular crystal, hybrid
materials, metal dilution, metallic doping, metal-organic framework, metal-organic
network, mixed crystal, mixed-metal compounds, molecular alloy, molecular
complex, molecular composite, molecular recognition, multicomponent crystal,
supramolecular alloy, supramolecular chemistry, supramolecular motif,
supramolecular selection.

Supramolecular Selection in Molecular and Framework Co-crystals
ii
Abstract
One of the ongoing challenges in supramolecular chemistry and crystal engineering
is the development of methods for synthesising multifunctional crystalline materials
that have predictable structural architectures and tunable solid-state properties. One
strategy is through the exploitation of known supramolecular motifs and
architectures to engineer molecular and framework co-crystals, which are essentially
solid solutions of molecules in the crystalline state. In this project, single co-crystals
were formed by the co-crystallisation of metal complexes that have similar
molecular and crystal structures but different physical or chemical properties.
By co-crystallising [MII(terpyR)2]
2+ (M
II = Fe, Co, Ni, Cu;
terpy = 2,2′:6′,2′′-terpyridine; R = H, OH) with [Ru(terpy)2]2+
it was possible to
exploit the 2D terpy embrace motif to synthesise four [MII
xRu1-x(terpy)2](PF6)2
(MII = Fe, Co, Ni, Cu) and five [M
II(terpyOH)2]x[Ru(terpy)2]1-x(BF4)2 (M
II = Fe, Ni,
Cu) novel co-crystals. Co-crystals were characterised using XRD and SEM-EDX, the
latter to quantify the amount of each metal complex present in single co-crystals.
SEM-EDX results indicated that co-crystals grown from the same solution were
found to have a range of concentrations such that xsolid single crystal 1 ≠ xsolid single crystal 2.
The variation in the relative metal complex concentration among single co-crystals
grown from the same solution is indicative of molecular recognition for like
complexes resulting in supramolecular selection. It appears that for systems that
display supramolecular selection, intermolecular interactions between like complex
pairs are more energetically favoured than interactions between different complexes
but not enough to result in exclusive crystallisation.
In addition, several novel framework co-crystals and crystals exhibiting epitaxial
growth were prepared using [MIII
(ox)3]3-
metal complexes as molecular building-
blocks (MIII
= Cr, Fe; ox = oxalate). Co-crystals, with the formula
K3[CrxFe1-x(ox)3]·2.5H2O were analysed using single crystal surface and confocal
Raman spectroscopic mapping, SEM-EDX and PXRD and were found to exhibit
directional intracrystal concentration gradients. The presence of a concentration
gradient is remarkable and presents the potential for a single crystal to display an

Supramolecular Selection in Molecular and Framework Co-crystals
iii
infinitely varying degree of magnetism as well as other concentration dependent
properties.
A total of five crystals exhibiting epitaxial crystal growth were also prepared from
K3[MIII
(ox)3]·2.5H2O (MIII
= Cr and/or Fe) seed crystals that were immersed into
saturated solutions of K3[MIII
(ox)3] (MIII
= Cr, Fe or a 1:1 mixture). Different
epitaxial growth patterns were observed depending on the method used to immerse
the seed crystals into the solution. Experiments also indicated that supramolecular
interactions between like and different complexes are similar enough to allow
simultaneous growth to occur on both types of crystals but that interactions between
like complexes are slightly more favourable.
Lastly, four different [MII(L)3][NaM
III(ox)3] co-crystals were prepared by
co-crystallising [MII(L)3]Cl2 (M
II = Ni, Ru; L = 2,2′-bipyridine (bipy),
1,10-phenanthroline (phen)) with K3[MIII
(ox)3] (MIII
= Cr, Fe) in the presence of
NaCl. Co-crystals were characterised using SEM-EDX, SCXRD and PXRD.
[Ni0.50Ru0.50(bipy)3][NaCr(ox)3] co-crystals were found to have the same ratio of the
metal complexes that was present in solution indicating that [MII(bipy)3]
2+ complexes
engage in negligible supramolecular selection during co-crystallisation. Results
obtained from [Ru(bipy)3][NaCr0.60Fe0.40(ox)3] co-crystals suggest that K3[Cr(ox)3]
was slightly favoured over K3[Fe(ox)3]. [Ni(bipy)3]0.80[Ru(phen)3]0.20[NaCr(ox)3] and
[Ni(phen)3]0.20[Ru(bipy)3]0.80[NaCr(ox)3] co-crystals were found to have a
[MII(bipy)3]
2+: [M
II(phen)3]
2+ ratio of 4:1.
Co-crystals of all four of these coordination frameworks were found to be
isomorphous. Most interestingly, it was discovered that the [MII(phen)3]
2+ molecules
in both [MA(bipy)3]0.80[M
B(phen)3]0.20[NaCr(ox)3] structures exhibited the opposite
chirality to the [MII(bipy)3]
2+ complexes and to the metals in the {[NaCr(ox)3]
2-}n
helical anionic framework such that single co-crystals had the general formula
Λ-[MA(bipy)3]0.80Δ-[M
B(phen)3]0.20Λ-[NaCr(ox)3]. The heterochiral structure of
these co-crystals is especially novel as [MII(L)3][NaM
III(ox)3] single crystals have
historically been known to only form homochiral structures.

Supramolecular Selection in Molecular and Framework Co-crystals
iv
Table of Contents
Keywords ........................................................................................................................................... i
Abstract ............................................................................................................................................. ii
Table of Contents ............................................................................................................................. iv
List of Figures ................................................................................................................................ viii
List of Tables ...................................................................................................................................xiv
List of Abbreviations .......................................................................................................................xvi
Statement of Original Authorship ................................................................................................ xviii
Acknowledgements .........................................................................................................................xix
Quotation .........................................................................................................................................xxi
CHAPTER 1: Introduction ................................................................................... 1
1.1 Supramolecular chemistry .................................................................................... 1
1.2 Crystal engineering ............................................................................................. 2
1.3 Intermolecular interactions ................................................................................... 5
1.4 Supramolecular motifs ....................................................................................... 12
1.5 Lattice dimensionality ....................................................................................... 14
1.6 Multicomponent crystals .................................................................................... 15
1.6.1 Nomenclature ........................................................................................... 15
1.6.2 Co-crystal systems in the literature ............................................................... 17
1.6.3 The discovery of supramolecular selection ..................................................... 25
CHAPTER 2: Project objectives ........................................................................ 35
2.1 Overall research objectives ................................................................................. 35
2.2 Molecular co-crystalline materials ....................................................................... 36
2.3 Metal-organic framework co-crystalline materials ................................................... 38
CHAPTER 3: Preparative experimental details and methodology ................ 40
3.1 Materials ......................................................................................................... 40
3.2 Characterisation techniques ................................................................................ 40
3.2.1 Scanning electron microscopy-energy dispersive X-ray analysis (SEM-EDX) ....... 40
3.2.2 Powder X-ray diffraction (PXRD) ................................................................ 41

Supramolecular Selection in Molecular and Framework Co-crystals
v
3.2.3 Single crystal X-ray diffraction (SCXRD) ...................................................... 42
3.2.4 Nuclear magnetic resonance spectroscopy (NMR) ........................................... 43
3.2.5 High resolution electrospray ionisation mass spectrometry (ESI-MS) .................. 43
3.2.6 Raman spectroscopy .................................................................................. 43
3.2.7 Elemental analysis ..................................................................................... 44
3.3 Synthetic experimental details ............................................................................. 45
3.3.1 Synthesis of 4′-phenyl-2,2′:6′,2′′-terpyridine (terpyPh) ..................................... 45
3.3.2 Synthesis of [MII(L)2]X2 transition metal complexes ......................................... 47
3.3.3 Synthesis of [MII(L)3]X2 transition metal complexes ........................................ 56
3.3.4 Synthesis of K3[MIII
(ox)3]·xH2O complexes .................................................... 59
3.3.5 Binary co-crystallisation experiments ............................................................ 63
3.3.6 K3[Cr(ox)3]·2.5H2O and K3[Fe(ox)3]·2.5H2O epitaxial experiments ..................... 67
3.3.7 Synthesis of [MII(L)3][NaM
III(ox)3] co-ordination metal-organic frameworks ........ 68
CHAPTER 4: Co-crystallisation systems incorporating [MII
(terpyR)2]2+
..... 70
4.1 Background: The [MII(terpyR)2]X2 metal complexes and the terpy motif ..................... 70
4.2 Background: Previous research into the co-crystallisation of [MA(L)n]X2 with [M
B(L)n]X2
to form [MA
xMB
1-x(L)n]X2 co-crystals. ............................................................................. 76
4.3 Results and discussion ....................................................................................... 80
4.3.1 [MII
xRu1-x(terpy)2](PF6)2 co-crystallisation systems .......................................... 81
4.3.2 [MII(terpyOH)2]x[Ru(terpy)2]1-x(BF4)2 co-crystallisation systems ........................ 99
4.3.3 Co-crystallisation experiments involving [MII(terpyPh)2](PF6)2, [Ni(phen)3](PF6)2,
[Ni(bipy)3](PF6)2 ................................................................................................... 118
4.4 Chapter summary and conclusions ..................................................................... 120
CHAPTER 5: Co-crystallisation systems incorporating [MIII
(ox)3]3-
to form
framework materials .............................................................................................. 122
5.1 Background and introduction ............................................................................ 122
5.1.1 The oxalato ligand (ox) and coordination frameworks containing [MIII
(ox)3]3-
complexes as building-blocks .................................................................................. 122
Supramolecular Selection in Molecular and Framework Co-crystals
vi
5.2 Results and discussion ..................................................................................... 127
5.2.1 Co-ordination frameworks of the type K3[MA
xMB
1-x(ox)3] ............................... 129
5.2.2 Co-ordination frameworks of the type [MII(L)3][M
IM
III(ox)3] ........................... 158
5.2.3 [NixRu1-x(bipy)3][NaCr(ox)3] (system 1) ....................................................... 170
5.2.4 [Ru(bipy)3][NaCrxFe1-x(ox)3] (system 2) ....................................................... 179
5.2.5 Homoleptic cationic and anionic metal dilutions involving [MII(phen)3]
2+ and
[MIII
(ox)3]3-
(systems 3 and 4) .................................................................................. 183
5.2.6 [Ni(bipy)3]x[Ru(phen)3]1-x[NaCr(ox)3] (system 5) and
[Ni(phen)3]x[Ru(bipy)3]1-x[NaCr(ox)3] (system 6) ......................................................... 190
5.3 Chapter summary and conclusions ..................................................................... 201
CHAPTER 6: Project summary and conclusions ........................................... 202
6.1 Overall project summary and conclusions ............................................................ 202
6.2 Novel molecular co-crystals formed through the use of the 2D terpy motif ................. 203
6.3 Co-crystallisations using the K3[MIII
(ox)3] metal complex building-block to form novel
co-crystalline metal-organic frameworks. ....................................................................... 206
CHAPTER 7: Directions for future research .................................................. 214
REFERENCES
In text references ..................................................................................................... 216
CSD reference code references .................................................................................. 234
APPENDICES
APPENDIX A: The use of SEM-EDX for quantitative analysis ......................................... 241
APPENDIX B: EDX analysis of the residues obtained by the evaporation of the mother liquors for
co-crystallisation experiments involving [MII(L)3]
2+ and [M
III(ox)3]
3- ................................... 246
APPENDIX C: PXRD of K3[CrxFe1-x(ox)3]·2.5H2O co-crystals ......................................... 251
APPENDIX D: Literature SCXRD refinement data for [Fe(terpyOH)2](BF4)2·H2O,
[Cu(terpyOH)2](BF4)2·H2O (CAPXUN, CAPYIC) and experimental data for
[Ni(terpyOH)2](BF4)2·H2O and [Ru(terpy)2](BF4)2·H2O .................................................... 252
APPENDIX E: SCXRD refinement data for [MII(terpyOH)2]x[Ru(terpy)2]1-x(BF4)2·H2O (M
II = Fe,
Ni, Cu) co-crystals ..................................................................................................... 253

Supramolecular Selection in Molecular and Framework Co-crystals
vii
APPENDIX F: Additional SCXRD refinement data for co-crystals of
[Ni0.50Ru0.50(bipy)3][NaCr(ox)3], [Ni(bipy)3]0.80[Ru(phen)3]0.20[NaCr(ox)3] and
[Ni(phen)3]0.20[Ru(bipy)3]0.80[NaCr(ox)3] ....................................................................... 254
Supramolecular Selection in Molecular and Framework Co-crystals
viii
List of Figures
Figure 1: Sodium chloride cubic lattice system. .................................................................................... 6
Figure 2: Octahedral labile [Na(H2O)6]+ complex ................................................................................. 6
Figure 3: [M(bipy)3]z+
complex (bipy = 2,2′-bipyridine) showing coordinate bonds between the metal
cation and the nitrogen atom of the ligands. ........................................................................................... 7
Figure 4: Geometric arrangement for FF (a) and OFF (b) interactions of the benzene dimer. ............ 10
Figure 5: Geometric arrangement for EF (a) and VF (b) interactions of the benzene dimer ............... 11
Figure 6: Primary multiple aryl embrace motifs for Ph4P+ cations ...................................................... 12
Figure 7: Multiple aryl embraces between pairs of [M(terpy)2]z+
complexes (a) [M(phen)3]z+
complexes (b) and [M(bipy)3]z+
complexes (c) ..................................................................................... 13
Figure 8: Schematic representations of (a) 1D linear chain, (b) grid (bottom) and honeycomb (top) 2D
lattices and (c) matrix (bottom), diamondoid (middle) and extended (top) 3D networks. .................... 15
Figure 9: 2,6-bis(pyrazol-3-yl)pyridine (bpp) ...................................................................................... 20
Figure 10: (left to right) 2,6-bis(pyrazol-1-yl)pyridine (1-bpp) and 2,2′;6′,2′′-terpyridine (terpy) ...... 20
Figure 11: Photographs of (imidazolium)2[MA
xMB
1-x(dipic)2]·2H2O co-crystals with the metals and
their respective ratios given under each image ..................................................................................... 22
Figure 12: Photographs of slices of G-1 (a, b), G-2 (c, d) and G-3 (e, f) epitaxial growth crystals
clearly showing the different Ru containing domains (colourless) and Fe-containing domains
(yellow/orange) ..................................................................................................................................... 24
Figure 13: Microscope images of single crystals of [Ni(phen)3](PF6)20.5H2O,
[Ru(phen)3](PF6)20.5H2O and single co-crystals of [NixRu1-x(phen)3](PF6)20.5H2O obtained by
co-crystallisation of an equimolar mixture of the two pure complexes................................................. 27
Figure 14: Representative ESI mass spectrum obtained for a single co-crystal produced from a
solution containing an equimolar mixture of [Ni(phen)3](PF6)2 and [Ru(phen)3](PF6)2 ....................... 28
Figure 15: Powder XRD patterns of pure [Fe(L)3](PF6)2 (red), [Ru(L)3](PF6)2 (blue), and
[Ni(L)3](PF6)2 (green) interspersed with the PXRD patterns for respective co-crystals obtained from
solutions containing 80:20, 50:50, and 20:80 molar ratios of the metal complexes for systems of
[MA
xMB
1-x(phen)3](PF6)20.5H2O (left) and [MA
xMB
1-x(bipy)3](PF6)2 (right). ....................................... 29
Figure 16: Scatter plot and regression line for SEM-EDX analyses of [NixRu1-x(phen)3](PF6)20.5H2O
co-crystals. ............................................................................................................................................ 30
Figure 17: Scatter plot and regression line for SEM-EDX analyses of [NixRu1-x(bipy)3](PF6)2
co-crystals. ............................................................................................................................................ 32
Figure 18: 4′-Phenyl-2,2′:6′,2′′-terpyridine (terpyPh) .......................................................................... 46
Figure 19: Schematic describing co-crystallisation experiments of complexes A and B via vapour
diffusion of ethanol into water. ............................................................................................................. 65
Figure 20: The structure of 2,2′:6′,2′′-terpyridine (terpy) showing the atom numbering of each pyridyl
ring. ....................................................................................................................................................... 70
Figure 21: The orthogonal arrangement of the terpy ligands of typical [MII(terpy)2]
2+ cations as
viewed perpendicular to the S4 axis (left) and along the S4 axis (right) ................................................ 71
Supramolecular Selection in Molecular and Framework Co-crystals
ix
Figure 22: The terpy embrace motif between a pair of [MII(terpy)2]
2+ complexes.............................. 72
Figure 23: Ball and stick representation showing the interactions between four [MII(terpy)2]
2+
complexes leading to the structure called the two-dimensional (2D) terpy embrace ........................... 72
Figure 24: Space-filled representation of an expanded 2D terpy embrace layer containing nine
[MII(terpy)2]
2+ complexes as viewed from the top (left), side (centre) and bottom (right) ................... 73
Figure 25: Plot of EDX results from previous experiments conducted by members of the McMurtrie
group of [NixCu1-x(terpy)2](PF6)2 where xsolution = 0.10 to 0.90 in 0.10 increments. ............................. 78
Figure 26: SEM secondary electron image of co-crystals with the general formula
[CoxRu1-x(terpy)2](PF6)2. ...................................................................................................................... 83
Figure 27: EDX spectrum from the area outlined in red on the [CoxRu1-x(terpy)2](PF6)2 co-crystal
shown in Figure 26. This co-crystal was found to contain 52% [Co(terpy)2](PF6)2 and 48%
[Ru(terpy)2](PF6)2................................................................................................................................. 83
Figure 28: Colour-coded plot of EDX results of co-crystals of the general formula
[MII
xRu1-x(terpy)2](PF6)2.. ..................................................................................................................... 85
Figure 29: A three-dimensional illustration of a [M(terpyR)2]z+
complex showing the orthogonal
relationship between the two ligands and the interpreted width and height of the complex. ............... 87
Figure 30: Width and Height of various [M(terpyR)2]2+
complexes reported in the CSD. ................. 88
Figure 31: Powder XRD patterns of freshly prepared pure [MII(terpy)2](PF6)2 crystals .................... 91
Figure 32: Powder XRD patterns of freshly prepared [FexRu1-x(terpy)2](PF6)2 co-crystals (shown in
purple) with the diffraction patterns of [Fe(terpy)2](PF6)2 (top) and [Ru(terpy)2](PF6)2 (bottom).. .... 94
Figure 33: Powder XRD patterns of freshly prepared [CoxRu1-x(terpy)2](PF6)2 co-crystals (shown in
blue) with the diffraction patterns of [Co(terpy)2](PF6)2 (top) and [Ru(terpy)2](PF6)2 (bottom). ........ 95
Figure 34: Powder XRD patterns of freshly prepared [NixRu1-x(terpy)2](PF6)2 co-crystals (shown in
green) with the diffraction patterns of [Ni(terpy)2](PF6)2 (top) and [Ru(terpy)2](PF6)2 (bottom). ...... 96
Figure 35: Powder XRD patterns of freshly prepared [CoxRu1-x(terpy)2](PF6)2 co-crystals (shown in
blue) and [NixRu1-x(terpy)2](PF6)2 co-crystals (shown in green). .......................................................... 97
Figure 36: Powder XRD patterns of freshly prepared [CuxRu1-x(terpy)2](PF6)2 co-crystals (shown in
red) with the diffraction patterns of [Cu(terpy)2](PF6)2 (top) and [Ru(terpy)2](PF6)2 (bottom) .......... 98
Figure 37: Secondary electron SEM images of co-crystals with the formula
[Fe(terpyOH)2]x[Ru(terpy)2]1-x(BF4)2 (left) and [Ni(terpyOH)2]x[Ru(terpy)2]1-x(BF4)2 (right).. ......... 101
Figure 38: Secondary electron (left) and backscattered (right) SEM images of a co-crystal with the
formula [Cu(terpyOH)2]x[Ru(terpy)2]1-x(BF4)2. .................................................................................. 101
Figure 39: SEM image of crystals grown from a solution containing a 1:1 ratio of
[CoIII
(terpyO)(terpyOH)](BF4)2 and [Ru(terpy)2](BF4)2 .................................................................... 102
Figure 40: Colour-coded plot of EDX results of co-crystals of the general formula
[MII(terpyOH)2]x[Ru(terpy)2]1-x(BF4)2 ................................................................................................ 104
Figure 41: Powder XRD patterns of freshly prepared pure [Ru(terpy)2](BF4)2 and
[MII(terpyOH)2](BF4)2 ........................................................................................................................ 108

Supramolecular Selection in Molecular and Framework Co-crystals
x
Figure 42: Powder XRD patterns of freshly prepared [Fe(terpyOH)2]x[Ru(terpy)2]1-x(BF4)2 co-crystals
(purple) shown with the diffraction patterns of [Fe(terpyOH)2](BF4)2 (black) and [Ru(terpy)2](BF4)2
(black). A pattern simulated from the SCXRD structure of [Fe(terpyOH)2]0.60[Ru(terpy)2]0.40(BF4)2
(grey) is shown at the very top of the figure and was used to assign Miller indices to the like patterns
shown.. ................................................................................................................................................ 110
Figure 43: Powder XRD patterns of freshly prepared [Ni(terpyOH)2]x[Ru(terpy)2]1-x(BF4)2 co-crystals
(green) shown with the diffraction patterns of [Ni(terpyOH)2](BF4)2 (black) and [Ru(terpy)2](BF4)2
(black). A pattern simulated from the SCXRD structure of [Ni(terpyOH)2]0.60[Ru(terpy)2]0.40(BF4)2
(grey) is shown at the very top of the figure and was used to assign Miller indices to the like patterns
shown. ................................................................................................................................................. 111
Figure 44: Powder XRD patterns of freshly prepared [Cu(terpyOH)2]x[Ru(terpy)2]1-x(BF4)2 co-crystals
(red) shown with the diffraction patterns of [Cu(terpyOH)2](BF4)2 (black) and [Ru(terpy)2](BF4)2
(black). A pattern simulated from the SCXRD structure of [Cu(terpyOH)2]0.50[Ru(terpy)2]0.50(BF4)2
(grey) is shown at the very top of the figure and was used to assign Miller indices to the like patterns
shown. ................................................................................................................................................. 112
Figure 45: Colour-coded plot of EDX results of co-crystals of the general formula
[MII(terpyOH)2]x[Ru(terpy)2]1-x(BF4)2 that were grown from solutions containing 5%
[MII(terpyOH)2](BF4)2. ........................................................................................................................ 115
Figure 46: Powder XRD patterns of freshly prepared [Fe(terpyOH)2]x[Ru(terpy)2]1-x(BF4)2 (purple)
[Cu(terpyOH)2]x[Ru(terpy)2]1-x(BF4)2 co-crystals (red) that were grown from solutions containing 5%
[MII(terpyOH)2](BF4)2. The [Ru(terpy)2](BF4)2 diffraction pattern is also shown (black). ................. 117
Figure 47: Powder XRD pattern of freshly prepared [Ni(terpyOH)2]x[Ru(terpy)2]1-x(BF4)2 (green)
co-crystals that were grown from a solution containing 5% [Ni(terpyOH)2](BF4)2. Diffraction patterns
of [Ni(terpyOH)2](BF4)2 and [Ru(terpy)2](BF4)2 are also shown (black).. .......................................... 117
Figure 48: The structure of oxalate (a), 2,2′-bipyridine (b) and 1,10-phanathroline (c). .................. 122
Figure 49: Schematic views showing the propeller-like geometry of Δ-[M(ox)3]z- and Λ-[M(ox)3]
z-
enantiomers. ........................................................................................................................................ 123
Figure 50: A schematic representation of the heterochiral arrangement of neighbouring metal centres
of [M(ox)3]z- complexes leading to the formation of a 2D (6,3) hexagonal anionic framework. ........ 124
Figure 51: A schematic representation of the homochiral arrangement of neighbouring metal centres
of [M(ox)3]z- complexes with Δ chirality leading to the formation of a 3D (10,3) helical anionic
framework. .......................................................................................................................................... 125
Figure 52: [100] projection of the anionic Δ-{[LiCr(ox)3]2-
}n host framework (left) and the cationic
Δ-[Ru(bipy)3]2+
guests (right) for the Δ-[Ru(bipy)3][LiCr(ox)3] structure reported by Andrés et al. . 126
Figure 53: PXRD patterns of pure and recrystallised K3[MIII
(ox)3]·xH2O ......................................... 130
Figure 54: SEM secondary electron image showing crystal aggregation and the various crystal habits
resulting from the equimolar co-crystallisation between K3[Fe(ox)3] and K3[Rh(ox)3].. .................... 133
Supramolecular Selection in Molecular and Framework Co-crystals
xi
Figure 55: Microscope images showing the crystal habits and colours of pure K3[Cr(ox)3]·2.5H2O
(a), K3[Fe(ox)3]·2.5H2O single crystals (b) and single co-crystals of the formula
K3[CrxFe1-x(ox)3]·2.5H2O (c), which were grown from a solution containing a 1:1 ratio of K3[Cr(ox)3]
and K3[Fe(ox)3] .................................................................................................................................. 134
Figure 56: SEM image of a co-crystal grown from a solution containing an equimolar ratio of
K3[Cr(ox)3] and K3[Fe(ox)3] .............................................................................................................. 136
Figure 57: Raman spectra highlighting the separation of the carbonyl stretching bands of
K3[Fe(ox)3]·2.5H2O and K3[Cr(ox)3]·2.5H2O at 1722.97 and 1727.47 cm-1
respectively .................. 139
Figure 58: Microscope image of a single co-crystal exhibiting a concentration gradient that was
co-crystallised from a solution containing an equimolar ratio of K3[Cr(ox)3] to K3[Fe(ox)3] ............ 141
Figure 59: Plot of the Raman peak position across the transect on a single co-crystal that was grown
from a solution containing a 1:1 ratio of K3[Cr(ox)3] to K3[Fe(ox)3].. .............................................. 142
Figure 60: Plot of the EDX measurements across the transect on a single co-crystal that was grown
from a solution containing a 1:1 ratio of K3[Cr(ox)3] to K3[Fe(ox)3]. ............................................... 142
Figure 61: Graphical representations of the data derived from a Raman area map conducted on the
surface of a single co-crystal that was grown from a solution containing a 1:1 ratio of K3[Cr(ox)3] to
K3[Fe(ox)3]. ........................................................................................................................................ 144
Figure 62: A plot of the depth versus the change in the confocal Raman peak position measured along
a transect with a tranjectory parallel to the largest facet of a single co-crystal that exhibited a surface
concentration gradient and was grown from a solution containing a 1:1 ratio of K3[Cr(ox)3] to
K3[Fe(ox)3] ......................................................................................................................................... 146
Figure 63: A plot of the depth versus the change in the confocal Raman peak position acquired from
two depth-profile maps each from a different single co-crystal (grown from a 1:1 solution of
K3[Cr(ox)3] to K3[Fe(ox)3]). A perpandicular trajectory (relative to the largest facet) was followed by
both transects ...................................................................................................................................... 147
Figure 64: Optical microscope images of one epitaxial crystal grown by immersing a
K3[Fe(ox)3]·2.5H2O seed into a saturated solution of K3[Cr(ox)3](aq/EtOH).. ........................................ 150
Figure 65: Optical microscope images of one epitaxial crystal grown by immersing a
K3[Cr(ox)3]·2.5H2O seed into a saturated solution of K3[Fe(ox)3](aq/EtOH).. ........................................ 150
Figure 66: The Raman peak positions across a transect from an epitaxial crystal grown by immersing
a K3[Fe(ox)3]·2.5H2O seed into a solution of K3[Cr(ox)3](aq/EtOH). ..................................................... 152
Figure 67: The Raman peak positions across a transect from an epitaxial crystal grown by immersing
a K3[Cr(ox)3]·2.5H2O seed into a solution of K3[Fe(ox)3](aq/EtOH). ..................................................... 152
Figure 68: Images of a K3[Cr(ox)3]·2.5H2O seed suspended by a glass fibre in a solution containing
K3[Fe(ox)3](aq/EtOH) before (a) and after (b) epitaxial growth. The image on the right (c) is of an
epitaxial crystal resulting from a K3[Fe(ox)3]·2.5H2O seed suspended by a glass fibre in a solution
containing K3[Cr(ox)3](aq/EtOH). ........................................................................................................... 154
Figure 69: Seed crystals of K3[Cr(ox)3]·2.5H2O and K3[Fe(ox)3]·2.5H2O suspended by glass fibres
and immersed in a solution of K3[Fe(ox)3](aq/EtOH). ............................................................................ 155

Supramolecular Selection in Molecular and Framework Co-crystals
xii
Figure 70: Optical microscope images of an epitaxial crystal grown by immersing a
K3[Fe(ox)3]·2.5H2O seed into a saturated solution containing an equimolar ratio of K3[Cr(ox)3] and
K3[Fe(ox)3] .......................................................................................................................................... 156
Figure 71: Plot of the Raman peak position across a transect on a crystal grown from a
K3[Fe(ox)3]·2.5H2O seed immersed in a solution containing an equimolar ratio of K3[Cr(ox)3]and
K3[Fe(ox)3].. ........................................................................................................................................ 157
Figure 72: [100] projection of Δ-[Ru(bipy)3][NaCr(ox)3] reported for the 2010 structure by Hauser et
al. ........................................................................................................................................................ 161
Figure 73: (a) Single co-crystals of the general formula [NixRu1-x(bipy)3][NaCr(ox)3] resulting from
the co-crystallisation of a 1:1:2 ratio of [Ni(bipy)3]2+
, [Ru(bipy)3]2+
and [Cr(ox)3]3-
in the presence of
NaCl (system 1), (b) single co-crystal resulting from the co-crystallisation of a 1:1:2 ratio of
[Ni(phen)3]2+
, [Ru(phen)3]2+
and [Cr(ox)3]3-
in the presence of NaCl (system 3) and (c) a single
co-crystal of the general formula [Ni(bipy)3]x[Ru(phen)3]1-x[NaCr(ox)3] resulting from the
co-crystallisation of a 1:1:2 ratio of [Ni(bipy)3]2+
, [Ruphen)3]2+
and [Cr(ox)3]3-
in the presence of
NaCl (system 5). ................................................................................................................................. 164
Figure 74: EDX plot showing the metal ratio of interest (Ni:Ru or Cr:Fe) and experiment system on
the x axis against the xsolid of Ni or Cr on the left and right y axes respectively .................................. 166
Figure 75: PXRD patterns of co-crystals from systems 1, 2, 5, 6 that were collected at room
temperature indexed against a simulated powder pattern collected from a
[Ni0.50Ru0.50(bipy)3][NaCr(ox)3] single co-crystal at 173K. ................................................................ 169
Figure 76: SEM image of intertwined mass of crystalline [NixRu1-x(bipy)3][NaCr(ox)3] co-crystals
(system 1) ............................................................................................................................................ 171
Figure 77: SEM image of a representative [NixRu1-x(bipy)3][NaCr(ox)3] single co-crystal resulting
from the co-crystallisation of a 1:1:2 ratio of [Ni(bipy)3]2+
, [Ru(bipy)3]2+
and [Cr(ox)3]3-
in the
presence of NaCl (system 1).. ............................................................................................................. 172
Figure 78: EDX spectrum from a tetrahedral co-crystal of [Ni0.49Ru0.51(bipy)3][NaCr(ox)3] ............ 173
Figure 79: [100] projection of {Δ-[NaCr(ox)3]2-
}n (left) and Δ-[Ni0.50Ru0.50(bipy)3]2+
(right) for the
Δ-[Ni0.50Ru0.50(bipy)3][NaCr(ox)3] compound. ................................................................................... 177
Figure 80: Diagram illustrating the twist angle (Φ) and s and h parameters used to assess distortion
of octahedral complexes. ..................................................................................................................... 177
Figure 81: SEM image of crystalline [Ru(bipy)3][NaCrxFe1-x(ox)3] (system 2).. ............................... 180
Figure 82: EDX spectrum from a tetrahedral [Ru(bipy)3][NaCr0.59Fe0.41(ox)3] co-crystal ................. 181
Figure 83: SEM image of a single co-crystal formed by the co-crystallisation of a 1:1:2 ratio of
[Ni(phen)3]2+
, [Ru(phen)3]2+
and [Cr(ox)3]3-
in the presence of NaCl (system 3).. ............................ 185
Figure 84: EDX spectra collected from rectangular prism shaped crystals grown from solutions
containing [MII(phen)3]
2+ and [M
III(ox)3]
3- in the presence of NaCl (systems 3 and 4) ...................... 186
Figure 85: SEM images of co-crystals exhibiting penetrative twinning that were grown from a
solution containing an equimolar mixture of [Ru(bipy)3](PF6)2 and [Ni(phen)3](PF6)2 detected using
secondary electrons (a and b) and backscattered electrons (c and d). ................................................. 191

Supramolecular Selection in Molecular and Framework Co-crystals
xiii
Figure 86: EDX spectra measured from crystals grown from co-crystallisation types 5 (a) and 6 (b)
with the formula [Ni(bipy)3]0.80[Ru(phen)3]0.20[NaCr(ox)3] and
[Ni(phen)3]0.20[Ru(bipy)3]0.80[NaCr(ox)3] respectively. ...................................................................... 192
Figure 87: The Λ-[Ru(bipy)3]2+
and Δ-[Ni(phen)3]2+
complexes in
[Ni(phen)3]0.20[Ru(bipy)3]0.80[NaCr(ox)3] as viewed along the [100] plane (left) and a perspective that
shows all of the ligands associated with the Ni/Ru site (right). ......................................................... 197
Figure 88: Three adjacent Λ-[Ru(bipy)3]2+
and Δ-[Ni(phen)3]2+
complexes in
[Ni(phen)3]0.20[Ru(bipy)3]0.80[NaCr(ox)3] as viewed along the [100] axis (left) and a perspective that
shows the overlap of the 1,10-phenanthroline carbon atoms (right). ................................................. 198

Supramolecular Selection in Molecular and Framework Co-crystals
xiv
List of Tables
Table 1: Calculated hydrogen bond dissociation energy for selected hydrogen bonding interactions in
the gas phase. .......................................................................................................................................... 8
Table 2: Energetic and geometric properties of strong, moderate and weak hydrogen bond interactions
according to Jeffery, 1997. ...................................................................................................................... 9
Table 3: Compound index .................................................................................................................... 45
Table 4: Summary of [MII(L)2]
2+ and [Ru(L)2]
2+ binary co-crystallisation experiments. ..................... 64
Table 5: Summary of [Ni(L)3]2+
and [Ru(L′)2]2+
binary co-crystallisation experiments. ...................... 65
Table 6: Summary of [MIII
(ox)3]3-
and [MIII
(ox)3]3-
co-crystallisation experiments. ............................ 67
Table 7: Summary of the composition of the K3[MIII
(ox)3]·2.5H2O seed crystals and the
K3[MIII
(ox)3](aq/EtOH) saturated solutions used to crystallise epitaxial growth crystals........................... 68
Table 8: Summary of co-crystallisation experiments between [MII(L)3]
2+ and [M
III(ox)3]
3- ................ 69
Table 9: Summary of crystal structures (in chronological order of publication) of [MII(terpy)2]
2+, and
[MII(terpyOH)2]
2+ complexes. ............................................................................................................... 75
Table 10: Summary of co-crystallisation experiments between [MII(terpy)2](PF6)2 and
[Ru(terpy)2](PF6)2 ................................................................................................................................. 82
Table 11: Statistical summary of xsolid values obtained from EDX data for experiments resulting in
co-crystals with the general formula [MII
xRu1-x(terpy)2](PF6)2. ............................................................ 84
Table 12: Comparison of factors that are known to influence metal complex size and shape. ............ 89
Table 13: Summary of co-crystallisation experiments between [MII(terpyOH)2](BF4)2 and
[Ru(terpy)2](BF4)2 ............................................................................................................................... 100
Table 14: Statistical summary of xsolid values obtained from EDX data for experiments resulting in
co-crystals with the general formula [MII(terpyOH)2]x[Ru(terpy)2]1-x(BF4)2 that were formed from
solutions containing 50% [MII(terpyOH)2](BF4)2.. ............................................................................. 102
Table 15: Statistical summary of xsolid values obtained from EDX data for experiments resulting in
co-crystals with the general formula [MII(terpyOH)2]x[Ru(terpy)2]1-x(BF4)2 that were formed from
solutions containing 5% [MII(terpyOH)2](BF4)2.. ............................................................................... 115
Table 16: Summary of co-crystallisation experiments between [MII(terpyPh)2](PF6)2 and
[Ru(terpy)2](PF6)2; [Ni(L)3](PF6)2 and [Ru(terpy)2](PF6)2 or [Ru(terpyPh)2](PF6)2............................ 119
Table 17: Summary of co-crystallisation experiments between [MIII
(ox)3]3-
and [MIII
(ox)3]3-
.......... 132
Table 18: Summary of the composition of the K3[MIII
(ox)3]·2.5H2O seed crystals and the
K3[MIII
(ox)3](aq/EtOH) saturated solutions used to crystallise epitaxial growth crystals......................... 149
Table 19: Summary of crystal structures (in chronological order of publication) and crystallising
conditions of 3D coordination frameworks involving [MII/III
(L)3]z+
with either {[MIM
III(ox)3]
2-}n,
{[MIIM
III(ox)3]
-}n, {[M
II2(ox)3]
2-}n or {[M
IM
III(dto)3]
2-}n.................................................................... 159
Table 20: Summary of co-crystallisation experiments between [MII(L)3]
2+ and [M
III(ox)3]
3-. ........... 163
Table 21: Statistical summary of xsolid values obtained from EDX data for experiments 1-6 that
involved [MII(L)3]
2+ and [M
III(ox)3]
3- complexes ................................................................................ 165

Supramolecular Selection in Molecular and Framework Co-crystals
xv
Table 22: Summary of crystal and refinement data for structures of [Ni0.50Ru0.50(bipy)3][NaCr(ox)3],
[Ni(bipy)3]0.80[Ru(phen)3]0.20[NaCr(ox)3] and [Ni(phen)3]0.20[Ru(bipy)3]0.80[NaCr(ox)3]. ................. 168

Supramolecular Selection in Molecular and Framework Co-crystals
xvi
List of Abbreviations
δ Partial charge
Δ Delta (right-handed propeller twist)
Λ Lambda (left-handed propeller twist)
1D One dimensional
2D Two-dimensional
3D Three-dimensional
6AE 6-fold Aryl Embrace
AAS Atomic Absorption Spectroscopy
aq aqueous
At% Atomic percent
bipy 2,2′-bipyridine
CSD Cambridge Structural Database
DCM Dichloromethane
DMF N,N-dimethylformamide
DMSO Dimethyl sulfoxide
EDX Energy Dispersive X-ray
EF Edge-to-Face
ESI-MS Electrospray Ionisation Mass Spectrometry
Et2O Diethyl ether
EtOH Ethanol
FF Face-to-Face
FWHM Full Width at Half Maximum
H-bond Hydrogen bond
HR High Resolution
ICP-MS Inductively Coupled Plasma Mass Spectrometry
m/z mass-to-charge ratio
Me2CO Acetone
MeCN Acetonitrile
MeOH Methanol
NBu4+ Tetra-n-butylammonium
NMR Nuclear Magnetic Resonance
Supramolecular Selection in Molecular and Framework Co-crystals
xvii
δH (proton chemical shift)
3JHH (vicinal proton-proton coupling constant)
4JHH (proton-proton coupling constant over 4
bonds)
s (singlet), d (doublet), t (triplet), dd (doublet of
doublets), dt (doublet of triplets), td (triplets of
doublets), tt (triplets of triplets), ddd (doublet of
doublets of doublets)
nPrOH n-Propanol
O4AE Orthogonal 4-fold Aryl Embrace
OFF Offset-Face-to-Face
ox oxalate
P4AE Parallel 4-fold Aryl Embrace
Ph Phenyl
phen 1,10-phenanthroline
PXRD Powder X-ray Diffraction
Refcode CSD crystal structure reference code
s(xsolid) Sample standard deviation of molar fraction in solid
S.D. Solvent Diffusion
S.E. Solvent Evaporation
SCO Spin Cross-Over
SCXRD Single Crystal X-Ray Diffraction
SEM Scanning Electron Microscopy
terpy 2,2′:6′,2′′-terpyridine
terpyO Deprotonated 2,6-bis(2-pyridyl)-4(1H)-pyridone
terpyOH 2,6-bis(2-pyridyl)-4(1H)-pyridone
terpyR 2,2′:6′,2′′-terpyridine substituted in the 4′-carbon position
VF Vertex-to-Face
xsolid Molar fraction in solid
xsolid single co-crystal Molar fraction in single co-crystal
xsolution Molar fraction in solution
x̄(xsolid) Sample mean of molar fraction in solid

Supramolecular Selection in Molecular and Framework Co-crystals
xviii
Statement of Original Authorship
The work contained in this thesis has not been previously submitted to meet
requirements for an award at this or any other higher education institution. To the
best of my knowledge and belief, the thesis contains no material previously
published or written by another person except where due reference is made.
Signature: __
Date: _________________________
08-04-2014
QUT Verified Signature

Supramolecular Selection in Molecular and Framework Co-crystals
xix
Acknowledgements
I would like to thank many people for their help and support during this long and
turbulent journey.
To my principal supervisor and mentor Dr John McMurtrie: I thank you more than
words can express for your help, guidance, support, wisdom and PATIENCE! Your
perspective on things has made me a better chemist and a better critical thinker.
Thank you for believing in me and for not giving up, you have made me realise that I
could swim all along.
Thank you to my co-supervisor Dr Madeleine Schultz for all of the wisdom, advice,
support, guidance and enthusiasm she has given me over the years. I thank you for
your strength and encouragement, it has truly inspired me.
Thank you to A/Prof Dennis Arnold for his ideas, wisdom and unwavering support
and for always telling me to keep going!
Thank you to Dr Llew Rintoul. I owe the success of all of the Raman spectroscopy
studies to his help, advice and nuggets of insight.
Thank you to Dr Thor Bostrom, Dr Peter Hines and Lambert Bekessy for all of their
help with SEM-EDX and to Tony Raftery for all of his help with PXRD and support.
I could not have completed this research without it.
Thank you to AA/Prof John Bartley for helping me with ESI-MS and for teaching
me how to navigate through the grey areas of NMR. I look at things differently
because of that day.
I would like to thank Dr Edeline Wentrup-Byrne for encouraging me to pursue a
career in chemistry, Dr Dalius Sagatys for sharing his infectious love of inorganic
chemistry and Dr Jack Clegg for his encouraging words and suggesting I investigate
oxalato complexes. I am on this path because of you.

Supramolecular Selection in Molecular and Framework Co-crystals
xx
Thank you to E/Prof Ray Frost and Dr Wayde Martens for introducing me to
research and for the invaluable life-long skills they have taught me.
I would also like to thank Prof Godwin Ayoko, Prof Steven Bottle, Prof Peter Healy,
A/Prof Peter Fredericks, A/Prof Eric Waclawik, AA/Prof Serge Kokot, Dr Tim
Dargaville, Dr Kathryn Fairfull-Smith and Dr Kathleen Mullen for their support and
kind words of encouragement when I needed them most.
Thank you to the technical staff for their insight and for training me to use the
myriad of instruments I needed to complete this project. Thank you to Nick Ryan for
listening and sorting things out. A big thank you to Elaine Reyes and Dean Rollbusch
of HDR support for their help and patience and to the APA and the office of the
DVC for financial support. Thank you to the team at the QUT IT helpdesk for going
above and beyond when computers decided to have a mind of their own.
Thank you to my fellow postgraduate students, many of whom have become
cherished friends. Special thanks (in alphabetical order) to Dr Sam Clifford, Priyanka
Dey, Nic Forster, Branko Koncarevic, Vanessa Lussini, Jason Morris, Dr Svetlana
Stevanovic and Hannah Wilson for understanding me, for their valuable friendship
and for always knowing how to cheer me up. An extra special thank you to Michael
Pfrunder for his help with all things SCXRD, for his friendship and support; I have
found an unlikely but true friend in you!
I would like to thank my family and friends, for their encouragement and support
during this long endeavour. Each one of you has enriched my life.
Lastly, I would like to thank my parents for believing in me and constantly telling me
that they are proud of me. Dad, I thank you for logic and for your love, support and
for being there whenever I need you. Thank you for listening to my chemistry woes
and for asking me if there is anything you can do to help- I needed the laughs! Mum,
I thank you for your infinite amounts of love, support and patience. Thank you for
always giving me half of the story and for making me figure out the rest. Without
you, I would not be the person I am today nor achieved the things I have achieved.

Supramolecular Selection in Molecular and Framework Co-crystals
xxi
“If we knew what it was we were doing,
it would not be called research, would it?”
Albert Einstein


CHAPTER 1
1
CHAPTER 1: Introduction
1.1 Supramolecular chemistry
Over the past thirty years, supramolecular chemistry has evolved into a major field,
which has stimulated countless multidisciplinary advances in domains within
chemistry, biology and physics.1-3 The philosophical groundwork for supramolecular
chemistry, specifically molecular recognition and host-guest chemistry was laid by
Nobel laureate Hermann Emil Fischer in the late nineteenth century. Fischer was the
first to postulate the lock and key analogy to describe enzyme-substrate interactions.
In this model only a key (substrate) of the correct size and shape would fit into the
lock (enzyme).4 However it was not until Pederson’s synthesis of crown ethers in
1960 and their subsequent application as ion-selective receptors by Lehn and Cram
in 1987 that the concepts of supramolecular chemistry were beginning to be
understood.5-13 Lehn, Cram and Pedersen won the Nobel Prize in 1987 for their work
with cryptands and crown ethers that were capable of recognition and selectivity for
metal ions.5,8-11 This work was a fundamental contribution into the research of
molecular architectures, host-guest assemblies and molecular recognition.
This domain of chemistry was dubbed by Lehn as supramolecular chemistry and is
defined by Lehn as “chemistry beyond the molecule” and the “chemistry of molecular
assembly and of the intermolecular bond.”14-16 Unlike traditional strands of
chemistry, such as organic chemistry, which concentrate on covalent bonding within
molecules, supramolecular chemistry focuses on non-covalent interactions between
molecules. Such interactions include hydrogen bonding, van der Waals forces, metal
coordination and π-interactions, all of which are weaker and described as dynamic
i.e. more easily reversed than covalent bonds.1-3
As Lehn’s definitions suggest, supramolecular chemistry focuses on the assembly of
larger secondary structures through the arrangement of smaller molecular units via
these non-covalent interactions. Lehn expands on these definitions by describing
three overlapping phases that might be considered in the pursuit and design of highly

CHAPTER 1
2
complex materials where the ultimate goal is to design self-fabricating systems;
molecular recognition, self-assembly and self-organisation through selection.1-3
Understanding the paradigms governing intermolecular interactions and subsequently
manipulating those interactions is essential for the construction of functionally
specific supramolecular systems.
1.2 Crystal engineering
The exploitation of supramolecular interactions to produce supramolecular
crystalline solids with desired functionalities is the essence of crystal engineering.17-21
Crystal engineering is essentially a form of solid-state supramolecular synthesis.22
Schmidt in 1971 is usually credited for having conceived the expression crystal
engineering in a publication reporting the light-induced photodimerisation of
cinnamic acids in the solid state, however there is an earlier publication by Pepinsky
in 1955 where the term crystal engineering is used for the very first time.23,24
Pepinsky demonstrated that by co-crystallising various organic ions with complex
ions, one could control the packing in the resulting crystalline solid.24,25
Early research into crystal engineering focused on the exploitation of hydrogen
bonds.26,27 More recently however, crystal engineering research has also involved
exploitation of other intermolecular interactions such as metal-ligand coordination
bonds and π-interactions. 28-35 Desiraju in Crystal engineering: The design of organic
solids, 1989 defined crystal engineering as:
“the understanding of intermolecular interactions in the context of crystal packing
and in the utilisation of such understanding in the design of new solids with desired
physical and chemical properties”.36
To date, this is still the most widely accepted and quoted definition of crystal
engineering.37,38 More recently Braga et al. in 2008 refined the definition of crystal
engineering with a statement that captures the foundation of the research presented
throughout this thesis:

CHAPTER 1
3
“Making crystals by design is the paradigm of crystal engineering, the main goal
being that of obtaining collective properties from the convolution of the physical and
chemical properties of the individual building-blocks with crystal periodicity and
symmetry”.39
These definitions of crystal engineering essentially involve the assembly of
molecular fragments using intermolecular interactions to form crystalline materials.
These molecular fragments are a substructural unit representative of the entire crystal
structure and have been coined by Desiraju as supramolecular tectons, which are a
direct analogy to the molecular tectons proposed by Corey for organic
retrosynthesis.40 Supramolecular tectons are defined by Desiraju as:
“structural units within supramolecules which can be formed and/or assembled by
known or conceivable synthetic operations involving intermolecular interactions”.27,41
Desiraju expanded on this definition by stating that supramolecular tectons are
“kinetically defined structural units that express the core features of a crystal
structure and which encapsulate the essence of crystals in terms of molecular
recognition.”37
An understanding of molecular recognition interactions is a crucial part of crystal
engineering due to the increasing ability to control the ways in which molecules
associate during assembly.1,11,42 The ultimate goal of crystal engineering is to
systematically design crystalline materials with specific functionalities by organising
supramolecular tectons into predictable arrays.43,44 The chemical and physical
properties of crystalline solids are influenced not only by the properties of the
molecular components but also by their geometric arrangement and spatial
distribution. However, it is important to note that crystal engineering is not
synonymous with crystal structure prediction and although physical and chemical
properties of the tectons can be controlled, it remains a challenge to definitively
control or predict crystal packing.45-48 The frustration with this facet of crystal
CHAPTER 1
4
engineering has been expressed so eloquently by Maddox in 1988 in an article
concerned with the ab initio calculations of silica, where he stated:
“One of the continuing scandals in the physical sciences is that it remains in general
impossible to predict the structure of even the simplest crystalline solids from a
knowledge of their chemical compositions.”49
Several years later Whitesell et al. in 1994 echoed the same dilemma concerning the
prediction of crystal structures with the statement:
“There is as yet no generally successful approach to predicting, let alone controlling,
molecular orientations in crystals. Thus the rational design and preparation of
crystalline and other supra-molecular materials is hampered by insufficient
knowledge of those factors that control packing.”50
Both sentiments still hold true today as ab initio crystal structure prediction is yet to
come into fruition.48 This lack of modularity during the moleculecrystal process
still remains a serious issue.37 At present we are still far off from being able to fully
understand, predict or model the various forces responsible for the cohesion of solids
from the knowledge of their molecular components.43
A quick glance at some of the structures deposited in the Cambridge Structural
Database (CSD),51 which is a fully licensed and searchable database, illustrates that
almost identical molecules can adopt very different crystal structures when
crystallised using the same method. Similarly, various crystal structures are also
reported for the same compounds crystallised from different solvent mixtures
regardless of whether the solvent is detected in the eventuating solid. Currently the
CSD contains almost 700 000 structures, which is more than double the number of
structures that was available ten years ago; the number of structures in the CSD is
observed to be exponentially growing. The increase in the volume of structures is
largely due to the efficiency of data collection and refinement afforded by new
advances in instrumentation, computation and structure visualisation. For many
supramolecular chemistry research groups, crystal structure determination has
become part of routine characterisation.
CHAPTER 1
5
The CSD is a vital research tool in realising the goal of crystal engineering and
crystal structure prediction. Due to the enormous volume of structures available
today it is possible to search for and identify similar molecules or tectons that lead to
similar crystal packing arrangements or recurring supramolecular motifs, thereby
identifying some element of modularity during the moleculecrystal process.43,47,52
Structures assembled using this building-block technique often display characteristic
patterns, which are determined by intermolecular interactions between molecular
units. Concerted sets of intermolecular interactions, which lead to supramolecular
motifs or packing arrangements, often occur in the supramolecular structures of
related compounds.53 These recurring motifs can be used as a basis for understanding
the underlying supramolecular chemistry responsible for the overall spatial
arrangement of molecular units.
The relevance of crystal packing to supramolecular chemistry has been articulated by
Dunitz, who stated, “a crystal is in a sense, the supramolecule par excellence.”54
Thus, supramolecular interactions, which form a supramolecular motif, are by
definition, infinitely repeated throughout the crystal with the utmost perfection. This
perfection arises from the assembly that contributes the most stabilising lattice
energy. If there is a correlation between the types of molecules and the packing
arrangement they adopt, it is assumed that the crystal packing for those types of
molecules is kinetically favoured and hence provides some basis from which to
engineer similar compounds that may adopt the same motif or crystal packing.37,41
The use and exploitation of known crystal packing arrangements and recurring
supramolecular motifs is the strategy that has been adopted during this research for
the synthesis of new co-crystalline materials with predictable structures.
1.3 Intermolecular interactions
The term non-covalent interaction includes a wide range of forces involving
fundamental attractive and repulsive interactions. Most of these forces, although
generally considered weaker than conventional covalent bonds, are relied upon for
CHAPTER 1
6
the assembly of supramolecular architectures. Some of the fundamental non-covalent
interactions in the realm of supramolecular chemistry, such as ionic, dipole,
π-interactions and van der Waals forces will be discussed briefly in this section.
Bonds between charged species are formed through ion-ion interactions. These
interactions are electrostatic in nature and therefore the associated energies can be
calculated using Coulomb’s law. Coulombic forces are distance dependent to the
approximate order of r-1
(where r is the distance separating the two charged species)
and as such are considered as long range interactions.55 Ionic bonds are the strongest
of intermolecular interactions with bond energies comparable in strength to covalent
bonds ca. 100-350 kJmol-1
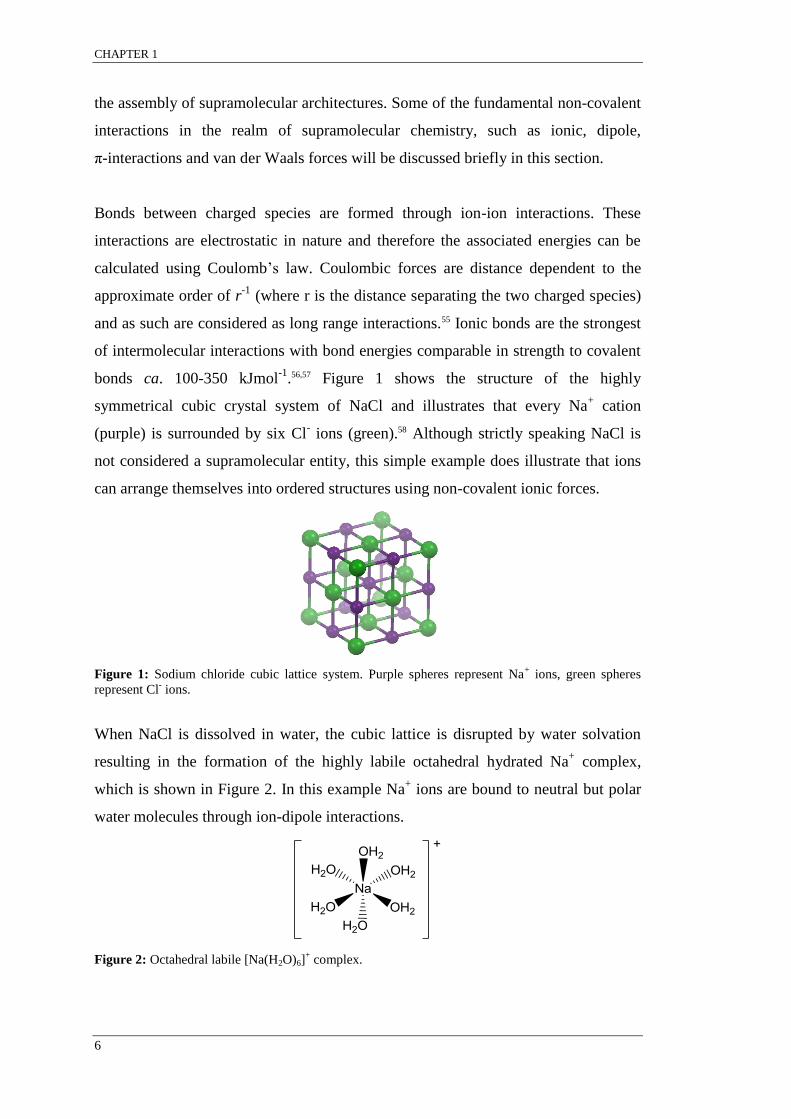
.56,57 Figure 1 shows the structure of the highly
symmetrical cubic crystal system of NaCl and illustrates that every Na+ cation
(purple) is surrounded by six Cl- ions (green).58 Although strictly speaking NaCl is
not considered a supramolecular entity, this simple example does illustrate that ions
can arrange themselves into ordered structures using non-covalent ionic forces.
Figure 1: Sodium chloride cubic lattice system. Purple spheres represent Na+ ions, green spheres
represent Cl- ions.
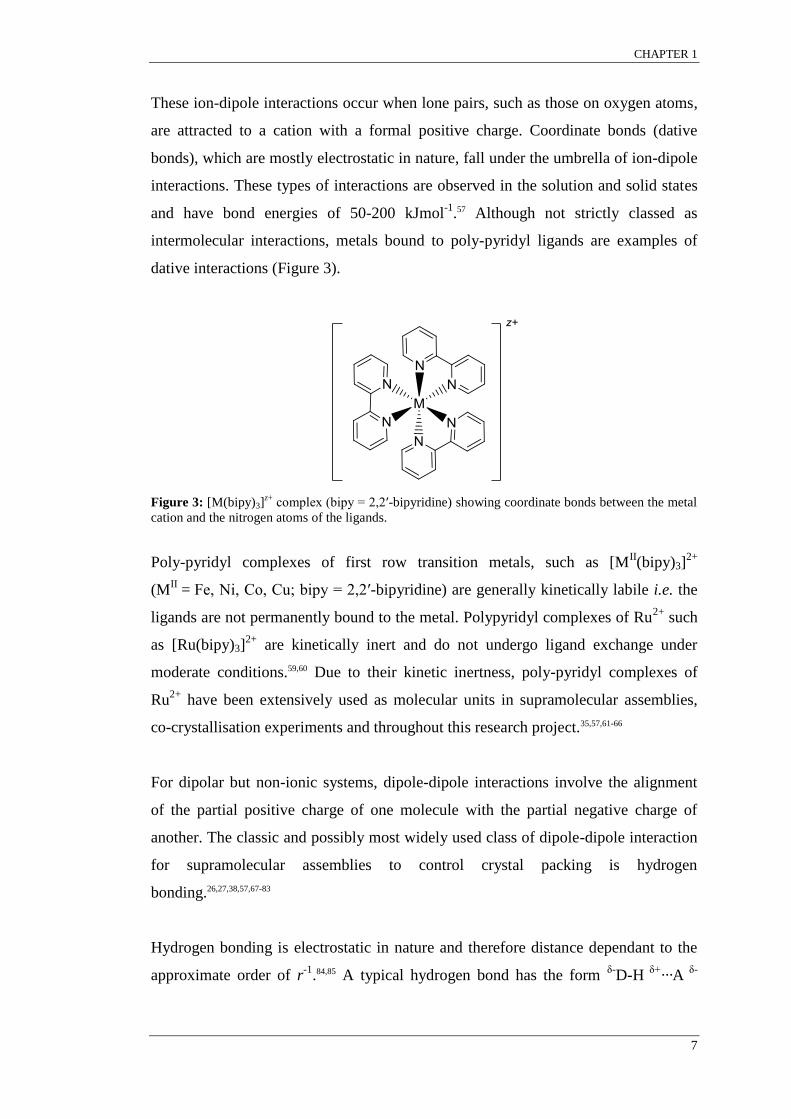
When NaCl is dissolved in water, the cubic lattice is disrupted by water solvation
resulting in the formation of the highly labile octahedral hydrated Na+ complex,
which is shown in Figure 2. In this example Na+ ions are bound to neutral but polar
water molecules through ion-dipole interactions.
Figure 2: Octahedral labile [Na(H2O)6]+ complex.
CHAPTER 1
7
These ion-dipole interactions occur when lone pairs, such as those on oxygen atoms,
are attracted to a cation with a formal positive charge. Coordinate bonds (dative
bonds), which are mostly electrostatic in nature, fall under the umbrella of ion-dipole
interactions. These types of interactions are observed in the solution and solid states
and have bond energies of 50-200 kJmol-1
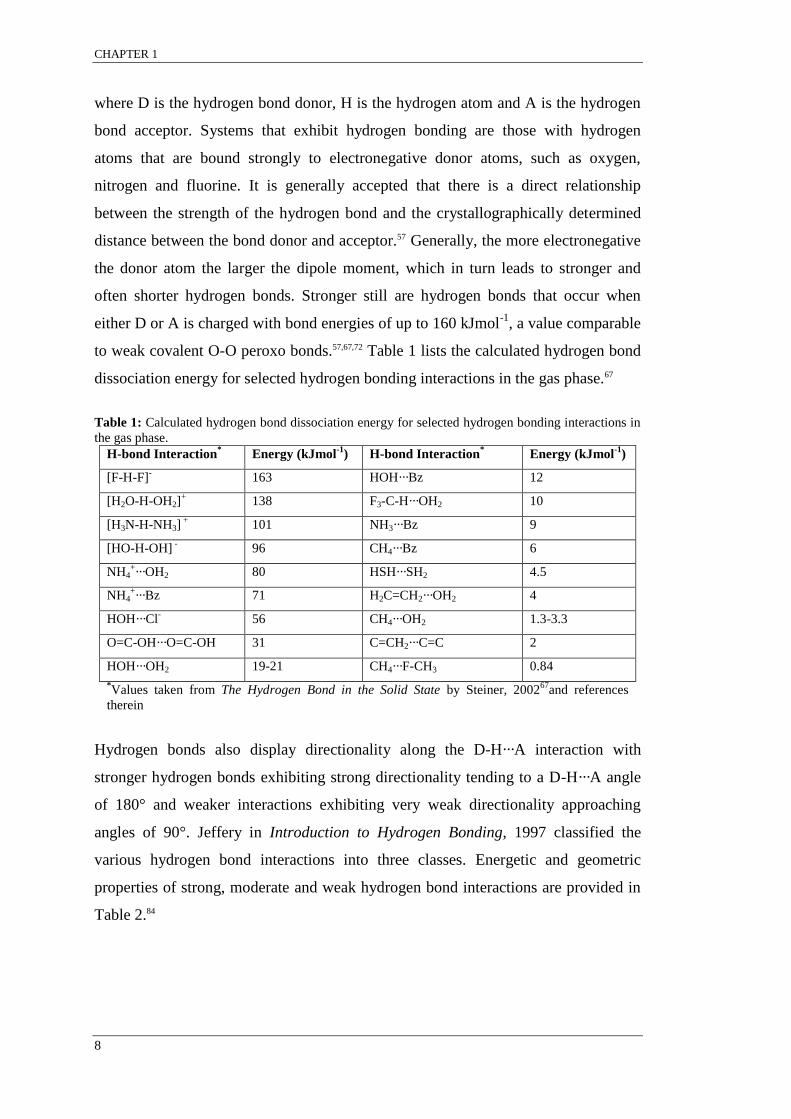
.57 Although not strictly classed as
intermolecular interactions, metals bound to poly-pyridyl ligands are examples of
dative interactions (Figure 3).
Figure 3: [M(bipy)3]z+
complex (bipy = 2,2′-bipyridine) showing coordinate bonds between the metal
cation and the nitrogen atoms of the ligands.
Poly-pyridyl complexes of first row transition metals, such as [MII(bipy)3]
2+
(MII = Fe, Ni, Co, Cu; bipy = 2,2′-bipyridine) are generally kinetically labile i.e. the
ligands are not permanently bound to the metal. Polypyridyl complexes of Ru2+
such
as [Ru(bipy)3]2+
are kinetically inert and do not undergo ligand exchange under
moderate conditions.59,60 Due to their kinetic inertness, poly-pyridyl complexes of
Ru2+
have been extensively used as molecular units in supramolecular assemblies,
co-crystallisation experiments and throughout this research project.35,57,61-66
For dipolar but non-ionic systems, dipole-dipole interactions involve the alignment
of the partial positive charge of one molecule with the partial negative charge of
another. The classic and possibly most widely used class of dipole-dipole interaction
for supramolecular assemblies to control crystal packing is hydrogen
bonding.26,27,38,57,67-83
Hydrogen bonding is electrostatic in nature and therefore distance dependant to the
approximate order of r-1
.84,85 A typical hydrogen bond has the form δ-
D-H δ+
···A δ-
CHAPTER 1
8
where D is the hydrogen bond donor, H is the hydrogen atom and A is the hydrogen
bond acceptor. Systems that exhibit hydrogen bonding are those with hydrogen
atoms that are bound strongly to electronegative donor atoms, such as oxygen,
nitrogen and fluorine. It is generally accepted that there is a direct relationship
between the strength of the hydrogen bond and the crystallographically determined
distance between the bond donor and acceptor.57 Generally, the more electronegative
the donor atom the larger the dipole moment, which in turn leads to stronger and
often shorter hydrogen bonds. Stronger still are hydrogen bonds that occur when
either D or A is charged with bond energies of up to 160 kJmol-1
, a value comparable
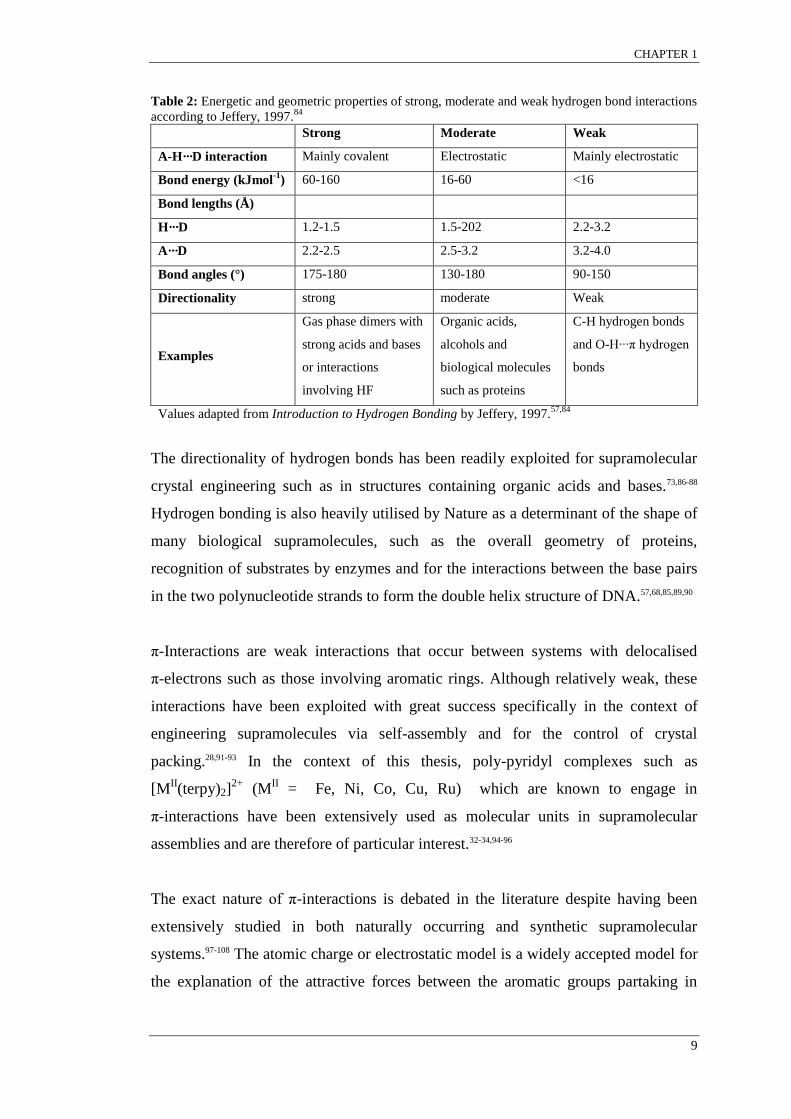
to weak covalent O-O peroxo bonds.57,67,72 Table 1 lists the calculated hydrogen bond
dissociation energy for selected hydrogen bonding interactions in the gas phase.67
Table 1: Calculated hydrogen bond dissociation energy for selected hydrogen bonding interactions in
the gas phase.
H-bond Interaction* Energy (kJmol
-1) H-bond Interaction
* Energy (kJmol
-1)
[F-H-F]- 163 HOH···Bz 12
[H2O-H-OH2]+ 138 F3-C-H···OH2 10
[H3N-H-NH3] +
101 NH3···Bz 9
[HO-H-OH] - 96 CH4···Bz 6
NH4+···OH2 80 HSH···SH2 4.5
NH4+···Bz 71 H2C=CH2···OH2 4
HOH···Cl- 56 CH4···OH2 1.3-3.3
O=C-OH···O=C-OH 31 C=CH2···C=C 2
HOH···OH2 19-21 CH4···F-CH3 0.84
*Values taken from The Hydrogen Bond in the Solid State by Steiner, 2002
67and references
therein
Hydrogen bonds also display directionality along the D-H···A interaction with
stronger hydrogen bonds exhibiting strong directionality tending to a D-H···A angle
of 180° and weaker interactions exhibiting very weak directionality approaching
angles of 90°. Jeffery in Introduction to Hydrogen Bonding, 1997 classified the
various hydrogen bond interactions into three classes. Energetic and geometric
properties of strong, moderate and weak hydrogen bond interactions are provided in
Table 2.84
CHAPTER 1
9
Table 2: Energetic and geometric properties of strong, moderate and weak hydrogen bond interactions
according to Jeffery, 1997.84
Strong Moderate Weak
A-H···D interaction Mainly covalent Electrostatic Mainly electrostatic
Bond energy (kJmol-1
) 60-160 16-60 <16
Bond lengths (Å)
H···D 1.2-1.5 1.5-202 2.2-3.2
A···D 2.2-2.5 2.5-3.2 3.2-4.0
Bond angles (°) 175-180 130-180 90-150
Directionality strong moderate Weak
Examples
Gas phase dimers with
strong acids and bases
or interactions
involving HF
Organic acids,
alcohols and
biological molecules
such as proteins
C-H hydrogen bonds
and O-H···π hydrogen
bonds
Values adapted from Introduction to Hydrogen Bonding by Jeffery, 1997.57,84
The directionality of hydrogen bonds has been readily exploited for supramolecular
crystal engineering such as in structures containing organic acids and bases.73,86-88
Hydrogen bonding is also heavily utilised by Nature as a determinant of the shape of
many biological supramolecules, such as the overall geometry of proteins,
recognition of substrates by enzymes and for the interactions between the base pairs
in the two polynucleotide strands to form the double helix structure of DNA.57,68,85,89,90
π-Interactions are weak interactions that occur between systems with delocalised
π-electrons such as those involving aromatic rings. Although relatively weak, these
interactions have been exploited with great success specifically in the context of
engineering supramolecules via self-assembly and for the control of crystal
packing.28,91-93 In the context of this thesis, poly-pyridyl complexes such as
[MII(terpy)2]
2+ (M
II = Fe, Ni, Co, Cu, Ru) which are known to engage in
π-interactions have been extensively used as molecular units in supramolecular
assemblies and are therefore of particular interest.32-34,94-96
The exact nature of π-interactions is debated in the literature despite having been
extensively studied in both naturally occurring and synthetic supramolecular
systems.97-108 The atomic charge or electrostatic model is a widely accepted model for
the explanation of the attractive forces between the aromatic groups partaking in

CHAPTER 1
10
π interactions.57,101-103,109 The hydrogen atoms in an aromatic system are
electron-deficient and therefore carry a partial positive charge. The carbon atoms in
these systems are electron-rich and therefore possess a partial negative charge.109
There are two main types of π-interactions; π-π interactions, sometimes referred to as
π-stacking and CH···π interactions.109 For each type there are two main geometries,
however due to the non-uniform charge distribution of aromatic systems, some
interactions are energetically favoured over others.95,110,111
Face-to-face (FF) and offset-face-to-face (OFF) geometries are types of π-π
interactions, which involve the faces of aromatic systems. The FF interaction, also
known as the sandwich, is a direct overlap of the partially negatively charged carbon
atoms (or of the partially positively charged hydrogen atoms) of two π systems. Due
to the electrostatic repulsion of opposing like charges experienced by the system and
hence the contribution of destabilising energy, this arrangement is rarely
encountered.111 The OFF interaction, also referred to as parallel displaced or slipped
face-to-face arrangement, contributes stabilising energy to a system, thus is
encountered more frequently.102,103 In the OFF the partially positively charged
hydrogen atoms of one aromatic system overlap the partially negatively charged
carbon atoms of the other.97,99-101,104,112 These types of π-π interactions are responsible
for the stacking arrangement of graphene sheets in graphite, hence graphite has
applications as a lubricant due to the ability for the graphene layers to slip over each
other.113 Similar stacking arrangements are observed between the aromatic groups of
nucleobase pairs. These interactions are responsible for the stabilisation of the DNA
double helix.89,90 Figure 4 illustrates the FF and OFF π-interactions using the benzene
dimer as a model.
Figure 4: Geometric arrangement for FF (a) and OFF (b) interactions of the benzene dimer as
indicated by the double-headed red arrows.
(a) (b)
CHAPTER 1
11
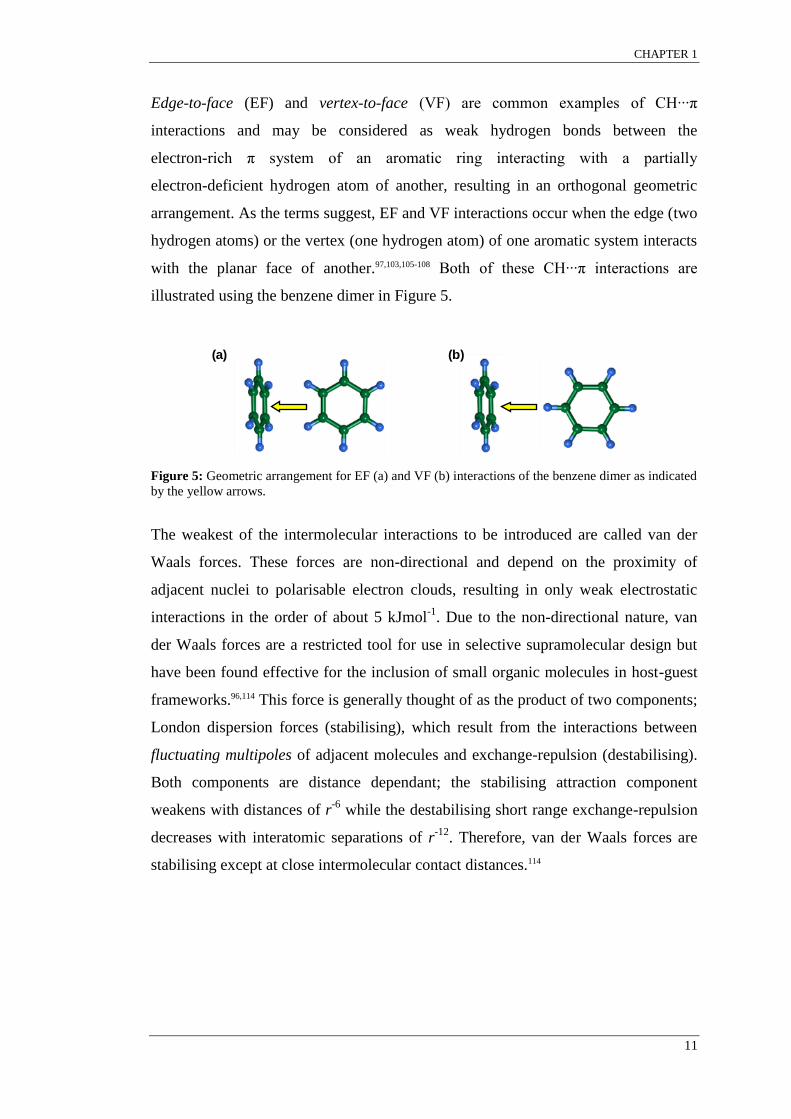
Edge-to-face (EF) and vertex-to-face (VF) are common examples of CH···π
interactions and may be considered as weak hydrogen bonds between the
electron-rich π system of an aromatic ring interacting with a partially
electron-deficient hydrogen atom of another, resulting in an orthogonal geometric
arrangement. As the terms suggest, EF and VF interactions occur when the edge (two
hydrogen atoms) or the vertex (one hydrogen atom) of one aromatic system interacts
with the planar face of another.97,103,105-108 Both of these CH···π interactions are
illustrated using the benzene dimer in Figure 5.
Figure 5: Geometric arrangement for EF (a) and VF (b) interactions of the benzene dimer as indicated
by the yellow arrows.
The weakest of the intermolecular interactions to be introduced are called van der
Waals forces. These forces are non-directional and depend on the proximity of
adjacent nuclei to polarisable electron clouds, resulting in only weak electrostatic
interactions in the order of about 5 kJmol-1
. Due to the non-directional nature, van
der Waals forces are a restricted tool for use in selective supramolecular design but
have been found effective for the inclusion of small organic molecules in host-guest
frameworks.96,114 This force is generally thought of as the product of two components;
London dispersion forces (stabilising), which result from the interactions between
fluctuating multipoles of adjacent molecules and exchange-repulsion (destabilising).
Both components are distance dependant; the stabilising attraction component
weakens with distances of r-6
while the destabilising short range exchange-repulsion
decreases with interatomic separations of r-12
. Therefore, van der Waals forces are
stabilising except at close intermolecular contact distances.114
(a) (b)

CHAPTER 1
12
1.4 Supramolecular motifs
The term supramolecular motif was briefly introduced earlier, and was defined as a
set of recurring intermolecular interactions. Research conducted by Dance et al.
concerning several primary and secondary motifs arising from various π-π and
CH···π interactions are pertinent to this research.92,95,96,100,115,116 Motifs that involve
phenyl groups have been described as multiple phenyl embraces however the term
multiple aryl embraces is commonly used to collectively include non-phenyl
aromatic systems such as pyridyl groups.100,116 Figure 6 illustrates some primary
phenyl-phenyl OFF and EF conformations in aryl embraces between cation pairs of
Ph4P+ species. The parallel 4-fold aryl embrace (P4AE) involves one OFF and two
EF interactions. The orthogonal analogue (O4AE) and the 6-fold aryl embrace (6AE)
consist of only EF interactions. Secondary motifs are simply the infinite propagation
of primary motifs throughout the crystal lattice.115-122
Figure 6: Primary multiple aryl embrace motifs for Ph4P+ cations. The parallel 4-fold aryl embrace
(P4AE) involves one OFF and two EF interactions. The orthogonal analogue (O4AE) and the 6-fold
aryl embrace (6AE) consist of only EF interactions.
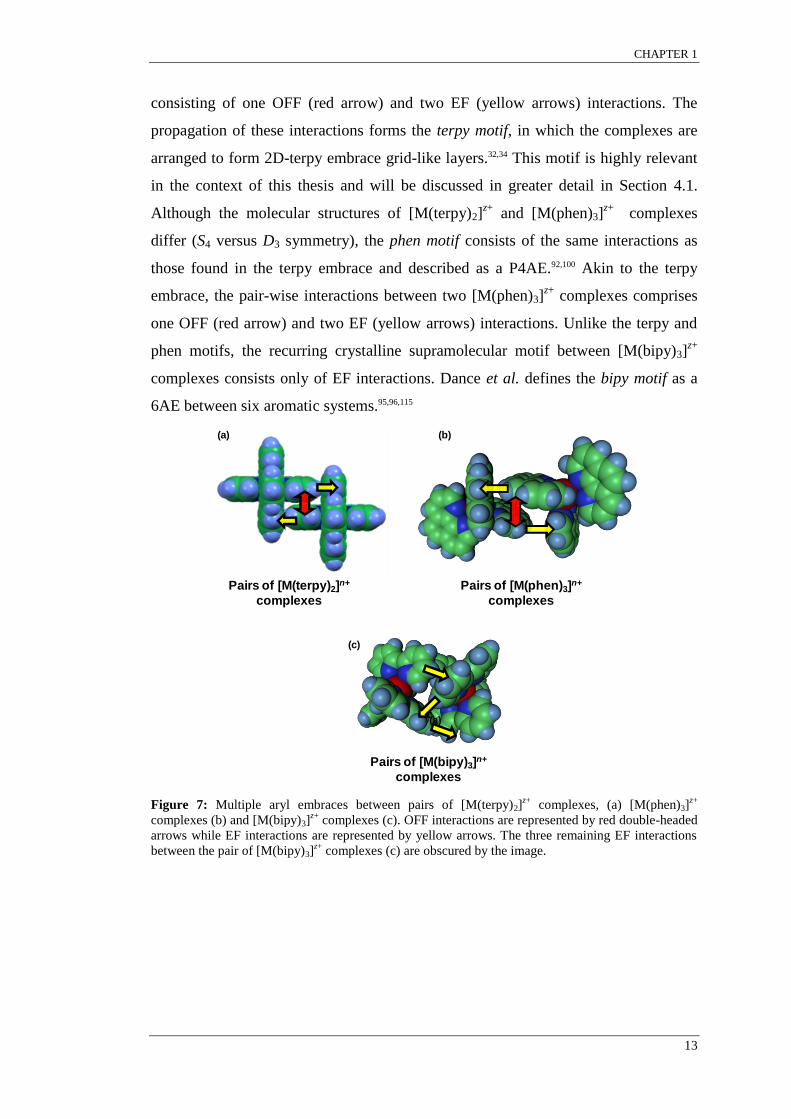
Multiple aryl embraces have been identified in the structures of a wide range of
compounds with aromatic components including many of the poly-pyridyl
coordination complexes discussed throughout this thesis.96,115 Multiple aryl embraces
between pairs of [M(terpy)2]z+
, pairs of [M(phen)3]z+
and pairs of [M(bipy)3]z+
complexes are shown in Figure 7 (a)-(c). Due to the orthogonal conformation of the
terpy ligands in [M(terpy)2]z+
complexes, pairs of complexes engage in a P4AE
Orthogonal 4-fold
aryl embrace (O4AE)
Parallel 4-fold aryl
embrace (P4AE)
6-fold aryl
embrace (6AE)
CHAPTER 1
13
consisting of one OFF (red arrow) and two EF (yellow arrows) interactions. The
propagation of these interactions forms the terpy motif, in which the complexes are
arranged to form 2D-terpy embrace grid-like layers.32,34 This motif is highly relevant
in the context of this thesis and will be discussed in greater detail in Section 4.1.
Although the molecular structures of [M(terpy)2]z+
and [M(phen)3]z+
complexes
differ (S4 versus D3 symmetry), the phen motif consists of the same interactions as
those found in the terpy embrace and described as a P4AE.92,100 Akin to the terpy
embrace, the pair-wise interactions between two [M(phen)3]z+
complexes comprises
one OFF (red arrow) and two EF (yellow arrows) interactions. Unlike the terpy and
phen motifs, the recurring crystalline supramolecular motif between [M(bipy)3]z+
complexes consists only of EF interactions. Dance et al. defines the bipy motif as a
6AE between six aromatic systems.95,96,115
Figure 7: Multiple aryl embraces between pairs of [M(terpy)2]z+
complexes, (a) [M(phen)3]z+
complexes (b) and [M(bipy)3]z+
complexes (c). OFF interactions are represented by red double-headed
arrows while EF interactions are represented by yellow arrows. The three remaining EF interactions
between the pair of [M(bipy)3]z+
complexes (c) are obscured by the image.
(a) (b)
(a)
(c)
Pairs of [M(terpy)2]n+
complexes
Pairs of [M(phen)3]n+
complexes
Pairs of [M(bipy)3]n+
complexes
CHAPTER 1
14
1.5 Lattice dimensionality
Wells in 1984 conceived topological rules that determine the connectivity and
consequently the structural dimensionality for various molecular assemblies.123 These
rules apply to repeat units that connect via a variety of intermolecular interactions,
however within the context of this research, the lattice dimensionality of a
supramolecular architecture is defined as the extent to which its building-blocks
(repeat units) interconnect through coordinate bonds.
Zero dimensional (0D) structures contain discrete molecular units, which are
self-contained and do not infinitely extend via coordinate bonds throughout the
lattice. Examples of such units include [M(terpy)2]z+
, [M(phen)3]z+
and [M(bipy)3]z+
metal complexes. It is important to note that although intermolecular interactions
between [M(terpy)2]z+
complexes form extended grid-like supramolecular motifs,
these structures are defined within the context of this thesis to be molecular and not
polymeric structures as propagation is via π-π and CH···π intermolecular interactions
and not coordinate bonds.
For structures of higher dimensionality, building-blocks must have at least two free
connecting links available for bonding to its neighbours.17,124 One-dimensional
structures (1D) are those where the molecular units are interconnected via two links
to produce polymeric structures that are infinite in one direction through the crystal
lattice. Examples of 1D structures include linear and zig-zag chains. A
two-dimensional structure (2D) involves building-blocks that are interconnected by
at least three points (coplanar). Examples of these include square grids and
honeycomb structures. Three-dimensional frameworks (3D) arise when
building-blocks are interconnected by at least three non-coplanar links. Some
common 3D scaffolds include infinite matrices and diamondoid structures.17,124
Figure 8 shows schematic representations of example 1D (a), 2D (b) and 3D (c)
topologies.

CHAPTER 1
15
Figure 8: Schematic representations of (a) 1D linear chain, (b) grid (bottom) and honeycomb (top) 2D
lattices and (c) matrix (bottom), diamondoid (middle) and extended (top) 3D networks. The building-
blocks and their connectivity are also shown to the right of each structure to illustrate the relationship
between building-block connectivity and the resulting dimensionality of the structure.17,124
The nomenclature of 1D, 2D and 3D metal-organic framework structures has
recently been the topic of debate, specifically in regards to the synonymous use of
the terms “coordination polymer”, “coordination frameworks/network” and
“metal-organic framework/network”.125,126 Throughout this thesis, 3D structures are
referred to using the terms coordination framework and metal-organic framework
interchangeably.
1.6 Multicomponent crystals
1.6.1 Nomenclature
The nomenclature of crystal forms that contain more than one component is currently
an active subject of debate, especially in regards to the distinction between
polymorphs, solvates/hydrates, molecular salts and co-crystals.39,127-136 The discussion
in the literature is especially heated in regards to the design and patenting of active
pharmaceutical ingredients.137-144
2 connected points
(a)
4 connected points
(coplanar)
(b)
3 connected points
(coplanar)
(c)
3 connected points
(non-coplanar)
6 connected points
(non-coplanar)
4 connected points
(non-coplanar)
CHAPTER 1
16
In a letter titled Crystal and Co-crystal, 2003 Desiraju expressed that “problems
with nomenclature are necessary evils in the development of a new subject”.131
Research into multicomponent crystals is not a relatively new topic, but has recently
become one of the most attractive and fast growing areas in crystal engineering.136
The term “co-crystal”, which has been used for some time,145 has specifically been a
subject of disagreement. Desiraju expressed that “co-crystal” must apply to crystals
together with other crystals, with each component retaining its individual crystalline
identity and that previously used terms such as molecular complex are more
acceptable to describe crystals with different components contained in the same
lattice.131
Dunitz in 2003 stated that the term molecular complex was too broad and not
necessarily connected to compounds in the crystalline state. Dunitz defined
co-crystals as “crystals containing two or more components together” further stating
that although the term has its flaws it has been firmly established in the literature.132
This definition has been expanded by Stahly who stated “co-crystals consist of two
or more components that form a unique crystalline structure having unique
properties”.134,135 However, both of these definitions are too broad as they
“encompass molecular compounds, molecular complexes, solvates, inclusion
compounds, channel compounds, clathrates, and possibly a few other types of
multi-component crystals”.129,132 A more specific definition restricts the use of the
term co-crystal to denote multicomponent crystals that are composed of molecular
components that are solids in their pure form under ambient conditions, versus those
that are composed of a solid together with a liquid, the latter of which are called
solvates or pseudopolymorphs.81,127-129,133-136 This definition implies that molecular
components abandon their individual crystalline identity within the co-crystal to
form a single crystalline phase.129
A thorough survey of the literature reveals that co-crystals, specifically those
containing transition metal coordination compounds, have been labelled under
several different terms. In addition to the term “co-crystal”, other common terms that
have been used include “solid solutions”,28,61,62,146-154 “metal dilution compounds” or
“diluted systems”,155-169 “metallic doped systems/compounds”,170-182 “mixed
crystals”,65,74,183-199 and “molecular/supramolecular alloys”.79,200-202 Many of these terms

CHAPTER 1
17
(more of which can be found in the keywords section of this thesis) are used
interchangeably, and some terms such as “mixed crystal” have been used extensively
to describe compounds such as simple salts and are therefore ambiguous.203-207
The inconsistency in the nomenclature of these compounds has caused unnecessary
confusion and misunderstandings. Moreover, it has added difficulty in the search for
compounds in the literature. To avoid confusion the term “co-crystal” is used
throughout this thesis to describe crystals that contain multiple molecular
components, specifically, two or more different types of metal complexes. The terms
“diluted”, “undiluted” and “dilution” are used to aid in the discussion of co-crystals
and co-crystallisation experiments involving systems that contain more than two
types of metal complexes. For example, in pure compounds of AB where A is a
cationic metal complex and B is an anionic metal complex, co-crystallisation
experiments can be performed that dilute A to yield a system of AxA′1-xB or to dilute
B resulting in a ABxB′1-x system (A′ and B′ are complexes capable of substituting for
A and B respectively). Herein, the former is called a cationic metal complex dilution
while the latter is called an anionic metal complex dilution.
1.6.2 Co-crystal systems in the literature
As mentioned earlier, an ongoing challenge in the field of supramolecular chemistry
and crystal engineering is the development of methods for reliably exploiting
intermolecular interactions to form new materials with specific functionalities and
predictable crystal structures. One approach to forming new materials with
predictable structures that is gaining popularity is through the synthesis of co-crystals
via the co-crystallisation of species that possess similar molecular and crystal
structures but different physical or chemical properties. The resulting crystals often
form with predictable structures and have properties that may be tuned by
modulating the relative concentration of the components in the co-crystallising
solution.
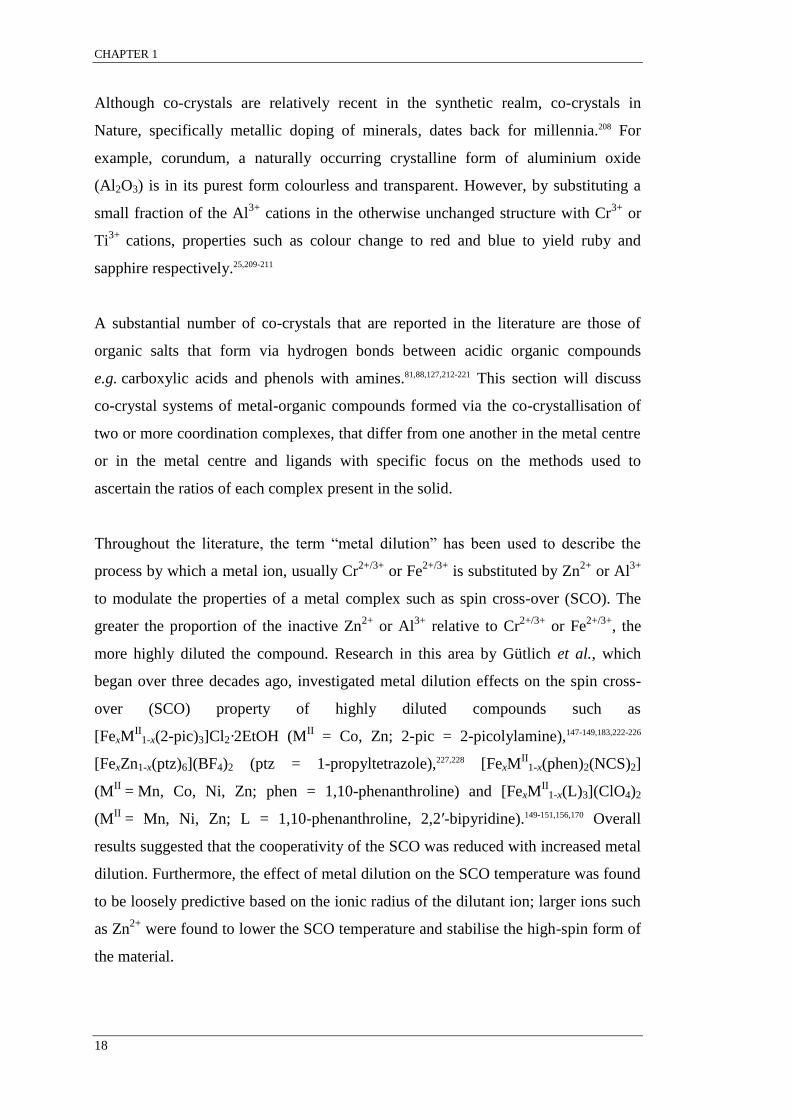
CHAPTER 1
18
Although co-crystals are relatively recent in the synthetic realm, co-crystals in
Nature, specifically metallic doping of minerals, dates back for millennia.208 For
example, corundum, a naturally occurring crystalline form of aluminium oxide
(Al2O3) is in its purest form colourless and transparent. However, by substituting a
small fraction of the Al3+
cations in the otherwise unchanged structure with Cr3+
or
Ti3+
cations, properties such as colour change to red and blue to yield ruby and
sapphire respectively.25,209-211
A substantial number of co-crystals that are reported in the literature are those of
organic salts that form via hydrogen bonds between acidic organic compounds
e.g. carboxylic acids and phenols with amines.81,88,127,212-221 This section will discuss
co-crystal systems of metal-organic compounds formed via the co-crystallisation of
two or more coordination complexes, that differ from one another in the metal centre
or in the metal centre and ligands with specific focus on the methods used to
ascertain the ratios of each complex present in the solid.
Throughout the literature, the term “metal dilution” has been used to describe the
process by which a metal ion, usually Cr2+/3+
or Fe2+/3+
is substituted by Zn2+
or Al3+
to modulate the properties of a metal complex such as spin cross-over (SCO). The
greater the proportion of the inactive Zn2+
or Al3+
relative to Cr2+/3+
or Fe2+/3+
, the
more highly diluted the compound. Research in this area by Gütlich et al., which
began over three decades ago, investigated metal dilution effects on the spin cross-
over (SCO) property of highly diluted compounds such as
[FexMII
1-x(2-pic)3]Cl2·2EtOH (MII = Co, Zn; 2-pic = 2-picolylamine),147-149,183,222-226
[FexZn1-x(ptz)6](BF4)2 (ptz = 1-propyltetrazole),227,228 [FexMII
1-x(phen)2(NCS)2]
(MII = Mn, Co, Ni, Zn; phen = 1,10-phenanthroline) and [FexM
II1-x(L)3](ClO4)2
(MII = Mn, Ni, Zn; L = 1,10-phenanthroline, 2,2′-bipyridine).149-151,156,170 Overall
results suggested that the cooperativity of the SCO was reduced with increased metal
dilution. Furthermore, the effect of metal dilution on the SCO temperature was found
to be loosely predictive based on the ionic radius of the dilutant ion; larger ions such
as Zn2+
were found to lower the SCO temperature and stabilise the high-spin form of
the material.
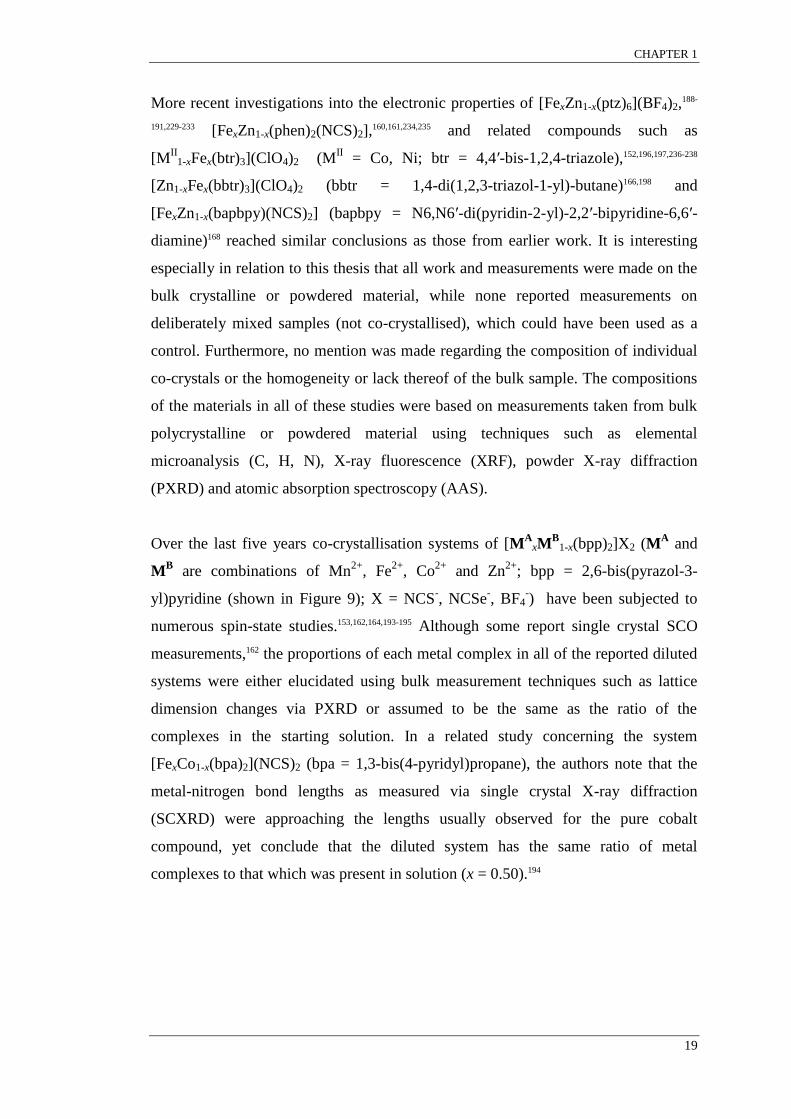
CHAPTER 1
19
More recent investigations into the electronic properties of [FexZn1-x(ptz)6](BF4)2,188-
191,229-233 [FexZn1-x(phen)2(NCS)2],160,161,234,235 and related compounds such as
[MII
1-xFex(btr)3](ClO4)2 (MII = Co, Ni; btr = 4,4′-bis-1,2,4-triazole),152,196,197,236-238
[Zn1-xFex(bbtr)3](ClO4)2 (bbtr = 1,4-di(1,2,3-triazol-1-yl)-butane)166,198 and
[FexZn1-x(bapbpy)(NCS)2] (bapbpy = N6,N6′-di(pyridin-2-yl)-2,2′-bipyridine-6,6′-
diamine)168 reached similar conclusions as those from earlier work. It is interesting
especially in relation to this thesis that all work and measurements were made on the
bulk crystalline or powdered material, while none reported measurements on
deliberately mixed samples (not co-crystallised), which could have been used as a
control. Furthermore, no mention was made regarding the composition of individual
co-crystals or the homogeneity or lack thereof of the bulk sample. The compositions
of the materials in all of these studies were based on measurements taken from bulk
polycrystalline or powdered material using techniques such as elemental
microanalysis (C, H, N), X-ray fluorescence (XRF), powder X-ray diffraction
(PXRD) and atomic absorption spectroscopy (AAS).
Over the last five years co-crystallisation systems of [MA
xMB
1-x(bpp)2]X2 (MA and
MB are combinations of Mn
2+, Fe
2+, Co
2+ and Zn
2+; bpp = 2,6-bis(pyrazol-3-
yl)pyridine (shown in Figure 9); X = NCS-, NCSe
-, BF4
-) have been subjected to
numerous spin-state studies.153,162,164,193-195 Although some report single crystal SCO
measurements,162 the proportions of each metal complex in all of the reported diluted
systems were either elucidated using bulk measurement techniques such as lattice
dimension changes via PXRD or assumed to be the same as the ratio of the
complexes in the starting solution. In a related study concerning the system
[FexCo1-x(bpa)2](NCS)2 (bpa = 1,3-bis(4-pyridyl)propane), the authors note that the
metal-nitrogen bond lengths as measured via single crystal X-ray diffraction
(SCXRD) were approaching the lengths usually observed for the pure cobalt
compound, yet conclude that the diluted system has the same ratio of metal
complexes to that which was present in solution (x = 0.50).194

CHAPTER 1
20
Figure 9: 2,6-bis(pyrazol-3-yl)pyridine (bpp)
Co-crystallisation systems that involve [MII(terpy)2]
2+ and related complexes,
especially systems where different metal complexes are co-crystallised together are
of particular interest. Halcrow et al. were the first to report SCO co-crystallisation
systems that incorporated two different metal complexes to give the formula
[MII(1-bpp)2]x[M
II(terpy)2]1-x(BF4)2 (M
II = Fe, Co, Ru; 1-bpp = 2,6-bis(pyrazol-1-
yl)pyridine; terpy = 2,2′;6′,2′′-terpyridine) by exploiting the similarities between the
lattices of the pure structures that arise from similar π-intermolecular
interactions.61,62,153 Figure 10 shows the structures of the ligands used.
Figure 10: (left to right) 2,6-bis(pyrazol-1-yl)pyridine (1-bpp) and 2,2′;6′,2′′-terpyridine (terpy)
PXRD of the bulk polycrystalline material was used to ascertain information relating
to structure and crystallinity of these systems. The PXRD patterns of the
[Fe(1-bpp)2]x[Ru(terpy)2]1-x(BF4)2 system are reported to broaden significantly as the
ratio of complexes approaches 0.50. Furthermore, the authors note that as the fraction
of the ruthenium complex increases (as determined by microanalysis (C, H, N) on
polycrystalline material), the larger the diffraction peak associated with the pure
ruthenium complex, thus giving rise to samples that contain two phases. The authors
conclude that a single phase is present only in systems with a high proportions of the
[MII(1-bpp)2]
2+ complex.61,153
Also pertinent to the research presented within this thesis are co-crystallisation
systems containing [MIII
(ox)3]3-
complexes (ox = oxalate), especially in regards to
the methods used to quantify the ratio of metal complexes present in the crystalline
state. Metal dilution systems such as Mg[NaAlxMIII
1-x(ox)3] (MIII
= Ti, V, Cr, Mn, Fe,
Co),175-181,239-244 NBu4[MA
xMB
1-xMIII
(ox)3] (MA and M
B are combinations of Cr
2+,
Mn2+
, Fe2+
, Co2+
, Ni2+
and Zn2+
; MIII
= Cr, Fe),184,245-247 NBu4[MIIM
AxM
B1-x(ox)3] (M
II

CHAPTER 1
21
= Cr, Mn, Fe; MA and M
B are combinations of Al
3+, Cr
3+, Mn
3+ and Fe
3+),185-187,248-250
and [MA
xMB
1-x(L)3][NaMIII
(ox)3] (MA and M
B are combinations of Co
2+, Zn
2+, Ru
2+
and Os2+
; MIII
= Al, Cr, Rh) and [MII(L)3][NaM
AxM
B1-x(ox)3] (M
II = Co, Zn, Ru, Os;
MA and M
B are combinations of Al
3+, Cr
3+ and Rh
3+)64,65,182,192,251-253 have been
extensively studied for their photophysical and electronic properties as well as for
their magnetic susceptibility.
In an overwhelming majority of these studies involving [MIII
(ox)3]3-
, the
measurements including those for determining the ratio of metals in the solid are
reported only for the bulk polycrystalline or powdered material. Of those that report
the investigated phenomena for single crystals, the characterisation method used to
quantify the metal ratio (x) in the solid was either unclear or not mentioned,182,242,244
calculated from bulk measurements such as PXRD and ICP-MS,65 calculated for
single crystals but unclear if only one co-crystal or multiple co-crystals grown from
each solution was analysed,243,253 or assumed to be the same as that which was present
in the crystallising solution.239 Furthermore, no mention with regards to the
homogeneity of the bulk crystalline material is made. In a few cases the authors note
that the effective solid-state concentration was different from the initial concentration
present in solution, however no suggestions are given as to why this might
be.64,65,182,192,252-254
Specifically with regards to the research presented within this thesis, an important
milestone in the field of co-crystals was published in 2000 by MacDonald et al.74 In
this work, isomorphous salts of the formula (imidazolium)2[MII(dipic)2]·2H2O (dipic
= pyridine-2,6-dicarboxylate) metal complexes were co-crystallised in varying ratios
to give single co-crystals of (imidazolium)2[MA
xMB
1-x(dipic)2]·2H2O (MA and M
B
are combinations of Mn2+
, Co2+
, Ni2+
, Cu2+
, and Zn2+
). Analysis of these single co-
crystals was by AAS, inductively coupled plasma-mass spectrometry (ICP-MS), and
neutron diffraction. Results of these analyses indicated that the concentration of the
different metal complexes (associated with MA and M
B) in the single co-crystals was
directly dependant on the ratio of the complexes in the co-crystallising solution. For
example, co-crystals formed from a 0.50:0.50 mixture of
(imidazolium)2[MA(dipic)2]·2H2O and (imidazolium)2[M
B(dipic)2]·2H2O were

CHAPTER 1
22
found to have the formula (imidazolium)2[MA
0.50MB
0.50(dipic)2]·2H2O, whereas
co-crystals formed from solutions containing 0.80:0.20 of the same two complexes
were found to have the formula (imidazolium)2[MA
0.80MB
0.20(dipic)2]·2H2O.
Photographs of representative co-crystals grown from various co-crystallising
solutions are shown in Figure 11.
Figure 11: Photographs of (imidazolium)2[MA
xMB
1-x(dipic)2]·2H2O co-crystals with the metals and
their respective ratios given under each image.74
Ordinary XRD as a means of determining the order/disorder of the metals in the
crystal lattice was bypassed since it detects electron density and therefore cannot
easily distinguish between atoms such as nickel and cobalt. Neutron diffraction was
instead used and the authors concluded that it was most likely that the metals were
randomly disordered within the crystal lattice. Furthermore, these results indicated
that the rates of crystallisation of all the metal complexes involved were comparable,
as the concentrations in the crystalline state matched the solution concentrations.74 In
these co-crystals, the complexes interact via charge-assisted hydrogen bonds between
the carboxylic acid groups of the dipic ligands and the imidazolium cations. The
report published by the authors is a rare example in the literature in which
synthetically engineered single co-crystals have been specifically analysed to directly
determine the relative concentrations of the different molecular components and the
distribution of the metals in the crystal structure.
Taking advantage of the close structural match between the various types of pure
(imidazolium)2[MII(dipic)2]·2H2O compounds, the authors also report the formation
of epitaxial growth crystals where seed crystals of one type of metal complex were
immersed into solutions containing a different complex.74,255 Interestingly, the authors
20% Cu
80% Co
40% Cu
60% Zn
60% Cu
40% Mn40% Ni
60% Co
33% Ni
33% Co
33% Cu
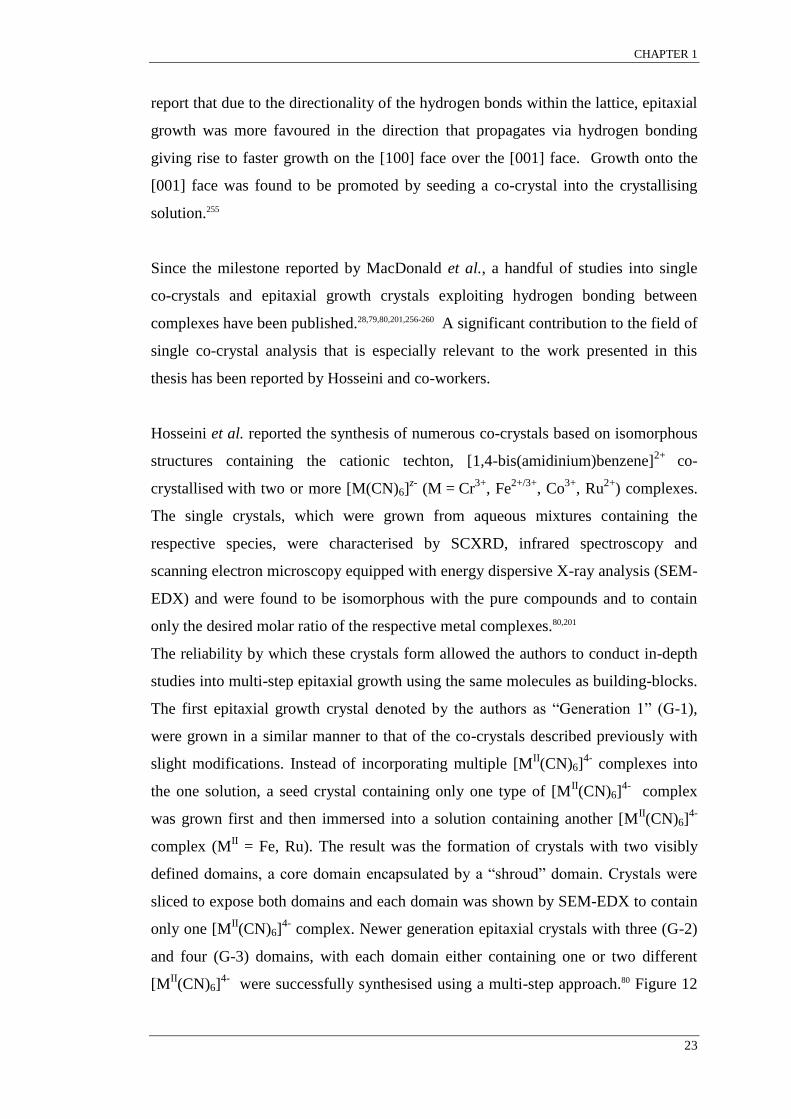
CHAPTER 1
23
report that due to the directionality of the hydrogen bonds within the lattice, epitaxial
growth was more favoured in the direction that propagates via hydrogen bonding
giving rise to faster growth on the [100] face over the [001] face. Growth onto the
[001] face was found to be promoted by seeding a co-crystal into the crystallising
solution.255
Since the milestone reported by MacDonald et al., a handful of studies into single
co-crystals and epitaxial growth crystals exploiting hydrogen bonding between
complexes have been published.28,79,80,201,256-260 A significant contribution to the field of
single co-crystal analysis that is especially relevant to the work presented in this
thesis has been reported by Hosseini and co-workers.
Hosseini et al. reported the synthesis of numerous co-crystals based on isomorphous
structures containing the cationic techton, [1,4-bis(amidinium)benzene]2+
co-
crystallised with two or more [M(CN)6]z- (M = Cr
3+, Fe
2+/3+, Co
3+, Ru
2+) complexes.
The single crystals, which were grown from aqueous mixtures containing the
respective species, were characterised by SCXRD, infrared spectroscopy and
scanning electron microscopy equipped with energy dispersive X-ray analysis (SEM-
EDX) and were found to be isomorphous with the pure compounds and to contain
only the desired molar ratio of the respective metal complexes.80,201
The reliability by which these crystals form allowed the authors to conduct in-depth
studies into multi-step epitaxial growth using the same molecules as building-blocks.
The first epitaxial growth crystal denoted by the authors as “Generation 1” (G-1),
were grown in a similar manner to that of the co-crystals described previously with
slight modifications. Instead of incorporating multiple [MII(CN)6]
4- complexes into
the one solution, a seed crystal containing only one type of [MII(CN)6]
4- complex
was grown first and then immersed into a solution containing another [MII(CN)6]
4-
complex (MII = Fe, Ru). The result was the formation of crystals with two visibly
defined domains, a core domain encapsulated by a “shroud” domain. Crystals were
sliced to expose both domains and each domain was shown by SEM-EDX to contain
only one [MII(CN)6]
4- complex. Newer generation epitaxial crystals with three (G-2)
and four (G-3) domains, with each domain either containing one or two different
[MII(CN)6]
4- were successfully synthesised using a multi-step approach.80 Figure 12
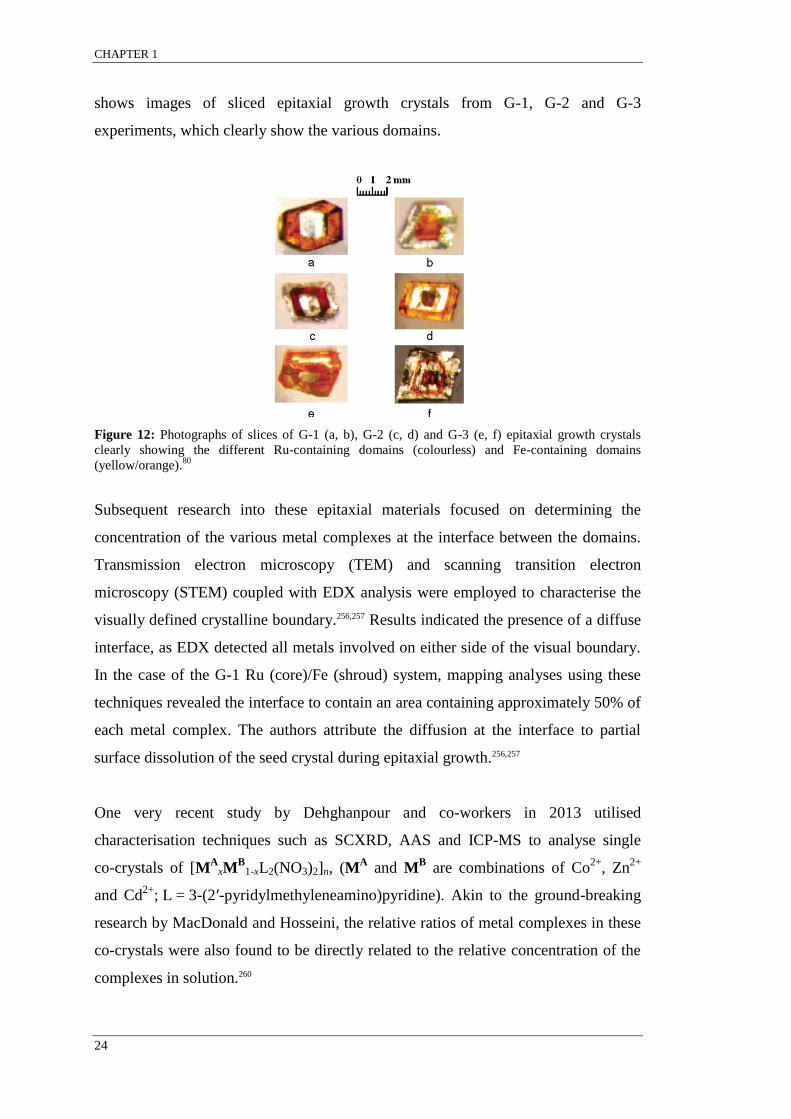
CHAPTER 1
24
shows images of sliced epitaxial growth crystals from G-1, G-2 and G-3
experiments, which clearly show the various domains.
Figure 12: Photographs of slices of G-1 (a, b), G-2 (c, d) and G-3 (e, f) epitaxial growth crystals
clearly showing the different Ru-containing domains (colourless) and Fe-containing domains
(yellow/orange).80
Subsequent research into these epitaxial materials focused on determining the
concentration of the various metal complexes at the interface between the domains.
Transmission electron microscopy (TEM) and scanning transition electron
microscopy (STEM) coupled with EDX analysis were employed to characterise the
visually defined crystalline boundary.256,257 Results indicated the presence of a diffuse
interface, as EDX detected all metals involved on either side of the visual boundary.
In the case of the G-1 Ru (core)/Fe (shroud) system, mapping analyses using these
techniques revealed the interface to contain an area containing approximately 50% of
each metal complex. The authors attribute the diffusion at the interface to partial
surface dissolution of the seed crystal during epitaxial growth.256,257
One very recent study by Dehghanpour and co-workers in 2013 utilised
characterisation techniques such as SCXRD, AAS and ICP-MS to analyse single
co-crystals of [MA
xMB
1-xL2(NO3)2]n, (MA and M
B are combinations of Co
2+, Zn
2+
and Cd2+
; L = 3-(2′-pyridylmethyleneamino)pyridine). Akin to the ground-breaking
research by MacDonald and Hosseini, the relative ratios of metal complexes in these
co-crystals were also found to be directly related to the relative concentration of the
complexes in solution.260
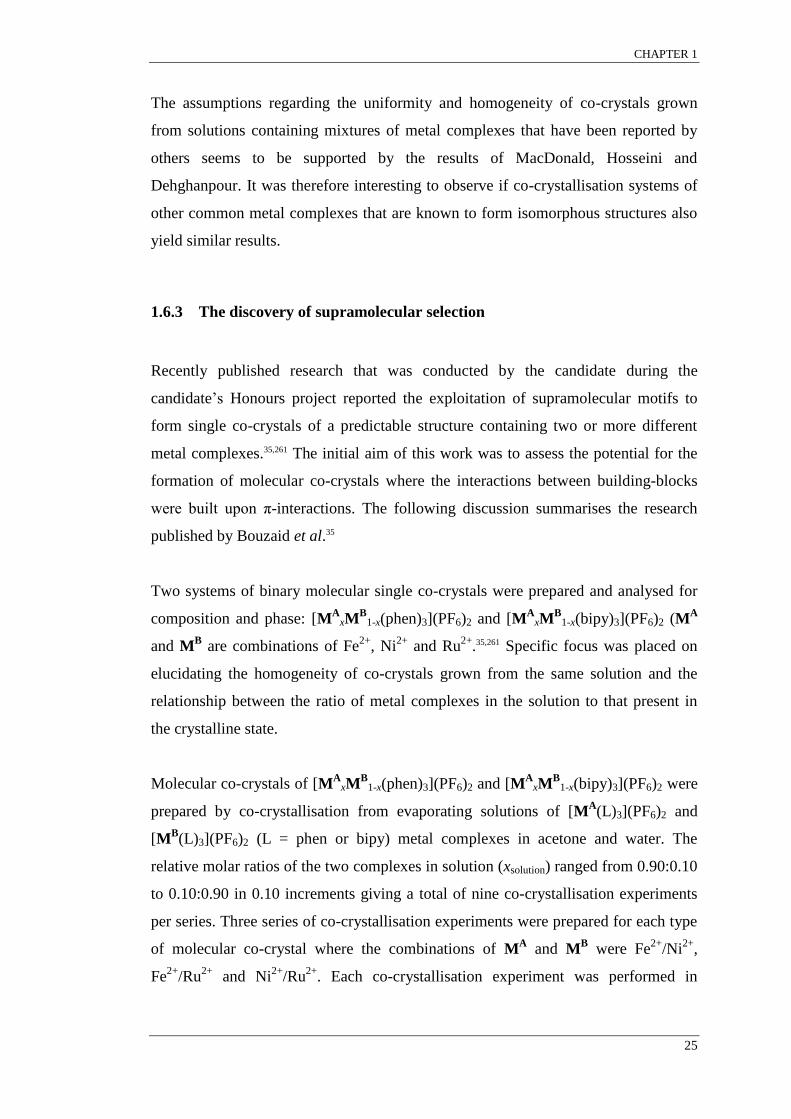
CHAPTER 1
25
The assumptions regarding the uniformity and homogeneity of co-crystals grown
from solutions containing mixtures of metal complexes that have been reported by
others seems to be supported by the results of MacDonald, Hosseini and
Dehghanpour. It was therefore interesting to observe if co-crystallisation systems of
other common metal complexes that are known to form isomorphous structures also
yield similar results.
1.6.3 The discovery of supramolecular selection
Recently published research that was conducted by the candidate during the
candidate’s Honours project reported the exploitation of supramolecular motifs to
form single co-crystals of a predictable structure containing two or more different
metal complexes.35,261 The initial aim of this work was to assess the potential for the
formation of molecular co-crystals where the interactions between building-blocks
were built upon π-interactions. The following discussion summarises the research
published by Bouzaid et al.35
Two systems of binary molecular single co-crystals were prepared and analysed for
composition and phase: [MA
xMB
1-x(phen)3](PF6)2 and [MA
xMB
1-x(bipy)3](PF6)2 (MA
and MB are combinations of Fe
2+, Ni
2+ and Ru
2+.35,261 Specific focus was placed on
elucidating the homogeneity of co-crystals grown from the same solution and the
relationship between the ratio of metal complexes in the solution to that present in
the crystalline state.
Molecular co-crystals of [MA
xMB
1-x(phen)3](PF6)2 and [MA
xMB
1-x(bipy)3](PF6)2 were
prepared by co-crystallisation from evaporating solutions of [MA(L)3](PF6)2 and
[MB(L)3](PF6)2 (L = phen or bipy) metal complexes in acetone and water. The
relative molar ratios of the two complexes in solution (xsolution) ranged from 0.90:0.10
to 0.10:0.90 in 0.10 increments giving a total of nine co-crystallisation experiments
per series. Three series of co-crystallisation experiments were prepared for each type
of molecular co-crystal where the combinations of MA and M
B were Fe
2+/Ni
2+,
Fe2+
/Ru2+
and Ni2+
/Ru2+
. Each co-crystallisation experiment was performed in
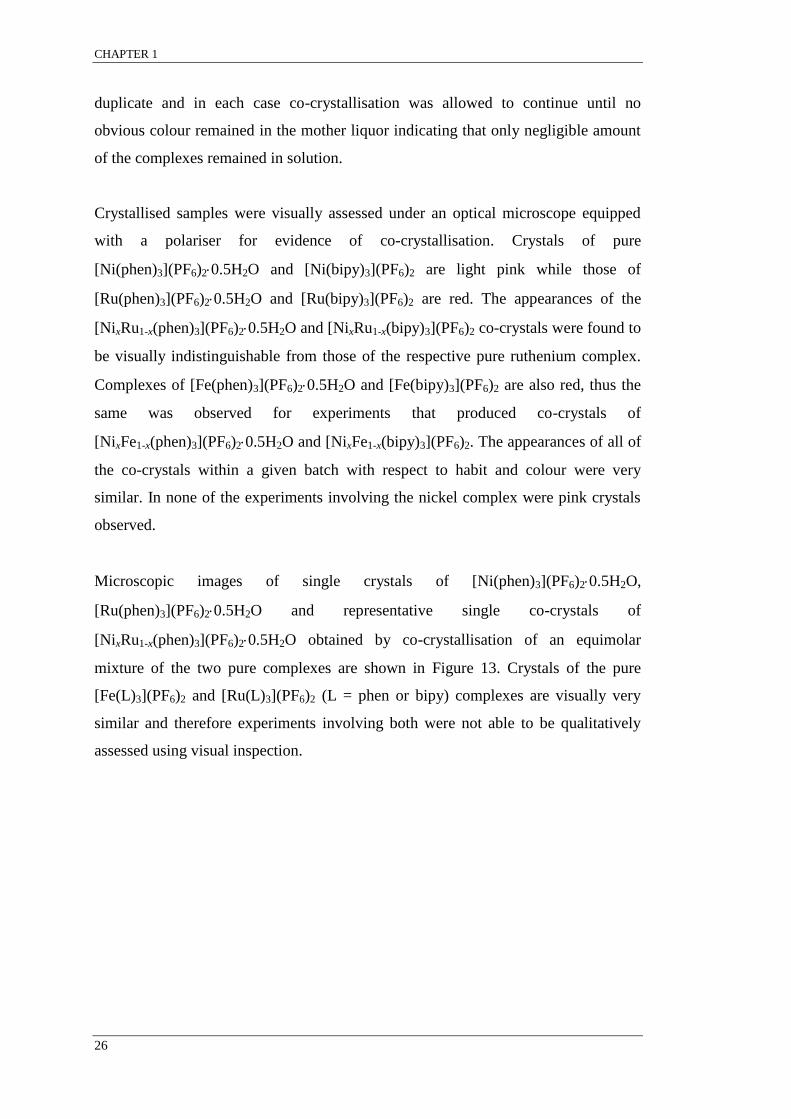
CHAPTER 1
26
duplicate and in each case co-crystallisation was allowed to continue until no
obvious colour remained in the mother liquor indicating that only negligible amount
of the complexes remained in solution.
Crystallised samples were visually assessed under an optical microscope equipped
with a polariser for evidence of co-crystallisation. Crystals of pure
[Ni(phen)3](PF6)20.5H2O and [Ni(bipy)3](PF6)2 are light pink while those of
[Ru(phen)3](PF6)20.5H2O and [Ru(bipy)3](PF6)2 are red. The appearances of the
[NixRu1-x(phen)3](PF6)20.5H2O and [NixRu1-x(bipy)3](PF6)2 co-crystals were found to
be visually indistinguishable from those of the respective pure ruthenium complex.
Complexes of [Fe(phen)3](PF6)20.5H2O and [Fe(bipy)3](PF6)2 are also red, thus the
same was observed for experiments that produced co-crystals of
[NixFe1-x(phen)3](PF6)20.5H2O and [NixFe1-x(bipy)3](PF6)2. The appearances of all of
the co-crystals within a given batch with respect to habit and colour were very
similar. In none of the experiments involving the nickel complex were pink crystals
observed.
Microscopic images of single crystals of [Ni(phen)3](PF6)20.5H2O,
[Ru(phen)3](PF6)20.5H2O and representative single co-crystals of
[NixRu1-x(phen)3](PF6)20.5H2O obtained by co-crystallisation of an equimolar
mixture of the two pure complexes are shown in Figure 13. Crystals of the pure
[Fe(L)3](PF6)2 and [Ru(L)3](PF6)2 (L = phen or bipy) complexes are visually very
similar and therefore experiments involving both were not able to be qualitatively
assessed using visual inspection.
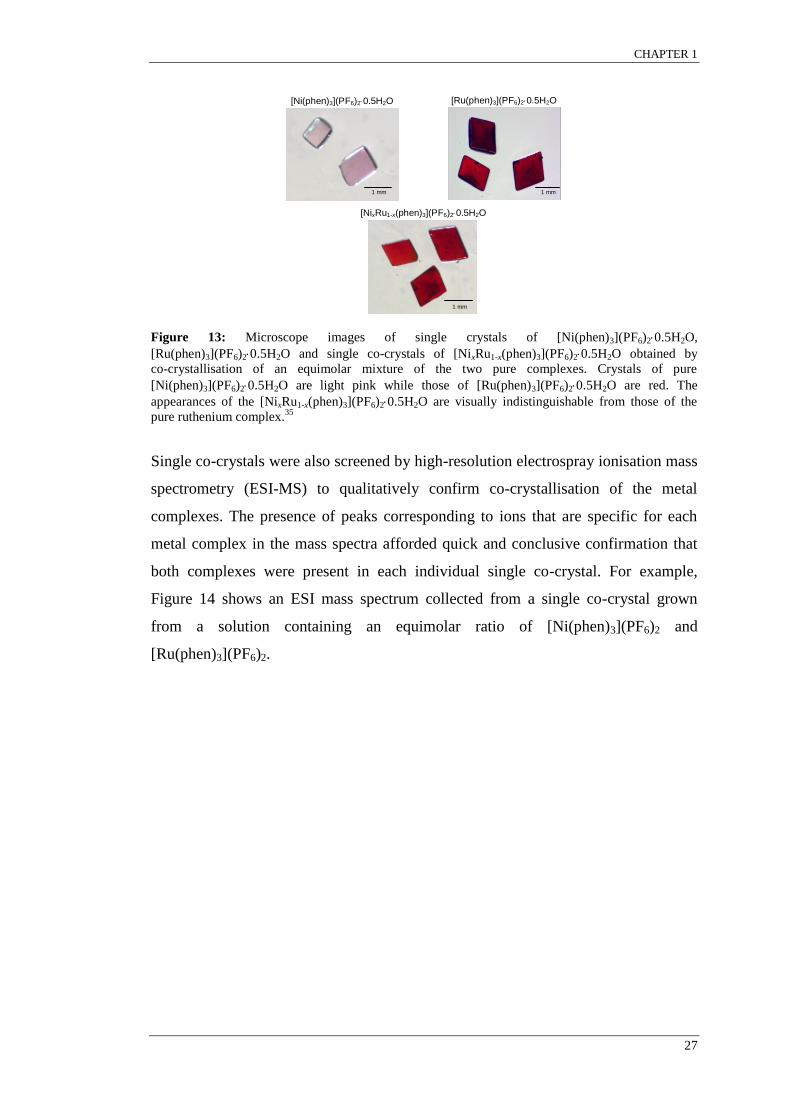
CHAPTER 1
27
Figure 13: Microscope images of single crystals of [Ni(phen)3](PF6)20.5H2O,
[Ru(phen)3](PF6)20.5H2O and single co-crystals of [NixRu1-x(phen)3](PF6)20.5H2O obtained by
co-crystallisation of an equimolar mixture of the two pure complexes. Crystals of pure
[Ni(phen)3](PF6)20.5H2O are light pink while those of [Ru(phen)3](PF6)20.5H2O are red. The
appearances of the [NixRu1-x(phen)3](PF6)20.5H2O are visually indistinguishable from those of the
pure ruthenium complex.35
Single co-crystals were also screened by high-resolution electrospray ionisation mass
spectrometry (ESI-MS) to qualitatively confirm co-crystallisation of the metal
complexes. The presence of peaks corresponding to ions that are specific for each
metal complex in the mass spectra afforded quick and conclusive confirmation that
both complexes were present in each individual single co-crystal. For example,
Figure 14 shows an ESI mass spectrum collected from a single co-crystal grown
from a solution containing an equimolar ratio of [Ni(phen)3](PF6)2 and
[Ru(phen)3](PF6)2.
[Ru(phen)3](PF6)20.5H2O
[NixRu1-x(phen)3](PF6)20.5H2O
[Ni(phen)3](PF6)20.5H2O
1 mm 1 mm
1 mm

CHAPTER 1
28
Figure 14: Representative ESI mass spectrum obtained for a single co-crystal produced from a
solution containing an equimolar mixture of [Ni(phen)3](PF6)2 and [Ru(phen)3](PF6)2. The spectrum
has peaks indicative of the presence of ions associated with each metal complex thus confirming that
both complexes were present in the single co-crystal.35
The spectrum in Figure 14 clearly shows the presence of peaks for m/z 299.0704
([Ni(phen)3]2+
), m/z 743.1057 ([Ni(phen)3] + PF6]+), m/z 321.0556 ([Ru(phen)3]
2+)
and m/z 787.0748 ([Ru(phen)3] + PF6]+). ESI-MS was used to screen at least three
crystals from each batch of co-crystallisation experiments, and in each case, the
co-crystals were found to contain both metal complexes, thus confirming
co-crystallisation.
Powder X-ray diffraction patterns of all the pure complexes as well as for the
co-crystals harvested from solutions which contained complexes in ratios of
0.80:0.20, 0.50:0.50 and 0.20:0.80 were collected for both the
[MA
xMB
1-x(phen)3](PF6)20.5H2O and [MA
xMB
1-x(bipy)3](PF6)2 systems. The PXRD
patterns for both systems are shown in Figure 15.
+ESI Scan (0.247-0.827 min, 37 scans) Frag=120.0V [Ni0.5Ru0.5(phen)3(PF6)2.d Subtract
0
2
4
6
8
742 746 750 754 758 762 766 770 774 778 782 786 790
Counts (%) vs. Mass-to-Charge (m/z)
Counts (%) vs. Mass-to-Charge (m/z)
300 340 380 420 460 500 540 580 620 660 700 740 780
299.0704
321.0556 743.1057
787.0748
743.1057
787.0748
[Ni(phen)3](PF6)+
[Ru(phen)3](PF6)+
1 x10
0
1
2
3
4
1 x10

CHAPTER 1
29
Figure 15: Powder XRD patterns of respective pure [Fe(L)3](PF6)2 (red), [Ru(L)3](PF6)2 (blue), and
[Ni(L)3](PF6)2 (green) interspersed with the PXRD patterns for respective co-crystals obtained from
solutions containing 80:20, 50:50, and 20:80 molar ratios of the metal complexes. The
[MA
xMB
1-x(phen)3](PF6)20.5H2O system is shown on the left, while the [MA
xMB
1-x(bipy)3](PF6)2
system is shown on the right.35
The PXRD patterns of the co-crystals were found to match the patterns of the pure
compounds. The experimental powder patterns were also found to match the patterns
simulated from experimental SCXRD data collected from the pure nickel and
ruthenium complexes as well as patterns simulated from SCXRD data collected from
co-crystals grown from solutions that contained equimolar ratios of complexes. The
similarities between the experimental powder patterns within each respective system
and with those simulated from experimental SCXRD data indicated that the co-
crystals were isomorphous with the pure samples and were of a single phase.
As the products of the co-crystallisation experiments were confirmed to be
co-crystals, elemental analysis of single co-crystals was obtained using SEM-EDX to
quantify the ratio of metal complexes present. At least three co-crystals from each
batch were analysed to determine if any variation (with respect to the ratios of metal
complexes) was present in co-crystals harvested from the same solution. In addition,
each co-crystal analysed was measured in three different locations to test for any
600.00
10600.00
20600.00
30600.00
40600.00
50600.00
60600.00
9 10 11 12 13 14 15 16 17 18 19 20 21 22 23 24
Powder XRD of [M(bipy)3](PF6)2 system
Co
unts
9 10 11 12 13 14 15 16 17 18 19 20 21 22 23 24
Position ( 2θ)
10
0 002 10
2
2-1
0
2-1
1
200
004
20-2
[Fe(bipy)3](PF6)2
[Ru(bipy)3](PF6)2
[Ni(bipy)3](PF6)2
[Fe(bipy)3](PF6)2
0.80Fe:0.20Ru
0.50Fe:0.50Ru
0.20Ni:0.80Ru
0.50Ni:0.50Ru
0.20Fe:0.80Ru
0.80Ni:0.20Ru
0.20Fe:0.80Ni
0.50Fe:0.50Ni
0.80Fe:0.20Ni
0.00
10000.00
20000.00
30000.00
40000.00
50000.00
60000.00
70000.00
8 9 10 11 12 13 14 15 16 17 18 19 20 21 22 23 24
Powder XRD of [M(phen)3](PF6)2 system
Co
unts
8 9 10 11 12 13 14 15 16 17 18 19 20 21 22 23 24
Position ( 2θ)
11
-1
51-1
80
0
62
-2
42-1
11
2 60
2420
13-131
1
[Fe(phen)3](PF6)2
[Ru(phen)3](PF6)2
[Ni(phen)3](PF6)2
[Fe(phen)3](PF6)2
0.80Fe:0.20Ru
0.50Fe:0.50Ru
0.20Ni:0.80Ru
0.50Ni:0.50Ru
0.20Fe:0.80Ru
0.80Ni:0.20Ru
0.20Fe:0.80Ni
0.50Fe:0.50Ni
0.80Fe:0.20Ni
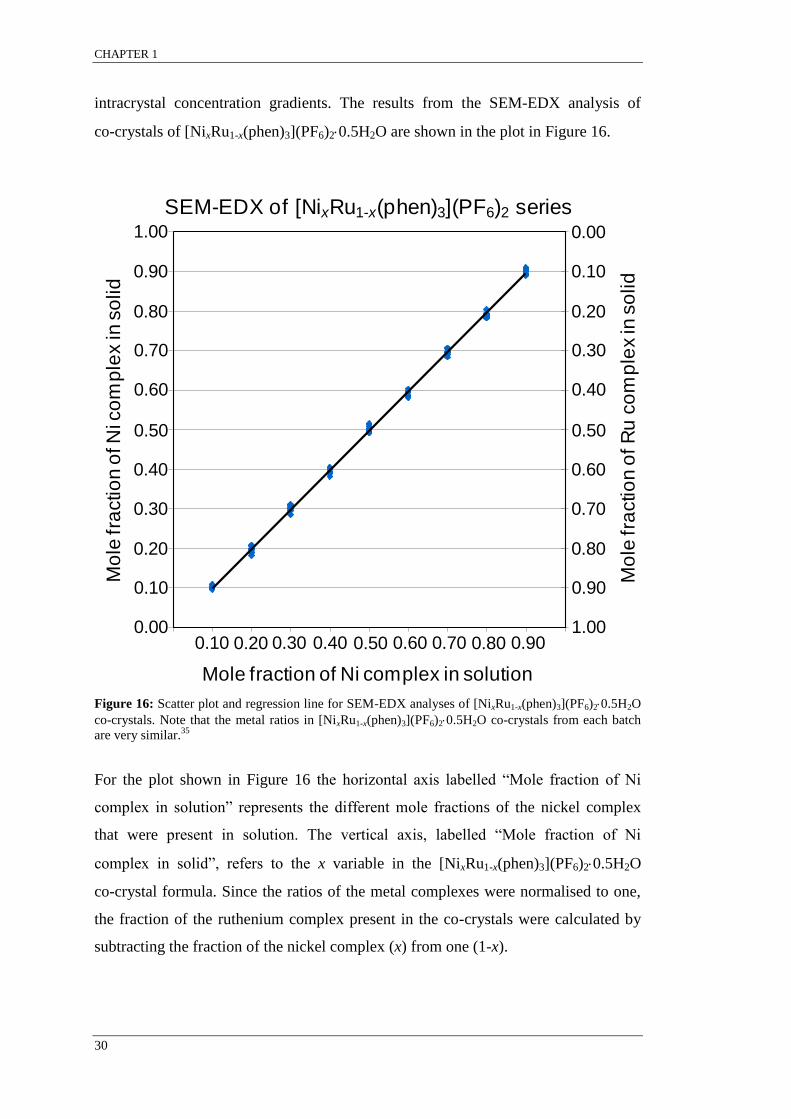
CHAPTER 1
30
intracrystal concentration gradients. The results from the SEM-EDX analysis of
co-crystals of [NixRu1-x(phen)3](PF6)20.5H2O are shown in the plot in Figure 16.
Figure 16: Scatter plot and regression line for SEM-EDX analyses of [NixRu1-x(phen)3](PF6)20.5H2O
co-crystals. Note that the metal ratios in [NixRu1-x(phen)3](PF6)20.5H2O co-crystals from each batch
are very similar.35
For the plot shown in Figure 16 the horizontal axis labelled “Mole fraction of Ni
complex in solution” represents the different mole fractions of the nickel complex
that were present in solution. The vertical axis, labelled “Mole fraction of Ni
complex in solid”, refers to the x variable in the [NixRu1-x(phen)3](PF6)20.5H2O
co-crystal formula. Since the ratios of the metal complexes were normalised to one,
the fraction of the ruthenium complex present in the co-crystals were calculated by
subtracting the fraction of the nickel complex (x) from one (1-x).
0.00
0.10
0.20
0.30
0.40
0.50
0.60
0.70
0.80
0.90
1.00
0.00 0.10 0.20 0.30 0.40 0.50 0.60 0.70 0.80 0.90 1.00
0.00
0.10
0.20
0.30
0.40
0.50
0.60
0.70
0.80
0.90
1.00
SEM-EDX of [NixRu1-x(phen)3](PF6)2 series
Mole fraction of Ni complex in solution
Mo
le fra
ctio
n o
f N
i co
mp
lex
in s
olid
Mo
le fra
ctio
n o
f R
uco
mp
lex
in s
olid
0.00
0.10
0.20
0.30
0.40
0.50
0.60
0.70
0.80
0.90
1.00
1.00
0.90
0.80
0.70
0.60
0.50
0.40
0.30
0.20
0.10
0.00
0.10 0.20 0.30 0.40 0.50 0.60 0.70 0.80 0.90
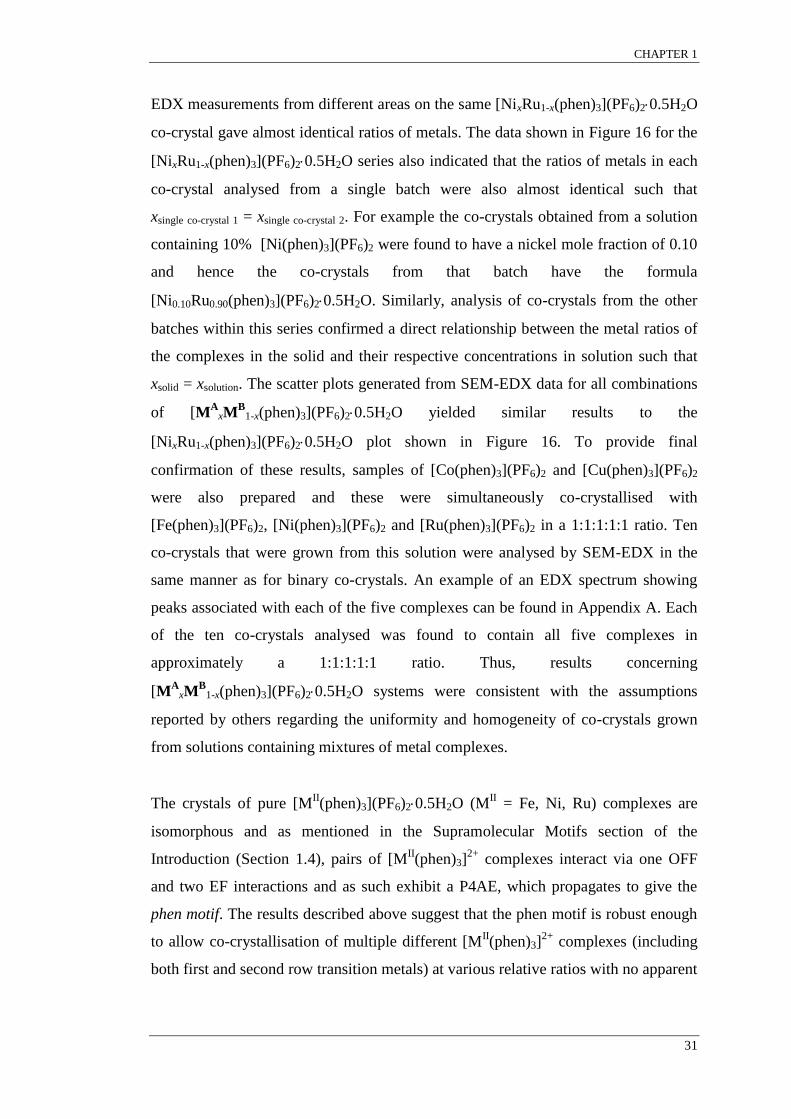
CHAPTER 1
31
EDX measurements from different areas on the same [NixRu1-x(phen)3](PF6)20.5H2O
co-crystal gave almost identical ratios of metals. The data shown in Figure 16 for the
[NixRu1-x(phen)3](PF6)20.5H2O series also indicated that the ratios of metals in each
co-crystal analysed from a single batch were also almost identical such that
xsingle co-crystal 1 = xsingle co-crystal 2. For example the co-crystals obtained from a solution
containing 10% [Ni(phen)3](PF6)2 were found to have a nickel mole fraction of 0.10
and hence the co-crystals from that batch have the formula
[Ni0.10Ru0.90(phen)3](PF6)20.5H2O. Similarly, analysis of co-crystals from the other
batches within this series confirmed a direct relationship between the metal ratios of
the complexes in the solid and their respective concentrations in solution such that
xsolid = xsolution. The scatter plots generated from SEM-EDX data for all combinations
of [MA
xMB
1-x(phen)3](PF6)20.5H2O yielded similar results to the
[NixRu1-x(phen)3](PF6)20.5H2O plot shown in Figure 16. To provide final
confirmation of these results, samples of [Co(phen)3](PF6)2 and [Cu(phen)3](PF6)2
were also prepared and these were simultaneously co-crystallised with
[Fe(phen)3](PF6)2, [Ni(phen)3](PF6)2 and [Ru(phen)3](PF6)2 in a 1:1:1:1:1 ratio. Ten
co-crystals that were grown from this solution were analysed by SEM-EDX in the
same manner as for binary co-crystals. An example of an EDX spectrum showing
peaks associated with each of the five complexes can be found in Appendix A. Each
of the ten co-crystals analysed was found to contain all five complexes in
approximately a 1:1:1:1:1 ratio. Thus, results concerning
[MA
xMB
1-x(phen)3](PF6)20.5H2O systems were consistent with the assumptions
reported by others regarding the uniformity and homogeneity of co-crystals grown
from solutions containing mixtures of metal complexes.
The crystals of pure [MII(phen)3](PF6)20.5H2O (M
II = Fe, Ni, Ru) complexes are
isomorphous and as mentioned in the Supramolecular Motifs section of the
Introduction (Section 1.4), pairs of [MII(phen)3]
2+ complexes interact via one OFF
and two EF interactions and as such exhibit a P4AE, which propagates to give the
phen motif. The results described above suggest that the phen motif is robust enough
to allow co-crystallisation of multiple different [MII(phen)3]
2+ complexes (including
both first and second row transition metals) at various relative ratios with no apparent
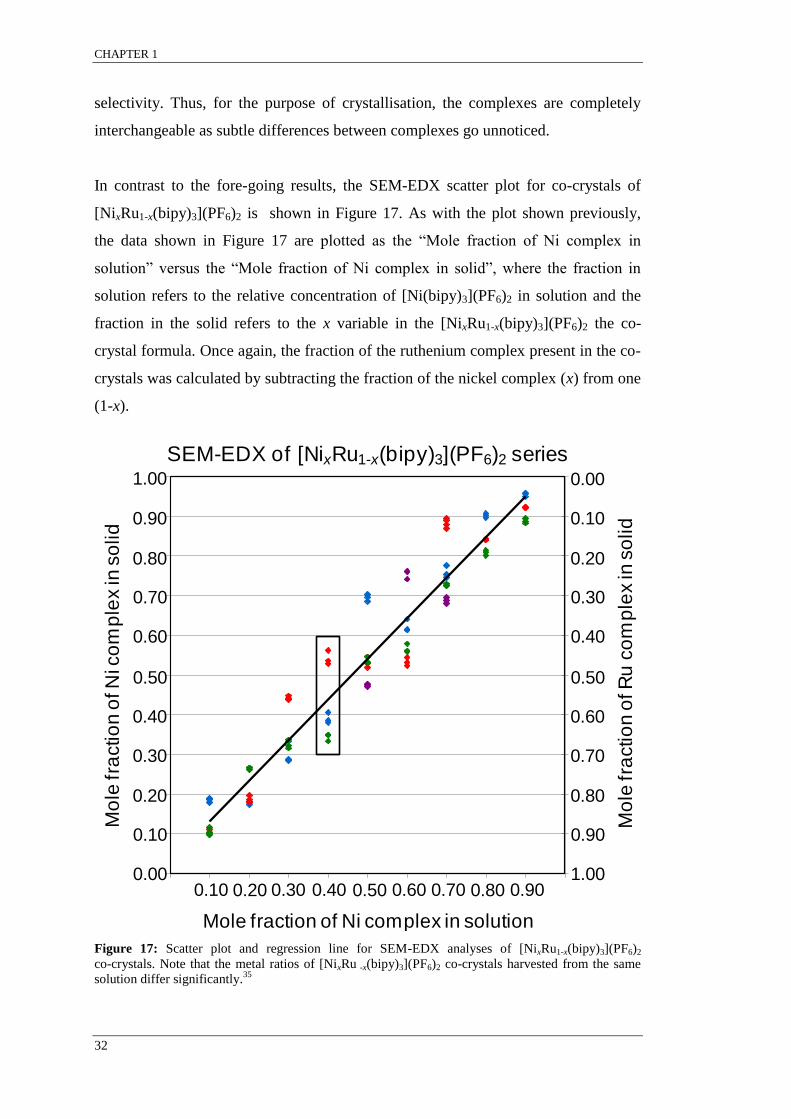
CHAPTER 1
32
selectivity. Thus, for the purpose of crystallisation, the complexes are completely
interchangeable as subtle differences between complexes go unnoticed.
In contrast to the fore-going results, the SEM-EDX scatter plot for co-crystals of
[NixRu1-x(bipy)3](PF6)2 is shown in Figure 17. As with the plot shown previously,
the data shown in Figure 17 are plotted as the “Mole fraction of Ni complex in
solution” versus the “Mole fraction of Ni complex in solid”, where the fraction in
solution refers to the relative concentration of [Ni(bipy)3](PF6)2 in solution and the
fraction in the solid refers to the x variable in the [NixRu1-x(bipy)3](PF6)2 the co-
crystal formula. Once again, the fraction of the ruthenium complex present in the co-
crystals was calculated by subtracting the fraction of the nickel complex (x) from one
(1-x).
Figure 17: Scatter plot and regression line for SEM-EDX analyses of [NixRu1-x(bipy)3](PF6)2
co-crystals. Note that the metal ratios of [NixRu -x(bipy)3](PF6)2 co-crystals harvested from the same
solution differ significantly.35
0.00
0.10
0.20
0.30
0.40
0.50
0.60
0.70
0.80
0.90
1.00
0.00 0.10 0.20 0.30 0.40 0.50 0.60 0.70 0.80 0.90 1.00
0
0.1
0.2
0.3
0.4
0.5
0.6
0.7
0.8
0.9
1
SEM-EDX of [NixRu1-x(bipy)3](PF6)2 series
Mole fraction of Ni complex in solution
Mo
le fra
ctio
n o
f N
i co
mp
lex
in s
olid
Mo
le fra
ctio
n o
f R
u c
om
ple
xin
so
lid
0.00
0.10
0.20
0.30
0.40
0.50
0.60
0.70
0.80
0.90
1.00
1.00
0.90
0.80
0.70
0.60
0.50
0.40
0.30
0.20
0.10
0.00
0.10 0.20 0.30 0.40 0.50 0.60 0.70 0.80 0.90

CHAPTER 1
33
The data in Figure 17 are colour-coded. It is important to note that data points of the
same colour within any given batch represent measurements obtained from a single
co-crystal. For example, three co-crystals were analysed from the batch that
contained 40% [Ni(bipy)3](PF6)2 in solution. The data points corresponding to these
measurements are enclosed in the black box. The red markers within this box were
obtained from a different co-crystal to the points in blue or green (within the box) but
that all co-crystals were harvested from the same solution. The colour coding only
applies to individual batches and not to the entire series. There is no relationship
between the colour codes used for crystals from different co-crystallisation batches.
The data plotted in Figure 17 look very different to the plot obtained for the
[NixRu1-x(phen)3](PF6)20.5H2O series (Figure 16). The SEM-EDX data of
[NixRu1-x(bipy)3](PF6)2 co-crystals illustrated that measurements made from the same
co-crystal were very similar (within 2%), but that measurements obtained from
different co-crystals grown from the same solution were very different to each other
(such that xsingle co-crystal 1 ≠ xsingle co-crystal 2) and different to the ratio present in solution:
i.e. xsolution ≠ xsolid. The scatter plots generated from SEM-EDX data for all other
combinations of [MA
xMB
1-x(bipy)3](PF6)2 (MA, M
B = Fe, Ni, Ru) yielded similar
results to those shown in Figure 17.
The crystals of pure [MII(bipy)3](PF6)2 (M
II = Fe, Ni, Ru) complexes are
isomorphous and as mentioned in the Supramolecular Motifs section of the
Introduction (Section 1.4), pairs of [MII(bipy)3]
2+ complexes interact via six EF
interactions and as such exhibit a 6AE, which propagates to give the bipy motif.
Results from these systems suggested that for the purposes of crystallisation,
molecules of different [MII(bipy)3]
2+ complexes are similar enough to co-crystallise
but not similar enough that they are completely interchangeable in the crystal
packing motif.
To explain these unprecedented results the term supramolecular selection was
introduced, which applies to the co-crystallisation of two molecules (A and B), that
are chemically and structurally very similar. When A and B are co-crystallising from
the same solution, like molecules organise through supramolecular interactions.

CHAPTER 1
34
Interactions of the type A···A and B···B are slightly more favourable than A···B.
Consequently, some crystals will nucleate with a higher concentration of A
compared to B (and vice versa) relative to the initial A:B ratio in solution.
Propagation of crystal growth is then influenced by the ratio of A to B present in the
crystal. Crystals richer in A will preferentially select for A over B (through
molecular recognition), while those that nucleated with a higher proportion of B will
continue to prefer B during co-crystallisation. For both occurrences, the selection
process is not exclusive but preferential. Therefore it is possible to yield co-crystals
from a solution that contained an equimolar ratio of A and B, where some co-crystals
have a higher proportion of A and others have a higher proportion of B.
It is therefore very interesting that [MII(bipy)3]
2+ complexes displayed
supramolecular selection while the [MII(phen)3]
2+ complexes showed no
supramolecular selection, given that both types of complexes are outwardly very
similar (albeit 2,2′-bipyridine ligands are less rigid and slightly smaller than
1,10-phenthroline ligands), engage in similar intermolecular interactions and have
the same molecular symmetry (D3). Therefore, co-crystallisation of similar molecules
does not, as previously assumed, necessarily result in the formation of co-crystals
with the same homogeneous distribution of composition. This is significant
revelation, as any measurement performed on bulk samples would only show the
average results for the range of co-crystals and their compositional variations.
Therefore, it is of high importance that future research concerning the formation of
co-crystals includes experiments to determine the relative homogeneity of single
co-crystals, prior to drawing conclusions regarding the properties of bulk
co-crystalline samples. The work presented within this thesis can be considered as a
significant broadening and deepening of the research discussed in this section.

CHAPTER 2
35
CHAPTER 2: Project objectives
2.1 Overall research objectives
The overall objective for this research was to examine co-crystal formation for a
range of different metal complexes. The premise behind this research was to engineer
new crystalline materials with potentially tunable properties. The synthesis of these
novel co-crystalline materials involved the exploitation of known supramolecular
motifs and architectures to incorporate known amounts of different metal complexes
into single co-crystals. Of interest were: the syntheses of co-crystalline materials that
form molecular structures that propagate through the 2D terpy embrace motif; and
those that form framework structures through the polymerisation of [MIII
(ox)3]3-
building-blocks. For example, many of the experiments involved the
co-crystallisation of complexes that form non-isomorphous structures in their pure
form. These types of experiments provide a methodology for potentially tuning the
co-crystalline phase based on the initial concentration of metal complexes in solution
i.e. observe if, and at what concentration, one phase is preferred over the other.
The experiment design and aims of this research were multifaceted; however, for
each system investigated, the objective was to gain a deeper understanding of crystal
engineering and molecular recognition. Specific focus was placed on factors that
may affect the ability of metal complexes to engage in molecular recognition for like
complexes, such as ligand type and size, mode of intermolecular interaction and
whether the complexes form discrete or polymeric structures. These and other
factors, and their hypothesised consequent effect on the co-crystallisation process,
were to be investigated through various binary homoleptic and different ligand
experiments.* By conducting these experiments, it was hoped a better understanding
of the limits of co-crystallisation were to be gained. The following subsections
outline the more specific research aims for each type of co-crystallisation system that
were investigated.
* See footnote on page 76 for clarification regarding the terms homoleptic and different ligand.
CHAPTER 2
36
2.2 Molecular co-crystalline materials
During this research several co-crystallisation experiments involving [MII(terpyR)2]
2+
complexes were performed. The degree of supramolecular selection for each
co-crystallisation experiment was investigated by incrementally introducing various
differences between the metal complexes that were to be co-crystallised. The extent
of supramolecular selection was inferred by examining the degree of compositional
variation among resulting co-crystals harvested from the same solution. Co-crystals
were to be characterised using techniques such as SEM-EDX, SCXRD and PXRD. A
measure of the robustness of a supramolecular motif was how much it could
withstand disruption. Overall, the experiments that were performed during this
research aimed to study the ability of the terpy motif to endure various degrees of
lattice disruption. A detailed introduction into the terpy motif is provided in the
Results and Discussion chapter for these experiments (Section 4.1). It was postulated
that complexes with greater differences would more readily engage in molecular
recognition for like complexes and hence display more supramolecular selection.
The first set of experiments that were performed were homoleptic co-crystallisations,
where [MII(terpy)2](PF6)2 complexes were co-crystallised with [Ru(terpy)2](PF6)2, to
form co-crystals of the general formula [MII
xRu1-x(terpy)2](PF6)2 (MII = Fe, Co, Ni,
Cu). Complexes involved are chemically different but geometrically almost
indistinguishable from one another. This set of experiments was therefore designed
to test the effects of minor differences between complexes on the co-crystallisation
process.
Several co-crystals with the general formula [MII(terpyOH)2]x[Ru(terpy)2]1-x(BF4)2
(MII = Fe, Ni, Cu) were prepared through different ligand co-crystallisation
experiments, where [MII(terpyOH)2](BF4)2 complexes were co-crystallised with
[Ru(terpy)2](BF4)2. Each experiment combination involved complexes that are
chemically and structurally different (i.e. different metal centres and ligands) but
similar enough to form very similar 2D terpy embrace motifs. These experiments
were designed to test the effects of moderate differences between complexes, which
are able to form the same motif on co-crystallisation.

CHAPTER 2
37
In addition to these experiments, a co-crystallisation experiment where
[Ru(terpy)2](BF4)2 was co-crystallised with [CoIII
(terpyO)(terpyOH)](BF4)2 was
prepared. Unlike [MII(terpyOH)2](BF4)2 metal complexes, which interact through π-
interactions to yield the 2D terpy motif, [CoIII
(terpyO)(terpyOH)](BF4)2 complexes
predominately interact through hydrogen bonds (no π-interactions between
complexes) to form a hydrogen bond motif. This experiment was designed to test
whether co-crystallisation would force [CoIII
(terpyO)(terpyOH)]2+
into a non
hydrogen bonding lattice or [Ru(terpy)2]2+
complexes (which cannot form hydrogen
bonds) into the hydrogen bond motif.
Another set of different ligand experiments that were performed involved the
co-crystallisation of [MII(terpyPh)2](PF6)2 complexes (M
II = Fe, Ni, Cu) with
[Ru(terpy)2](PF6)2 complexes. The phenyl ring on the 4′-carbon atom of the terpyPh
ligand is much larger than the hydroxyl group and this has been shown to disrupt the
2D terpy motif. Nevertheless, [MII(terpyPh)2]
2+ complex pairs interact through a
similar terpy embrace consisting of one OFF and two EF π-interactions. These
experiments were designed to test the effects of larger differences between
complexes, which are capable of interacting through the same set of π-interactions on
co-crystallisation.
The final set of experiments in this section involved the co-crystallisation of
[Ru(terpyR)2](PF6)2 (terpyR = terpy, terpyPh) with either [Ni(phen)2](PF6)2 or
[Ni(bipy)2](PF6)2. The main difference between [MII(terpy)2]
2+ and [Ni(L)3]
2+
complexes (L = phen, bipy) is that [MII(terpy)2]
2+ complexes have S4 point
symmetry, while [Ni(L)3]2+
have D3 point symmetry. Regardless of the structural
differences, all of the complexes involved in these experiments are of a similar size
and form structures by engaging in some combination of OFF and/or EF interactions,
albeit forming different motifs. Complexes involved in each co-crystallisation are
chemically and structurally different, form different motifs in their pure form but are
hypothetically capable of interacting through a compatible set of π-interactions.
These experiments tested the effects of pronounced differences between complexes
on the co-crystallisation process. It was also of interest to observe which if any motif
dominates in the co-crystalline phase.

CHAPTER 2
38
2.3 Metal-organic framework co-crystalline materials
The experiment design for this research component focused on the synthesis of
polymeric metal-organic frameworks. During this research a variety of
co-crystallisation and epitaxial experiments involving the [MIII
(ox)3]3-
metal complex
building-block were performed. These experiments were designed to test if the
enhanced electronic communication between metal centres afforded by the bridging
nature and negative charge of the oxalato ligand resulted in greater supramolecular
selection. A detailed introduction into the frameworks containing the [MIII
(ox)3]3-
building-block is provided in the Results and Discussion chapter for these
experiments (Section 5.1.1). As with the co-crystals resulting from the molecular
systems, the extent of supramolecular selection was inferred by examining the degree
of compositional variation among co-crystals that were collected from the same
solution. Co-crystals that formed were to be characterised using techniques such as
SEM-EDX, SCXRD, PXRD and Raman spectroscopic mapping.
The first set of experiments that were conducted are described as homoleptic anionic
metal dilutions. These experiments involved the co-crystallisation of two different
K3[MIII
(ox)3]·xH2O complexes (MIII
= Mn, Cr, Fe, Ru and Rh) to form co-crystals of
the general formula K3[MA
xMB
1-x(ox)3]·xH2O. Extensions of these experiments using
epitaxial crystallisation methods were also performed. These epitaxial crystallisation
experiments involved the immersion of single crystal seeds of the formula
[MIII
(ox)3]·2.5H2O (MIII
= Cr, Fe) into saturated solutions of K3[MIII
(ox)3](aq/EtOH)
(MIII
= Cr, Fe or a 1:1 mixture). Crystals containing K3[Cr(ox)3]·2.5H2O complexes
are usually very dark green/blue while those containing K3[Fe(ox)3]·2.5H2O
complexes are bright green. Analyses of the differences in colour between the seed
and epitaxial domains were designed to aid the understanding of the crystal growth
patterns of K3[MA
xMB
1-x(ox)3]·xH2O that were grown by the co-crystallisation of two
different K3[MIII
(ox)3]·xH2O complexes.
It was also of interest to observe the growth patterns in experiments that involved the
simultaneous immersion of K3[Cr(ox)3]·2.5H2O and K3[Fe(ox)3]·2.5H2O seeds into
solutions of either K3[Cr(ox)3](aq/EtOH) or K3[Fe(ox)3](aq/EtOH). Experiments where pure
K3[Fe(ox)3]·2.5H2O seed crystals were placed in a saturated solution containing an
CHAPTER 2
39
equimolar ratio of both complexes were also of particular interest. These experiments
were designed to test the selection process in systems that contain competing metal
complexes. Overall, all of these epitaxial experiments aimed to provide a better
understanding of the mechanisms driving the formation of K3[MA
xMB
1-x(ox)3]·xH2O
co-crystals.
A total of six experiments that involved the co-crystallisation of [MIII
(ox)3]3-
(MIII
= Cr, Fe) with [MII(L)3]
2+ (M
II = Ni, Ru and L = bipy, phen) in the presence of
Na+ were also prepared. Four of these co-crystallisation experiments aimed to form
co-crystals of the formula [NixRu1-x(L)3][NaCr(ox)3] and [Ru(L)3][NaFexCr1-x(ox)3]
(L = phen or bipy). The remaining two experiments that were prepared aimed to
form co-crystals of the general formula [MA(bipy)3]x[M
B(phen)3]1-x[NaCr(ox)3] (M
A,
MB = Ni, Ru or vice versa). Experiments that involved the dilution of the [M
II(L)3]
2+
site were designed to test the supramolecular selection in systems where the cationic
complexes do not engage in intermolecular interactions with each other.

CHAPTER 3
40
CHAPTER 3: Preparative experimental details and
methodology
3.1 Materials
The starting materials 2,2′:6′,2′′-terpyridine (terpy),
2,6-bis(2-pyridyl)-4(1H)-pyridone (terpyOH), 1,10-phenanthroline (phen),
2,2′-bipyridine (bipy), lithium chloride (LiCl), sodium tetrafluoroborate (NaBF4),
potassium hexafluorophosphate (KPF6), potassium permanganate (KMnO4),
potassium dichromate (K2Cr2O7) and silver nitrate (AgNO3) were purchased from
Sigma Aldrich with 98% or higher stated purity and used without any further
purification. Iron (II) chloride tetrahydrate (FeCl2·4H2O), iron (III) chloride
hexahydrate (FeCl3·6H2O), cobalt (II) chloride hexahydrate (CoCl2·6H2O), nickel (II)
chloride hexahydrate (NiCl2·6H2O), copper (II) chloride dihydrate (CuCl2·2H2O),
oxalic acid hydrate (H2C2O4·H2O), potassium oxalate dihydrate (K2C2O4·2H2O),
potassium carbonate (K2CO3) and potassium hydroxide (KOH) were of reagent grade
quality and were purchased from Banksia Scientific. RuCl3·xH2O (x ≈ 3.5) was
purchased from Precious Metals Online and had a stated purity of 99%. RhCl3·xH2O
(x ≈ 3) was kindly provided by Associate Professor Dennis Arnold. All solvents were
of reagent grade quality and used as supplied by the manufacturers.
3.2 Characterisation techniques
3.2.1 Scanning electron microscopy-energy dispersive X-ray analysis
(SEM-EDX)
Samples were prepared in one of the following ways:
More stable samples were mounted on aluminium stubs using double sided carbon
tape as they did not crumble under the vacuum atmosphere of the SEM. Co-crystals
of the general formula K3(MA
xMB
1-x(ox)3]·xH2O were initially prepared using the
carbon tape method but were found to deteriorate rapidly into a powder once under
vacuum in the SEM. Instead, these samples were first embedded in a putty adhesive
CHAPTER 3
41
to minimise the surface area exposed and thus give the single crystal more structural
support. All co-crystals regardless of the mounting method were then coated with a
thin layer of evaporated carbon to enhance surface conductivity and reduce charging.
Energy-Dispersive X-ray (EDX) analysis was conducted on a JEOL 840A analytical
scanning electron microscope (SEM) integrated with a JEOL 2300 micro-analyser.
Accelerating voltage was set at 20 kV. The electron beam current was set at 1.000
nA, which was measured with a Faraday cup, while the acquisition live time was the
same for all samples of the same type and was usually between 20-60 seconds
(depending on the stability of the sample), with an average of 2400 counts per
second. The instrument was calibrated using a set of standard blocks mounted with
natural minerals containing elements found in the samples to be analysed. Prior to
every analysis session, samples of known concentrations such as
[MA
0.50MB
0.50(phen)3](PF6)2 single co-crystals (MA and M
B are the same transition
metals as those in the unknown sample) were used as a check of the instrument’s
accuracy and precision.261 Atomic percentages were calculated in the JEOL EDS
software suite by a standardised quantitative analysis method using a phi-rho-z X-ray
depth distribution function with a fitting coefficient no more than 0.10. Appendix A
contains a discussion regarding the use of EDX as a technique for elemental analysis.
All of the data used throughout this research originated from chemically justifiable
data and where this was not possible other avenues of characterisation were explored.
3.2.2 Powder X-ray diffraction (PXRD)
Samples were prepared as thin films on silicon 511 wafers and were analysed at
room temperature on instruments equipped with either Cu or Co anodes. X-ray
Diffraction (XRD) patterns were collected either using a PANalytical X’Pert PRO
X-ray diffractometer (radius of 240 mm) with incident X-ray radiation sourced from
a line-focused PW3373/00 copper (Cu) X-ray tube, or with a Philips X-ray
diffractometer (radius 173 mm) with an incident X-ray radiation sourced from a line
focused PW1050 cobalt (Co) X-ray tube. Both X-ray tubes were used at 40 kV and
40 mA, with Kα wavelengths of 1.54060 Å and 1.78901 Å respectively. For all
patterns acquired with Cu radiation, a Bragg–Brentano beam geometry was chosen.
Depending on the sample type, starting positions ranged from 3-5° 2θ, while end
CHAPTER 3
42
positions were typically to 60-90° 2θ. Step sizes ranged from 0.017-0.020° 2θ, at
2.0-8.0 seconds per step. Data for photosensitive samples (as specified) were
collected in the dark to avoid decomposition during analysis. For direct comparison
of patterns within a series, all samples within that series were analysed under the
same conditions using the same parameters. The experimental patterns were then
compared with patterns simulated from experimental refinement data or known
structures found in the CSD.51 The X’pert Highscore Plus (PANanalytical) software
package was used to analyse the diffraction patterns and to calculate the simulated
patterns from single crystal data.
3.2.3 Single crystal X-ray diffraction (SCXRD)
Reflection data were collected using the CrysAlis package on an Oxford Diffraction
Xcalibur diffractometer at 173 K equipped with a Sapphire3 Gemini Ultra detector
and a graphite monochromator.262 X-ray radiation was from a fine-focused sealed
Molybdenum (Mo) X-ray tube at 40 kV and 50 mA, with a Kα wavelength of
0.71073 Å. The data collection mode (Laue Class, hemisphere, full sphere) and
exposure time per frame were determined within the software package, depending on
the intensity of diffraction displayed by the crystal and the fit percentage of reflection
data to the determined cell in the pre-experiment.
Data reduction was conducted using CrysAlis RED, within which multi-scan
empirical absorption corrections were applied using spherical harmonics,
implemented in the SCALE3 ABSPACK scaling algorithm.262 Crystal structures were
solved via direct methods using SIR97263 and refined with SHELXL97264 through the
WINGX graphical user interface.265 Full occupancy non-hydrogen atoms were
refined with anisotropic displacement parameters. C-H hydrogen atoms were
included in idealised positions and a riding model was used for their refinement. The
MA and M
B atoms in the co-crystals shared the same sites. Their coordinates and
anisotropic displacement parameters (where applicable) were fixed to be equivalent
in each case and occupancies were refined to determine an estimate of the relative
proportion of each metal in the crystals. Final refinement cycles were done with the
relative occupancies fixed at the ratios found. The attached CD contains the
crystallographic information files (.cif) for the crystal structures presented herein.
CHAPTER 3
43
3.2.4 Nuclear magnetic resonance spectroscopy (NMR)
Most of the compounds discussed in this thesis contain octahedral paramagnetic
cations (Co2+
, Ni2+
, Cu2+
, Cr3+
, Fe3+
) and therefore, NMR spectroscopy was only
used for characterisation of the diamagnetic complexes and organic ligands.
Samples were prepared in CDCl3, d6-DMSO, d6-acetone or D2O as specified. 1H
NMR spectra were recorded on a Bruker Avance 400 MHz at room temperature.
Chemical shifts are reported in ppm and referenced against the relevant solvent peak.
3.2.5 High resolution electrospray ionisation mass spectrometry (ESI-MS)
Electrospray ionisation mass spectrometry was conducted on an Agilent 6520
Accurate-Mass Q-TOF LC/MS. Samples were dissolved in HPLC grade solvents and
diluted to concentrations of 10 µg·cm-3
. Ultra-pure nitrogen gas was used as both the
drying and nebulising gas and the source temperature was set to 350°C. The
fragmentor and skimmer voltages were set at 100 V and 20 V respectively (unless
otherwise specified). Mass spectra were collected in both positive and negative ion
modes (as specified) from m/z 100 to 1000 Da.
3.2.6 Raman spectroscopy
Powders of the samples were placed directly on a polished metal slide while single
crystals were affixed to a glass slide with putty adhesive to ensure a flat and level
surface. The slides were then placed on the stage of an Olympus BHSM microscope
fitted with a 50× long working distance objective. Analysis was performed on a
Renishaw 1000 Raman microscope system equipped with a monochromator, a notch
filter system, a thermo-electrically cooled Charge Coupled Device (CCD) detector
and a Spectra-Physics model 127 Nd-YAG laser (785 nm). Raman spectra were
acquired in the range between 100-2000 cm-1
. Spectra were calibrated using the
520.5 cm-1
line of a silicon wafer prior to every analysis session and then with the
1722.97 and 1727.47 cm-1
carbonyl stretching bands of pure K3[Fe(ox)3]·2.5H2O and
K3[Cr(ox)3]·2.5H2O single crystals respectively.

CHAPTER 3
44
Single crystal Raman spectroscopic mapping was used to map the change in the
carbonyl stretching frequency at different locations on K3(CrxFe1-x(ox)3]·xH2O single
co-crystals. Raman line maps were measured along transects that spanned the single
crystal surface while area maps were measured so that the maximum possible area of
the selected surface of each individual crystal was analysed. Confocal experiments
were measured to depths of up to 500 µm; however, the signal to noise intensity at
these depths was at times very poor. Raman spectra collected during mapping were
acquired in the range between 1300-1800 cm-1
. All maps were conducted with the
aid of a computer controlled automatic stage. Spectral processing, such as curve
fitting, was performed using the WiRE Raman Renishaw software package.
3.2.7 Elemental analysis
Elemental microanalysis (C, H, N) was performed by the University of Queensland
Microanalytical Service. Difference calculations were employed to determine the
solvate species. For crystals that desolvate readily, microanalysis was carried out
after the crystals were air-dried.

CHAPTER 3
45
3.3 Synthetic experimental details
The terpyPh ligand and metal complexes studied in this work were synthesised and
crystallised using reported literature procedures. The ligands, precursors and
complexes are indexed in Table 3.
Table 3: Compound index
Section Formula Section Formula
3.3.1 terpyPh 3.3.2.16 [Ru(terpy)2](BF4)2·H2O
3.3.2.1 [Fe(terpy)2](PF6)2 3.3.2.17 [Ru(terpyPh)2](PF6)2·4MeCN
3.3.2.2 [Co(terpy)2](PF6)2 3.3.2.18 [Ru(terpyOH)2](BF4)2·H2O
3.3.2.3 [Ni(terpy)2](PF6)2 3.3.3.1 [Ni(phen)3]Cl2·8.5H2O
3.3.2.4 [Cu(terpy)2](PF6)2 3.3.3.2 [Ni(phen)3](PF6)2·H2O
3.3.2.5 [Fe(terpyPh)2](PF6)2·MeCN·H2O 3.3.3.3 [Ni(bipy)3]Cl2·7H2O
3.3.2.6 [Ni(terpyPh)2](PF6)2·4MeCN 3.3.3.4 [Ni(bipy)3](PF6)2
3.3.2.7 [Cu(terpyPh)2](PF6)2·4MeCN 3.3.3.5 cis-[Ru(phen)2Cl2]·2H2O
3.3.2.8 [Fe(terpyOH)2](BF4)2·H2O 3.3.3.6 cis-[Ru(bipy)2Cl2]·2H2O
3.3.2.9 [Ni(terpyOH)2](BF4)2·H2O 3.3.3.7 [Ru(phen)3]Cl2·9H2O
3.3.2.10 [Cu(terpyOH)2](BF4)2·H2O 3.3.3.8 [Ru(bipy)3]Cl2·7H2O
3.3.2.11 [Co(terpyOH)(terpyO)](BF4)2·3.5H2O 3.3.4.1 K3[Mn(ox)3] ·xH2O
3.3.2.12 cis-[Ru(DMSO)4Cl2] 3.3.4.2 K3[Cr(ox)3]·2.5H2O
3.3.2.13 [Ru(terpy)Cl3] 3.3.4.3 K3[Fe(ox)3]·2.5H2O
3.3.2.14 [Ru(terpy)2]Cl2 3.3.4.4, 3.3.3.5 K3[Ru(ox)3] ·xH2O methods 1 and 2
3.3.2.15 [Ru(terpy)2](PF6)2 3.3.4.6 K3[Rh(ox)3]·2H2O
3.3.1 Synthesis of 4′-phenyl-2,2′:6′,2′′-terpyridine (terpyPh)
3.3.1.1 3-phenyl-1,5-bis(2-pyridyl)-1,5-pentanedione
This precursor was synthesised by the literature method of Constable et al.266 The
compound 2-acetylpyridine (5.0 cm3, 44.6 mmol) was added dropwise to a stirred
emulsion of benzaldehyde (2.3 cm3, 22.6 mmol) in EtOH (20 cm
3) and aqueous
sodium hydroxide solution (15 cm3, 1.5 M, 22.5 mmol). After addition of
approximately 10 drops of the 2-acetylpyridine, a white precipitate was observed.
This precipitate continued to form during the addition of the remaining
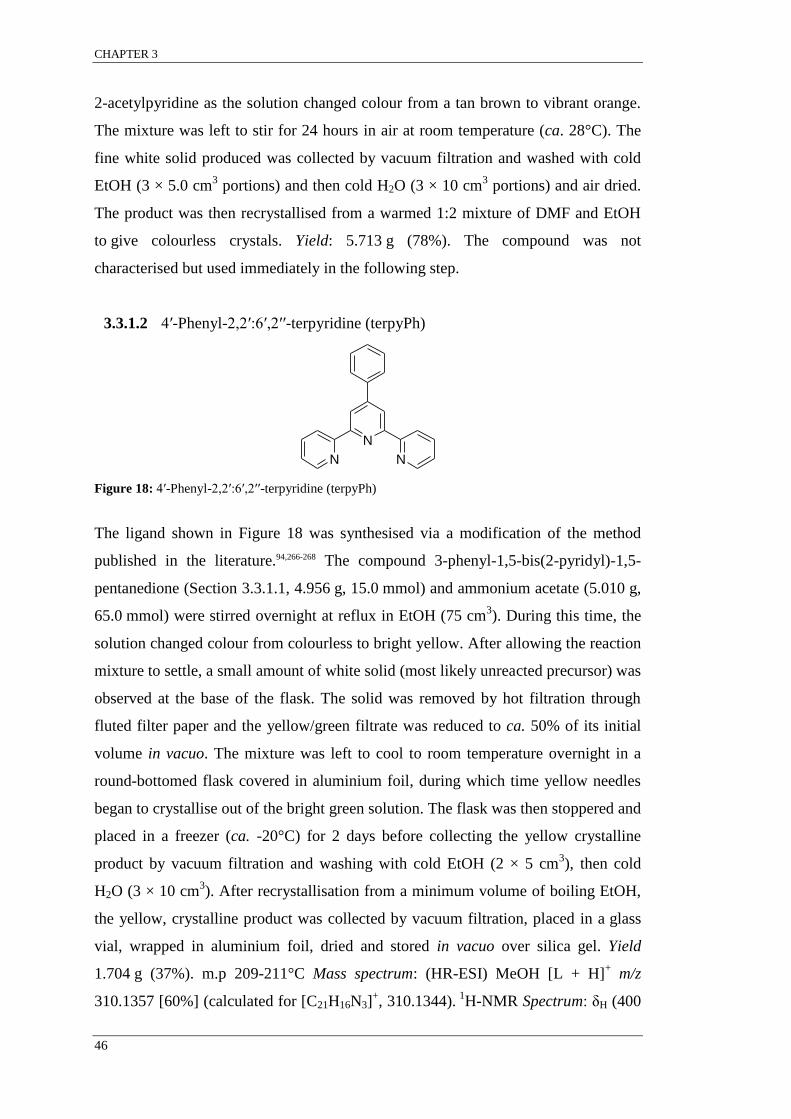
CHAPTER 3
46
2-acetylpyridine as the solution changed colour from a tan brown to vibrant orange.
The mixture was left to stir for 24 hours in air at room temperature (ca. 28°C). The
fine white solid produced was collected by vacuum filtration and washed with cold
EtOH (3 × 5.0 cm3 portions) and then cold H2O (3 × 10 cm
3 portions) and air dried.
The product was then recrystallised from a warmed 1:2 mixture of DMF and EtOH
to give colourless crystals. Yield: 5.713 g (78%). The compound was not
characterised but used immediately in the following step.
3.3.1.2 4′-Phenyl-2,2′:6′,2′′-terpyridine (terpyPh)
N
N
N
Figure 18: 4′-Phenyl-2,2′:6′,2′′-terpyridine (terpyPh)
The ligand shown in Figure 18 was synthesised via a modification of the method
published in the literature.94,266-268 The compound 3-phenyl-1,5-bis(2-pyridyl)-1,5-
pentanedione (Section 3.3.1.1, 4.956 g, 15.0 mmol) and ammonium acetate (5.010 g,
65.0 mmol) were stirred overnight at reflux in EtOH (75 cm3). During this time, the
solution changed colour from colourless to bright yellow. After allowing the reaction
mixture to settle, a small amount of white solid (most likely unreacted precursor) was
observed at the base of the flask. The solid was removed by hot filtration through
fluted filter paper and the yellow/green filtrate was reduced to ca. 50% of its initial
volume in vacuo. The mixture was left to cool to room temperature overnight in a
round-bottomed flask covered in aluminium foil, during which time yellow needles
began to crystallise out of the bright green solution. The flask was then stoppered and
placed in a freezer (ca. -20°C) for 2 days before collecting the yellow crystalline
product by vacuum filtration and washing with cold EtOH (2 × 5 cm3), then cold
H2O (3 × 10 cm3). After recrystallisation from a minimum volume of boiling EtOH,
the yellow, crystalline product was collected by vacuum filtration, placed in a glass
vial, wrapped in aluminium foil, dried and stored in vacuo over silica gel. Yield
1.704 g (37%). m.p 209-211°C Mass spectrum: (HR-ESI) MeOH [L + H]+ m/z
310.1357 [60%] (calculated for [C21H16N3]+, 310.1344).
1H-NMR Spectrum: δH (400

CHAPTER 3
47
MHz; CDCl3) 8.74 (s, 2H), 8.73 (unresolved dd, 3JHH = 4.4 Hz, 2H), 8.68 (d,
3JHH =
8.2 Hz, 2H), 7.91 (dd, 3JHH = 8.2 Hz,
4JHH = 1.2 Hz, 2H), 7.87 (dd,
3JHH = 7.6 Hz,
4JHH = 1.8 Hz, 2H), 7.52 (tt,
3JHH = 7.6 Hz,
4JHH = 1.8 Hz, 2H), 7.45 (unresolved tt,
3JHH = 7.64 Hz, 1H), 7.36 (ddd,
3JHH = 7.6 Hz,
4JHH = 1.2 Hz, 2H). This is a match to
reported literature values.266
3.3.2 Synthesis of [MII
(L)2]X2 transition metal complexes
These complexes, all of which have been previously reported, were synthesised using
modified literature procedures.32-34,266,269-275 Complexes of the formula
[MII(terpy)2](PF6)2, [M
II(terpyOH)2](BF4)2 and [M
II(terpyPh)2](PF6)2 (M
II = Fe, Co,
Ni, Cu) were all prepared using similar procedures, however the syntheses of
[MII(terpyPh)2](PF6)2 complexes were conducted in the dark. In each case, the ligand
(ca. 1 mmol) was dissolved in warm EtOH or MeOH (ca. 5 cm3, at ca. 40°C) and
added dropwise to a warmed aqueous solution of the appropriate metal(II) chloride
(ca. 0.5 mmol in 5 cm3 at ca. 40°C). The ligand was added in slight excess to the
metal ion (ca. 2.1:1) in order to ensure a slightly basic environment and to complete
complexation of the metal ions. During the addition of all the ligand solutions, a
colour change was observed and this is documented in the corresponding
experimental sections. The complexes were then precipitated via metathesis with
saturated aqueous solutions of either KPF6 and NaBF4 salts and then filtered using a
sintered glass funnel, and washed with cold H2O until a sample of the filtrate
remained clear when reacted with aqueous AgNO3 (ca. 1.0 M). Unless otherwise
specified, [MII(L)2]X2 complexes were recrystallised from 1:1 MeCN:H2O solvent
mixtures using the solvent evaporation method.
3.3.2.1 [Fe(terpy)2](PF6)2
A solution of 2,2′:6′,2′′-terpyridine (0.244 g, 1.05 mmol) in EtOH (5 cm3 at ca. 40°C)
was added dropwise to FeCl2·4H2O (0.099 g, 0.499 mmol) dissolved in H2O (ca. 5
cm3 at 40°C). During the addition of the ligand solution, the reaction mixture
changed colour from yellow to brown and then finally to deep violet. A saturated
aqueous solution of KPF6 (5 drops) was added immediately, resulting in a purple
precipitate. The solid was filtered and recrystallised to produce thin dark purple
CHAPTER 3
48
rectangular crystals. Yield 0.366 g (91%). Mass spectrum: (HR-ESI) MeCN [ML2]2+
m/z 261.0649 [100%] (calculated for [C30H22N6Fe1]2+
, 261.0628), [ML2 + X]+ m/z
667.0913 [39%] (calculated for [C30H22N6Fe1 + PF6]+, 667.0898).
1H-NMR
Spectrum: δH (400 MHz; d6-DMSO) 9.22 (d, 3JHH = 7.6 Hz, 4H), 8.79 (unresolved m,
6H), 7.99 (t, 3JHH = 7.6 Hz, 4H), 7.16 (unresolved m, 8H). The peaks are broad,
presumably due to the large amount of water present as indicated by the peak at 3.42
ppm.
3.3.2.2 [Co(terpy)2](PF6)2
A solution of 2,2′:6′,2′′-terpyridine (0.239 g, 1.025 mmol) in EtOH (5 cm3 at ca.
40°C) was added dropwise to CoCl2·6H2O (0.116 g, 0.488 mmol) dissolved in H2O
(ca. 5 cm3 at 40°C). During the addition of the ligand solution, the reaction mixture
changed colour from pink to dark orange and then finally to brown. Addition of
saturated aqueous KPF6 solution (5 drops) resulted in a tan precipitate. The solid was
filtered and recrystallised to produce thin brown rectangular crystals. Yield 0.354 g
(89%). Mass spectrum: (HR-ESI) MeCN [ML2]2+
m/z 262.5639 [100%] (calculated
for [C30H22N6Co1]2+
, 262.5619), [ML2 + X]+ m/z 670.0889 [29%] (calculated for
[C30H22N6Co1 + PF6]+, 667.0880).
3.3.2.3 [Ni(terpy)2](PF6)2
A solution of 2,2′:6′,2′′-terpyridine (0.233 g, 1.00 mmol) in EtOH (5 cm3 at ca. 40°C)
was added dropwise to NiCl2·6H2O (0.112 g, 0.476 mmol) dissolved in H2O (ca. 5
cm3 at 40°C). During the addition of the ligand solution the reaction mixture changed
colour from pale green to tan and then finally to light brown. Addition of saturated
aqueous KPF6 solution (5 drops) resulted in a light brown precipitate. The solid was
filtered and recrystallised to produce thin light brown square crystals. Yield 0.349 g
(90%). Mass spectrum: (HR-ESI) MeCN [ML2]2+
m/z 262.0646 [100%] (calculated
for [C30H22N6Ni1]2+
, 262.0630), [ML2 + X]+ m/z 669.0910 [46%] (calculated for
[C30H22N6Ni1 + PF6]+, 669.0901).

CHAPTER 3
49
3.3.2.4 [Cu(terpy)2](PF6)2
A solution of 2,2′:6′,2′′-terpyridine (0.233 g, 0.997 mmol) in EtOH (5 cm3 at ca.
40°C) was added dropwise to CuCl2·2H2O (0.081 g, 0.475 mmol) dissolved in warm
H2O (ca. 5 cm3 at 40°C). During the addition of the ligand solution the reaction
mixture changed colour from light blue to blue and then finally to dark blue.
Addition of saturated aqueous KPF6 solution (5 drops) resulted in a light blue/green
precipitate. The solid was filtered and recrystallised to produce thin blue/green
rectangular shaped crystals. Yield 0.354 g (91%). Mass spectrum: (HR-ESI) MeCN
[ML2 + H]2+
m/z 265.0854 [100%] (calculated for [C30H23N6Cu1]2+
, 265.0640). This
base peak in the ESI-MS for the protonated yet dicationic ion indicates that the Cu2+
complex is very easily prone to reduction under the conditions of the mass
spectrometer to a Cu+ complex ion.
3.3.2.5 [Fe(terpyPh)2](PF6)2·MeCN·H2O
A solution of 4′-phenyl-2,2′:6′,2′′-terpyridine (Section 3.3.1.2, 0.190 g, 0.613 mmol)
in EtOH (5 cm3 at ca. 40°C) was added dropwise to FeCl2·4H2O (0.058 g,
0.292 mmol) dissolved in warm H2O (ca. 5 cm3 at 40°C). During the addition of the
ligand solution the reaction mixture changed colour from yellow to brown and then
finally to deep violet. A saturated aqueous solution of KPF6 (5 drops) was then
added, immediately resulting in an intense purple precipitate. The solid was filtered
and recrystallised to produce dark purple long rectangular crystals. After 15-30
minutes out of the mother liquor the crystals began to desolvate and appeared to lose
lustre and eventually formed a powder; this indicates that they likely contain volatile
solvents of crystallisation. Yield 0.269 g (90%). Mass spectrum: (HR-ESI) MeCN
[ML2]2+
m/z 337.0956 [100%] (calculated for [C42H30N6Fe1]2+
, 337.0941), [ML2 +
X]+ m/z 819.1515 [27%] (calculated for [C42H30N6Fe1 + PF6]
+, 819.1523).
1H-NMR
Spectrum: δH (400 MHz; d6-DMSO) 9.69 (s, 4H), 9.08 (d, 3JHH = 8.2 Hz, 4H), 8.57
(d, 3JHH = 7.6 Hz, 4H), 8.05 (t,
3JHH = 7.6 Hz, 4H), 7.85 (t,
3JHH = 7.6 Hz, 4H), 7.75
(t, 3JHH = 7.0 Hz, 2H), 7.30 (d,
3JHH = 5.3 Hz, 4H), 7.21 (t,
3JHH = 7.0 Hz, 4H).

CHAPTER 3
50
3.3.2.6 [Ni(terpyPh)2](PF6)2·4MeCN
A solution of 4′-phenyl-2,2′:6′,2′′-terpyridine (Section 3.3.1.2, 0.191 g, 0.617 mmol)
in EtOH (5 cm3 at ca. 40°C) was added dropwise to NiCl2·6H2O (0.070 g,
0.294 mmol) dissolved in warm H2O (ca. 5 cm3 at 40°C). During the addition of the
ligand solution, the reaction mixture changed colour from pale green to deep orange
then finally to brown. A saturated aqueous solution of KPF6 (5 drops) was then
added immediately resulting in a dark tan precipitate. The solid was filtered and
recrystallised to produce tan brown crystals. After no more than 5 minutes out of the
mother liquor, the crystals began to desolvate, appeared to lose lustre, and eventually
formed a powder. Yield 0.306 g (92%). Mass spectrum: (HR-ESI) MeCN [ML2]2+
m/z 338.0956 [100%] (calculated for [C42H30N6Ni1]2+
, 338.0943), [ML2 + X]+ m/z
821.1510 [44%] (calculated for [C42H30N6Ni1 + PF6]+, 821.1527).
3.3.2.7 [Cu(terpyPh)2](PF6)2·4MeCN
A solution of 4′-phenyl-2,2′:6′,2′′-terpyridine (Section 3.3.1.2, 0.190 g, 0.616 mmol)
in EtOH (5 cm3 at ca. 40°C) was added dropwise to CuCl2·2H2O (0.050 g,
0.293 mmol) dissolved in warm H2O (ca. 5 cm3 at 40°C). During the addition of the
ligand solution the reaction mixture changed colour from pale blue to blue/green and
then finally to dark blue/green. A saturated aqueous solution of KPF6 (5 drops) was
added immediately, resulting in an intense purple precipitate. The solid was filtered
and recrystallised to produce blue/green crystals. After 5 minutes out of the mother
liquor, the crystals began to desolvate, appeared to lose lustre, and eventually formed
a powder. Yield 0.310 g (93%). Mass spectrum: (HR-ESI) MeCN [ML2]2+
m/z
340.5927 [34%] (calculated for [C42H30N6Cu1]2+
, 340.5914), [M(L)(L + H)]2+
m/z
341.0940 [19%] (calculated for [C42H31N6Cu1]2+
, 341.0948), [ML2]+ m/z 681.1822
[4%] (calculated for [C42H30N6Cu1]+, 681.1817).
3.3.2.8 [Fe(terpyOH)2](BF4)2·H2O
A solution of 2,6-bis(2-pyridyl)-4(1H)-pyridone (0.086 g, 0.343 mmol) in EtOH (5
cm3 at ca. 40°C) was added dropwise to FeCl2·4H2O (0.033 g, 0.163 mmol)
dissolved in warm H2O (ca. 5 cm3 at 40°C). During the addition of the ligand
CHAPTER 3
51
solution the reaction mixture changed colour from yellow to brown and then finally
to deep violet. Addition of saturated aqueous NaBF4 solution (10 drops) resulted in a
purple precipitate. The solid was filtered and recrystallised to produce purple
crystals. Yield 0.121 g (91%). Mass spectrum: (HR-ESI) MeCN [ML2]2+
m/z
277.0588 [100%] (calculated for [C30H22N6O2Fe1]2+
, 277.0577), [M(L)(L – H)]+ m/z
553.1075 [46%] (calculated for [C30H21N6O2Fe1]+, 553.1076).
1H-NMR Spectrum:
δH (400 MHz; d6-DMSO) 8.63 (d, 3JHH = 8.2 Hz, 4H), 8.55 (s, 4H), 7.95 (t,
3JHH =
7.6 Hz, 4H), 7.25 (d, 3JHH = 5.3 Hz, 4H), 7.19 (t,
3JHH = 6.4 Hz, 4H). The peaks were
broad and the phenolic proton was not observed, presumably due to the large amount
of water present as indicated by the peak at 3.38 ppm. The NMR spectrum of this
compound has not previously been reported.
3.3.2.9 [Ni(terpyOH)2](BF4)2·H2O
A solution of 2,6-bis(2-pyridyl)-4(1H)-pyridone (0.085 g, 0.342 mmol) in EtOH (5
cm3 at ca. 40°C) was added dropwise to NiCl2·6H2O (0.038 g, 0.163 mmol)
dissolved in warm H2O (ca. 5 cm3 at 40°C). During the addition of the ligand
solution the reaction mixture changed colour from pale green to tan orange and then
finally to brown. Addition of saturated aqueous NaBF4 solution (10 drops) resulted in
a brown precipitate. The solid was filtered and recrystallised to produce small brown
crystals. Yield 0.110 g (93%). Mass spectrum: (HR-ESI) MeCN [ML2]2+
m/z
278.0594 [100%] (calculated for [C30H22N6O2Ni1]2+
, 278.0579), [M(L)(L – H)]+ m/z
555.1083 [60%] (calculated for [C30H21N6O2Ni1]+, 555.1079).
3.3.2.10 [Cu(terpyOH)2](BF4)2·H2O
A solution of 2,6-bis(2-pyridyl)-4(1H)-pyridone (0.086 g, 0.344 mmol) in EtOH (5
cm3 at ca. 40°C) was added dropwise to CuCl2·2H2O (0.028 g, 0.164 mmol)
dissolved in warm H2O (ca. 5 cm3 at 40°C). During the addition of the ligand
solution the reaction mixture changed colour from pale blue to blue/green and then
finally to dark blue/green. Addition of saturated aqueous NaBF4 solution (10 drops)
resulted in a brown precipitate. The solid was filtered and recrystallised to produce
blue/green rectangular crystals. Yield 0.116 g (94%). Mass spectrum: (HR-ESI)

CHAPTER 3
52
MeCN [ML2]2+
m/z 280.5561 [100%] (calculated for [C30H22N6O2Cu1]2+
, 280.5550),
[M(L)(L – H)]+ m/z 560.1020 [74%] (calculated for [C30H21N6O2Cu1]
+, 560.1022).
3.3.2.11 [Co(terpyOH)(terpyO)](BF4)2·3.5H2O
A solution of 2,6-bis(2-pyridyl)-4(1H)-pyridone (0.076 g, 0.315 mmol) in MeOH (5
cm3 at ca. 40°C) was added dropwise to CoCl2·6H2O (0.036 g, 0.150 mmol)
dissolved in warm H2O (ca. 5 cm3 at 40°C). During the addition of the ligand
solution the reaction mixture changed colour from pink to rose brown and then
finally to dark red/brown. Air was then vigorously bubbled through the solution for 1
hour. Addition of saturated aqueous NaBF4 solution (20 drops) resulted in a
red/brown precipitate. The solid was filtered and recrystallised to produce small
red/brown multifaceted crystals. Yield 0.105 g (88%). Mass spectrum: (HR-ESI)
MeCN [M(L – H)2]+ m/z 555.0983 [100%] (calculated for [C30H20N6O2Co1]
+,
555.0980). 1
H-NMR Spectrum: δH (400 MHz; d6-DMSO) 8.63 (d, 3JHH = 7.6 Hz,
4H), 8.19 (dt, 3JHH = 7.6 Hz,
4JHH = 1.2 Hz, 4H), 8.04 (s, 4H), 7.54 (d,
3JHH = 5.9 Hz ,
4H), 7.45 (dt, 3JHH = 6.8 Hz,
4JHH = 1.2 Hz, 4H). The phenolic proton was not
observed, presumably due to the large amount of water present as indicated by the
peak at 3.36 ppm. The NMR spectrum of this compound has not previously been
reported.
3.3.2.12 cis-[Ru(DMSO)4Cl2]
The compound RuCl3·xH2O (2.002 g, 7.40 mmol for x = 3.5) in DMSO (15 cm3) was
first purged with N2 gas for 15 minutes then heated at reflux (ca. 160°C) for 10 mins
under a N2 atmosphere. During this time, dimethyl sulfide distillate was collected
and the reaction mixture changed colour from black/brown to deep red/brown. The
solution was slowly cooled to room temperature then placed in an ice bath. Acetone
(200 cm3) was then quickly added and the resulting mixture left to cool in an ice bath
for a further 20 minutes, during which time a fine yellow product precipitated. The
flask was stoppered and placed in the freezer overnight then the solid was filtered,
washed with cold acetone (3 × 25 cm3) and dried in vacuo over silica gel. Yield
2.923 g (68%). This complex was used as a synthetic precursor without further
purification and was not characterised.

CHAPTER 3
53
3.3.2.13 [Ru(terpy)Cl3]
The compound RuCl3·xH2O (0.677 g, 2.50 mmol for x = 3.5) and
2,2′:6′,2′′-terpyridine (0.601 g, 2.57 mmol) in EtOH (60 cm3) were heated at reflux
with stirring for 90 minutes. The reaction mixture was allowed to cool slowly to
room temperature during which time a fine brown precipitate formed. The
black/brown solid was isolated via vacuum filtration and washed with H2O (3 × 20
cm3), EtOH (3 × 20 cm
3) and finally Et2O (3 × 20 cm
3) then left to dry. Yield 0.987 g
(90%). This complex was used as a synthetic precursor without further purification
and was not characterised.
3.3.2.14 [Ru(terpy)2]Cl2
The compounds [Ru(terpy)Cl3] (Section 3.3.2.13, 0.657 g, 1.49 mmol),
2,2′:6′,2′′-terpyridine (0.362, 1.55 mmol) and N-ethylmorpholine (17 drops) were
added together in EtOH (33 cm3) and heated at reflux. After 3.5 hours the reaction
mixture had changed from dark brown to bright red and then was diluted with H2O
(30 cm3) and filtered through a pad of Celite®. Most of the EtOH was removed in
vacuo and the resulting aqueous solution was split into two (without further
purification or characterisation) in preparation for anion exchange (Sections 3.3.2.15
and 3.3.2.16).
3.3.2.15 [Ru(terpy)2](PF6)2
A saturated aqueous solution of KPF6 (20 drops) was added to a solution of
[Ru(terpy)2]Cl2 (ca. 15 cm3), which immediately resulted in a bright red precipitate.
The solid was filtered washed with H2O (2 × 4.0 cm3), cold EtOH (2 × 4.0 cm
3) and
Et2O (4 × 7.5 cm3). The dried solid was recrystallised to give deep red multifaceted
thin prisms. Yield 0.575 g (90% based on half of the [Ru(terpy)Cl3] used in Section
3.3.2.14). Mass spectrum: (HR-ESI) MeCN [ML2]2+
m/z 284.0486 [100%]
(calculated for [C30H22N6Ru1]2+
, 284.0479), [ML2 + X]+ m/z 713.0586 [50%]
(calculated for [C30H22N6Ru1 + PF6]+, 713.0599).
1H-NMR Spectrum: δH (400 MHz;
d6-acetone) 9.08 (d, 3JHH = 8.2 Hz, 4H), 8.81 (d,
3JHH = 8.2 Hz, 4H), 8.59 (t,
3JHH =
7.6 Hz, 2H), 8.08 (dt, 3JHH = 8.2 Hz,
4JHH = 1.2 Hz, 4H), 7.70 (d,
3JHH = 8.2 Hz, 4H),

CHAPTER 3
54
7.33 (ddd, 3JHH = 7.6 Hz,
4JHH = 1.2 Hz 4H),. The collected spectrum is a match to
literature values.276
3.3.2.16 [Ru(terpy)2](BF4)2·H2O
A saturated aqueous solution of NaBF4 (30 drops) was added to a solution of
[Ru(terpy)2]Cl2 (ca. 15 cm3), resulting in a bright red precipitate. The solid was
filtered and washed with H2O (1 × 2.5 cm3), cold EtOH (2 × 2.5 cm
3) and Et2O (4 ×
5 cm3). The dried solid was recrystallised to give deep red multifaceted prisms. Yield
0.498 g (88% based on half of the [Ru(terpy)Cl3] used in Section 3.3.2.14). Mass
spectrum: (HR-ESI) MeCN [ML2]2+
m/z 284.0488 [100%] (calculated for
[C30H22N6Ru1]2+
, 284.0479), [ML2 + X]+ m/z 655.0985 [45%] (calculated for
[C30H22N6Ru1 + BF4]+, 655.0991).
1H-NMR Spectrum: δH (400 MHz; d6-acetone)
9.10 (d, 3JHH = 7.6 Hz, 4H), 8.83 (d,
3JHH = 8.2 Hz, 4H), 8.58 (t,
3JHH = 8.2 Hz, 2H),
8.07 (dt, 3JHH = 7.6 Hz,
4JHH = 1.2 Hz, 4H), 7.71 (d,
3JHH = 4.7 Hz, 4H), 7.33 (dt,
3JHH = 7.6 Hz,
4JHH = 1.2 Hz, 4H), which is a match to literature values.277
3.3.2.17 [Ru(terpyPh)2](PF6)2·4MeCN
The compound 4′-phenyl-2,2′:6′,2′′-terpyridine (Section 3.3.1.2, 0.145 g,
0.483 mmol) dissolved in EtOH (5.5 cm3) was added to a solution of
cis-[Ru(DMSO)4Cl2] (Section 3.3.2.12, 0.112 g, 0.230 mmol) in H2O (5.5 cm3). The
resulting mixture was heated at reflux with stirring and after 1.5 hours, the solution
had changed colour from yellow to deep red. After a total of 4 hours heating at
reflux, the reaction was left to cool to room temperature. Precipitation of a bright red
solid was achieved through metathesis with a saturated aqueous solution of KPF6 (45
drops). The solid was collected via vacuum filtration, washed with cold EtOH (2 × 5
cm3) and Et2O (2 × 10 cm
3) and recrystallised to give thin red crystals. After 15-30
minutes out of the mother liquor, the crystals began to desolvate, appeared to lose
lustre, and eventually formed a powder. Yield 0.195 g (84%). Mass spectrum:
(HR-ESI) MeCN [ML2]2+
m/z 360.0807 [100%] (calculated for [C42H30N6Ru1]2+
,
360.0794), [ML2 + X]+ m/z 865.1206 [43%] (calculated for [C42H30N6Ru1 + PF6]
+,
865.1229). 1
H-NMR Spectrum: δH (400 MHz; d6-acetone) 9.45 (s, 4H), 9.08 (d, 3JHH
= 8.2 Hz, 4H), 8.34 (dd, 3JHH = 8.2 Hz,
4JHH = 1.2 Hz, 4H), 8.12 (dt,
3JHH = 7.6 Hz,
CHAPTER 3
55
4JHH = 1.2 Hz, 4H), 7.84 (d,
3JHH = 5.3 Hz, 4H), 7.77 (t,
3JHH = 7.6 Hz, 4H), 7.70 (t,
3JHH = 7.6 Hz, 2H), 7.36 (dt,
3JHH = 7.6 Hz,
4JHH = 1.2 Hz, 4H).
3.3.2.18 [Ru(terpyOH)2](BF4)2·H2O
The compound 2,6-bis(2-pyridyl)-4(1H)-pyridone (0.109 g, 0.438 mmol) in EtOH
(5.5 cm3) was added to a solution of cis-[Ru(DMSO)4Cl2] (Section 3.3.2.12, 0.106 g,
0.218 mmol) in H2O (5.5 cm3). The resulting mixture was heated at reflux with
stirring and after 1.5 hours, the solution had changed colour from yellow to ruby red.
After a total of 3.5 hours, heating at reflux the reaction was left to cool to room
temperature. Precipitation of a bright red solid was achieved through metathesis with
a saturated aqueous solution of NaBF4 (30 drops). The solid was collected via
vacuum filtration, washed with cold EtOH (2 × 5 cm3) and Et2O (2 × 10 cm
3) and
recrystallised to give red crystals. Yield 0.141 g (82%). Mass spectrum: (HR-ESI)
MeCN [ML2]2+
m/z 300.0437 [50%] (calculated for [C30H22N6O2Ru1]2+
, 300.0428),
[M(L)(L – H)]+ m/z 599.0763 [27%] (calculated for [C30H21N6O2Ru1]
+, 599.0778).
1H-NMR Spectrum: δH (400 MHz; d6-acetone) 8.68 (d,
3JHH = 8.2 Hz, 4H), 8.50 (s,
4H), 8.03 (t, 3JHH = 8.2 Hz, 4H), 7.76 (d,
3JHH = 5.9 Hz, 4H), 7.32 (t,
3JHH = 6.5 Hz,
4H). The phenolic proton was not observed, presumably due to the large amount of
water present as indicated by the peak at 2.85 ppm.

CHAPTER 3
56
3.3.3 Synthesis of [MII
(L)3]X2 transition metal complexes
These following complexes, all of which have been previously reported, were
synthesised using modified literature procedures.
3.3.3.1 [Ni(phen)3]Cl2·8.5H2O
The synthesis of this complex and subsequent PF6- salt metathesis (Section 3.3.3.2)
followed a published literature procedure.278-280 A solution of 1,10-phenanthroline
(0.183 g, 1.02 mmol) in EtOH (5 cm3 at ca. 40°C) was added dropwise to
NiCl2·6H2O (0.078 g, 0.328 mmol) dissolved in warm H2O (ca. 5 cm3 at 40°C).
During the addition of the ligand solution the reaction mixture changed colour from
pale green to purple and then finally to pink. The solvents were removed in vacuo
until only solid was visible and the reaction vessel left unstoppered in an oven at ca.
60°C for 1 hour to ensure complete solvent evaporation. An aqueous solution of the
crude mixture was then triturated with acetone (ca. 5 cm3) and the solid filtered and
washed with cold acetone (2 × 2 cm3). The solid was recrystallised by vapour
diffusion of acetone into H2O to give deep pink thin prisms. Yield 0.232 g (86%).
Mass spectrum: (HR-ESI) MeCN [ML3]2+
m/z 299.0732 [100%] (calculated for
[C36H24N6Ni1]2+
, 299.0708), [ML2 + X]+ m/z 453.0423 [23%] (calculated for
[C24H16N4Ni1 + Cl]+, 453.0417). Elemental Analysis Found: C, 52.51; H, 4.67; N,
10.10. Calculated for C36H41Cl2N6Ni1O8.5: C, 52.52; H, 5.02; N, 10.21.
3.3.3.2 [Ni(phen)3](PF6)2·H2O
An aqueous/ethanolic solution of the complex [Ni(phen)3]Cl2 was synthesised as per
the procedure described in Section 3.3.3.1. Saturated aqueous KPF6 (15 drops) was
then added which immediately resulted in a pale pink precipitate. The solid was
filtered washed with H2O (3 × 5.0 cm3) and left to air dry. The dried solid was
recrystallised from a 1:1 acetone:H2O solvent mixture to give deep pink prisms. Yield
0.268 g (91%). Mass spectrum: (HR-ESI) MeCN [ML3]2+
m/z 299.0715 [100%]
(calculated for [C36H24N6Ni1]2+
, 299.0708), [ML3 + X]+ m/z 743.1063 [35%]
(calculated for [C36H24N6Ni1 + PF6]+, 743.1063).
CHAPTER 3
57
3.3.3.3 [Ni(bipy)3]Cl2·7H2O
The synthesis of this complex and subsequent PF6- salt metathesis (Section 3.3.3.4)
followed a published literature procedure.278-280 A solution of 2,2′-bipyridine (0.157 g,
1.01 mmol) in EtOH (5 cm3 at ca. 40°C) was added dropwise to NiCl2·6H2O
(0.077 g, 0.325 mmol) dissolved in warm H2O (ca. 5 cm3 at 40°C). During the
addition of the ligand solution the reaction mixture changed colour from pale green
to purple and then finally to orange/pink. The solvents were removed in vacuo until
only solid was visible and the reaction vessel then left unstoppered in an oven at ca.
60°C for 1 hour to ensure complete solvent evaporation. An aqueous solution of the
crude product mixture was then triturated with acetone (ca. 5 cm3) and the solid
filtered and washed with cold acetone (2 × 2 cm3). The solid was recrystallised by
vapour diffusion of acetone into H2O to give pink multifaceted prisms. Yield 0.209 g
(89%). Mass spectrum: (HR-ESI) MeCN [ML3]2+
m/z 263.0735 [100%] (calculated
for [C30H24N6Ni1]2+
, 263.0703), [ML2 + X]+ m/z 405.0423 [27%] (calculated for
[C20H16N4Ni1 + Cl]+, 405.0417). Elemental Analysis Found: C, 49.88; H, 5.10; N,
11.58. Calculated for C30H38Cl2N6Ni1O7: C, 49.75; H, 5.29; N, 11.60.
3.3.3.4 [Ni(bipy)3](PF6)2
An aqueous/ethanolic solution of the complex [Ni(bipy)3]Cl2 was synthesised as per
the procedure described in Section 3.3.3.3.280 Saturated aqueous KPF6 (20 drops) was
then added which immediately resulted in a pale salmon pink precipitate. The solid
was filtered washed with H2O (3 × 5.0 cm3) and left to air dry. The dried solid was
recrystallised from a 1:1 acetone:H2O solvent mixture to give long pink/orange
needles. Yield 0.239 g (90%) Mass spectrum: (HR-ESI) MeCN [ML3]2+
m/z
263.0705 [100%] (calculated for [C30H24N6Ni1]2+
, 263.0703).
3.3.3.5 cis-[Ru(phen)2Cl2]·2H2O
The synthesis of this complex follows a similar procedure to that of Sullivan et al.281
Commercially available RuCl3·xH2O (1.966 g, 7.27 mmol for x = 3.5),
1,10-phenanthroline (2.751 g, 15.3 mmol) and anhydrous lithium chloride, LiCl
(2.053 g, 48.4 mmol) in DMF (13 cm3) were heated at reflux with stirring for 6 hours
CHAPTER 3
58
during which time the reaction mixture changed colour from olive green to dark
pink/purple. Once cooled to room temperature a black solid began to form. Acetone
(65 cm3) was added and then the resultant mixture cooled in the freezer at -20°C
overnight. The black solid was filtered and washed with ice cold H2O (3 × 5 cm3)
followed by cold Et2O (3 × 5 cm3) then left to dry. Yield 2.768 g (67%). This
complex was used as a synthetic precursor without further purification. 1H-NMR
(400 MHz; d6-DMSO; 300 K): δH 10.32 (d, 3JHH = 4.7 Hz, 2H), 8.69 (d,
3JHH = 8.2
Hz, 2H), 8.40 (d, 3JHH = 8.2 Hz, 2H), 8.33 (d,
3JHH = 8.2 Hz, 2H), 8.28 (d,
3JHH = 8.2
Hz, 2H), 8.21 (m, 2H), 7.77 (dd, 3JHH = 4.7 Hz, 2H), 7.32 (ddd,
3JHH = 8.2 Hz, 2H).
This is a match to the spectrum reported in the literature.282
3.3.3.6 cis-[Ru(bipy)2Cl2]·2H2O
This complex was synthesised using the procedure as described in Section 3.3.3.5,281
replacing 1,10-phenanthroline with a molar equivalent of 2,2′-bipyridine. Yield
2.584 g (69%). This complex was used as a synthetic precursor without further
purification. 1
H-NMR (400 MHz; d6-DMSO; 300 K): δH 9.95 (unresolved dd, 3JHH =
4.8 Hz, 2H), 8.63 (d, 3JHH = 8.2 Hz, 2H), 8.47 (d,
3JHH = 8.2 Hz, 2H), 8.06 (dt,
3JHH =
7.6 Hz, 4JHH = 1.2 Hz, 2H), 7.77 (unresolved dt,
3JHH = 7.6 Hz, 2H), 7.68 (unresolved
dt, 3JHH = 8.2 Hz, 2H), 7.51 (d,
3JHH = 5.3 Hz, 2H), 7.10 (unresolved td,
3JHH = 6.8
Hz, 2H). This is a match to spectra reported in the literature.282,283
3.3.3.7 [Ru(phen)3]Cl2·9H2O
This complex was prepared using a reported literature procedure.272 A solution of
1,10-phenanthroline (0.185 g, 1.03 mmol) in MeOH (20 cm3) was added to a solution
of cis-[Ru(phen)2Cl2] ·2H2O (Section 3.3.3.5, 0.557 g, 0.98 mmol) in MeOH (100
cm3) and then heated at reflux for 1 hour with stirring, during which time the solution
turned bright red. The reaction mixture was cooled to room temperature, filtered
through a pad of Celite® and the solvent removed in vacuo. An aqueous solution of
the crude mixture was then triturated with acetone (ca. 5 cm3) and the dark red solid
was filtered and washed with cold acetone (2 × 2 cm3). The solid was recrystallised
by vapour diffusion of acetone into H2O to give red thin prisms. Yield 0.574 g (67%).
Mass spectrum: (HR-ESI) MeCN [ML3]2+
m/z 321.0570 [100%] (calculated for
CHAPTER 3
59
[C36H24N6Ru1]2+
, 321.0548), [ML3 + X]+ m/z 677.0787 [21%] (calculated for
[C36H24N6Ru1 + Cl]+, 677.0789). Elemental Analysis Found: C, 49.46; H, 4.55; N,
9.68. Calculated for C36H42Cl2N6O9Ru1: C, 49.43; H, 4.84; N, 9.61. 1H-NMR
Spectrum: δH (400 MHz; D2O) 8.47 (d, 3JHH = 8.2 Hz, 6H), 8.12 (s, 6H), 8.00 (d,
3JHH
= 8.2 Hz, 6H), 7.49 (unresolved dd, 3JHH = 8.2 Hz, 6H). The spectrum is a match to
that reported in the literature.284
3.3.3.8 [Ru(bipy)3]Cl2·7H2O
This complex was prepared using a reported literature procedure.272 A solution of
2,2′-bipyridine (0.166 g, 1.06 mmol) in MeOH (20 cm3) was added to a solution of
cis-[Ru(bipy)2Cl2] ·2H2O (Section 3.3.3.6, 0.526 g, 1.01 mmol) in MeOH (100 cm3)
and heated at reflux for 1 hour with stirring, during which time the solution turned
bright red. The reaction mixture was cooled to room temperature, filtered through a
pad of Celite® and the solvent removed in vacuo. An aqueous solution of the crude
mixture was then triturated with acetone (ca. 5 cm3) and the red solid filtered and
washed with cold acetone (2 × 2 cm3). The solid was recrystallised by vapour
diffusion of acetone into H2O to give red multifaceted prisms. Yield 0.550 g (71%).
Mass spectrum: (HR-ESI) MeCN [ML3]2+
m/z 285.0565 [100%] (calculated for
[C30H24N6Ru1]2+
, 285.0548), [ML3 + X]+ m/z 605.0785 [15%] (calculated for
[C30H24N6Ru1 + Cl]+, 605.0789). Elemental Analysis Found: C, 46.74; H, 4.61; N,
10.97. Calculated for C30H38Cl2N6O7Ru1: C, 47.00; H, 5.00; N, 10.96. 1H-NMR
Spectrum: δH (400 MHz; D2O) 8.44 (d, 3JHH = 8.2 Hz, 6H), 7.95 (dt,
3JHH = 8.2 Hz,
4JHH = 1.8, 6H), 7.34 (unresolved dd,
3JHH = 4.7 Hz, 6H), 7.27 (dt,
3JHH = 6.8 Hz,
4JHH = 1.2, 6H). The spectrum is a match to that reported in the literature.284
3.3.4 Synthesis of K3[MIII
(ox)3]·xH2O complexes
3.3.4.1 K3[Mn(ox)3]·xH2O
This complex was synthesised according to the literature procedure of Cartledge and
Ericks.285 Powdered potassium permanganate, KMnO4 (2.307 g, 14.60 mmol) was
added in very small portions to a stirred solution of oxalic acid, H2C2O4·2H2O
(11.811 g, 93.74 mmol) in H2O (75 cm3, ca. 70°C). To the resultant milky white
CHAPTER 3
60
suspension, potassium carbonate, K2CO3 (2.612 g, 18.90 mmol) was added and the
reaction mixture wrapped in aluminium foil and placed in an ice salt water bath.
Further KMnO4 (0.604 g, 3.82 mmol) was then added with stirring to the ice cold
light protected solution. The white solid was then quickly separated from the cherry
red filtrate via vacuum filtration and discarded. Ice cold EtOH (40 cm3) was then
added to the coloured solution until small amounts of a deep red/purple crystalline
precipitate were evident. The mixture was left to stand in an ice bath to further
crystallise for ca. 1 hour before filtering the deep purple prismatic crystals and
washing first with ice cold EtOH (2 × 10 cm3), then with ice cold acetone (2 × 10
cm3). The crystalline product was stored in vacuo over silica gel and protected from
light with aluminium foil. Decomposition began after ca. 4 days (light pink colour)
and after ca. 1 week decomposition was complete, resulting in a snow white solid.
Yield 4.581 g (57%) based on anhydrous formula.
3.3.4.2 K3[Cr(ox)3]·2.5H2O
This complex was synthesised according to the procedure of Bailer et al.286 Powdered
potassium dichromate, K2Cr2O7 (1.920 g, 6.53 mmol) was added very slowly to a
vigorously stirring solution of potassium oxalate, K2C2O4·H2O (2.313 g,
12.55 mmol) and oxalic acid, H2C2O4·2H2O (5.508 g, 43.69 mmol) in H2O (80 cm3).
After the addition of all of the K2Cr2O7, the solvent was removed in vacuo to near
dryness at which point small blue/black crystals began to form. An aqueous solution
of the crude mixture was then triturated with EtOH (ca. 5 cm3) and the green/blue
solid filtered and washed with cold EtOH (2 × 2 cm3). The solid was recrystallised
by vapour diffusion of EtOH into H2O to give large iridescent blue/black rectangular
prisms. Yield 4.865 g (80%). Elemental Analysis Found: C, 15.07; H, 0.73.
Calculated for C6H5CrK3O14.5: C, 15.06; H, 1.05. –ve ion mass spectrum: (HR-ESI)
MeCN [ML2]- m/z 227.9186 [100%] (calculated for [C4O8Cr1]
-, 227.8998),
X[M(L)3]2-
m/z 177.4380 [44%] (calculated for [C6O12K1Cr1]2-
, 177.4216),
X2[M(L)3]- m/z 393.8327 [29%] (calculated for [C6O12K2Cr1]
-, 393.8069).
CHAPTER 3
61
3.3.4.3 K3[Fe(ox)3]·2.5H2O
This compound was synthesised according to the procedure of Johnson and although
not stated the reaction mixture was protected from light at all times.287 A solution of
K2C2O4·H2O (3.008 g, 16.33 mmol) in hot H2O (15 cm3) was added slowly to a
stirring solution of FeCl3·6H2O (1.236 g, 4.57 mmol) in hot H2O (15 cm3, ca. 70°C)
resulting in a lime green solution. The reaction was cooled slowly in the dark then
placed in an ice bath for ca. 1 hour to induce crystallisation. The bright green solid
was vacuum filtered, washed with cold EtOH (2 × 5 cm3) and then recrystallised by
vapour diffusion of EtOH into H2O to give photosensitive green square bipyramidal
and rectangular prismatic crystals. Yield 1.983 g (90%). Elemental Analysis Found:
C, 15.02; H, 0.75. Calculated for C6H5FeK3O14.5: C, 14.94; H, 1.05. –ve ion mass
spectrum: (HR-ESI) MeCN [ML2]- m/z 231.9133 [100%] (calculated for [C4O8Fe1]
-,
231.8943), X2[M(L)3]- m/z 397.8266 [16%] (calculated for [C6O12K2Fe1]
-, 397.8014).
3.3.4.4 K3[Ru(ox)3]·xH2O Method 1
The synthesis of this complex via this method and method 2 (outlined in Section
3.3.4.5) followed the literature procedures of Beattie et al.288 Although not stated in
the paper, it is known that the process was conducted in the dark. A solution of
potassium hydroxide, KOH (0.747 g, 13.31 mmol) in H2O (1 cm3) was added
dropwise to a stirring solution of RuCl3·xH2O (1.046 g, 3.87 mmol for x = 3.5) in
H2O (20 cm3). After 15 mins the black Ru(OH)3·xH2O precipitate was isolated by
vacuum filtration and washed with H2O (8 × 200 cm3). The washings involved
vigorous stirring of the aqueous suspension of Ru(OH)3·xH2O for ca. 20 mins
followed by separation of the black tarry solid by vacuum filtration and testing of the
filtrate for the presence of Cl- anions with an aqueous solution AgNO3 (1 M). This
washing process required 7 hours. This hydroxide intermediate was then added to a
boiling aqueous solution of H2C2O4·2H2O (1.981 g, 15.71 mmol, 10 cm3) and heated
at reflux for 20 minutes at which point the black solid had dissolved and formed an
olive green solution. Powdered K2C2O4·H2O (1.082 g, 5.87 mmol) was added with
stirring to the hot solution and the resultant mixture heated at reflux for a further 20
mins, then cooled to ca. 40°C and poured onto EtOH (225 cm3) resulting in an
immediate yellow/green principate. This solid was then isolated via vacuum
CHAPTER 3
62
filtration, washed with ice cold EtOH (3 × 20 cm3) and then recrystallised by vapour
diffusion of EtOH into H2O to give olive green needles and a large amount of an
amorphous black pasty solid. Within 3 days the light/air-protected olive green
crystalline material decomposed to a black oil. Yield before recrystallisation 1.026 g
(48%).
3.3.4.5 K3[Ru(ox)3]·xH2O Method 2
A solution of RuCl3·xH2O (1.010 g, 3.74 mmol for x = 3.5) and K2C2O4·H2O
(2.360 g, 12.80 mmol) in H2O (20 cm3) was heated at reflux with vigorous stirring
for 7 hours, during which time the solution changed colour from black/brown to clear
olive green. Hot EtOH (50 cm3, ca. 70°C) was then quickly added resulting in the
immediate formation of a black solid, which was then filtered warm. The solid was
then redissolved in H2O (3 cm3) and the resulting solution triturated with EtOH (20
cm3). The precipitate was then isolated by vacuum filtration and the filtrate tested
with an aqueous solution of AgNO3 (1 M) for the presence of Cl- anions. The solid
was redissolved and reprecipitated once more, at which time the filtrate tested
negative for Cl- anions. As described in the previous method, the solid was isolated
via vacuum filtration, washed with ice cold EtOH (3 × 20 cm3) and then
recrystallised by vapour diffusion of EtOH into H2O to give olive green needles and
plates. Within 1 week the light/air-protected olive green crystalline material
decomposed to a black oil. Yield 1.348 g (65%). –ve ion mass spectrum: (HR-ESI)
MeCN [ML2]‾ m/z 277.8839 [100%] (calculated for [C4O8Ru1]
-, 277.8638),
X2[M(L)3]‾ m/z 443.7961 [11%] (calculated for [C6O12K2Ru1]
-, 443.7709),
X[M(L)3]2-
m/z 202.4206 [9%] (calculated for [C6O12K1Ru1]2-
, 202.4036).
3.3.4.6 K3[Rh(ox)3]·2H2O
The preparation of this complex followed the synthetic procedure of Coronado et
al.289 Freshly dried RhCl3 (1.008 g, 4.82 mmol after 1 hour in an oven at 110°C),
H2C2O4·2H2O (2.030 g, 16.11 mmol) and AgNO3 (2.049 g, 12.06 mmol) were
suspended in a 1:1 H2O:EtOH mixture (40 cm3) and heated to 85°C. After 3 hours a
white precipitate (most likely AgCl) formed and was separated from the bright
orange solution by hot gravity filtration. Solid K2C2O4·H2O (1.242 g, 6.74 mmol)

CHAPTER 3
63
was then added to the filtrate and the resulting mixture heated for another 2 hours at
85°C. The solution was then left to cool slightly (ca. 40°C), filtered through Celite®
and then poured over EtOH (250 cm3) immediately precipitating a pale yellow solid.
This solid was then isolated via vacuum filtration, washed with ice cold EtOH (4 ×
20 cm3) and then recrystallised by vapour diffusion of EtOH into H2O to give bright
orange prismatic crystals. Yield 1.856 g (74%). Elemental Analysis Found: C, 13.84;
H, 0.70. Calculated for C6H4K3O14.Rh: C, 13.85; H, 0.77. –ve ion mass spectrum:
(HR-ESI) MeCN X[M(L)3]2-
m/z 202.9328 [8%] (calculated for [C6O12K1Rh1]2-
,
202.9041), X2[M(L)3]‾ m/z 444.7969 [7%] (calculated for [C6O12K2Rh1]
-, 444.7719),
[ML2]‾ m/z 278.8831 [1%] (calculated for [C4O8Rh1]
-, 278.8648).
3.3.5 Binary co-crystallisation experiments
The binary co-crystallisation experiments discussed within this thesis fit into
three general categories. The first are experiments between cationic metal complexes
of the type [MII(L)n]
2+, and are described first. Then experiments between anionic
[MIII
(ox)3]3-
metal complexes are described. Finally, experiments involving metal
complex cations and metal complex anions are described.
3.3.5.1 Binary co-crystallisation experiments involving [MII(terpyR)2]
2+
complexes
The general co-crystallisation protocol was the same for all cationic metal
complexes, and is described as follows. The two complexes to be co-crystallised
(totalling ca. 20-100 mg) were accurately weighed into two separate glass vials. The
complexes were then dissolved in the appropriate solvent or solvent mixture before
being combined by the dropwise addition of the solution of one complex to the other.
The solutes in the resultant co-solution were then crystallised via the appropriate
method (usually slow of evaporation of 1:1 MeCN:H2O) to yield single co-crystals,
which contained both complexes (after ca. 2 days). The crystallised sample was then
visually assessed under an optical microscope equipped with a polariser for evidence
of co-crystallisation. Attributes that were noted were crystal habit(s), colour(s) and
twinning or aggregation. If co-crystallisation was thought to have occurred (as
evident from microscope observations), representative single crystals were then
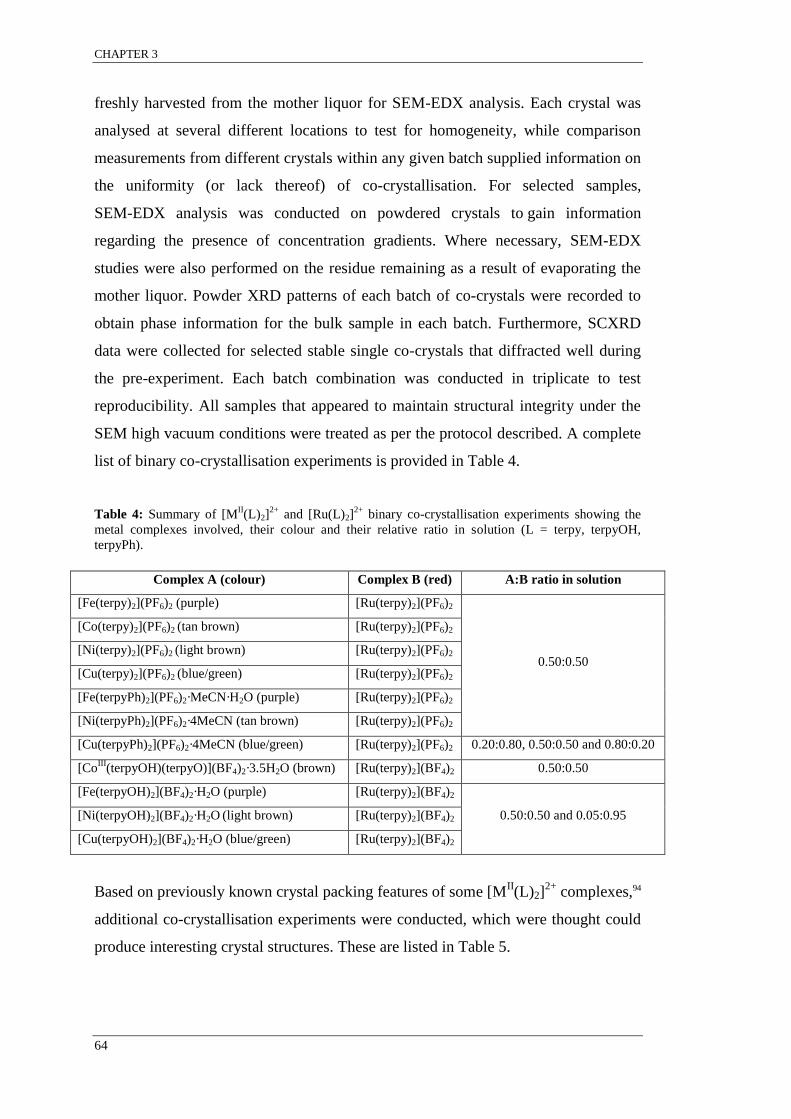
CHAPTER 3
64
freshly harvested from the mother liquor for SEM-EDX analysis. Each crystal was
analysed at several different locations to test for homogeneity, while comparison
measurements from different crystals within any given batch supplied information on
the uniformity (or lack thereof) of co-crystallisation. For selected samples,
SEM-EDX analysis was conducted on powdered crystals to gain information
regarding the presence of concentration gradients. Where necessary, SEM-EDX
studies were also performed on the residue remaining as a result of evaporating the
mother liquor. Powder XRD patterns of each batch of co-crystals were recorded to
obtain phase information for the bulk sample in each batch. Furthermore, SCXRD
data were collected for selected stable single co-crystals that diffracted well during
the pre-experiment. Each batch combination was conducted in triplicate to test
reproducibility. All samples that appeared to maintain structural integrity under the
SEM high vacuum conditions were treated as per the protocol described. A complete
list of binary co-crystallisation experiments is provided in Table 4.
Table 4: Summary of [MII(L)2]
2+ and [Ru(L)2]
2+ binary co-crystallisation experiments showing the
metal complexes involved, their colour and their relative ratio in solution (L = terpy, terpyOH,
terpyPh).
Complex A (colour) Complex B (red) A:B ratio in solution
[Fe(terpy)2](PF6)2 (purple) [Ru(terpy)2](PF6)2
0.50:0.50
[Co(terpy)2](PF6)2 (tan brown) [Ru(terpy)2](PF6)2
[Ni(terpy)2](PF6)2 (light brown) [Ru(terpy)2](PF6)2
[Cu(terpy)2](PF6)2 (blue/green) [Ru(terpy)2](PF6)2
[Fe(terpyPh)2](PF6)2·MeCN·H2O (purple) [Ru(terpy)2](PF6)2
[Ni(terpyPh)2](PF6)2·4MeCN (tan brown) [Ru(terpy)2](PF6)2
[Cu(terpyPh)2](PF6)2·4MeCN (blue/green) [Ru(terpy)2](PF6)2 0.20:0.80, 0.50:0.50 and 0.80:0.20
[CoIII
(terpyOH)(terpyO)](BF4)2·3.5H2O (brown) [Ru(terpy)2](BF4)2 0.50:0.50
[Fe(terpyOH)2](BF4)2·H2O (purple) [Ru(terpy)2](BF4)2
0.50:0.50 and 0.05:0.95 [Ni(terpyOH)2](BF4)2·H2O (light brown) [Ru(terpy)2](BF4)2
[Cu(terpyOH)2](BF4)2·H2O (blue/green) [Ru(terpy)2](BF4)2
Based on previously known crystal packing features of some [MII(L)2]
2+ complexes,94
additional co-crystallisation experiments were conducted, which were thought could
produce interesting crystal structures. These are listed in Table 5.
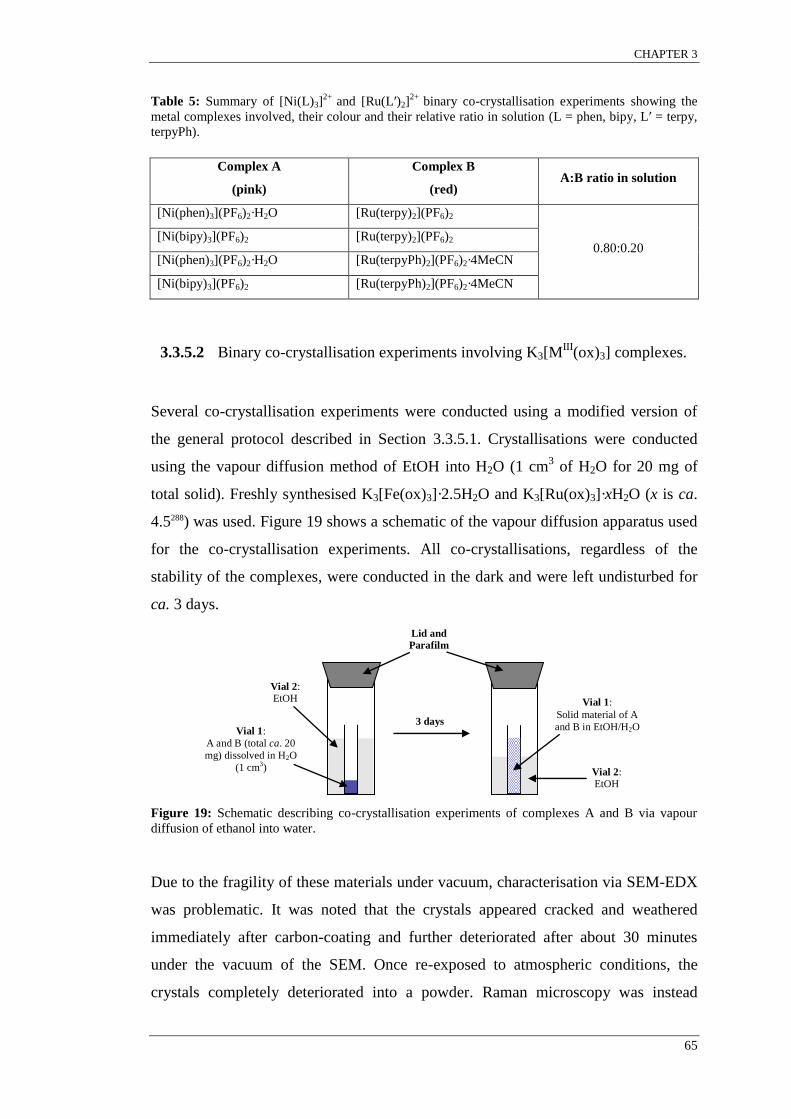
CHAPTER 3
65
Table 5: Summary of [Ni(L)3]2+
and [Ru(L′)2]2+
binary co-crystallisation experiments showing the
metal complexes involved, their colour and their relative ratio in solution (L = phen, bipy, L′ = terpy,
terpyPh).
Complex A
(pink)
Complex B
(red) A:B ratio in solution
[Ni(phen)3](PF6)2·H2O [Ru(terpy)2](PF6)2
0.80:0.20 [Ni(bipy)3](PF6)2 [Ru(terpy)2](PF6)2
[Ni(phen)3](PF6)2·H2O [Ru(terpyPh)2](PF6)2·4MeCN
[Ni(bipy)3](PF6)2 [Ru(terpyPh)2](PF6)2·4MeCN
3.3.5.2 Binary co-crystallisation experiments involving K3[MIII
(ox)3] complexes.
Several co-crystallisation experiments were conducted using a modified version of
the general protocol described in Section 3.3.5.1. Crystallisations were conducted
using the vapour diffusion method of EtOH into H2O (1 cm3 of H2O for 20 mg of
total solid). Freshly synthesised K3[Fe(ox)3]·2.5H2O and K3[Ru(ox)3]·xH2O (x is ca.
4.5288) was used. Figure 19 shows a schematic of the vapour diffusion apparatus used
for the co-crystallisation experiments. All co-crystallisations, regardless of the
stability of the complexes, were conducted in the dark and were left undisturbed for
ca. 3 days.
Figure 19: Schematic describing co-crystallisation experiments of complexes A and B via vapour
diffusion of ethanol into water.
Due to the fragility of these materials under vacuum, characterisation via SEM-EDX
was problematic. It was noted that the crystals appeared cracked and weathered
immediately after carbon-coating and further deteriorated after about 30 minutes
under the vacuum of the SEM. Once re-exposed to atmospheric conditions, the
crystals completely deteriorated into a powder. Raman microscopy was instead
Vial 1:
A and B (total ca. 20
mg) dissolved in H2O
(1 cm3)
Vial 2: EtOH
Lid and
Parafilm
3 days
Vial 1:
Solid material of A
and B in EtOH/H2O
Vial 2: EtOH

CHAPTER 3
66
employed as the primary characterisation technique for quantitative analysis using
the position of the carbonyl stretching frequency. Each single co-crystal was
prepared and characterised individually before the next was harvested from solution.
Once viewed under an optical microscope, selected crystals were removed from the
mother liquor and placed on the stage of the Raman microscope. Although under low
magnification the single crystals appeared to be well formed with lustrous faces and
sharp edges, it was evident under higher magnification that the faces possessed
several defects. Therefore, after viewing each face under the Raman microscope,
crystals were oriented so that the smoothest face was analysed. It was discovered that
these defects acted as fault lines once the crystals were out of the mother liquor (ca.
24 hours) and so it was important that the measurements be completed in the shortest
amount of time. The selected face was then photographed using the WiRE Raman
Renishaw software and then analysed at 3-4 different positions using optimised
measurement conditions and noting the location of each measurement.* The
photograph was then used to trace out regions for line and two-dimensional
mapping.†
A select few samples were subjected to Confocal Raman microscopy
depth-profile mapping.‡ This variation on the usual Raman technique required ca.
15-20 hours and was conducted following line and area maps.
Once the Raman measurements were completed the crystal was then carefully
mounted to have the same surface facing up and then prepared for SEM-EDX as
described earlier. Where possible, EDX measurements were taken from the same
locations as the Raman measurements for the purpose of validating the quantitative
use of the carbonyl stretching band in the Raman spectrum. EDX analysis was
limited to 30 minutes per crystal. A full discussion regarding the use of Raman
microscopy for quantitative analysis can be found in Section 5.2.1. A summary of
co-crystallisation experiments showing all metal complexes involved, their relative
*Spectra were recorded using a 50× long working distance objective with a 785 nm laser at 10%
power (as any greater power damaged the sample) co-adding triplicate 20 second measurements. Full
spectra were measured using the extended method while spectra between 1300-1800 cm-1
were taken
using the static method. †Line and area maps were obtained from a series of static scans with an exposure time of 10 seconds
(usually 5-10 µm apart for line maps and square areas of 20 × 20 µm to 50 × 50 µm for area maps)
using the same objective and laser power. ‡ Confocal Raman spectra were recorded at 100% laser power starting from depths of up to 500 µm.
Spectra were taken at 50 µm intervals using the static method with exposure times 45-60 minutes.
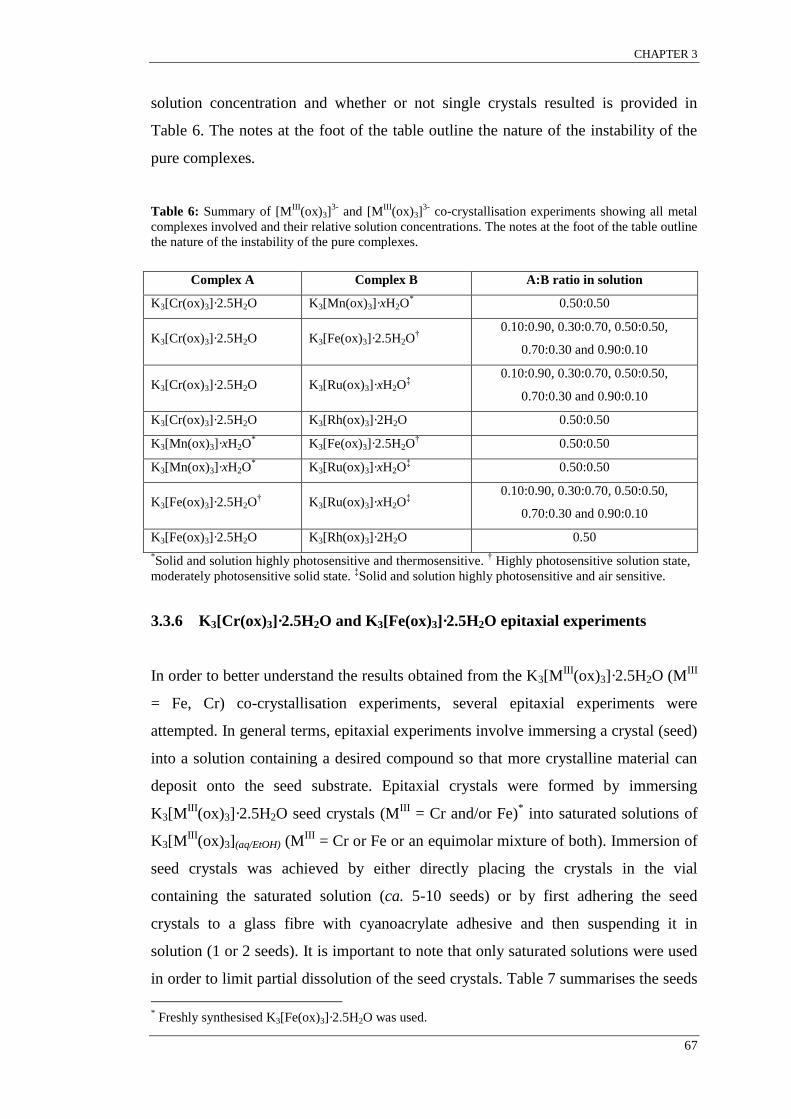
CHAPTER 3
67
solution concentration and whether or not single crystals resulted is provided in
Table 6. The notes at the foot of the table outline the nature of the instability of the
pure complexes.
Table 6: Summary of [MIII
(ox)3]3-
and [MIII
(ox)3]3-
co-crystallisation experiments showing all metal
complexes involved and their relative solution concentrations. The notes at the foot of the table outline
the nature of the instability of the pure complexes.
3.3.6 K3[Cr(ox)3]·2.5H2O and K3[Fe(ox)3]·2.5H2O epitaxial experiments
In order to better understand the results obtained from the K3[MIII
(ox)3]·2.5H2O (MIII
= Fe, Cr) co-crystallisation experiments, several epitaxial experiments were
attempted. In general terms, epitaxial experiments involve immersing a crystal (seed)
into a solution containing a desired compound so that more crystalline material can
deposit onto the seed substrate. Epitaxial crystals were formed by immersing
K3[MIII
(ox)3]·2.5H2O seed crystals (MIII
= Cr and/or Fe)* into saturated solutions of
K3[MIII
(ox)3](aq/EtOH) (MIII
= Cr or Fe or an equimolar mixture of both). Immersion of
seed crystals was achieved by either directly placing the crystals in the vial
containing the saturated solution (ca. 5-10 seeds) or by first adhering the seed
crystals to a glass fibre with cyanoacrylate adhesive and then suspending it in
solution (1 or 2 seeds). It is important to note that only saturated solutions were used
in order to limit partial dissolution of the seed crystals. Table 7 summarises the seeds
* Freshly synthesised K3[Fe(ox)3]·2.5H2O was used.
Complex A Complex B A:B ratio in solution
K3[Cr(ox)3]·2.5H2O K3[Mn(ox)3]·xH2O*
0.50:0.50
K3[Cr(ox)3]·2.5H2O
K3[Fe(ox)3]·2.5H2O†
0.10:0.90, 0.30:0.70, 0.50:0.50,
0.70:0.30 and 0.90:0.10
K3[Cr(ox)3]·2.5H2O K3[Ru(ox)3]·xH2O‡
0.10:0.90, 0.30:0.70, 0.50:0.50,
0.70:0.30 and 0.90:0.10
K3[Cr(ox)3]·2.5H2O K3[Rh(ox)3]·2H2O 0.50:0.50
K3[Mn(ox)3]·xH2O* K3[Fe(ox)3]·2.5H2O
† 0.50:0.50
K3[Mn(ox)3]·xH2O*
K3[Ru(ox)3]·xH2O‡
0.50:0.50
K3[Fe(ox)3]·2.5H2O†
K3[Ru(ox)3]·xH2O‡
0.10:0.90, 0.30:0.70, 0.50:0.50,
0.70:0.30 and 0.90:0.10
K3[Fe(ox)3]·2.5H2O K3[Rh(ox)3]·2H2O 0.50
*Solid and solution highly photosensitive and thermosensitive.
† Highly photosensitive solution state,
moderately photosensitive solid state. ‡Solid and solution highly photosensitive and air sensitive.
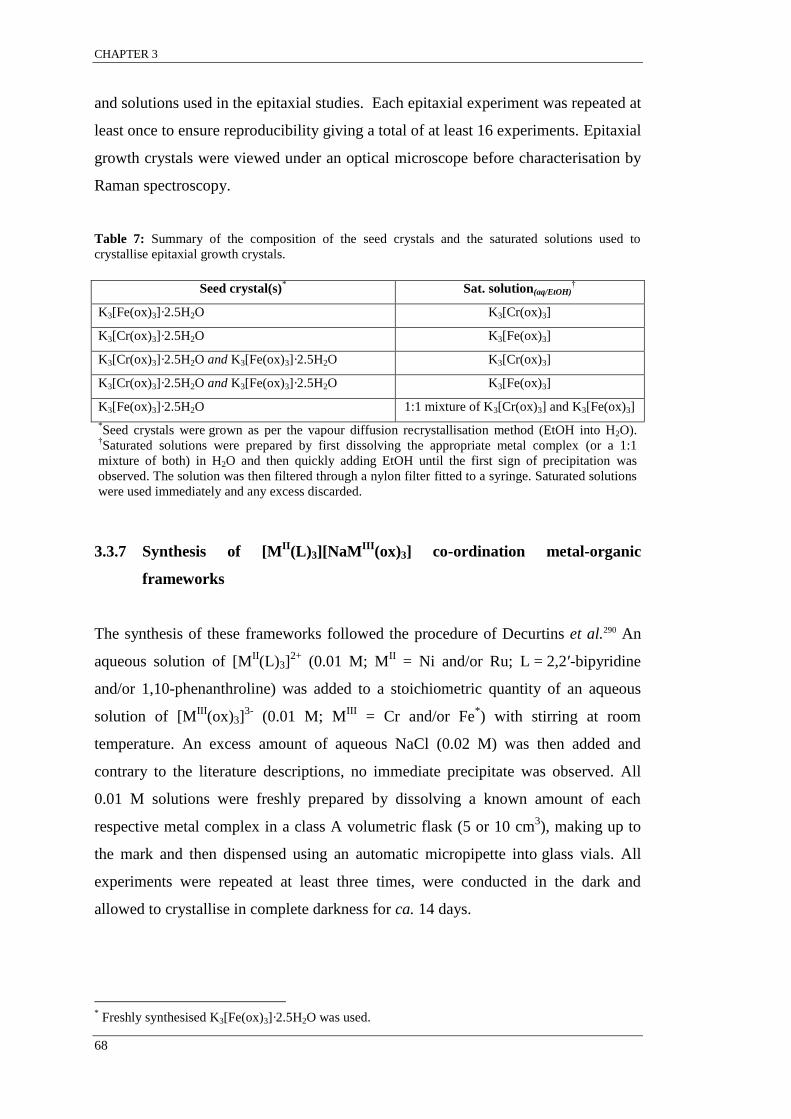
CHAPTER 3
68
and solutions used in the epitaxial studies. Each epitaxial experiment was repeated at
least once to ensure reproducibility giving a total of at least 16 experiments. Epitaxial
growth crystals were viewed under an optical microscope before characterisation by
Raman spectroscopy.
Table 7: Summary of the composition of the seed crystals and the saturated solutions used to
crystallise epitaxial growth crystals.
Seed crystal(s)
* Sat. solution(aq/EtOH)
†
K3[Fe(ox)3]·2.5H2O K3[Cr(ox)3]
K3[Cr(ox)3]·2.5H2O K3[Fe(ox)3]
K3[Cr(ox)3]·2.5H2O and K3[Fe(ox)3]·2.5H2O K3[Cr(ox)3]
K3[Cr(ox)3]·2.5H2O and K3[Fe(ox)3]·2.5H2O K3[Fe(ox)3]
K3[Fe(ox)3]·2.5H2O 1:1 mixture of K3[Cr(ox)3] and K3[Fe(ox)3]
*Seed crystals were grown as per the vapour diffusion recrystallisation method (EtOH into H2O).
†Saturated solutions were prepared by first dissolving the appropriate metal complex (or a 1:1
mixture of both) in H2O and then quickly adding EtOH until the first sign of precipitation was
observed. The solution was then filtered through a nylon filter fitted to a syringe. Saturated solutions
were used immediately and any excess discarded.
3.3.7 Synthesis of [MII
(L)3][NaMIII
(ox)3] co-ordination metal-organic
frameworks
The synthesis of these frameworks followed the procedure of Decurtins et al.290 An
aqueous solution of [MII(L)3]
2+ (0.01 M; M
II = Ni and/or Ru; L = 2,2′-bipyridine
and/or 1,10-phenanthroline) was added to a stoichiometric quantity of an aqueous
solution of [MIII
(ox)3]3-
(0.01 M; MIII
= Cr and/or Fe*) with stirring at room
temperature. An excess amount of aqueous NaCl (0.02 M) was then added and
contrary to the literature descriptions, no immediate precipitate was observed. All
0.01 M solutions were freshly prepared by dissolving a known amount of each
respective metal complex in a class A volumetric flask (5 or 10 cm3), making up to
the mark and then dispensed using an automatic micropipette into glass vials. All
experiments were repeated at least three times, were conducted in the dark and
allowed to crystallise in complete darkness for ca. 14 days.
* Freshly synthesised K3[Fe(ox)3]·2.5H2O was used.

CHAPTER 3
69
To avoid any possibility of ligand exchange, combinations with both
K3[Fe(ox)3]·2.5H2O and [Ni(L)3]Cl2·xH2O were avoided due to the labile nature of
the metals. Samples were analysed by SEM-EDX; however, only samples that
retained crystallinity were analysed using XRD techniques. A summary of the co-
crystallisation experiments showing all of the metal complexes involved and the
formula (where known) of the resulting co-crystalline co-ordination framework is
provided in Table 8.
Table 8: Summary of co-crystallisation experiments between [MII(L)3]
2+ and [M
III(ox)3]
3- showing all
metal complexes involved and their relative ratios in solution. Aqueous NaCl (0.02 M) was added to
each experiment.
Complexes involved in dilution (xsolution = 0.50) Counterion Complex
Complex A* Complex B
* Complex C
* A:B:C ratio in solution
Homoleptic dilutions: Co-crystallisation of [MII(bipy)3]
2+ with [M
III(ox)3]
3-
[Ni(bipy)3]Cl2 [Ru(bipy)3]Cl2 K3[Cr(ox)3] 0.50:0.50:1
K3[Cr(ox)3] K3[Fe(ox)3] [Ru(bipy)3]Cl2 0.50:0.50:1
Homoleptic dilutions: Co-crystallisation of [MII(phen)3]
2+ with [M
III(ox)3]
3-
[Ni(phen)3]Cl2
[Ru(phen)3]Cl2 K3[Cr(ox)3] 0.50:0.50:1
K3[Cr(ox)3]
K3[Fe(ox)3] [Ru(phen)3]Cl2 0.50:0.50:1
Different ligand dilutions: Co-crystallisation of [MII
(L)3]2+
(L = bipy, phen) with [MIII
(ox)3]3-
[Ni(bipy)3]Cl2 [Ru(phen)3]Cl2 K3[Cr(ox)3] 0.50:0.50:1
[Ni(phen)3]Cl2 [Ru(bipy)3]Cl2 K3[Cr(ox)3] 0.50:0.50:1 *Metal complex hydrates were used. The hydration of each complex is not shown but was accounted for
when preparing the solutions.

CHAPTER 4
70
CHAPTER 4: Co-crystallisation systems incorporating
[MII
(terpyR)2]2+
complexes
4.1 Background: The [MII
(terpyR)2]X2 metal complexes and the terpy motif
The compound 2,2′:6′,2′′-terpyridine (terpy), for which the chemical structure and
numbering system are shown in Figure 20, was first synthesised by Morgan and
Burstall in 1932, by the oxidative coupling of pyridine using anhydrous ferric
chloride.291 This group was also the first to report the coordination of a metal to terpy
by synthesising a variety of mononuclear and trinuclear platinum complexes, with
various mono-anionic species included in the coordination sphere and/or acting as
counter ions.292 Five years later Morgan and Burstall (1937) reported the first
syntheses of bis-terpy complexes with the formula [MII(terpy)2]X2 (M
II = Cr, Fe, Co,
Ni, Ru, Os; X = Cl-, Br
-).293 The introduction, results and discussion presented in this
chapter refer to complexes of the formula [MII(terpyR)2]X2, where M
II is a first or
second row transition metal, terpyR is either the unsubstituted terpy (R = H) or the
4′-functionalised terpyOH or terpyPh ligand and X = small mono-anionic
counterion.
Figure 20: The structure of 2,2′:6′,2′′-terpyridine (terpy) showing the atom numbering of each pyridyl
ring. The two outer rings are denoted Ro while the central pyridyl ring is labelled R
c. Note the
4′-carbon position, which may be substituted and written in formulae as (terpyR; R = OH, Ph).
The following discussion aims to outline the key features of [MII(terpyR)2]
2+
complexes and the terpy motif. Many of the [MII(terpyR)2]
2+ complexes used during
this research exhibit the same features and interact through the same supramolecular
chemical interactions as those introduced here.
Terpy most commonly behaves as a meridional-N3-tridentate chelating ligand,
coordinating to the metal. Thus, for di-cationic transition metals that form octahedral
complexes, two terpy ligands complete the coordination sphere to make
4'
4 4''
1
3
5
6
1'
3' 5'
1''
3''
5''
6''
N
N N
Ro
Rc
Ro

CHAPTER 4
71
[MII(terpy)2]
2+ species. Typical N-M-N′ bond angles for these types of complexes are
less than 90° and as such, they often display a distorted octahedral geometry.* 294-303
The dimensions of [MII(terpy)2]
2+ units vary depending on the nature of the
coordinating metal.† Figure 21 shows the orthogonal arrangement of the two terpy
ligands in [MII(terpy)2]
2+ complexes as viewed perpendicular to and along the S4
axis.
Figure 21: The orthogonal arrangement of the terpy ligands of typical [MII(terpy)2]
2+ cations as
viewed perpendicular to the S4 axis (left) and along the S4 axis (right). Carbon atoms are represented
in green, hydrogen atoms in white, nitrogen atoms in blue and the metal ion in red.
As a consequence of this orthogonal arrangement, [MII(terpy)2]
2+ complexes are able
to engage in a parallel 4-fold aryl embrace (P4AE) consisting of one OFF and two
EF interactions per complex pair in the solid state (Figure 22). This specific set of
interactions, which is now known as the terpy embrace or primary terpy motif, was
first observed by Figgis et al. in 1983 as a common crystal packing arrangement
adopted by [Co(terpy)2]2+
complexes.294
* The N-M-N′ bond angles (measured from reported crystal structures) appear to be consistent for
each different metal ion (within 2°) except for [Co(terpy)2]2+
complexes, which have N-M-N′ angles
ranging from 76-84°. † A more in-depth explanation regarding the dimensions of [M
II(terpy)2]
2+ complexes can be found in
the results section of this chapter (Section 4.3.1).
S4
axisS4
axis

CHAPTER 4
72
Figure 22: The terpy embrace motif between a pair of [M
II(terpy)2]
2+ complexes. The ligands
involved in the OFF interaction lie in parallel planes (outlined in red box and red double-headed
arrow), while EF interactions involve ligands perpendicular to each other (yellow single-headed
arrows). The EF interactions occur orthogonally to the OFF interactions. For each type of interaction
it is only the Ro pyridyl rings involved. The R
c rings, although not involved in either interaction,
create the walls of voids giving rise to deep and shallow grooves that are capable of accommodating
solvates and counterions. Deep grooves are framed by parallel faces of Rc rings (blue shaded area),
while shallow grooves are bordered by the hydrogen atoms of Rc and R
o rings (pink shaded area).
More recently, in-depth crystal packing analysis has revealed the terpy motif to be
prevalent among, [MII(terpy)2]
2+, [M
II(terpyOH)2]
2+ and many [M
II(terpy-like)2]
2+
complexes.*32,34,94,121,271,294 These interactions arrange the complexes in a
two-dimensional grid-like array called the two-dimensional (2D) terpy embrace. This
grid structure is shown in Figure 23 and Figure 24.
Figure 23: Ball and stick representation showing the interactions between four [MII(terpy)2]
2+
complexes leading to the “infinite” grid-like structure called the two-dimensional (2D) terpy embrace.
As with previous figures, OFF interactions are represented by the double-headed red arrows, while
single-headed yellow arrows represent EF interactions. This motif propagates in all four directions, as
indicated by the solid black arrows. Hydrogen atoms have been omitted for visual clarity.
*[M
II(terpy-like)2]
2+ complexes are complexes that have similar structures and geometries to the
archetypal [MII(terpy)2]
2+ complexes. These “terpy-like” compounds are typically
meridional-N3-tridentate ligands with terminal five or six membered N-heterocycle groups.
Deep groove
Shallow
groove
Deep groove
Shallow
groove

CHAPTER 4
73
Figure 24: Space-filled representation of an expanded 2D terpy embrace layer containing nine
[MII(terpy)2]
2+ complexes as viewed from the top (left), side (centre) and bottom (right). The black
dotted squares (shown in the top and bottom views) highlight the four complexes represented in
Figure 23. Deep grooves are not fully boxed in by complex pairs but instead are segmented into
staggered cavities (Rc cavities shown by the transparent white boxes in the diagram on the far left).
The l × w × d of these cavities are ca. 7.0 × 5.0 × 4.5 Å and link together to form a linear groove
(thick blue rectangle) that runs the length of the 2D grid. Shallow grooves (thin pink rectangle) are
also continuous and run perpendicular to deep grooves on the same surface. On the opposite side, like
grooves are perpendicular to each other as evident by comparing top and bottom views.
The 2D layers of complexes exhibiting the 2D terpy embrace stack to form
three-dimensional (3D) structures. The displacement of adjacent 2D layers in a
direction parallel to the lattice plane is a distinctive trait shared by all [MII(terpy)2]X2
and [MII(terpyOH)2]X2 structures, where X is a small monoanion such as BF4
-. This
stacking arrangement allows a portion of the Rc pyridyl ring of complexes in one
layer to protrude slightly into the grooves of a neighbouring layer. Thus, the groove
(deep or shallow), which is partially occupied, depends on one of three stacking
variations of the layers.*32,271 Analyses of literature crystal structures revealed that
deep grooves were also able to completely house relatively small counterions, such
as NO3-, ClO4
-, BF4
-, PF6
- and sometimes include small solvent molecules, such as
water. These anion and solvent molecules in [MII(terpyOH)2]X2 structures form
hydrogen bonds with the hydroxyl group of the terpyOH ligand. These interlayer
hydrogen bond arrangements are not present for [MII(terpy)2]X2 as there are no
hydroxyl groups on the unsubstituted terpy ligand. Despite this difference, the same
interlayer distances were found for [MII(terpyOH)2]X2 as those found for
[MII(terpy)2]X2 (ca. 10Å) indicating that the 4′-functionalisation of the terpy ligand
with an OH group had little steric effect on the stacking of the 2D layers.271
* The three main stacking variations are; 1) parallel, where the planes of the ligands in adjacent layers
are parallel to each other and are related by inversion or reflection symmetry; 2) angled, where the
ligand planes in complexes of neighbouring layers stack at ca. 45° to one another and are related by 21
screw symmetry 3) perpendicular, where the planes of the ligands in contiguous layers are at 90° to
one another.
Deep grooves
Shallow grooves
Rc cavity
Deep grooves
Shallow grooves
Deep grooves
Shallow grooves
Rc cavityRc cavity

CHAPTER 4
74
The supramolecular chemistry present in [MII(terpyPh)2]
2+ systems is more varied
than that in either [MII(terpy)2]
2+ and [M
II(terpyOH)2]
2+ systems. Nevertheless,
[MII(terpyPh)2]
2+ complex pairs interact through the same terpy embrace that is
observed between pairs of [MII(terpy)2]
2+ and [M
II(terpyOH)2]
2+ complexes.
Structures of [MII(terpyPh)2]
2+, are known to exhibit less robust analogues of the 2D
terpy embrace with interlayer separations as large as ca. 16 Å. These structures are
often highly solvated with volatile solvent molecules such as MeCN, which act as
space occupiers and lattice supports. Consequently, evaporation of these molecules
causes the lattice to collapse. Given that the grooves of one layer accommodate
counter-ions, solvate species and portions of metal complexes from adjacent layers, it
is not surprising that large substituents on the 4′-carbon atom of the Rc ring (such as a
phenyl group) disrupt the terpy motif.32-34,94,121,266,271,304,305
Although the 2D terpy embrace motif is prevalent among most [MII(terpy)2]
2+ and
[MII(terpyOH)2]
2+ systems, the various structures that form belong to a multitude of
space groups ranging from low symmetry triclinic P1̄ to high symmetry P4̄21c
tetragonal space groups. The differences in symmetry present for the various
structures are usually due to the size and complexity of counterions and the nature of
the crystallising solution. Table 9 summarises the various [MII(terpy)2]
2+ and
[MII(terpyOH)2]
2+ crystal structures that have small counterions such as PF6
-, which
are available in the CSD (in chronological order of publication).51 For many of the
structures in Table 9, the positions of counterions and solvate species were found to
be rotationally disordered.

CHAPTER 4
75
Table 9: Summary of crystal structures (in chronological order of publication) of [MII(terpy)2]
2+, and
[MII(terpyOH)2]
2+ complexes.
CSD REFCODE Year Compound Formula Space Group
TERPYC01 1971 [Cu(terpy)2](NO3)2 I41/a
TPYCOB 1974 [Co(terpy)2]Br2·3H2O P1̄
TERPCO 1976 [Co(terpy)2](SCN)2·2H2O P1̄
BEJPUB 1982 [Cu(terpy)2](PF6)2 P4̄21c
BIKJUA 1982 [Ni(terpy)2](PF6)2 P212121
BIYJOI 1982 [Co(terpy)2](ClO4)2·0.5H2O I41/a
CAPSAN 1983 [Co(terpy)2](ClO4)2·H2O I41/a
CASXID* 1983 [Co(terpy)2]I2·2H2O P42/n
DANMOU 1985 [Fe(terpy)2](ClO4)2·H2O P21
FADJAW 1986 [Co(terpy)2](NO3)2·2H2O I41/a
SIBWEF 1990 [Cu(terpy)2]Br2·3H2O P1̄
ZARNIP 1995 [Ni(terpy)2](ClO4)2·H2O P21
GOGDIP† 1998 [Ru(terpy)2](ClO4)2·H2O I41/a
GOGDOV 1998 [Os(terpy)2](ClO4)2·0.5H2O P21/n
LOCREA 1999 [Ru(terpy)2](PF6)2·Me2CO P21/c
SUVGAR 1999 [Ru(terpy)2](PF6)2·MeCN P41
BIYJOI01 2001 [Co(terpy)2](ClO4)2·0.5H2O P42/n
NELKEU 2001 [Cu(terpy)2](ClO4)2·H2O I41/a
XENWAO 2001 [Mn(terpy)2](ClO4)2·0.5H2O P43
XENWES 2001 [Fe(terpy)2](ClO4)2·0.5H2O P21
WOWZEN 2001 [Co(terpyOH)2]I2·H2O P21
BINZAA 2004 [Mn(terpy)2](NO3)2·2H2O I41/a
XAHLIC 2004 [Mn(terpy)2]I2·3H2O P21/n
CAPXUN 2005 [Fe(terpyOH)2](BF4)2·H2O P1̄
CAPYEY 2005 [Ru(terpyOH)2](BF4)2·H2O P1̄
CAPYIC 2005 [Cu(terpyOH)2](BF4)2·H2O P21
CAPYOI 2005 [Ni(terpyOH)2](BF4)2 P212121
CAZJUJ 2005 [Ru(terpy)2]Cl2·6H2O P21/c
NAVGEX 2005 [Ni(terpyOH)2](N(CN)2)2·H2O P1̄
XAJVOU 2005 [Ni(terpy)2](PF6)2·DMF P21/n
XAJVUA 2005 [Ni(terpy)2](PF6)2·Me2CO P212121
XAMMUU 2005 [Ni(terpy)2](NO3)2·0.5H2O I41/a
PEJHOC 2006 [Co(terpyOH)2](BF4)2·H2O P21
PEJHOC01 2006 [Co(terpyOH)2](BF4)2·H2O P1̄
PEJJIY 2006 [Co(terpyOH)2]I2·H2O P21/c

CHAPTER 4
76
PEJJOE 2006 [Co(terpyO)(terpyOH)](PF6)2 P21/c
LIDTUO 2007 [Zn(terpy)2](NO3)2·2H2O P42/n
MIWQAL§ 2008 [Mn(terpyOH)2](ClO4)2 P21/n
GUHPIJ 2009 [Ru(terpy)2]Cl2·DCM P21/c
QUNZAB 2009 [Ru(terpy)2](BF4)2 Cc
FAGGOL 2010 [Ni(terpy)2]SO4·nPrOH I4̄
FAGHAY 2010 [Ni(terpyOH)2]SO4·EtOH·MeOH·0.5H2O P1̄
WALVEM‡ 2010 [Co(terpy)2](BF4)2 Cc
XAHFAP 2010 [Co(terpy)2](PF6)2·MeCN P43
OMUTUM 2011 [Cd(terpy)2](NO3)2·2H2O I41/a
BARRAP 2012 [Ni(terpy)2](PF6)2·MeCN P41
*Measured at 120 and 295 K.
†No coordinates available.
‡Measured at 30, 100, 150, 200, 250, 300,
325, 350 and 375 K. §Measured at 100 and 150K
4.2 Background: Previous research into the co-crystallisation of [MA(L)n]X2
with [MB(L)n]X2 to form [M
AxM
B1-x(L)n]X2 co-crystals.
As introduced in Section 1.6.3, members of the McMurtrie group have over the past
few years focused on the use of supramolecular motifs to form single co-crystals of a
predictable structure containing two or more different metal complexes. Single
co-crystals of the general formula [MA
xMB
1-x(L)n]X2 were prepared from solutions
containing various relative ratios of [MA(L)n]X2 to [M
B(L)n]X2 (M
A, M
B = different
first or second row transition metals, L = polypyridyl ligands such as
1,10-phenanthroline and X = monoanion such PF6-). In addition to the binary
homoleptic systems of [MA
xMB
1-x(phen)3](PF6)2 and [MA
xMB
1-x(bipy)3](PF6)2 that
were mentioned in Section 1.6.3, experiments also included heteroleptic systems
such as [MA(phen)3]x[M
B(phen)2(bipy)]1-x(PF6)2 and
[MA(bipy)3]x[M
B(phen)2(bipy)]1-x(PF6)2 and different ligand combinations, such as
[MA(bipy)3]x[M
B(phen)3]1-x(PF6)2.
* Results from these systems demonstrated that
through the exploitation of known crystalline supramolecular motifs, it was possible
to form co-crystals that contained different metal complexes.261,306,307
* Homoleptic co-crystallisation experiments refer to systems in which all metal complexes have
identical ligands and therefore complexes only differ in the metal centre. Heteroleptic systems
involve metal complexes that have more than one type of ligand coordinated to the metal. The term
different ligand is used throughout this thesis to describe experiments involving different homoleptic
complexes co-crystallised together, i.e. the ligands of one complex are different to the ligands of the
other complex species.

CHAPTER 4
77
It was therefore hypothesised that systems with a dominant supramolecular motif,
such as those exhibiting the 2D terpy embrace, would be the most suitable for
co-crystallisation experiments due to the predictability afforded by co-crystallising
complexes capable of similar intermolecular interactions. Furthermore, robust motifs
such as the 2D terpy embrace are hypothesised to better tolerate the changes to the
crystal structure resulting from the incorporation of different metal complexes due to
the intermolecular interactions present between metal complex pairs.
Preliminary binary co-crystallisation experiments involving first row transition metal
systems bearing terpyridyl ligands of the type [MA
xMB
1-x(terpy)2]X2 and
[MA
xMB
1-x(terpyOH)2]X2 (MII = Fe, Co, Ni, Cu; X = PF6
-, BF4
-, I
-) were previously
conducted and the resulting co-crystals analysed by SEM-EDX.306 An example of the
data from one co-crystallisation series is shown in Figure 25. This figure plots the
SEM-EDX data measured from co-crystals of the general formula
[NixCu1-x(terpy)2](PF6)2, which were formed from solutions containing various ratios
of [Ni(terpy)2](PF6)2 relative to [Cu(terpy)2](PF6)2. The ratios of the metal complexes
in the co-crystallising solutions (batches) are shown on the x axis (xsolution = 0.10 to
0.90 in 0.10 increments), while the concentrations of metal complexes in the
co-crystals as determined by SEM-EDX are shown on the y axis (xsolid). The xsolution
and xsolid values pertain to the [Ni(terpy)2](PF6)2 concentration in the solution and
solid states respectively. The equation of the trend line, the standard errors for the
slope, y intercept and R2 correlation coefficient are also shown.
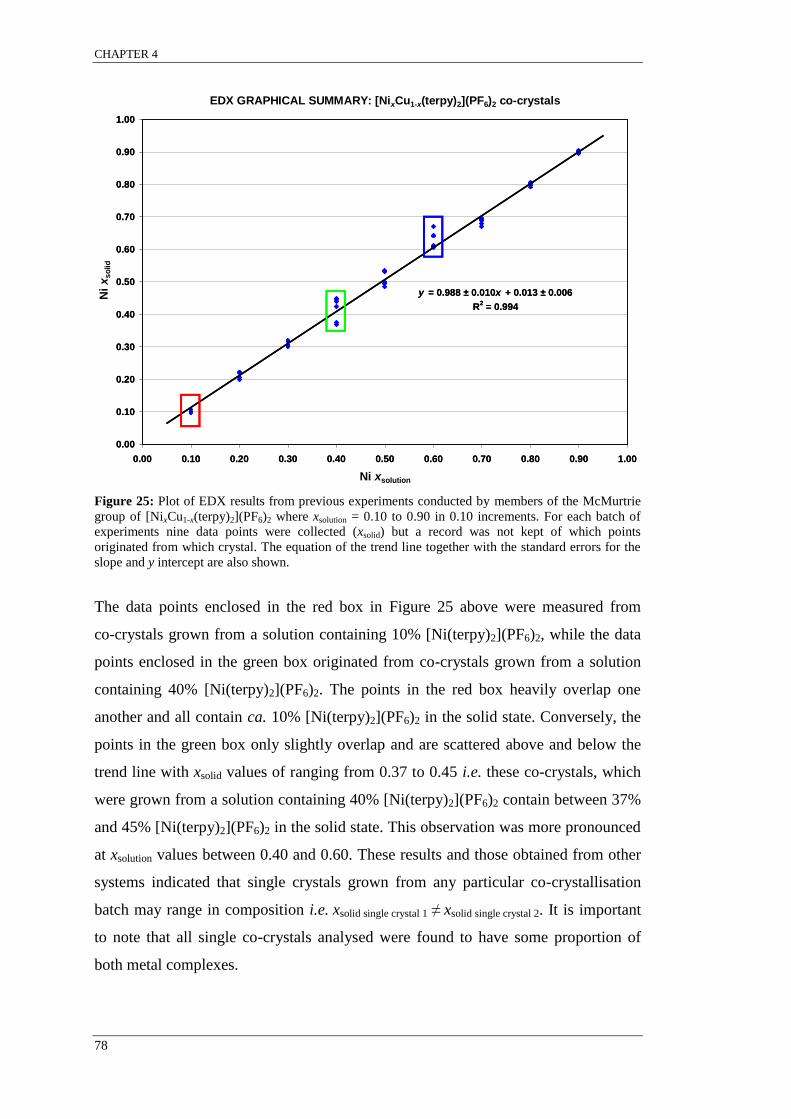
CHAPTER 4
78
Figure 25: Plot of EDX results from previous experiments conducted by members of the McMurtrie
group of [NixCu1-x(terpy)2](PF6)2 where xsolution = 0.10 to 0.90 in 0.10 increments. For each batch of
experiments nine data points were collected (xsolid) but a record was not kept of which points
originated from which crystal. The equation of the trend line together with the standard errors for the
slope and y intercept are also shown.
The data points enclosed in the red box in Figure 25 above were measured from
co-crystals grown from a solution containing 10% [Ni(terpy)2](PF6)2, while the data
points enclosed in the green box originated from co-crystals grown from a solution
containing 40% [Ni(terpy)2](PF6)2. The points in the red box heavily overlap one
another and all contain ca. 10% [Ni(terpy)2](PF6)2 in the solid state. Conversely, the
points in the green box only slightly overlap and are scattered above and below the
trend line with xsolid values of ranging from 0.37 to 0.45 i.e. these co-crystals, which
were grown from a solution containing 40% [Ni(terpy)2](PF6)2 contain between 37%
and 45% [Ni(terpy)2](PF6)2 in the solid state. This observation was more pronounced
at xsolution values between 0.40 and 0.60. These results and those obtained from other
systems indicated that single crystals grown from any particular co-crystallisation
batch may range in composition i.e. xsolid single crystal 1 ≠ xsolid single crystal 2. It is important
to note that all single co-crystals analysed were found to have some proportion of
both metal complexes.
SEM-EDX: Nix (solution) vs. Nix (solid) for [Nix Cu1-x (terpy)2](PF6)2 system
y = 0.988 ± 0.010x + 0.013 ± 0.006
R2 = 0.994
0.00
0.10
0.20
0.30
0.40
0.50
0.60
0.70
0.80
0.90
1.00
0.00 0.10 0.20 0.30 0.40 0.50 0.60 0.70 0.80 0.90 1.00
x solution
xs
oli
dN
i x
so
lid
Ni xsolution
EDX GRAPHICAL SUMMARY: [NixCu1-x(terpy)2](PF6)2 co-crystalsSEM-EDX: Nix (solution) vs. Nix (solid) for [Nix Cu1-x (terpy)2](PF6)2 system
y = 0.988 ± 0.010x + 0.013 ± 0.006
R2 = 0.994
0.00
0.10
0.20
0.30
0.40
0.50
0.60
0.70
0.80
0.90
1.00
0.00 0.10 0.20 0.30 0.40 0.50 0.60 0.70 0.80 0.90 1.00
x solution
xs
oli
dN
i x
so
lid
Ni xsolution
EDX GRAPHICAL SUMMARY: [NixCu1-x(terpy)2](PF6)2 co-crystals

CHAPTER 4
79
The points outlined by the blue box are also noteworthy. These measurements all lie
above 0.60. This result alone signified the possibility of a solubility bias between
complex species but in the presence of the other measurements it strongly indicates
that the sample size for this batch was too small. In fact, it likely that the sample
sizes from all of the batches for the system shown in Figure 25 and others were
insufficient especially given the range for the 0.50:0.50 batch was smaller than the
range of values for the batches shown either side of it.
It is important to note that all the data points in Figure 25 are represented by blue
markers because it was not noted which measurement originated from which
co-crystal. This was a major shortcoming of these preliminary experiments as results
generally suggested that xsolid ≠ xsolution yet it was unclear if the measurements within
a batch were from different regions on a single co-crystal or from different single
co-crystals. Furthermore, although several co-crystallisation experiments were
conducted, only some of the co-crystals were analysed by SEM-EDX, and none were
characterised by powder or single crystal XRD. Therefore, no information relating to
phase or structure was collected. Lastly, it is important to note that SEM-EDX is a
surface technique, analysing to depths of ca. 5 µm, and since crystals grow in three
dimensions it would be possible for measurements taken from the surface to differ
from measurements taken from the core. Differences between surface and core
measurements would imply the formation of co-crystals with concentration
gradients.
Therefore, experiments conducted within this work aimed to address these issues and
answer the questions raised from those preliminary experiments in order to better
understand the mechanism(s) driving co-crystal growth. Further research into the
composition, phase and crystal structure of [MA
xMB
1-x(terpyR)2]X2 single co-crystals
was the focus of the work presented here.
CHAPTER 4
80
4.3 Results and discussion
During this research several co-crystallisation experiments involving [MII(terpyR)2]
2+
complexes were conducted. Section 4.3.1 presents results obtained from homoleptic
experiments where [MII(terpy)2](PF6)2 complexes were co-crystallised with
[Ru(terpy)2](PF6)2, to form co-crystals of the general formula
[MII
xRu1-x(terpy)2](PF6)2 (MII = Fe, Co, Ni, Cu). Section 4.3.2 discusses the results
obtained from different ligand experiments where [MII(terpyOH)2](BF4)2 or
[CoIII
(terpyO)(terpyOH)](BF4)2 complexes were co-crystallised with
[Ru(terpy)2](BF4)2, to form co-crystals of the general formula
[MII(terpyOH)2]x[Ru(terpy)2]1-x(BF4)2 (M
II = Fe, Co, Ni, Cu). The results from
different ligand co-crystallisation experiments where [MII(terpyPh)2](PF6)2
complexes (MII = Fe, Ni, Cu) were co-crystallised with [Ru(terpy)2](PF6)2 and where
[Ru(terpyR)2](PF6)2 (terpyR = terpy, terpyPh) were co-crystallised with either
[Ni(phen)2](PF6)2 or [Ni(bipy)2](PF6)2 are discussed in Section 4.3.3.
Results obtained from previous work indicated that single crystals of the type
[MA
xMB
1-x(L)n]X2 grown from solutions where the relative ratio between [MA(L)n]X2
and [MB(L)n]X2 was between 0.40-0.60 (xsolution) displayed the largest range in xsolid
values. It was due to this repeated observation that experiments conducted during this
research focused on combinations where xsolution = 0.50. Although ligand exchange is
not a concern for homoleptic combinations, it is a major issue for different ligand
systems, so a kinetically inert ruthenium complex was used as one of the complex
species in each co-crystallisation experiment.59,60
Throughout this project, SEM-EDX has been used as a quantitative characterisation
technique for elemental analysis of single co-crystals. Co-crystals to be analysed
were harvested with a pipette directly from the glass vial in which they were grown,
and deposited onto carbon tape that was adhered to an aluminium SEM stub. The
small amount of mother liquor that was also transferred by the pipette was removed
using a Kimwipe® to prevent a thin film of residue forming on the crystals. The
crystals were then carbon-coated before being analysed. For each co-crystallisation
batch, at least ten intact single co-crystals were analysed, each in at least three
CHAPTER 4
81
different areas.*Experiments were conducted in triplicate to make certain the
technique was reliable and the results were reproducible. Since SEM-EDX is a
surface technique, a selection of co-crystals were carefully crushed and re-analysed.
Results obtained from crushed crystals were compared with surface measurements.
The complete SEM-EDX protocol developed for this project, which outlines all the
details of sample preparation, selection and measurement can be found in the
preparative experimental details chapter in Sections 3.2.1 and 3.3.5.1. In addition, a
brief discussion outlining the technical aspects of the SEM-EDX technique and its
use throughout this research as a means of elemental analysis can be found in
Appendix A.
Where possible, co-crystals were also characterised using powder and single crystal
X-Ray diffraction techniques. Powder XRD patterns, single crystal diffraction
(SCXRD) and refinement data are discussed in the relevant sections.
4.3.1 [MII
xRu1-x(terpy)2](PF6)2 co-crystallisation systems
Several co-crystals with the general formula [MII
xRu1-x(terpy)2](PF6)2 (MII = Fe, Co,
Ni, Cu), were prepared from solutions containing [MII(terpy)2](PF6)2 and
[Ru(terpy)2](PF6)2 in equimolar ratios. Crystallisations were conducted using the
slow evaporation method (1:1 MeCN:H2O). The cationic metal centre was the only
difference between the complexes in each co-crystallisation experiment. The metal is
completely shrouded by the ligand and therefore concealed from other complexes.
This set of experiments was designed to test the effects of very small differences
between complexes on the co-crystallisation process i.e. molecular recognition
patterns between complexes that are chemically different but geometrically almost
indistinguishable from one another.
*Size is an important factor because each measurement is statistically weighted equally and so for very
large crystals their impact on the co-crystallisation system would be underestimated due to the amount
of material consumed during the process. The opposite is true for very small crystals. Also, measuring
a broken crystal could mean that particular crystal is measured more than once. This would also
misrepresent the true range present in each batch. A record was kept of any measurements from
crystals that were either broken, relatively large or small or of a different crystal habit and if the
results from these were different from those obtained from regular co-crystals.
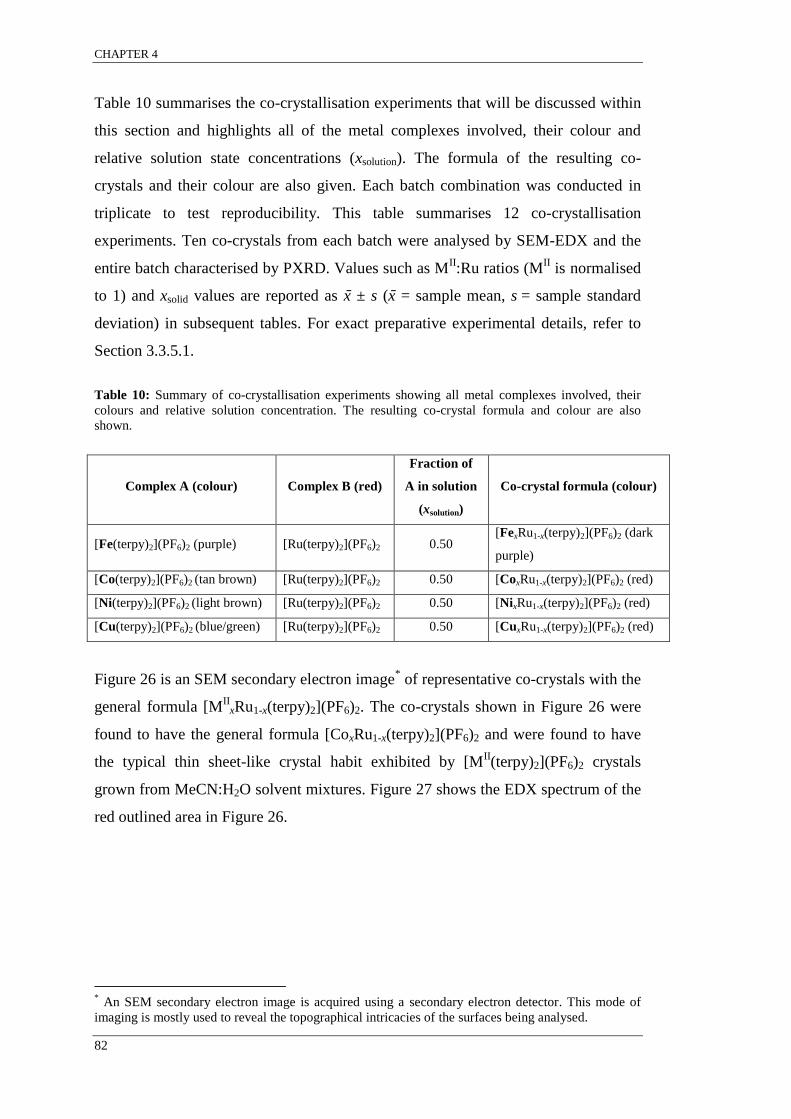
CHAPTER 4
82
Table 10 summarises the co-crystallisation experiments that will be discussed within
this section and highlights all of the metal complexes involved, their colour and
relative solution state concentrations (xsolution). The formula of the resulting co-
crystals and their colour are also given. Each batch combination was conducted in
triplicate to test reproducibility. This table summarises 12 co-crystallisation
experiments. Ten co-crystals from each batch were analysed by SEM-EDX and the
entire batch characterised by PXRD. Values such as MII:Ru ratios (M
II is normalised
to 1) and xsolid values are reported as x̄ ± s (x̄ = sample mean, s = sample standard
deviation) in subsequent tables. For exact preparative experimental details, refer to
Section 3.3.5.1.
Table 10: Summary of co-crystallisation experiments showing all metal complexes involved, their
colours and relative solution concentration. The resulting co-crystal formula and colour are also
shown.
Figure 26 is an SEM secondary electron image* of representative co-crystals with the
general formula [MII
xRu1-x(terpy)2](PF6)2. The co-crystals shown in Figure 26 were
found to have the general formula [CoxRu1-x(terpy)2](PF6)2 and were found to have
the typical thin sheet-like crystal habit exhibited by [MII(terpy)2](PF6)2 crystals
grown from MeCN:H2O solvent mixtures. Figure 27 shows the EDX spectrum of the
red outlined area in Figure 26.
* An SEM secondary electron image is acquired using a secondary electron detector. This mode of
imaging is mostly used to reveal the topographical intricacies of the surfaces being analysed.
Complex A (colour)
Complex B (red)
Fraction of
A in solution
(xsolution)
Co-crystal formula (colour)
[Fe(terpy)2](PF6)2 (purple) [Ru(terpy)2](PF6)2 0.50 [FexRu1-x(terpy)2](PF6)2 (dark
purple)
[Co(terpy)2](PF6)2 (tan brown) [Ru(terpy)2](PF6)2 0.50 [CoxRu1-x(terpy)2](PF6)2 (red)
[Ni(terpy)2](PF6)2 (light brown) [Ru(terpy)2](PF6)2 0.50 [NixRu1-x(terpy)2](PF6)2 (red)
[Cu(terpy)2](PF6)2 (blue/green) [Ru(terpy)2](PF6)2 0.50 [CuxRu1-x(terpy)2](PF6)2 (red)

CHAPTER 4
83
Figure 26: SEM secondary electron image of co-crystals with the general formula
[CoxRu1-x(terpy)2](PF6)2. Note the thin sheet-like crystal habit, which is typical for [MII(terpy)2](PF6)2
complexes grown from this solvent mixture.
Figure 27: EDX spectrum from the area outlined in red on the [CoxRu1-x(terpy)2](PF6)2 co-crystal
shown in Figure 26. This co-crystal was found to contain 52% [Co(terpy)2](PF6)2 and 48%
[Ru(terpy)2](PF6)2.
Representative SEM-EDX statistical data for these systems are summarised in Table
11, which shows the mean (x̄), standard deviation (s), minimum (Min), maximum
(Max) and range for MII xsolid values. The data in each row, determined by EDX,
correspond to the element highlighted in bold. For example, the statistics for the
system in the first row relate to the iron mole fraction relative to ruthenium in the
solid state, whereas the values in the second row relate to the cobalt content relative
to ruthenium.
Raw At% Ratio
(Co) 1.02 0.52
(Ru) 0.95 0.48
Formula
[Co0.52Ru0.48(terpy)2](PF6)2
Raw At% Ratio
(Co) 1.02 0.52
(Ru) 0.95 0.48
Formula
[Co0.52Ru0.48(terpy)2](PF6)2

CHAPTER 4
84
Table 11: Statistical summary of xsolid values obtained from EDX data for experiments resulting in
co-crystals with the general formula [MII
xRu1-x(terpy)2](PF6)2. The sample mean (x̄), standard
deviation (s), minimum, maximum and range for MII
xsolid values are shown along with the co-crystal
formula. The xsolid data correspond to the element in bold.
Co-crystallising systems x̄(xsolid) s(xsolid) Minimum Maximum Range
[FexRu1-x(terpy)2](PF6)2 0.50 0.02 0.47 0.55 0.08
[CoxRu1-x(terpy)2](PF6)2 0.55 0.08 0.42 0.64 0.22
[NixRu1-x(terpy)2](PF6)2 0.55 0.07 0.43 0.67 0.24
[CuxRu1-x(terpy)2](PF6)2 0.51 0.08 0.41 0.62 0.21
For all [MII
xRu1-x(terpy)2](PF6)2 systems discussed herein, measurements from
irregular crystals such as that outlined by the white box in Figure 26 showed xsolid
concentrations to be scattered within the ranges and not biased towards the upper or
lower limits shown in Table 11.
Figure 28 is a colour-coded graphical representation of the same EDX information
summarised in Table 11. The horizontal axis shows the different combinations of
co-crystallised metal complexes and hence the metal ratios of interest and are
labelled from left to right as Fe:Ru, Co:Ru, Ni:Ru and Cu:Ru. In addition, the
measurements from each batch are labelled with the general formula i.e.
measurements from the Co:Ru batch are labelled [CoxRu1-x(terpy)2](PF6)2. The y axis
is labelled MII
xsolid, thus for the Co:Ru system, this refers to the x variable in the
[CoxRu1-x(terpy)2](PF6)2 formula, and is the atomic fraction of Co detected in the
solid by SEM-EDX. Note that the y axis has been expanded showing a range of
0.40-0.70 so that data points can be viewed with minimal overlap. It is important to
note that data points of the same colour/shape represent measurements taken from
any particular co-crystal within a co-crystallisation batch. So for example, the data
points outlined by the red box, are from a different co-crystal to those outlined by the
black box, but both sets of measurements were from co-crystals grown from the
same solution.
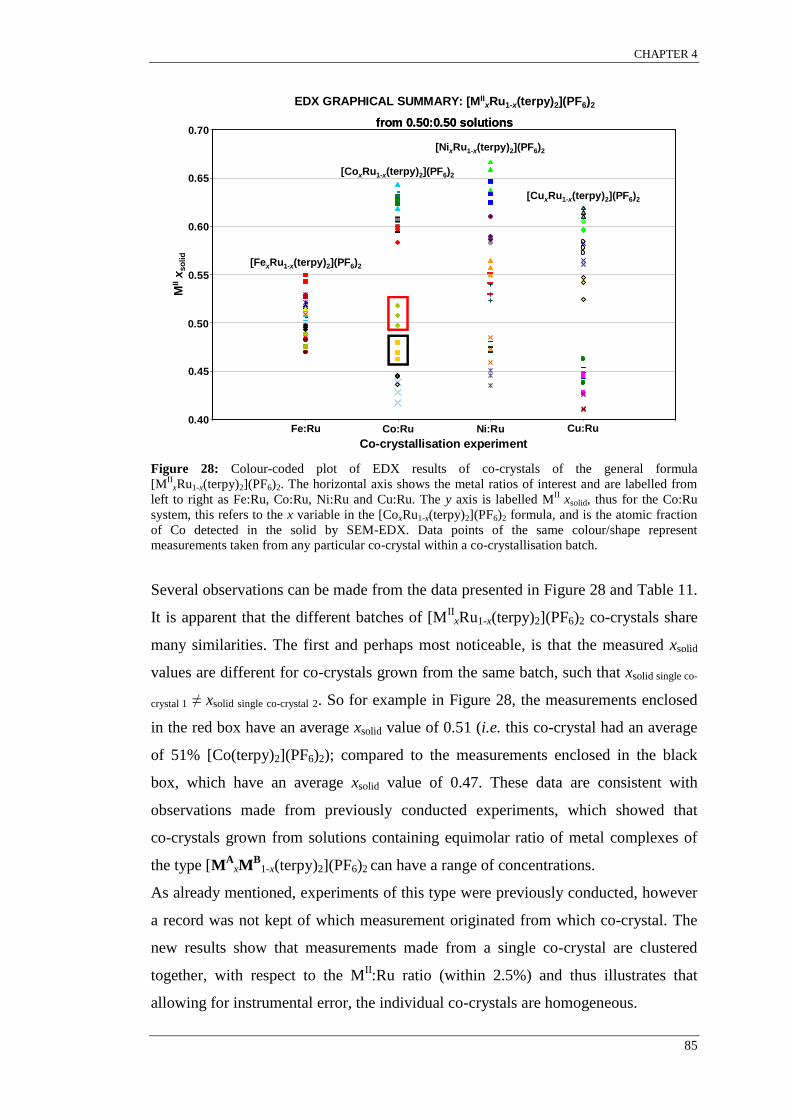
CHAPTER 4
85
Figure 28: Colour-coded plot of EDX results of co-crystals of the general formula
[MII
xRu1-x(terpy)2](PF6)2. The horizontal axis shows the metal ratios of interest and are labelled from
left to right as Fe:Ru, Co:Ru, Ni:Ru and Cu:Ru. The y axis is labelled MII xsolid, thus for the Co:Ru
system, this refers to the x variable in the [CoxRu1-x(terpy)2](PF6)2 formula, and is the atomic fraction
of Co detected in the solid by SEM-EDX. Data points of the same colour/shape represent
measurements taken from any particular co-crystal within a co-crystallisation batch.
Several observations can be made from the data presented in Figure 28 and Table 11.
It is apparent that the different batches of [MII
xRu1-x(terpy)2](PF6)2 co-crystals share
many similarities. The first and perhaps most noticeable, is that the measured xsolid
values are different for co-crystals grown from the same batch, such that xsolid single co-
crystal 1 ≠ xsolid single co-crystal 2. So for example in Figure 28, the measurements enclosed
in the red box have an average xsolid value of 0.51 (i.e. this co-crystal had an average
of 51% [Co(terpy)2](PF6)2); compared to the measurements enclosed in the black
box, which have an average xsolid value of 0.47. These data are consistent with
observations made from previously conducted experiments, which showed that
co-crystals grown from solutions containing equimolar ratio of metal complexes of
the type [MA
xMB
1-x(terpy)2](PF6)2 can have a range of concentrations.
As already mentioned, experiments of this type were previously conducted, however
a record was not kept of which measurement originated from which co-crystal. The
new results show that measurements made from a single co-crystal are clustered
together, with respect to the MII:Ru ratio (within 2.5%) and thus illustrates that
allowing for instrumental error, the individual co-crystals are homogeneous.
0.40
0.45
0.50
0.55
0.60
0.65
0.70
0.00 0.10 0.20 0.30 0.40 0.50
MII
xs
oli
d[CoxRu1-x(terpy)2](PF6)2
[FexRu1-x(terpy)2](PF6)2
[NixRu1-x(terpy)2](PF6)2
[CuxRu1-x(terpy)2](PF6)2
0.40
0.45
0.50
0.55
0.60
0.65
0.70
Co-crystallisation experiment
EDX GRAPHICAL SUMMARY: [MIIxRu1-x(terpy)2](PF6)2
from 0.50:0.50 solutions
Fe:Ru Co:Ru Ni:Ru Cu:Ru0.40
0.45
0.50
0.55
0.60
0.65
0.70
0.00 0.10 0.20 0.30 0.40 0.50
MII
xs
oli
d[CoxRu1-x(terpy)2](PF6)2
[FexRu1-x(terpy)2](PF6)2
[NixRu1-x(terpy)2](PF6)2
[CuxRu1-x(terpy)2](PF6)2
0.40
0.45
0.50
0.55
0.60
0.65
0.70
Co-crystallisation experiment
EDX GRAPHICAL SUMMARY: [MIIxRu1-x(terpy)2](PF6)2
from 0.50:0.50 solutions
Fe:Ru Co:Ru Ni:Ru Cu:Ru

CHAPTER 4
86
Statistically, the average [MII(terpy)2](PF6)2 (M
II = Fe, Co, Ni Cu) mole fractions
(xsolid) for all of the co-crystallisation experiments were found to be at or around
0.50. The minimum and maximum xsolid values were found to be within two standard
deviations of the mean in all four types of experiment. For each of the four
experiments shown in Figure 28, the data points are distributed above and below
0.50. This indicates, that under these crystallising conditions, each of the
[MII(terpy)2](PF6)2 complexes has a similar solubility to [Ru(terpy)2](PF6)2. If
complex A were less soluble than complex B (or vice versa) then complex A would
crystallise first with some of complex B. As crystallisation progresses, the relative
concentration of complex A in solution would decrease. As the relative concentration
of each complex in solution is constantly changing, the ratio of the two complexes in
the co-crystals during crystal growth also changes. This leads to the formation of
co-crystals with a concentration gradient, where higher concentrations of complex B
to relative to complex A are present on the co-crystal’s surface compared to the
ratios present towards the co-crystal’s nucleus. SEM-EDX analysis of co-crystals
with solubility gradients would yield xsolid values above or below that of 0.50 but not
both.
Earlier it was mentioned that SEM-EDX is largely a surface technique, capable of
measuring to depths of about 5 μm for these types of materials. As part of the
protocol developed during this project, representative co-crystals that already had
been analysed were crushed and re-prepared for SEM-EDX analysis. Comparisons
between measurements made on crushed and intact (surface) co-crystals consistently
showed only small differences (± 0.03). This is further evidence that the complexes
in each of the crystallising solutions have similar solubilities and that co-crystals of
the formula [MII
xRu1-x(terpy)2](PF6)2 that grow from these solutions do not have
concentration gradients. Overall, the results presented here indicate that the variation
in xsolid values between co-crystals grown from the same batch was due to
supramolecular selection.
Supramolecular selection is thought to proceed through molecular recognition
mechanisms whereby intermolecular interactions between like complexes are slightly
favoured over interactions between different complexes. Structural differences
between complexes, such as their size and shape, are likely factors that may play a
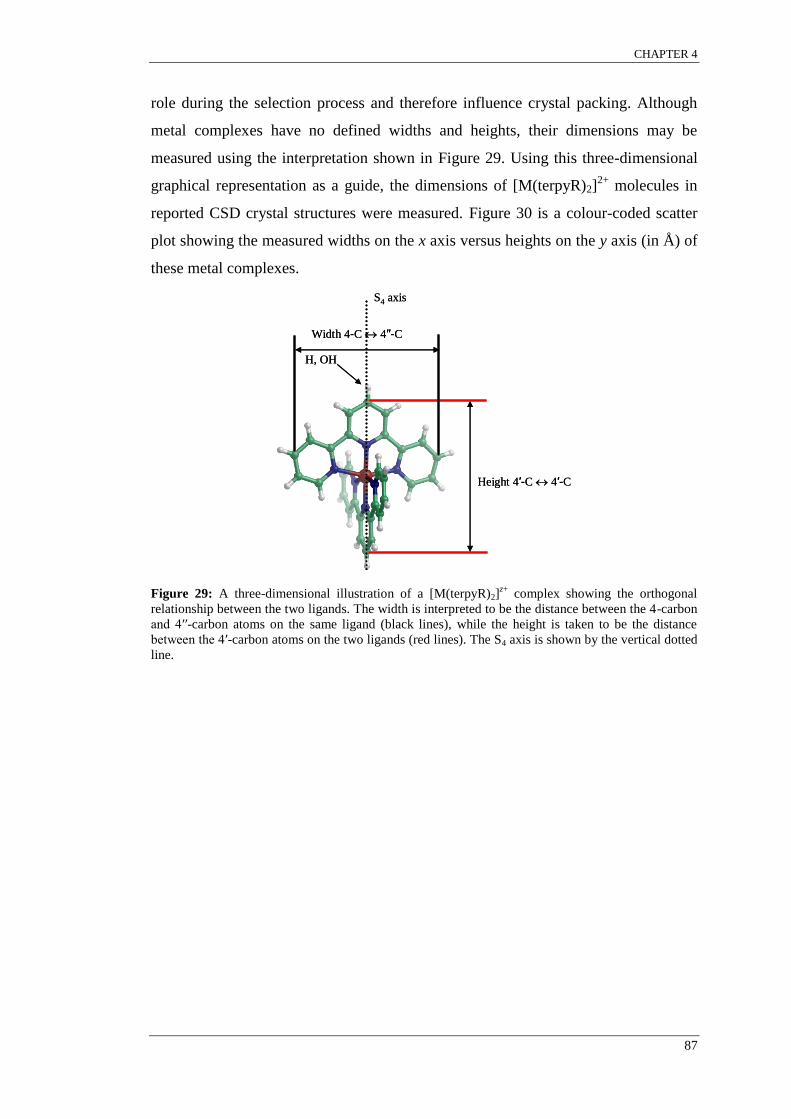
CHAPTER 4
87
role during the selection process and therefore influence crystal packing. Although
metal complexes have no defined widths and heights, their dimensions may be
measured using the interpretation shown in Figure 29. Using this three-dimensional
graphical representation as a guide, the dimensions of [M(terpyR)2]2+
molecules in
reported CSD crystal structures were measured. Figure 30 is a colour-coded scatter
plot showing the measured widths on the x axis versus heights on the y axis (in Å) of
these metal complexes.
Figure 29: A three-dimensional illustration of a [M(terpyR)2]z+
complex showing the orthogonal
relationship between the two ligands. The width is interpreted to be the distance between the 4-carbon
and 4′′-carbon atoms on the same ligand (black lines), while the height is taken to be the distance
between the 4′-carbon atoms on the two ligands (red lines). The S4 axis is shown by the vertical dotted
line.
Height 4′-C 4′-C
Width 4-C 4′′-C
H, OH
S4 axis
Height 4′-C 4′-C
Width 4-C 4′′-C
H, OH
S4 axis
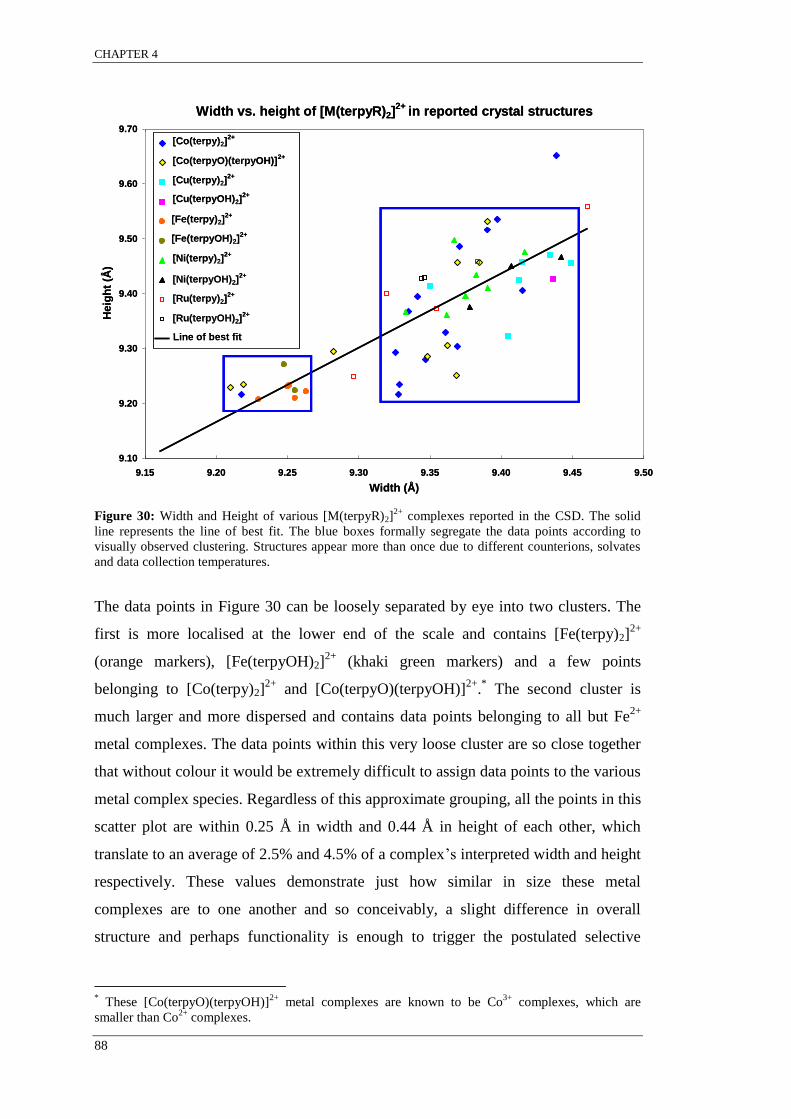
CHAPTER 4
88
Figure 30: Width and Height of various [M(terpyR)2]2+
complexes reported in the CSD. The solid
line represents the line of best fit. The blue boxes formally segregate the data points according to
visually observed clustering. Structures appear more than once due to different counterions, solvates
and data collection temperatures.
The data points in Figure 30 can be loosely separated by eye into two clusters. The
first is more localised at the lower end of the scale and contains [Fe(terpy)2]2+
(orange markers), [Fe(terpyOH)2]2+
(khaki green markers) and a few points
belonging to [Co(terpy)2]2+
and [Co(terpyO)(terpyOH)]2+
.* The second cluster is
much larger and more dispersed and contains data points belonging to all but Fe2+
metal complexes. The data points within this very loose cluster are so close together
that without colour it would be extremely difficult to assign data points to the various
metal complex species. Regardless of this approximate grouping, all the points in this
scatter plot are within 0.25 Å in width and 0.44 Å in height of each other, which
translate to an average of 2.5% and 4.5% of a complex’s interpreted width and height
respectively. These values demonstrate just how similar in size these metal
complexes are to one another and so conceivably, a slight difference in overall
structure and perhaps functionality is enough to trigger the postulated selective
* These [Co(terpyO)(terpyOH)]
2+ metal complexes are known to be Co
3+ complexes, which are
smaller than Co2+
complexes.
Width vs. height of [M(terpyR)2]2+
in reported crystal structures
9.10
9.20
9.30
9.40
9.50
9.60
9.70
9.15 9.20 9.25 9.30 9.35 9.40 9.45 9.50
Width (Å)
Heig
ht
(Å)
[Co(terpy)2]2+
[Co(terpyOH)2]2+
[Cu(terpy)2]2+
[Cu(terpyOH)2]2+
[Fe(terpy)2]2+
[Fe(terpyOH)2]2+
[Ni(terpy)2]2+
[Ni(terpyOH)2]2+
[Ru(terpy)2]2+
[Ru(terpyOH)2]2+
Line of best fit
[Co(terpy)2]2+
[Cu(terpy)2]2+
[Fe(terpy)2]2+
[Ni(terpy)2]2+
[Ru(terpyOH)2]2+
[Co(terpyO)(terpyOH)]2+
[Cu(terpyOH)2]2+
[Fe(terpyOH)2]2+
[Ni(terpyOH)2]2+
[Ru(terpy)2]2+
Line of best fit
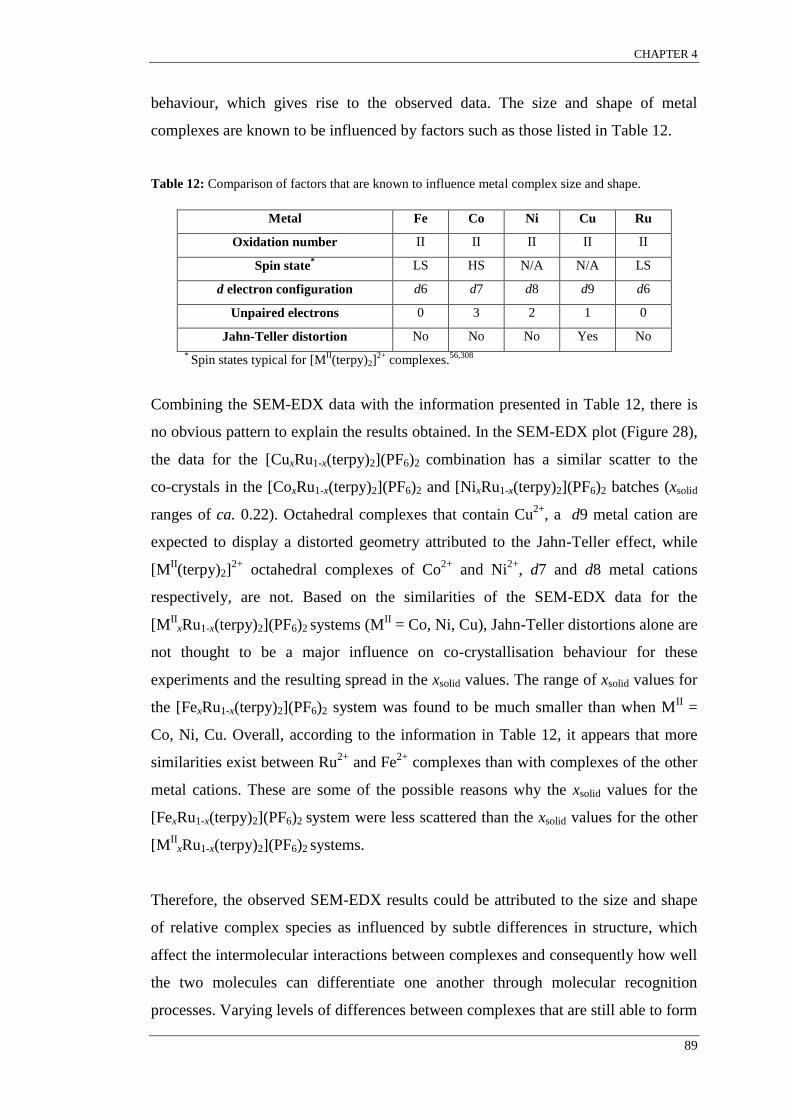
CHAPTER 4
89
behaviour, which gives rise to the observed data. The size and shape of metal
complexes are known to be influenced by factors such as those listed in Table 12.
Table 12: Comparison of factors that are known to influence metal complex size and shape.
Metal Fe Co Ni Cu Ru
Oxidation number II II II II II
Spin state* LS HS N/A N/A LS
d electron configuration d6 d7 d8 d9 d6
Unpaired electrons 0 3 2 1 0
Jahn-Teller distortion No No No Yes No
* Spin states typical for [M
II(terpy)2]
2+ complexes.
56,308
Combining the SEM-EDX data with the information presented in Table 12, there is
no obvious pattern to explain the results obtained. In the SEM-EDX plot (Figure 28),
the data for the [CuxRu1-x(terpy)2](PF6)2 combination has a similar scatter to the
co-crystals in the [CoxRu1-x(terpy)2](PF6)2 and [NixRu1-x(terpy)2](PF6)2 batches (xsolid
ranges of ca. 0.22). Octahedral complexes that contain Cu2+
, a d9 metal cation are
expected to display a distorted geometry attributed to the Jahn-Teller effect, while
[MII(terpy)2]
2+ octahedral complexes of Co
2+ and Ni
2+, d7 and d8 metal cations
respectively, are not. Based on the similarities of the SEM-EDX data for the
[MII
xRu1-x(terpy)2](PF6)2 systems (MII = Co, Ni, Cu), Jahn-Teller distortions alone are
not thought to be a major influence on co-crystallisation behaviour for these
experiments and the resulting spread in the xsolid values. The range of xsolid values for
the [FexRu1-x(terpy)2](PF6)2 system was found to be much smaller than when MII =
Co, Ni, Cu. Overall, according to the information in Table 12, it appears that more
similarities exist between Ru2+
and Fe2+
complexes than with complexes of the other
metal cations. These are some of the possible reasons why the xsolid values for the
[FexRu1-x(terpy)2](PF6)2 system were less scattered than the xsolid values for the other
[MII
xRu1-x(terpy)2](PF6)2 systems.
Therefore, the observed SEM-EDX results could be attributed to the size and shape
of relative complex species as influenced by subtle differences in structure, which
affect the intermolecular interactions between complexes and consequently how well
the two molecules can differentiate one another through molecular recognition
processes. Varying levels of differences between complexes that are still able to form

CHAPTER 4
90
co-crystals would lead to varying degrees of the supramolecular selection observed,
i.e. the range of xsolid values between co-crystals grown from the same batch.
The reasoning that co-crystallisation depends on molecular recognition between
complexes is ultimately based on the favourability of intermolecular interactions
between like complexes over those between complexes that are slightly different
from one another. The study of these interactions in the crystalline state is best
facilitated by the collection of SCXRD data. Unfortunately, the single co-crystals
obtained diffracted poorly due to their thin crystal habit. In lieu of crystal structures,
powder XRD, which is a bulk property analytical technique, was conducted on pure
and co-crystallised samples. Where possible, structural information was inferred
using powder diffraction patterns simulated from known single crystal structures, for
which crystallographic data is available in the CSD.51
All powder diffraction samples within this [MII(terpy)2](PF6)2 series were prepared
as thin films and analysed at room temperature (data collected to up to 60°2θ) with
an incident X-ray radiation sourced from a line-focused copper (Cu) X-ray tube
(1.54060 Å). Powder XRD patterns for this and all subsequent series are graphed so
that the position °2θ (shown on the x axis) is plotted against the relative intensity
“counts” (shown on the y axis). Powder XRD of these types of materials usually
produces patterns with one or two very intense low angle peaks. Therefore,
individual patterns are magnified to highlight less intense higher angle reflections.
Sometimes the intensity of these peaks is so much greater than the other reflections
that it becomes necessary to exclude their peak maxima in order to observe the
remainder of the pattern.
Diffraction patterns of freshly prepared pure [MII(terpy)2](PF6)2 crystals (M
II = Fe,
Co, Ni, Cu, Ru) are shown in Figure 31. Also shown in this figure (first pattern from
the top), is a simulated trace calculated from a published crystal structure of
[Cu(terpy)2](PF6)2 grown from acetone, which was collected at room temperature
and deposited in the CSD (reference code BEJPUB).309 Miller indices have been
assigned to the peaks of [MII(terpy)2](PF6)2 (M
II = Co, Ni, Cu) based on the indexing
of the simulated pattern; their positions are represented by dotted lines. There were

CHAPTER 4
91
no simulated patterns that matched those obtained experimentally for
[Fe(terpy)2](PF6)2 and [Ru(terpy)2](PF6)2 published in the CSD.
Figure 31: Powder XRD patterns of freshly prepared pure [MII(terpy)2](PF6)2 crystals ( M
II = Fe, Co,
Ni, Cu, Ru). The first diffraction pattern from the top is a simulated trace calculated from a published
crystal structure of [Cu(terpy)2](PF6)2 deposited in the CSD (reference code BEJPUB).309
Miller
indices have been assigned to the peaks of [MII(terpy)2](PF6)2 (M
II = Co, Ni, Cu) based on the
indexing of the calculated pattern. Although not clear from this plot, the [101] reflection at around
10°2θ, which is present in the three isomorphous and simulated powder patterns, is a single peak that
shows no evidence of any underlying peaks.
0
5000
10000
15000
20000
25000
30000
35000
5 10 15 20 25 30
002
102110
112
004
104 and 200
202
210
211212
101
305 10 15 20 25
Co
un
ts
Position [°2θ (Cu)]
PXRD: [MII(terpy)2](PF6)2 (MII = Fe, Co, Ni, Cu, Ru)
[Ru(terpy)2](PF6)2
[Co(terpy)2](PF6)2
[Fe(terpy)2](PF6)2
[Ni(terpy)2](PF6)2
BEJPUB (P421c)
[Cu(terpy)2](PF6)2
[Cu(terpy)2](PF6)2

CHAPTER 4
92
The simulated pattern of the solvent free [Cu(terpy)2](PF6)2 reported structure, (CSD
reference code BEJPUB),309 correlates well in regards to peak position and relative
peak intensity with the [Cu(terpy)2](PF6)2 experimental pattern. Although the two
compounds were recrystallised from different solvent mixtures, it appears that at
room temperature the experimentally obtained [Cu(terpy)2](PF6)2 is isomorphous
with the structure reported by Declercq et al. The experimental powder patterns of
[Co(terpy)2](PF6)2 and [Ni(terpy)2](PF6)2 match that of [Cu(terpy)2](PF6)2 and
therefore all three are isomorphous, belonging to the P4̄21c primitive tetragonal
space group.
It is important to note that peaks shift according to Bragg’s Law with changes in
lattice dimensions. Changes in these dimensions sometimes cause overlapping
reflections to resolve. Leftward peak shifts signify elongated lattice dimensions while
rightward shifts indicate shortened lattice parameters. Therefore, two patterns
obtained from isomorphous compounds each with slightly different lattice
dimensions could have a different number of observed peaks. An example of this is
observed for the simulated pattern in Figure 31. Upon initial inspection, the
simulated pattern appears to be comprised of only well resolved reflections without
any peak overlap. However, after a more in-depth analysis of this calculated pattern,
the reflection at around 20°2θ was found to be an overlap of the [104] and [200]
reflections; these two peaks are of similar intensity, have the same d spacing (4.465
Å) and are only separated by a one thousandth of a °2θ. The overlap is most
noticeable in the collected [Cu(terpy)2](PF6)2 pattern, where the peak maxima are
separated by 0.25°2θ and to a lesser extent in the [Ni(terpy)2](PF6)2 pattern.
Magnification of this peak in the [Co(terpy)2](PF6)2 pattern shows evidence of a
shoulder on the right hand side, which is likely to be the shift of the [200] reflection.
Another observation, which becomes more apparent due to the dotted lines, are the
very slight rightward shifts of the [002] and [004] reflections in the collected patterns
from their positions in the simulated trace (by 0.12 and 0.24°2θ respectively). This
shift possibly indicates a tightening of the d002 and d004 spacings, causing a very
slight shortening of the c-axis lattice parameter in accordance with Bragg’s law.
Apart from these observations, it appears that the unit cell dimensions for the
CHAPTER 4
93
[MII(terpy)2](PF6)2 (M
II = Co, Ni, Cu) crystals are identical to or vary only slightly
from the published BEJPUB structure (a = 8.930(3), b = 8.930(3), c = 20.623(5)).309
As there were no simulated powder patterns found in the CSD that matched those
experimentally obtained at room temperature for [Fe(terpy)2](PF6)2 and
[Ru(terpy)2](PF6)2, absolute conclusions regarding structure cannot be made without
the collection of single crystal data. However, it may be inferred that of all the
patterns shown in Figure 31, the [Fe(terpy)2](PF6)2 lattice possesses the least amount
of symmetry at room temperature because the powder pattern consists of the greatest
number of peaks. On the contrary, the [Ru(terpy)2](PF6)2 powder pattern shows very
few peaks, and therefore is expected to belong to a high symmetry space group at
room temperature. These conclusions regarding symmetry are drawn based on the
assumption that powder patterns of these crystals indicate the presence of a single
phase.* Furthermore and perhaps most noteworthy in regards to phase identification
of co-crystalline samples, is the difference of the [Ru(terpy)2](PF6)2 pattern
compared with the experimental patterns of the other four compounds. Comparison
of the experimental patterns shown in Figure 31 reveals that all the peaks associated
with the [Ru(terpy)2](PF6)2 occur at unique positions that avoid overlap with the
other powder patterns. Therefore, if a diffraction pattern of any co-crystal system
exhibits a peak at or around 7.8°2θ, it can likely be attributed to an inclusion of the
[Ru(terpy)2](PF6)2 phase in the bulk sample.
It is unfortunate that SCXRD data could not be collected for any of the compounds
within this series; however, a great deal of information can be extracted from the
comparison between the powder patterns of the co-crystals and their corresponding
pure compounds. It was hypothesised that since the pure structures of
[MII(terpy)2](PF6)2 (M
II = Co, Ni, Cu) were found to be isomorphous, the structures
of [MII
xRu1-x(terpy)2](PF6)2 (MII = Co, Ni, Cu) would also be isomorphous.
Figure 32 - Figure 36 show representative powder diffraction patterns of the various
[MII
xRu1-x(terpy)2](PF6)2 co-crystals (MII = Fe, Co, Ni, Cu) that were co-crystallised
* Powder XRD of [Fe(terpy)2](PF6)2 and [Ru(terpy)2](PF6)2 was repeated twice more on new batches
of freshly recrystallised samples to test for multiple phases, as verification using simulated patterns
was not available. The results were found to be reproducible, suggesting the presence of a single
phase.

CHAPTER 4
94
from solutions containing [MII(terpy)2](PF6)2 and [Ru(terpy)2](PF6)2 in equimolar
ratios. In each of these following figures the co-crystal pattern is shown between the
[MII(terpy)2](PF6)2 pattern (top) and [Ru(terpy)2](PF6)2 (bottom). The diffraction
patterns of the co-crystals are coloured differently to facilitate the comparison
between the various patterns. Dotted lines and shaded areas emphasise the
differences and similarities between patterns.
Figure 32: Powder XRD patterns of freshly prepared [FexRu1-x(terpy)2](PF6)2 co-crystals (shown in
purple) with the diffraction patterns of [Fe(terpy)2](PF6)2 (top) and [Ru(terpy)2](PF6)2 (bottom).
Dotted lines and shaded areas emphasise the differences between like patterns.
By examining the data presented in Figure 32, it is obvious that none of the peaks in
the [Ru(terpy)2](PF6)2 phase are present in the purple pattern. The general profiles of
both the [FexRu1-x(terpy)2](PF6)2 and [Fe(terpy)2](PF6)2 patterns are similar in most
cases. The reflections at 13.3, 17.8, 18.5, 20.4 and 26.8°2θ that are present in the
[Fe(terpy)2](PF6)2 pattern, have shifted to the left in the [FexRu1-x(terpy)2](PF6)2
pattern by 0.2°2θ. In the co-crystal pattern, the reflection at 8.8°2θ now shows a
prominent shoulder. Without hkl indexing, it is unclear if this weak reflection was
present as an underlying peak in the [Fe(terpy)2](PF6)2 pattern. The shoulder at
14.8°2θ, which is visible in the [Fe(terpy)2](PF6)2 pattern, seems to have merged
with its more intense neighbour and is absent from the co-crystal diffraction profile.
Similarly, the slight leftward shift of the peak at 26.8°2θ seems to have led to the
coalescence of the two peaks highlighted in this area. The leftward shifts indicate a
slight expansion of the unit cell due to the inclusion of the larger [Ru(terpy)2]2+
0
1000
2000
3000
4000
5000
6000
7000
8000
9000
5 10 15 20 25 30305 10 15 20 25
Co
un
ts
Position [°2θ (Cu)]
PXRD: [FexRu1-x(terpy)2](PF6)2 co-crystals
[Ru(terpy)2](PF6)2
[Fe(terpy)2](PF6)2
[FexRu1-x(terpy)2](PF6)2
0
1000
2000
3000
4000
5000
6000
7000
8000
9000
5 10 15 20 25 30305 10 15 20 25
Co
un
ts
Position [°2θ (Cu)]
PXRD: [FexRu1-x(terpy)2](PF6)2 co-crystals
[Ru(terpy)2](PF6)2
[Fe(terpy)2](PF6)2
[FexRu1-x(terpy)2](PF6)2

CHAPTER 4
95
complex into the [Fe(terpy)2](PF6)2 phase. This is a reasonable conclusion as a size
difference between these two complexes is indicated in the size chart shown in
Figure 30. It is interesting to note that the leftward shifts of only a selected number of
peaks are observed as opposed to a complete transposition of the entire co-crystal
pattern. This suggests a lattice expansion in only one or two dimensions. Overall,
there is overwhelming evidence to support the conclusion that
[FexRu1-x(terpy)2](PF6)2 co-crystals are exclusively comprised of the
[Fe(terpy)2](PF6)2 phase, albeit in a slightly elongated lattice. Therefore, the single
crystal SEM-EDX findings seem to be representative of the bulk sample.
The powder XRD pattern of [CoxRu1-x(terpy)2](PF6)2 together with the patterns of
[Co(terpy)2](PF6)2 and [Ru(terpy)2](PF6)2 are shown in Figure 33.
Figure 33: Powder XRD patterns of freshly prepared [CoxRu1-x(terpy)2](PF6)2 co-crystals (shown in
blue) with the diffraction patterns of [Co(terpy)2](PF6)2 (top) and [Ru(terpy)2](PF6)2 (bottom). Dotted
lines and shaded areas emphasise the differences between like patterns.
Peaks associated with the [Ru(terpy)2](PF6)2 phase are absent in the
[CoxRu1-x(terpy)2](PF6)2 pattern. None of the patterns simulated from literature single
crystal structures match the [CoxRu1-x(terpy)2](PF6)2 pattern shown in Figure 33.
Unlike the observation made for the previous set of results (Figure 32), only a few
similarities are noted between the patterns of [CoxRu1-x(terpy)2](PF6)2 and
[Co(terpy)2](PF6)2. The dotted lines at around 10.7, 13.3 and 22.7°2θ show the
possible similarities between the two patterns. The shaded peaks at around 10.7°2θ
0
1000
2000
3000
4000
5000
6000
7000
8000
9000
5 10 15 20 25 30305 10 15 20 25
Co
un
ts
Position [°2θ (Cu)]
PXRD: [CoxRu1-x(terpy)2](PF6)2 co-crystals
[Ru(terpy)2](PF6)2
[Co(terpy)2](PF6)2
[CoxRu1-x(terpy)2](PF6)2
0
1000
2000
3000
4000
5000
6000
7000
8000
9000
5 10 15 20 25 30305 10 15 20 25
Co
un
ts
Position [°2θ (Cu)]
PXRD: [CoxRu1-x(terpy)2](PF6)2 co-crystals
[Ru(terpy)2](PF6)2
[Co(terpy)2](PF6)2
[CoxRu1-x(terpy)2](PF6)2

CHAPTER 4
96
and 22.7°2θ could be due to the [Co(terpy)2](PF6)2 phase or the result of the
formation of a completely new structure. The shaded peak at around 16.5°2θ
suggests the latter. If the [Co(terpy)2](PF6)2 phase is indeed present in the
co-crystalline pattern then the peaks at around 20.0°2θ could be the separation of the
[104] and [200] reflections due to the differences in the lattice parameters in the
[CoxRu1-x(terpy)2](PF6)2 structure compared to the structure of pure
[Co(terpy)2](PF6)2. Since none of these peaks occur at exactly the same positions in
both patterns, it is unlikely that pure [Co(terpy)2](PF6)2 crystals formed during
co-crystallisation. Overall, there is evidence to support the conclusion that most
[CoxRu1-x(terpy)2](PF6)2 co-crystals have adopted a new structure and some evidence
to support the inference that a small percentage have formed in the
[Co(terpy)2](PF6)2 phase.
The powder XRD pattern of [NixRu1-x(terpy)2](PF6)2 together with the patterns of
[Ni(terpy)2](PF6)2 and [Ru(terpy)2](PF6)2 are shown in Figure 34. Upon examination
of the [NixRu1-x(terpy)2](PF6)2 XRD pattern, it was immediately noted that the pattern
for this batch of co-crystals greatly resembled the pattern of
[CoxRu1-x(terpy)2](PF6)2. The [CoxRu1-x(terpy)2](PF6)2 and [NixRu1-x(terpy)2](PF6)2
powder patterns are shown in Figure 35.
Figure 34: Powder XRD patterns of freshly prepared [NixRu1-x(terpy)2](PF6)2 co-crystals (shown in
green) with the diffraction patterns of [Ni(terpy)2](PF6)2 (top) and [Ru(terpy)2](PF6)2 (bottom). Dotted
lines and shaded areas emphasise the differences between like patterns.
0
1000
2000
3000
4000
5000
6000
7000
8000
9000
5 10 15 20 25 30305 10 15 20 25
Co
un
ts
Position [°2θ (Cu)]
PXRD: [NixRu1-x(terpy)2](PF6)2 co-crystals
[Ru(terpy)2](PF6)2
[Ni(terpy)2](PF6)2
[NixRu1-x(terpy)2](PF6)2
0
1000
2000
3000
4000
5000
6000
7000
8000
9000
5 10 15 20 25 30305 10 15 20 25
Co
un
ts
Position [°2θ (Cu)]
PXRD: [NixRu1-x(terpy)2](PF6)2 co-crystals
[Ru(terpy)2](PF6)2
[Ni(terpy)2](PF6)2
[NixRu1-x(terpy)2](PF6)2

CHAPTER 4
97
Figure 35: Powder XRD patterns of freshly prepared [CoxRu1-x(terpy)2](PF6)2 co-crystals (shown in
blue) and [NixRu1-x(terpy)2](PF6)2 co-crystals (shown in green). Dotted lines and shaded areas are
present to emphasise the variations between these patterns.
The peaks in the [NixRu1-x(terpy)2](PF6)2 pattern correlate well to the peaks in the
[CoxRu1-x(terpy)2](PF6)2 pattern except in the areas highlighted by the green shading,
which may indicate the possibility of a phase impurity. These differences could also
be attributed to subtle differences in the lattice parameters between
[NixRu1-x(terpy)2](PF6)2 and [CoxRu1-x(terpy)2](PF6)2 co-crystals as each highlighted
peak is adjacent to a more intense peak. Since the two patterns shown in Figure 35
are otherwise almost identical, it is very likely that most of the
[NixRu1-x(terpy)2](PF6)2 co-crystals are isomorphous with [CoxRu1-x(terpy)2](PF6)2.
Furthermore, due to the similarities between the patterns of [CoxRu1-x(terpy)2](PF6)2
and [NixRu1-x(terpy)2](PF6)2, the proposal that [CoxRu1-x(terpy)2](PF6)2 was
contaminated with the [Co(terpy)2](PF6)2 phase is unlikely. Therefore, the majority
of co-crystals resulting from these experiments seem to have formed a completely
new crystalline phase in the absence of any major phase impurities.
The last set of powder patterns to be discussed in this section are those pertaining to
the [CuxRu1-x(terpy)2](PF6)2 system. The co-crystal diffraction pattern along with the
patterns of [Cu(terpy)2](PF6)2 and [Ru(terpy)2](PF6)2 are shown in Figure 36.
0
1000
2000
3000
4000
5000
6000
7000
8000
9000
5 10 15 20 25 305
Co
un
ts
Position [°2θ (Cu)]
3010 15 20 25
PXRD: [MIIxRu1-x(terpy)2](PF6)2 co-crystals (MII = Co, Ni)
[NixRu1-x(terpy)2](PF6)2
[CoxRu1-x(terpy)2](PF6)2
0
1000
2000
3000
4000
5000
6000
7000
8000
9000
5 10 15 20 25 305
Co
un
ts
Position [°2θ (Cu)]
3010 15 20 25
PXRD: [MIIxRu1-x(terpy)2](PF6)2 co-crystals (MII = Co, Ni)
[NixRu1-x(terpy)2](PF6)2
[CoxRu1-x(terpy)2](PF6)2

CHAPTER 4
98
Figure 36: Powder XRD patterns of freshly prepared [CuxRu1-x(terpy)2](PF6)2 co-crystals (shown in
red) with the diffraction patterns of [Cu(terpy)2](PF6)2 (top) and [Ru(terpy)2](PF6)2 (bottom). Dotted
lines and shaded areas emphasise the differences between like patterns.
In keeping with the trend observed thus far, the main peaks from the
[Ru(terpy)2](PF6)2 phase are absent in the co-crystal pattern. The only notable
differences observed between the patterns of [CuxRu1-x(terpy)2](PF6)2 and
[Cu(terpy)2](PF6)2 are highlighted in red at around 10.8, 14.1 and 26.1°2θ. Overall
the [CuxRu1-x(terpy)2](PF6)2 pattern looks very similar to that of [Cu(terpy)2](PF6)2.
The peak highlighted at 14.1°2θ is present but very weak in the
[CuxRu1-x(terpy)2](PF6)2 pattern. The peaks highlighted at 26.1°2θ are also common
to both patterns however they are relatively weaker in the [Cu(terpy)2](PF6)2 pattern.
The difference in relative peak intensity can be attributed to preferred orientation
effects, which are common for highly crystalline samples such as these.* The
difference in the intensities is more obvious for the peak at 8.7°2θ, which is visible in
both patterns but has a much greater relative intensity in the [CuxRu1-x(terpy)2](PF6)2
pattern. The extra peaks in the shaded area around 10.8°2θ in the
[CuxRu1-x(terpy)2](PF6)2 pattern could either be due to preferred orientation or a
slight phase impurity. Overall, the data suggests that a most of the co-crystals in the
bulk [CuxRu1-x(terpy)2](PF6)2 sample adopted the [Cu(terpy)2](PF6)2 phase.
*Ideally, every possible crystalline orientation is represented equally resulting in a true average. For
samples that display preferred orientation the average is skewed by one or more crystalline
orientations, which in turn distorts the relative intensities.
0
1000
2000
3000
4000
5000
6000
7000
8000
9000
5 10 15 20 25 30305 10 15 20 25
Co
un
ts
Position [°2θ (Cu)]
PXRD: [CuxRu1-x(terpy)2](PF6)2 co-crystals
[Ru(terpy)2](PF6)2
[Cu(terpy)2](PF6)2
[CuxRu1-x(terpy)2](PF6)2
0
1000
2000
3000
4000
5000
6000
7000
8000
9000
5 10 15 20 25 30305 10 15 20 25
Co
un
ts
Position [°2θ (Cu)]
PXRD: [CuxRu1-x(terpy)2](PF6)2 co-crystals
[Ru(terpy)2](PF6)2
[Cu(terpy)2](PF6)2
[CuxRu1-x(terpy)2](PF6)2

CHAPTER 4
99
4.3.2 [MII
(terpyOH)2]x[Ru(terpy)2]1-x(BF4)2 co-crystallisation systems
Several co-crystals with the general formula [MII(terpyOH)2]x[Ru(terpy)2]1-x(BF4)2
(MII = Fe, Ni, Cu) were prepared from solutions containing [M
II(terpyOH)2](BF4)2
and [Ru(terpy)2](BF4)2 in 0.50:0.50 and 0.05:0.95 ratios. Crystallisations were
conducted using the slow evaporation method (1:1 MeCN:H2O). Each experiment
combination involves complexes that are chemically and structurally different (i.e.
different metal centres and ligands) but still which form the 2D terpy embrace motif.
These experiments were designed to test the effects of larger differences between
complexes on co-crystallisation.
In addition to these combinations, a co-crystallisation solution was prepared that
contained an equimolar ratio of [Ru(terpy)2](BF4)2 and
[CoIII
(terpyO)(terpyOH)](BF4)2. Unlike the metal complexes in
[MII(terpyOH)2](BF4)2 crystals (M
II = Fe, Ni, Cu), which form π-interactions to yield
the 2D terpy motif, the molecules in [CoIII
(terpyO)(terpyOH)](BF4)2 predominately
interact through hydrogen bonds (no π-interactions between complexes) to form a
hydrogen bond motif.34 This experiment was conducted to test whether
co-crystallisation would force [CoIII
(terpyO)(terpyOH)]2+
into a non hydrogen
bonding lattice or [Ru(terpy)2]2+
complexes (which cannot form hydrogen bonds)
into the hydrogen bond motif.
Table 13 summarises the co-crystallisation experiments that will be discussed within
this section and highlights all of the metal complexes involved, their colour and
relative solution state concentrations (xsolution). The formulae of the resulting
co-crystals and their colour are also given. For simplicity, the formulae of the various
pure complexes and co-crystals are shown unsolvated, however most contain at least
one molecule of water per metal complex unit (as determined from XRD data). Each
batch combination was conducted in triplicate to test reproducibility. This table
summarises 21 co-crystallisation experiments. Ten co-crystals from each batch were
analysed by SEM-EDX. Values such as MII:Ru ratios (where the M
II is normalised
to 1) and xsolid values are reported as x̄ ± s (x̄ = sample mean; s = sample standard
deviation). Single crystal and powder XRD data were collected from batches that
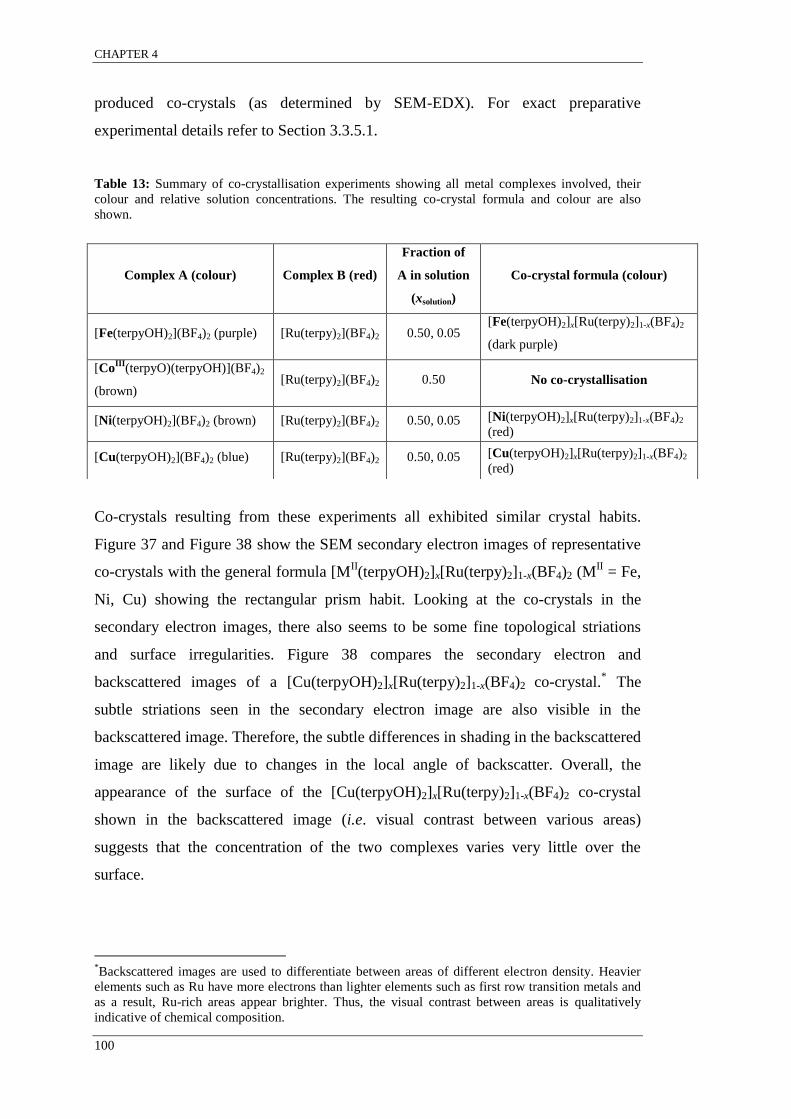
CHAPTER 4
100
produced co-crystals (as determined by SEM-EDX). For exact preparative
experimental details refer to Section 3.3.5.1.
Table 13: Summary of co-crystallisation experiments showing all metal complexes involved, their
colour and relative solution concentrations. The resulting co-crystal formula and colour are also
shown.
Co-crystals resulting from these experiments all exhibited similar crystal habits.
Figure 37 and Figure 38 show the SEM secondary electron images of representative
co-crystals with the general formula [MII(terpyOH)2]x[Ru(terpy)2]1-x(BF4)2 (M
II = Fe,
Ni, Cu) showing the rectangular prism habit. Looking at the co-crystals in the
secondary electron images, there also seems to be some fine topological striations
and surface irregularities. Figure 38 compares the secondary electron and
backscattered images of a [Cu(terpyOH)2]x[Ru(terpy)2]1-x(BF4)2 co-crystal.* The
subtle striations seen in the secondary electron image are also visible in the
backscattered image. Therefore, the subtle differences in shading in the backscattered
image are likely due to changes in the local angle of backscatter. Overall, the
appearance of the surface of the [Cu(terpyOH)2]x[Ru(terpy)2]1-x(BF4)2 co-crystal
shown in the backscattered image (i.e. visual contrast between various areas)
suggests that the concentration of the two complexes varies very little over the
surface.
*Backscattered images are used to differentiate between areas of different electron density. Heavier
elements such as Ru have more electrons than lighter elements such as first row transition metals and
as a result, Ru-rich areas appear brighter. Thus, the visual contrast between areas is qualitatively
indicative of chemical composition.
Complex A (colour)
Complex B (red)
Fraction of
A in solution
(xsolution)
Co-crystal formula (colour)
[Fe(terpyOH)2](BF4)2 (purple) [Ru(terpy)2](BF4)2 0.50, 0.05 [Fe(terpyOH)2]x[Ru(terpy)2]1-x(BF4)2
(dark purple)
[CoIII
(terpyO)(terpyOH)](BF4)2
(brown) [Ru(terpy)2](BF4)2 0.50 No co-crystallisation
[Ni(terpyOH)2](BF4)2 (brown) [Ru(terpy)2](BF4)2 0.50, 0.05 [Ni(terpyOH)2]x[Ru(terpy)2]1-x(BF4)2
(red)
[Cu(terpyOH)2](BF4)2 (blue) [Ru(terpy)2](BF4)2 0.50, 0.05 [Cu(terpyOH)2]x[Ru(terpy)2]1-x(BF4)2
(red)

CHAPTER 4
101
Although beyond the capabilities of the instrument used, it would be interesting to
examine the surface feratures of these types of co-crystals at lower voltages (ca.
10kV).
Figure 37: Secondary electron SEM images of co-crystals with the formula
[Fe(terpyOH)2]x[Ru(terpy)2]1-x(BF4)2 (left) and [Ni(terpyOH)2]x[Ru(terpy)2]1-x(BF4)2 (right). Note the
co-crystals share similar dimensions and have a comparable rectangular prism crystal habit.
Figure 38: Secondary electron (left) and backscattered (right) SEM images of a co-crystal with the
formula [Cu(terpyOH)2]x[Ru(terpy)2]1-x(BF4)2.
Figure 39 shows an SEM secondary electron image of crystals grown from a solution
containing an equimolar ratio of [CoIII
(terpyO)(terpyOH)](BF4)2 and
[Ru(terpy)2](BF4)2. The thin sheets such as the one outlined in red were found to
contain only [Ru(terpy)2](BF4)2. The multifaceted prisms (outlined in yellow) were
found to be exclusively composed of [CoIII
(terpyO)(terpyOH)](BF4)2. Repeated
attempts to co-crystallise the two complexes were unsuccessful as each experiment
resulted in a sample containing only pure crystals of both complexes, each with a
different habit. It appears that the supramolecular interactions of these two
complexes are too different to allow the complexes to co-crystallise. Although the
overall shape of the [CoIII
(terpyO)(terpyOH)]2+
complex lends itself to π-interactions
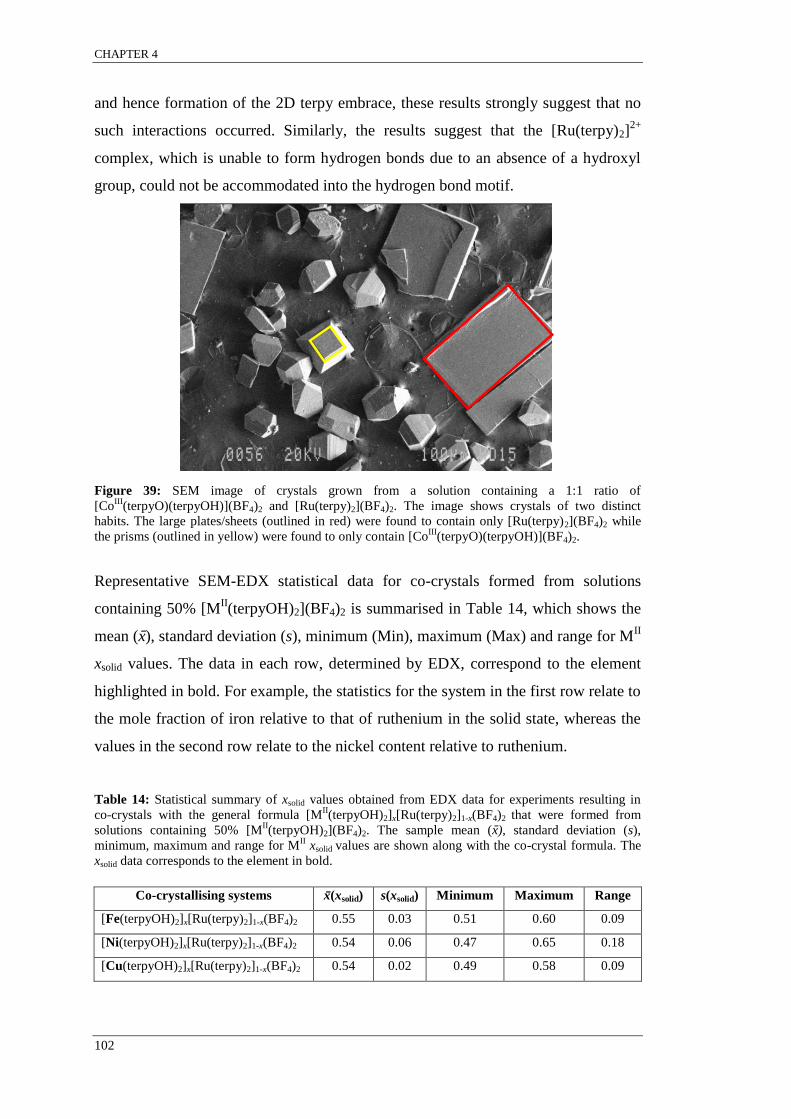
CHAPTER 4
102
and hence formation of the 2D terpy embrace, these results strongly suggest that no
such interactions occurred. Similarly, the results suggest that the [Ru(terpy)2]2+
complex, which is unable to form hydrogen bonds due to an absence of a hydroxyl
group, could not be accommodated into the hydrogen bond motif.
Figure 39: SEM image of crystals grown from a solution containing a 1:1 ratio of
[CoIII
(terpyO)(terpyOH)](BF4)2 and [Ru(terpy)2](BF4)2. The image shows crystals of two distinct
habits. The large plates/sheets (outlined in red) were found to contain only [Ru(terpy)2](BF4)2 while
the prisms (outlined in yellow) were found to only contain [CoIII
(terpyO)(terpyOH)](BF4)2.
Representative SEM-EDX statistical data for co-crystals formed from solutions
containing 50% [MII(terpyOH)2](BF4)2 is summarised in Table 14, which shows the
mean (x̄), standard deviation (s), minimum (Min), maximum (Max) and range for MII
xsolid values. The data in each row, determined by EDX, correspond to the element
highlighted in bold. For example, the statistics for the system in the first row relate to
the mole fraction of iron relative to that of ruthenium in the solid state, whereas the
values in the second row relate to the nickel content relative to ruthenium.
Table 14: Statistical summary of xsolid values obtained from EDX data for experiments resulting in
co-crystals with the general formula [MII(terpyOH)2]x[Ru(terpy)2]1-x(BF4)2 that were formed from
solutions containing 50% [MII(terpyOH)2](BF4)2. The sample mean (x̄), standard deviation (s),
minimum, maximum and range for MII xsolid values are shown along with the co-crystal formula. The
xsolid data corresponds to the element in bold.
Co-crystallising systems x̄(xsolid) s(xsolid) Minimum Maximum Range
[Fe(terpyOH)2]x[Ru(terpy)2]1-x(BF4)2 0.55 0.03 0.51 0.60 0.09
[Ni(terpyOH)2]x[Ru(terpy)2]1-x(BF4)2 0.54 0.06 0.47 0.65 0.18
[Cu(terpyOH)2]x[Ru(terpy)2]1-x(BF4)2 0.54 0.02 0.49 0.58 0.09

CHAPTER 4
103
Figure 40 is a colour-coded graphical representation of the same EDX information
summarised in Table 14. The horizontal axis shows the different combinations of
co-crystallised metal complexes and hence the metal ratios of interest and are
labelled from left to right as Fe:Ru, Ni:Ru and Cu:Ru. In addition, the data points
from each batch are labelled with the general formula, i.e. measurements from the
Cu:Ru batch are labelled [Cu(terpyOH)2]x[Ru(terpy)2]1-x(BF4)2. The primary y axis
on the left is labelled MII xsolid. Thus for the Cu:Ru system, this refers to the x
variable in the [Cu(terpyOH)2]x[Ru(terpy)2]1-x(BF4)2 co-crystal formula, and is the
atomic fraction of Cu detected in the solid by SEM-EDX. It is important to note that
all measurements taken from a single co-crystal (at least three) within a
co-crystallisation batch are represented by one type of marker. So for example, the
[Cu(terpyOH)2]x[Ru(terpy)2]1-x(BF4)2 data points outlined by the blue box, are from a
different co-crystal to those outlined by the black box, but both sets of measurements
were from co-crystals grown from the same solution. The secondary y axis on the
right is labelled MII xsolid (mother liquor residue) and corresponds to the red data
points outlined in the red box. These data points refer to the atomic fraction of MII
detected in the residue resulting from the evaporation of the mother liquor after the
co-crystals were harvested. The error bars associated with these red markers
correspond to one standard deviation.
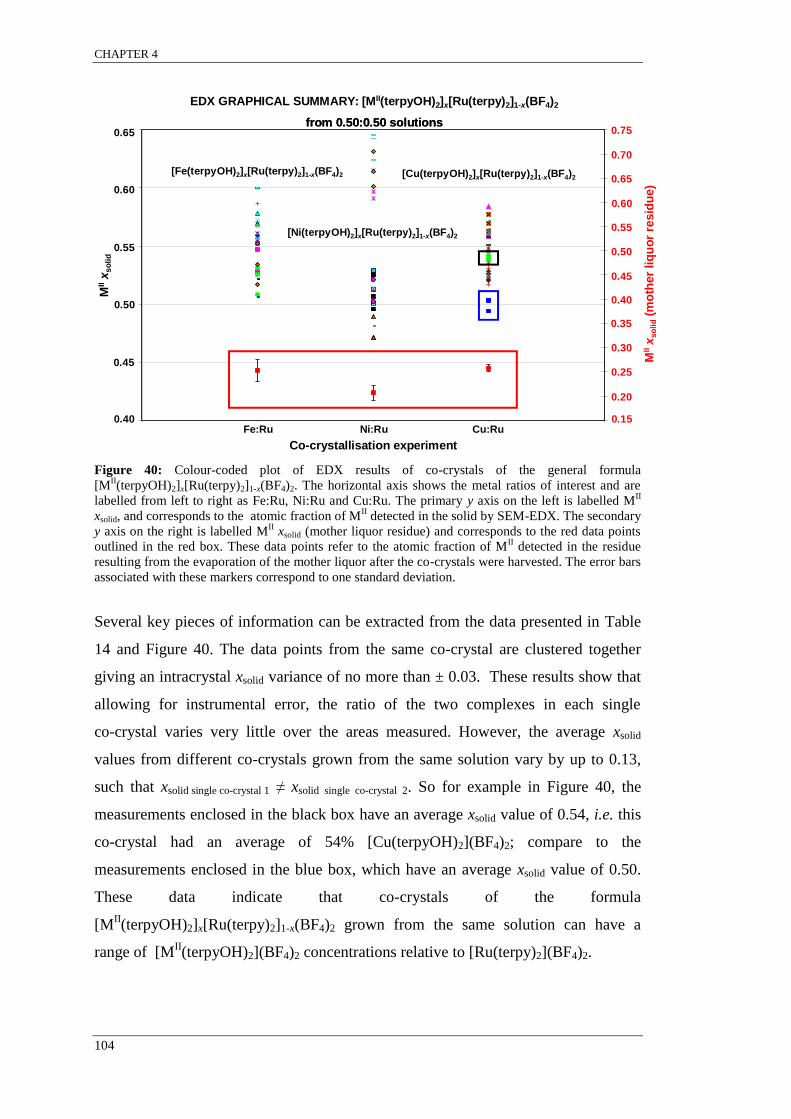
CHAPTER 4
104
Figure 40: Colour-coded plot of EDX results of co-crystals of the general formula
[MII(terpyOH)2]x[Ru(terpy)2]1-x(BF4)2. The horizontal axis shows the metal ratios of interest and are
labelled from left to right as Fe:Ru, Ni:Ru and Cu:Ru. The primary y axis on the left is labelled MII
xsolid, and corresponds to the atomic fraction of MII detected in the solid by SEM-EDX. The secondary
y axis on the right is labelled MII xsolid (mother liquor residue) and corresponds to the red data points
outlined in the red box. These data points refer to the atomic fraction of MII detected in the residue
resulting from the evaporation of the mother liquor after the co-crystals were harvested. The error bars
associated with these markers correspond to one standard deviation.
Several key pieces of information can be extracted from the data presented in Table
14 and Figure 40. The data points from the same co-crystal are clustered together
giving an intracrystal xsolid variance of no more than ± 0.03. These results show that
allowing for instrumental error, the ratio of the two complexes in each single
co-crystal varies very little over the areas measured. However, the average xsolid
values from different co-crystals grown from the same solution vary by up to 0.13,
such that xsolid single co-crystal 1 ≠ xsolid single co-crystal 2. So for example in Figure 40, the
measurements enclosed in the black box have an average xsolid value of 0.54, i.e. this
co-crystal had an average of 54% [Cu(terpyOH)2](BF4)2; compare to the
measurements enclosed in the blue box, which have an average xsolid value of 0.50.
These data indicate that co-crystals of the formula
[MII(terpyOH)2]x[Ru(terpy)2]1-x(BF4)2 grown from the same solution can have a
range of [MII(terpyOH)2](BF4)2 concentrations relative to [Ru(terpy)2](BF4)2.
0.40
0.45
0.50
0.55
0.60
0.65
0 0.1 0.2 0.3 0.4
0.15
0.20
0.25
0.30
0.35
0.40
0.45
0.50
0.55
0.60
0.65
0.70
0.75
MII
xs
oli
d
0.40
0.45
0.55
0.60
0.65
EDX GRAPHICAL SUMMARY: [MII(terpyOH)2]x[Ru(terpy)2]1-x(BF4)2
from 0.50:0.50 solutions
Co-crystallisation experiment
[Ni(terpyOH)2]x[Ru(terpy)2]1-x(BF4)2
[Fe(terpyOH)2]x[Ru(terpy)2]1-x(BF4)2 [Cu(terpyOH)2]x[Ru(terpy)2]1-x(BF4)2
0.50
0.15
0.25
0.50
0.60
0.75
0.40
0.65
0.35
0.30
0.45
0.55
0.20
0.70
MII
xs
oli
d(m
oth
er
liq
uo
r re
sid
ue)
Fe:Ru Ni:Ru Cu:Ru0.40
0.45
0.50
0.55
0.60
0.65
0 0.1 0.2 0.3 0.4
0.15
0.20
0.25
0.30
0.35
0.40
0.45
0.50
0.55
0.60
0.65
0.70
0.75
MII
xs
oli
d
0.40
0.45
0.55
0.60
0.65
EDX GRAPHICAL SUMMARY: [MII(terpyOH)2]x[Ru(terpy)2]1-x(BF4)2
from 0.50:0.50 solutions
Co-crystallisation experiment
[Ni(terpyOH)2]x[Ru(terpy)2]1-x(BF4)2
[Fe(terpyOH)2]x[Ru(terpy)2]1-x(BF4)2 [Cu(terpyOH)2]x[Ru(terpy)2]1-x(BF4)2
0.50
0.15
0.25
0.50
0.60
0.75
0.40
0.65
0.35
0.30
0.45
0.55
0.20
0.70
MII
xs
oli
d(m
oth
er
liq
uo
r re
sid
ue)
Fe:Ru Ni:Ru Cu:Ru

CHAPTER 4
105
The xsolid values from the [Fe(terpyOH)2]x[Ru(terpy)2]1-x(BF4)2 and
[Cu(terpyOH)2]x[Ru(terpy)2]1-x(BF4)2 systems are tightly distributed compared to the
data points for the [Ni(terpyOH)2]x[Ru(terpy)2]1-x(BF4)2 system. Based on the spread
of xsolid values for each batch (also evident from the standard deviations in Table 14),
it appears that the degree of supramolecular selection occurring during
co-crystallisation is greatest for the [Ni(terpyOH)2]x[Ru(terpy)2]1-x(BF4)2 system as
the spread for this system is the largest. Since supramolecular selection is
rationalised to be dependent on intermolecular interactions between complexes, it
seems that interactions between [MII(terpyOH)2](BF4)2 and [Ru(terpy)2](BF4)2
(MII = Fe, Cu) are more favourable than interactions between [Ni(terpyOH)2](BF4)2
and [Ru(terpy)2](BF4)2.
Statistically, the average [MII(terpyOH)2](BF4)2 mole fractions (xsolid) for all of the
co-crystallisation experiments were found to be greater than 0.50. In fact, the
majority of the co-crystals analysed from all of the systems were found to have
higher concentrations of the [MII(terpyOH)2](BF4)2 complex and none of the
[Fe(terpyOH)2]x[Ru(terpy)2]1-x(BF4)2 co-crystals that were measured were found to
have concentrations of [Fe(terpyOH)2](BF4)2 less than 0.50. These results suggest
that under these crystallising conditions, the two complexes in each of the
co-crystallising solutions have different solubilities. Measurements taken from the
powder obtained by evaporating the solvent from the mother liquors confirm this, as
higher concentrations of [Ru(terpy)2](BF4)2 relative to [MII(terpyOH)2](BF4)2 were
found. These are represented by the red data points enclosed in the red box in Figure
40. Measurements taken from crushed single co-crystals found the relative
[MII(terpyOH)2](BF4)2 concentration to be on average 0.06 higher than the relative
concentration found on the surface. This provides further evidence that the two
complexes in each co-crystallising solution have different solubilities thus forming
co-crystals with a subtle concentration gradient.
For these systems, it may be rationalised that [MII(terpyOH)2](BF4)2 crystallises first
with some of [Ru(terpy)2](BF4)2. As this process continues the solution concentration
of [MII(terpyOH)2](BF4)2 slightly decreases relative to [Ru(terpy)2](BF4)2. Therefore,
the relative concentrations of the two complexes constantly change during
co-crystallisation and as such, the concentration in the co-crystals also changes

CHAPTER 4
106
during co-crystal growth. The result is the formation of co-crystals that contain a
slight concentration gradient. Therefore, the results presented here suggest that the
co-crystallisation process for these systems is influenced by both the difference in the
solubilities of [MII(terpyOH)2](BF4)2 and [Ru(terpy)2](BF4)2 and by supramolecular
selection.
For systems that involve complexes with similar solubilities such as those that form
co-crystals with the general formula [MA
xMB
1-x(terpy)2](PF6)2, supramolecular
selection is hypothesised to be due to molecular recognition processes, whereby
interactions between like complexes are slightly more favoured over interactions
between different complexes. This favourability causes one co-crystal to nucleate
with a slightly higher proportion of complex A to complex B and vice versa, which
then continues as a selection bias during co-crystal growth in favour of the complex
in greater proportion. However, for systems that involve complexes with different
solubilities, such as those discussed here, the selection bias that occurs during
co-crystallisation is likely instigated by the differences in solubility between the
complexes. This reasoning explains the greater proportion of [MII(terpyOH)2](BF4)2
that was found in the co-crystals as well as the variation in metal ratios between
co-crystals harvested from the same batch.
The difference between complexes in homoleptic experiments such as
[MA
xMB
1-x(terpy)2](PF6)2 occurs at the metal centre, which is shrouded by ligands
and therefore unseen by other complexes in solution. It has been demonstrated that
this unseen variation between complexes is being recognised beyond the point of
difference giving rise to systems that display supramolecular selection. Unlike the
[MA
xMB
1-x(terpy)2](PF6)2 homoleptic systems, molecular recognition processes
between [MII(terpyOH)2]
2+ and [Ru(terpy)2]
2+ complexes are influenced by
differences introduced at the metal centre and 4′-carbon position of the ligand. The
differences between the ligands is a variation that is visible to other complexes
during co-crystallisation.
Information relating to the structure and phase of pure samples and co-crystals were
ascertained using X-ray diffraction characterisation techniques. Figure 41 shows the
powder diffraction patterns of freshly prepared pure [Ru(terpy)2](BF4)2 and
CHAPTER 4
107
[MII(terpyOH)2](BF4)2 crystals (M
II = Fe, Ni, Cu). Patterns simulated from single
crystal structures are also shown. Figure 42 - Figure 44 show the powder diffraction
patterns of the various [MII(terpyOH)2]x[Ru(terpy)2]1-x(BF4)2 co-crystals, that were
co-crystallised from solutions containing equimolar ratios of [MII(terpyOH)2](BF4)2
and [Ru(terpy)2](BF4)2 (MII = Fe, Ni, Cu). These figures also show the powder
patterns obtained from the pure complexes that were present in the co-crystallisation
solution and a pattern simulated from SCXRD data collected from the corresponding
[MII(terpyOH)2]x[Ru(terpy)2]1-x(BF4)2 single co-crystal. The patterns simulated from
single crystal data were used as reference patterns to assign Miller indices to the
peaks in the corresponding experimentally obtained PXRD patterns. Simulated
reference patterns are shown above the experimentally obtained patterns for which
they match. The labelled dotted lines emphasise the positions of the prominent peaks
that are present in like patterns. Powder patterns and experimental single crystal data
were collected at room temperature and 100 K respectively. Refer to Sections 3.2.2
and 3.2.3 for full preparative details.
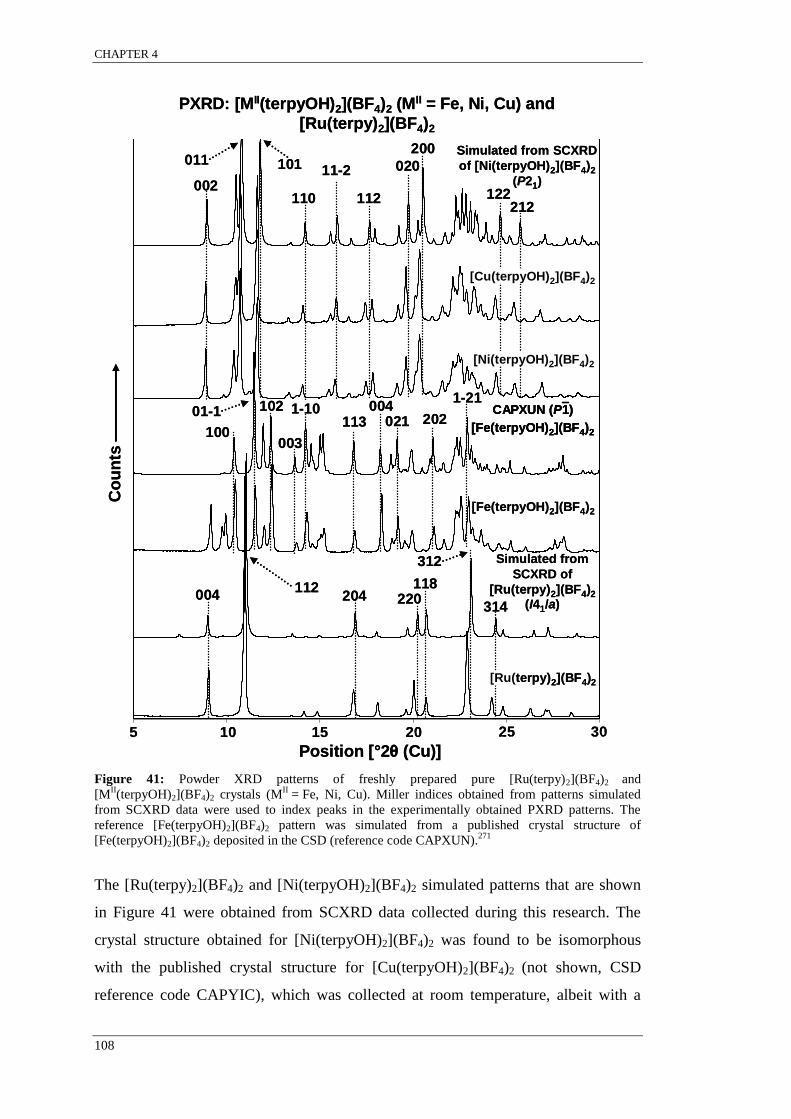
CHAPTER 4
108
Figure 41: Powder XRD patterns of freshly prepared pure [Ru(terpy)2](BF4)2 and
[MII(terpyOH)2](BF4)2 crystals (M
II = Fe, Ni, Cu). Miller indices obtained from patterns simulated
from SCXRD data were used to index peaks in the experimentally obtained PXRD patterns. The
reference [Fe(terpyOH)2](BF4)2 pattern was simulated from a published crystal structure of
[Fe(terpyOH)2](BF4)2 deposited in the CSD (reference code CAPXUN).271
The [Ru(terpy)2](BF4)2 and [Ni(terpyOH)2](BF4)2 simulated patterns that are shown
in Figure 41 were obtained from SCXRD data collected during this research. The
crystal structure obtained for [Ni(terpyOH)2](BF4)2 was found to be isomorphous
with the published crystal structure for [Cu(terpyOH)2](BF4)2 (not shown, CSD
reference code CAPYIC), which was collected at room temperature, albeit with a
5 10 15 20 25 30
002112110
11-2
200
020011 101
305 10 15 20 25
Co
un
ts
Position [°2θ (Cu)]
PXRD: [MII(terpyOH)2](BF4)2 (MII = Fe, Ni, Cu) and
[Ru(terpy)2](BF4)2
Simulated from
SCXRD of
[Ru(terpy)2](BF4)2
(I41/a)
[Fe(terpyOH)2](BF4)2
Simulated from SCXRD
of [Ni(terpyOH)2](BF4)2
(P21)
004112
204 220118
312
314
[Ru(terpy)2](BF4)2
212122
[Ni(terpyOH)2](BF4)2
[Cu(terpyOH)2](BF4)2
CAPXUN (P1)
[Fe(terpyOH)2](BF4)2100
01-1 102 1-10113
004021
1-21
003
202
5 10 15 20 25 30
002112110
11-2
200
020011 101
305 10 15 20 25
Co
un
ts
Position [°2θ (Cu)]
PXRD: [MII(terpyOH)2](BF4)2 (MII = Fe, Ni, Cu) and
[Ru(terpy)2](BF4)2
Simulated from
SCXRD of
[Ru(terpy)2](BF4)2
(I41/a)
[Fe(terpyOH)2](BF4)2
Simulated from SCXRD
of [Ni(terpyOH)2](BF4)2
(P21)
004112
204 220118
312
314
[Ru(terpy)2](BF4)2
212122
[Ni(terpyOH)2](BF4)2
[Cu(terpyOH)2](BF4)2
CAPXUN (P1)
[Fe(terpyOH)2](BF4)2
CAPXUN (P1)
[Fe(terpyOH)2](BF4)2100
01-1 102 1-10113
004021
1-21
003
202

CHAPTER 4
109
slightly smaller unit cell.271 The [Fe(terpyOH)2](BF4)2 reference trace was simulated
from the published crystal structure of [Fe(terpyOH)2](BF4)2 (CSD reference code
CAPXUN) that was grown from an MeCN/H2O solution.271 Refinement data for the
published [Cu(terpyOH)2](BF4)2 and [Fe(terpyOH)2](BF4)2 structures (CSD
reference codes CAPYIC and CAPXUN) and the experimental [Ni(terpyOH)2](BF4)2
structure collected during this research are provided in Appendix D. The refinement
for the [Ru(terpy)2](BF4)2 was problematic due to pseudo-symmetry issues that were
not satisfactorily resolved and therefore only the unit cell parameters are presented
for this structure in Appendix D. The accompanying CD contains the
crystallographic information files (.cif) for these crystal structures.
The data presented in Figure 41 suggest that pure samples of [Ni(terpyOH)2](BF4)2
and [Cu(terpyOH)2](BF4)2 are isomorphous and crystallise in the monoclinic P21
space group. The simulated pattern obtained from SCXRD data collected from a
[Ni(terpyOH)2](BF4)2 single crystal is very similar to the patterns of
[Ni(terpyOH)2](BF4)2 and [Cu(terpyOH)2](BF4)2. The leftward shifts of the peaks in
the experimentally obtained powder patterns compared to the same peaks in the
pattern simulated from the [Ni(terpyOH)2](BF4)2 structure indicate a slight change in
lattice dimensions. This suggests that although the phase remains constant between
100 and 298 K, the lattice dimensions of the [Ni(terpyOH)2](BF4)2 and
[Cu(terpyOH)2](BF4)2 unit cells are slightly larger at room temperature. The
experimental [Fe(terpyOH)2](BF4)2 powder pattern correlates well with the pattern
simulated from the published structure, which was collected at room temperature and
found to belong to the triclinic P1̄ space group (CSD reference code CAPXUN). The
peaks at 9.2, 9.8 and 9.9°2θ that are observed in the experimentally obtained
[Fe(terpyOH)2](BF4)2 powder pattern correspond to the [002], [010] and [011]
reflections, which are present but very weak in the simulated pattern. The difference
in the intensity of these peaks is most likely due to preferred orientation effects as
opposed to a phase impurity. The [Ru(terpy)2](BF4)2 powder pattern matches the
pattern simulated from the [Ru(terpy)2](BF4)2 tetragonal I41/a structure. The
positions of some of the peaks in the experimental [Ru(terpy)2](BF4)2 pattern are
slightly to the left of the same peaks in the pattern simulated from the SCXRD data,
indicating a slight expansion of the unit cell at room temperature.
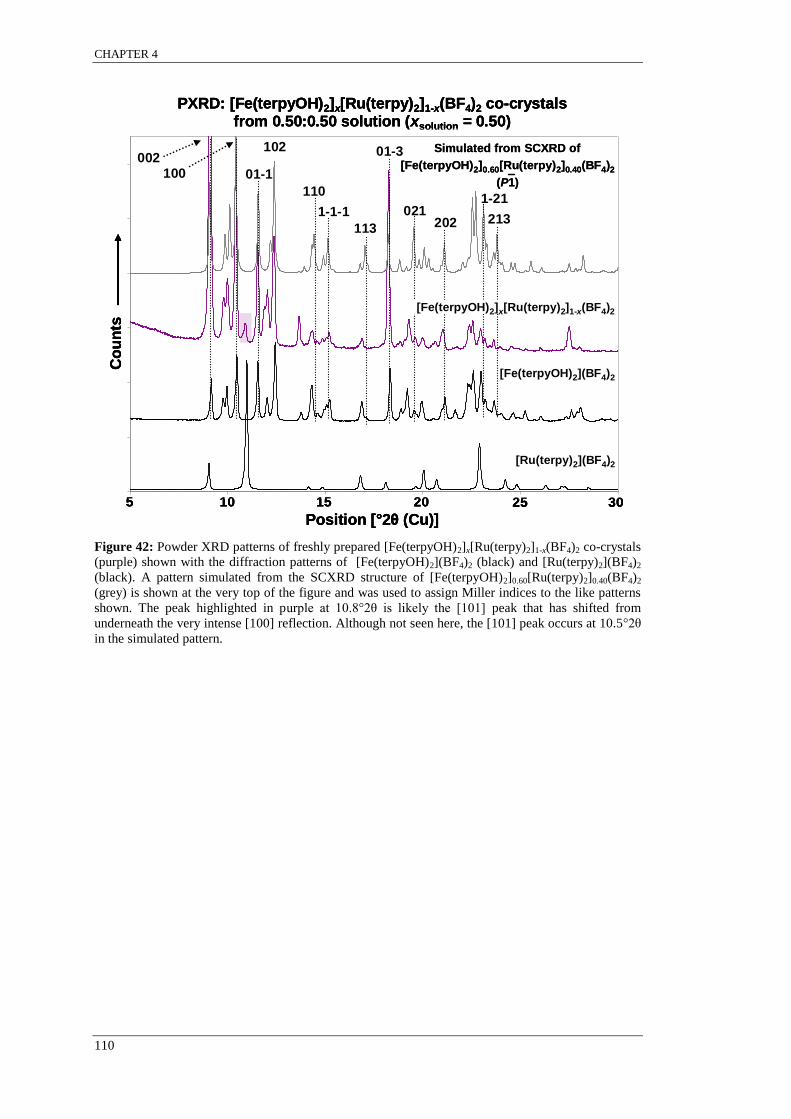
CHAPTER 4
110
Figure 42: Powder XRD patterns of freshly prepared [Fe(terpyOH)2]x[Ru(terpy)2]1-x(BF4)2 co-crystals
(purple) shown with the diffraction patterns of [Fe(terpyOH)2](BF4)2 (black) and [Ru(terpy)2](BF4)2
(black). A pattern simulated from the SCXRD structure of [Fe(terpyOH)2]0.60[Ru(terpy)2]0.40(BF4)2
(grey) is shown at the very top of the figure and was used to assign Miller indices to the like patterns
shown. The peak highlighted in purple at 10.8°2θ is likely the [101] peak that has shifted from
underneath the very intense [100] reflection. Although not seen here, the [101] peak occurs at 10.5°2θ
in the simulated pattern.
0
2000
4000
6000
8000
10000
12000
5 10 15 20 25 30305 10 15 20 25
Co
un
ts
Position [°2θ (Cu)]
PXRD: [Fe(terpyOH)2]x[Ru(terpy)2]1-x(BF4)2 co-crystalsfrom 0.50:0.50 solution (xsolution = 0.50)
[Ru(terpy)2](BF4)2
[Fe(terpyOH)2](BF4)2
Simulated from SCXRD of
[Fe(terpyOH)2]0.60[Ru(terpy)2]0.40(BF4)2
(P1)
002
01-1
102 01-3
100
021202113
1-21
213
110
1-1-1
[Fe(terpyOH)2]x[Ru(terpy)2]1-x(BF4)2
0
2000
4000
6000
8000
10000
12000
5 10 15 20 25 30305 10 15 20 25
Co
un
ts
Position [°2θ (Cu)]
PXRD: [Fe(terpyOH)2]x[Ru(terpy)2]1-x(BF4)2 co-crystalsfrom 0.50:0.50 solution (xsolution = 0.50)
[Ru(terpy)2](BF4)2
[Fe(terpyOH)2](BF4)2
Simulated from SCXRD of
[Fe(terpyOH)2]0.60[Ru(terpy)2]0.40(BF4)2
(P1)
Simulated from SCXRD of
[Fe(terpyOH)2]0.60[Ru(terpy)2]0.40(BF4)2
(P1)
002
01-1
102 01-3
100
021202113
1-21
213
110
1-1-1
[Fe(terpyOH)2]x[Ru(terpy)2]1-x(BF4)2

CHAPTER 4
111
Figure 43: Powder XRD patterns of freshly prepared [Ni(terpyOH)2]x[Ru(terpy)2]1-x(BF4)2 co-crystals
(green) shown with the diffraction patterns of [Ni(terpyOH)2](BF4)2 (black) and [Ru(terpy)2](BF4)2
(black). A pattern simulated from the SCXRD structure of [Ni(terpyOH)2]0.60[Ru(terpy)2]0.40(BF4)2
(grey) is shown at the very top of the figure and was used to assign Miller indices to the like patterns
shown.
0
2000
4000
6000
8000
10000
12000
5 10 15 20 25 30305 10 15 20 25
Co
un
ts
Position [°2θ (Cu)]
PXRD: [Ni(terpyOH)2]x[Ru(terpy)2]1-x(BF4)2 co-crystals
from 0.50:0.50 solution (xsolution = 0.50)
[Ru(terpy)2](BF4)2
Simulated from SCXRD of
[Ni(terpyOH)2]0.60[Ru(terpy)2]0.40(BF4)2
(P21)002
212
112
122
10-411-2
011101
10-1
020
200 210
[Ni(terpyOH)2](BF4)2
[Ni(terpyOH)2]x[Ru(terpy)2]1-x(BF4)2
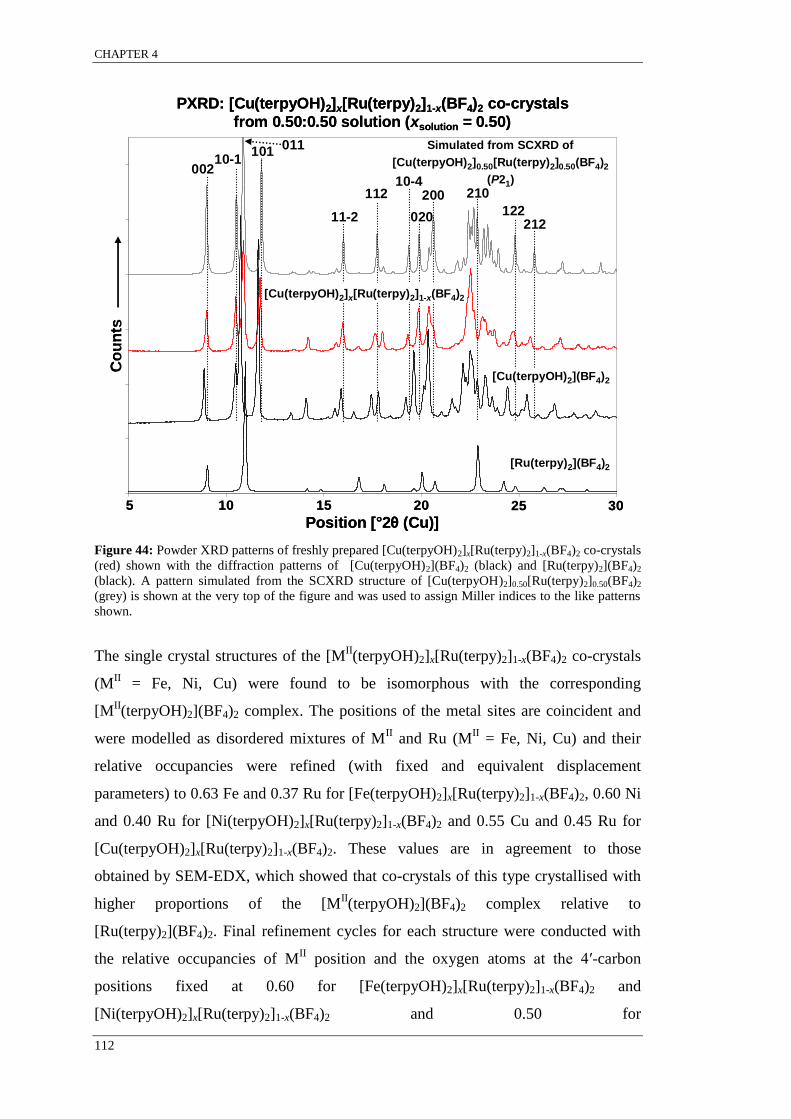
CHAPTER 4
112
Figure 44: Powder XRD patterns of freshly prepared [Cu(terpyOH)2]x[Ru(terpy)2]1-x(BF4)2 co-crystals
(red) shown with the diffraction patterns of [Cu(terpyOH)2](BF4)2 (black) and [Ru(terpy)2](BF4)2
(black). A pattern simulated from the SCXRD structure of [Cu(terpyOH)2]0.50[Ru(terpy)2]0.50(BF4)2
(grey) is shown at the very top of the figure and was used to assign Miller indices to the like patterns
shown.
The single crystal structures of the [MII(terpyOH)2]x[Ru(terpy)2]1-x(BF4)2 co-crystals
(MII = Fe, Ni, Cu) were found to be isomorphous with the corresponding
[MII(terpyOH)2](BF4)2 complex. The positions of the metal sites are coincident and
were modelled as disordered mixtures of MII and Ru (M
II = Fe, Ni, Cu) and their
relative occupancies were refined (with fixed and equivalent displacement
parameters) to 0.63 Fe and 0.37 Ru for [Fe(terpyOH)2]x[Ru(terpy)2]1-x(BF4)2, 0.60 Ni
and 0.40 Ru for [Ni(terpyOH)2]x[Ru(terpy)2]1-x(BF4)2 and 0.55 Cu and 0.45 Ru for
[Cu(terpyOH)2]x[Ru(terpy)2]1-x(BF4)2. These values are in agreement to those
obtained by SEM-EDX, which showed that co-crystals of this type crystallised with
higher proportions of the [MII(terpyOH)2](BF4)2 complex relative to
[Ru(terpy)2](BF4)2. Final refinement cycles for each structure were conducted with
the relative occupancies of MII position and the oxygen atoms at the 4′-carbon
positions fixed at 0.60 for [Fe(terpyOH)2]x[Ru(terpy)2]1-x(BF4)2 and
[Ni(terpyOH)2]x[Ru(terpy)2]1-x(BF4)2 and 0.50 for
0
2000
4000
6000
8000
10000
12000
5 10 15 20 25 30305 10 15 20 25
Co
un
ts
Position [°2θ (Cu)]
PXRD: [Cu(terpyOH)2]x[Ru(terpy)2]1-x(BF4)2 co-crystals
from 0.50:0.50 solution (xsolution = 0.50)
[Ru(terpy)2](BF4)2
Simulated from SCXRD of
[Cu(terpyOH)2]0.50[Ru(terpy)2]0.50(BF4)2
(P21)002
212
112
122
10-4
11-2
011101
10-1
020
200 210
[Cu(terpyOH)2]x[Ru(terpy)2]1-x(BF4)2
[Cu(terpyOH)2](BF4)2

CHAPTER 4
113
[Cu(terpyOH)2]x[Ru(terpy)2]1-x(BF4)2.* Each unit cell was also found to contain one
water molecule, one ordered BF4- and one rotationally disordered BF4
- counterion.
Appendix E summarises the crystal refinement data for these co-crystals. The
accompanying CD contains the crystallographic information files (.cif) for these
crystal structures.
The powder patterns of the co-crystallised samples that are shown in Figure
43 and Figure 44 look similar to the [MII(terpyOH)2](BF4)2 pattern and the pattern
simulated from the SCXRD that are shown within the same figure. The relative peak
intensities in the experimentally obtained [Fe(terpyOH)2]x[Ru(terpy)2]1-x(BF4)2
powder pattern (shown in purple in Figure 42) do not match the relative intensities
observed in the [Fe(terpyOH)2](BF4)2 and simulated patterns. This discrepancy is
most obvious for the [002] and [01-3] reflections as they are relatively much larger in
the purple pattern than in the [Fe(terpyOH)2](BF4)2 or simulated patterns. This is
likely caused by preferred orientation effects, which arise when crystallites in a
powder are orientated in some ways more often than others. The patterns for the
[Ni(terpyOH)2]x[Ru(terpy)2]1-x(BF4)2 and [Cu(terpyOH)2]x[Ru(terpy)2]1-x(BF4)2
systems (Figure 43 and Figure 44 respectively) suggests that there are minimal
preferred orientation effects.
Also there is a peak at 10.8°2θ in the [Fe(terpyOH)2]x[Ru(terpy)2]1-x(BF4)2 PXRD
pattern that is not observed in the [Fe(terpyOH)2](BF4)2 or simulated patterns. This
peak could be due to the shift of the [101] reflection from underneath the very
intense [100] peak. Although not seen here, the
[Fe(terpyOH)2]0.60[Ru(terpy)2]0.40(BF4)2 simulated pattern contains a peak at 10.5°2θ
that is concealed under the [100] reflection. This extra peak could also be due to a
phase impurity as it coincides with the [Ru(terpy)2](BF4)2 [112] reflection. All of the
other major [Ru(terpy)2](BF4)2 reflections occur at the same position as peaks in the
pure [Fe(terpyOH)2](BF4)2 pattern and the pattern simulated from the
[Fe(terpyOH)2]0.60[Ru(terpy)2]0.40(BF4)2 structure. Since no bright red sheet-like
* SEM-EDX data of the same [Fe(terpyOH)2]x[Ru(terpy)2]1-x(BF4)2 co-crystal was obtained upon
completion of SCXRD data and suggested xsolid = 0.60 ± 0.02. For each of the SCXRD datasets
discussed herein, when the relative occupancies were fixed at Ru 0.40 or 0.50 prior to refinement,
only very minimal changes in the refinement residuals were observed. Hence, the final refinement
cycles were performed with the relative occupancies fixed at the values stipulated.

CHAPTER 4
114
crystals were observed in any of the co-crystallisation batches, a phase impurity is
unlikely. None of the other systems show any signs of phase impurities. Overall the
PXRD patterns collected from [MII(terpyOH)2]x[Ru(terpy)2]1-x(BF4)2 co-crystals
strongly suggest that the bulk sample is composed of the [MII(terpyOH)2](BF4)2
phase; P1̄ for [Fe(terpyOH)2]x[Ru(terpy)2]1-x(BF4)2 and P21 for
[Ni(terpyOH)2]x[Ru(terpy)2]1-x(BF4)2 and [Cu(terpyOH)2]x[Ru(terpy)2]1-x(BF4)2. No
significant evidence points to the formation of co-crystals that belong to the
tetragonal I41/a [Ru(terpy)2](BF4)2 phase.
Experiments where [MII(terpyOH)2](BF4)2 (M
II = Fe, Ni, Cu) were co-crystallised
with [Ru(terpy)2](BF4)2 in 0.05:0.95 ratios (xsolid = 0.05) were conducted to test
whether [MII(terpyOH)2]
2+ complexes could adopt the tetragonal I41/a
[Ru(terpy)2](BF4)2 phase. Representative SEM-EDX statistical data for these
systems are summarised in Table 15 in the same manner as those for analogous
0.50:0.50 experiments.
Figure 45 is a colour-coded graphical representation of the same EDX information
summarised in Table 15. The horizontal axis shows the different combinations of
co-crystallised metal complexes and hence the metal ratios of interest and are
labelled from left to right as Fe:Ru, Co:Ru, Ni:Ru and Cu:Ru. In addition, the
measurements from each batch are labelled with the general formula i.e.
measurements from the Ni:Ru batch are labelled
[Ni(terpyOH)2]x[Ru(terpy)2]1-x(BF4)2. The y axis is labelled MII
xsolid, thus for the
Ni:Ru system, this refers to the x variable in the [Ni(terpyOH)2]x[Ru(terpy)2]1-x(BF4)2
formula, and is the atomic fraction of Ni detected in the solid by SEM-EDX. Note
that the y axis has been expanded showing a range of 0.00-0.20 so that data points
can be viewed with minimal overlap. It is important to note that data points of the
same colour/shape represent measurements taken from any particular co-crystal
within a co-crystallisation batch. So for example, the data points outlined by the blue
box, are from a different co-crystal to those outlined by the orange box, but both sets
of measurements were from co-crystals grown from the same solution.

CHAPTER 4
115
Table 15: Statistical summary of xsolid values obtained from EDX data for experiments resulting in
co-crystals with the general formula [MII(terpyOH)2]x[Ru(terpy)2]1-x(BF4)2 that were formed from
solutions containing 5% [MII(terpyOH)2](BF4)2. The sample mean (x̄), standard deviation (s), the
minimum, maximum and range of MII xsolid values are shown along with the co-crystal formula. The
xsolid data correspond to the element in bold.
Co-crystallising systems x̄(xsolid) s(xsolid) Minimum Maximum Range
[Fe(terpyOH)2]x[Ru(terpy)2]1-x(BF4)2 0.09 0.03 0.03 0.12 0.09
[Ni(terpyOH)2]x[Ru(terpy)2]1-x(BF4)2 0.07 0.04 0.03 0.12 0.09
[Cu(terpyOH)2]x[Ru(terpy)2]1-x(BF4)2 0.08 0.04 0.05 0.17 0.12
Figure 45: Colour-coded plot of EDX results of co-crystals of the general formula
[MII(terpyOH)2]x[Ru(terpy)2]1-x(BF4)2 that were grown from solutions containing 5%
[MII(terpyOH)2](BF4)2. The horizontal axis shows the metal ratios of interest and are labelled from left
to right as Fe:Ru, Ni:Ru and Cu:Ru. The y axis is labelled MII xsolid, and corresponds to the atomic
fraction of MII detected in the solid by SEM-EDX.
The mother liquors at the time the co-crystals were harvested were still intensely red
indicating that a significant proportion of [Ru(terpy)2](BF4)2 remained in solution.
SEM-EDX of the solid residue obtained from evaporating the mother liquors
indicated that negligible amounts of the [MII(terpyOH)2](BF4)2 remained in solution.
It may appear that repeat measurements taken from a single co-crystal within a batch
deviate significantly from one another; however, upon closer inspection, this
observation is simply a visual illusion due to the small amounts of MII detected in the
Fe:Ru Ni:Ru Cu:Ru0.00
0.05
0.10
0.15
0.20
0 0.1 0.2 0.3 0.4
MII
xs
oli
d
0.00
0.05
0.10
0.15
0.20
EDX GRAPHICAL SUMMARY: [MII(terpyOH)2]x[Ru(terpy)2]1-x(BF4)2
from 0.05:0.95 solutions
Co-crystallisation experiment
[Ni(terpyOH)2]x[Ru(terpy)2]1-x(BF4)2
[Fe(terpyOH)2]x[Ru(terpy)2]1-x(BF4)2
[Cu(terpyOH)2]x[Ru(terpy)2]1-x(BF4)2
0.00
0.05
0.10
0.15
0.20
0 0.1 0.2 0.3 0.4
MII
xs
oli
d
0.00
0.05
0.10
0.15
0.20
EDX GRAPHICAL SUMMARY: [MII(terpyOH)2]x[Ru(terpy)2]1-x(BF4)2
from 0.05:0.95 solutions
Co-crystallisation experiment
[Ni(terpyOH)2]x[Ru(terpy)2]1-x(BF4)2
[Fe(terpyOH)2]x[Ru(terpy)2]1-x(BF4)2
[Cu(terpyOH)2]x[Ru(terpy)2]1-x(BF4)2

CHAPTER 4
116
solid.* As with the analogous 0.50:0.50 experiments, the SEM-EDX data for these
experiments show clustered data points for measurements taken from the same
co-crystal (± 0.03). These results show that allowing for instrumental error, the ratio
of the two complexes in each single co-crystal varies very little over the areas
measured.
Differences between measurements obtained from crushed co-crystals and those
made on the co-crystal surface were not significant (differences of 0.01-0.02).
However, the average xsolid values from different co-crystals grown from the same
batch were observed to differ significantly; between 0.05-0.10 depending on the
co-crystallising system, such that xsolid single co-crystal 1 ≠ xsolid single co-crystal 2. As observed
for the 0.50:0.50 experiments, these data also indicate that
[MII(terpyOH)2]x[Ru(terpy)2]1-x(BF4)2 co-crystals grown from a solution containing
only 5% [MII(terpyOH)2](BF4)2 can have a range of [M
II(terpyOH)2](BF4)2
concentrations relative to [Ru(terpy)2](BF4)2. Overall, the data suggest that even at
[MII(terpyOH)2](BF4)2 initial solution concentrations of 5% relative to
[Ru(terpy)2](BF4)2, some degree of supramolecular selection occurs during
co-crystallisation.
The structures of the resulting co-crystals were inferred through the collection of
PXRD patterns. The [MII(terpyOH)2]x[Ru(terpy)2]1-x(BF4)2 powder patterns
(MII = Fe, Cu) for co-crystals grown from solutions containing 5%
[MII(terpyOH)2](BF4)2 are shown in Figure 46 with the pattern of pure
[Ru(terpy)2](BF4)2. Figure 47 shows the powder patterns of
[Ni(terpyOH)2]x[Ru(terpy)2]1-x(BF4)2, [Ni(terpyOH)2](BF4)2 and [Ru(terpy)2](BF4)2.
* Absolute instrumental error remains the same, however, relative instrumental error is larger due to
smaller MII xsolid values that are obtained.

CHAPTER 4
117
Figure 46: Powder XRD patterns of freshly prepared [Fe(terpyOH)2]x[Ru(terpy)2]1-x(BF4)2 (purple)
[Cu(terpyOH)2]x[Ru(terpy)2]1-x(BF4)2 co-crystals (red) that were grown from solutions containing 5%
[MII(terpyOH)2](BF4)2 (M
II = Fe, Cu). The [Ru(terpy)2](BF4)2 diffraction pattern is also shown
(black). The dotted lines emphasise the similarities between the patterns shown.
Figure 47: Powder XRD pattern of freshly prepared [Ni(terpyOH)2]x[Ru(terpy)2]1-x(BF4)2 (green)
co-crystals that were grown from a solution containing 5% [Ni(terpyOH)2](BF4)2. Diffraction patterns
of [Ni(terpyOH)2](BF4)2 and [Ru(terpy)2](BF4)2 are also shown (black). The dotted lines emphasise
the similarities between the patterns shown. The peaks highlighted by shaded area in the green pattern
have different relative intensities to the peaks in the [Ni(terpyOH)2](BF4)2 pattern. This is likely due to
preferred orientation effects.
Interpretation of the diffraction patterns shown in Figure 46 suggests that
[MII(terpyOH)2]x[Ru(terpy)2]1-x(BF4)2 co-crystals grown from solutions containing
5% [MII(terpyOH)2](BF4)2 (M
II = Fe, Cu) adopted the tetragonal I41/a
[Ru(terpy)2](BF4)2 phase. There is no evidence of the [MII(terpyOH)2](BF4)2 phase in
these patterns. The [Ni(terpyOH)2]x[Ru(terpy)2]1-x(BF4)2 pattern shown in Figure 47
0
1000
2000
3000
4000
5000
6000
7000
8000
9000
5 10 15 20 25 30305 10 15 20 25
Position [ 2θ (Cu)]
PXRD: [MII(terpyOH)2]x[Ru(terpy)2]1-x(BF4)2 co-crystals (MII = Fe, Cu) from 0.05:0.95 solution (MII xsolution = 0.05)
[Cu(terpyOH)2]x[Ru(terpy)2]1-x(BF4)2C
ou
nts
[Fe(terpyOH)2]x[Ru(terpy)2]1-x(BF4)2
[Ru(terpy)2](BF4)2
0
1000
2000
3000
4000
5000
6000
7000
8000
9000
5 10 15 20 25 30305 10 15 20 25
Position [ 2θ (Cu)]
PXRD: [Ni(terpyOH)2]x[Ru(terpy)2]1-x(BF4)2 co-crystals from 0.05:0.95 solution (MII xsolution = 0.05)
[Ru(terpy)2](BF4)2
[Ni(terpyOH)2]x[Ru(terpy)2]1-x(BF4)2
[Ni(terpyOH)2](BF4)2
Co
un
ts

CHAPTER 4
118
shares many similarities with the [Ni(terpyOH)2](BF4)2 shown. The peaks
highlighted by shaded area in the green pattern have different relative intensities to
the peaks in the [Ni(terpyOH)2](BF4)2 pattern. The relative intensities of the peaks in
the low angle region (8-11°2θ) are also different in the co-crystal pattern to those in
the [Ni(terpyOH)2](BF4)2 pattern. This distortion in the relative peak intensities is
most likely due to preferred orientation effects. Overall, the patterns shown in Figure
47 suggest that [Ni(terpyOH)2]x[Ru(terpy)2]1-x(BF4)2 co-crystals grown from a
solution containing 5% [Ni(terpyOH)2](BF4)2 adopt the monoclinic P21
[Ni(terpyOH)2](BF4)2 phase.
4.3.3 Co-crystallisation experiments involving [MII
(terpyPh)2](PF6)2,
[Ni(phen)3](PF6)2 and [Ni(bipy)3](PF6)2
The following experiments were designed to test the effects of large differences
between complexes, which are chemically and structurally different on the
co-crystallisation process. The main differences between [MII(terpy)2]
2+ and
[Ni(L)3]2+
complexes (L = phen, bipy) is that the former has S4 point symmetry,
while the latter has D3 point symmetry. Regardless of the structural differences
between the all of the complexes involved in these experiments, each metal complex
is of a similar size and forms structures by engaging in some combination of OFF
and/or EF interactions. More specifically cation pairs of [Ni(phen)3]2+
, [Ru(terpy)2]2+
and [Ru(terpyPh)2]2+
all interact through one OFF and two EF interactions (phen and
terpy motifs respectively). Cation pairs of [Ni(bipy)3]2+
interact through a set of six
EF interactions. Therefore, in theory it is possible to form co-crystals of the general
formula [MII(terpyPh)2]x[Ru(terpy)2]1-x(PF6)2, [Ni(L)3]x[Ru(terpy)2]1-x(PF6)2 or
[Ni(L)3]x[Ru(terpyPh)2]1-x(PF6)2. Previous co-crystallisation experiments conducted
by our group, of the type [MA(bipy)3]x[M
B(phen)3]1-x(PF6)2 (M
A, M
B = Ni, Ru)
demonstrated that it is possible to combine two different motifs to form single
co-crystals containing both complexes.261,306
Several different ligand co-crystallisation experiments involving
[MII(terpyPh)2](PF6)2, [Ni(phen)3](PF6)2 and [Ni(bipy)3](PF6)2 were conducted.
Complexes with the formula [MII(terpyPh)2](PF6)2 (M
II = Fe, Ni, Cu) were
co-crystallised with [Ru(terpy)2](PF6)2 with the aim of forming co-crystals with the

CHAPTER 4
119
formula [MII(terpyPh)2]x[Ru(terpy)2]1-x(PF6)2. The aim of experiments where
[Ni(phen)3](PF6)2 or [Ni(bipy)3](PF6)2 were co-crystallised with either
[Ru(terpy)2](PF6)2 or [Ru(terpyPh)2](PF6)2 was to form co-crystals with the general
formula [Ni(L)3]x[Ru(terpy)2]1-x(PF6)2 and [Ni(L)3]x[Ru(terpyPh)2]1-x(PF6)2 (L =
phen, bipy).
Crystallisations were conducted using the slow evaporation method (1:1
MeCN:H2O). Table 16 summarises the co-crystallisation experiments. Each batch
combination was conducted twice to test reproducibility. Due to the results obtained
from the first two replicates, the vials in the third set of experiments were stoppered
after only partial co-crystallisation (after ca. one day). This last set of experiments
was conducted to test for any solubility differences between the complexes. Ten
co-crystals from each batch were analysed by SEM-EDX. This table summarises 21
co-crystallisation experiments. For exact preparative experimental details, refer to
Section 3.3.5.1.
Table 16: Summary of co-crystallisation experiments showing all metal complexes involved, their
colours and relative solution concentrations.
Complex A (colour) Complex B (red) Fraction of A in solution (xsolution)
[Fe(terpyPh)2](PF6)2 (purple) [Ru(terpy)2](PF6)2 0.50
[Ni(terpyPh)2](PF6)2 (tan) [Ru(terpy)2](PF6)2 0.50
[Cu(terpyPh)2](PF6)2 (blue) [Ru(terpy)2](PF6)2 0.20, 0.50 and 0.80
[Ni(phen)3](PF6)2 (pink) [Ru(terpy)2](PF6)2
0.80 [Ni(bipy)3](PF6)2 (pink) [Ru(terpy)2](PF6)2
[Ni(phen)3](PF6)2 (pink) [Ru(terpyPh)2](PF6)2
[Ni(bipy)3](PF6)2 (pink) [Ru(terpyPh)2](PF6)2
Repeated co-crystallisation experiments resulted in samples containing only pure
crystals of both complexes. The result was initially verified under an optical
microscope using the different colours and crystal habits of the pure complexes as
indicators of co-crystallisation. In each batch, two distinct types of crystals were
observed, each type of the same colour and habit of the crystals of the pure starting
materials. SEM-EDX measurements conducted on both types of crystal in each batch
confirmed that no co-crystallisation had occurred. SEM-EDX measurements
conducted on the crystals that formed from experiments that were allowed to only

CHAPTER 4
120
partially co-crystallise also formed crystals of both types of complex. Furthermore,
analysis of the residue obtained by evaporating the mother liquors indicated the
presence of both complexes in solution. These findings suggest that the cause of
these results is likely due to molecular recognition leading to extreme supramolecular
selection as opposed to solubility differences between the complexes in solution i.e.
complex A did not completely crystallise out before complex B (or vice versa).
Therefore, it appears that the supramolecular interactions of the two complexes in
each co-crystallisation experiment shown in Table 16 are too different to allow the
complexes to co-crystallise.
4.4 Chapter summary and conclusions
It was possible to exploit the 2D terpy embrace motif to synthesise four
[MII
xRu1-x(terpy)2](PF6)2 (MII = Fe, Co, Ni, Cu) and five
[MII(terpyOH)2]x[Ru(terpy)2]1-x(BF4)2 (M
II = Fe, Ni, Cu) novel co-crystals.
Co-crystals were characterised using XRD and SEM-EDX, the former to examine
phase and structure and the latter to quantify the amount of each metal complex
present in single co-crystals. XRD data for co-crystals from both systems suggested
the presence of a single phase and in the case of co-crystals grown from equimolar
solutions, indicated the absence of the [Ru(terpy)2]X2 (X = BF4-, PF6
-) phase. This
suggested that the [Ru(terpy)2]X2 structure is less robust as it was unable to
accommodate [MII(terpy)2](PF6)2 or [M
II(terpyOH)2](BF4)2 complexes at xsolution
values of 0.50. The [Ru(terpy)2](BF4)2 phase was exclusively adopted in co-crystals
of [MII(terpyOH)2]x[Ru(terpy)2]1-x(BF4)2 (M
II = Fe, Cu) when the xsolution of
[MII(terpyOH)2](BF4)2 was 0.05. SEM-EDX results for both types of systems
indicated that co-crystals grown from the same solution had a range of
concentrations such that xsolid single crystal 1 ≠ xsolid single crystal 2 and thus suggested that
complexes exhibited supramolecular selection.
Only crystals of pure complexes were obtained for experiments where
[Co(terpyO)(terpyOH)](BF4)2 was co-crystallised with [Ru(terpy)2](BF4)2,
[MII(terpyPh)2](PF6)2 (M
II = Fe, Ni, Cu) were co-crystallised with [Ru(terpy)2](PF6)2
and where [Ni(L)3](PF6)2 (L = phen, bipy) were co-crystallised with

CHAPTER 4
121
[Ru(terpy)2](PF6)2 or [Ru(terpyPh)2](PF6)2. The absence of any co-crystals suggested
that despite the apparent similarities between the complexes being co-crystallised
these combinations surpassed the limit for which molecular recognition processes
can be confused into co-crystallising different molecules into the same crystalline
lattice.
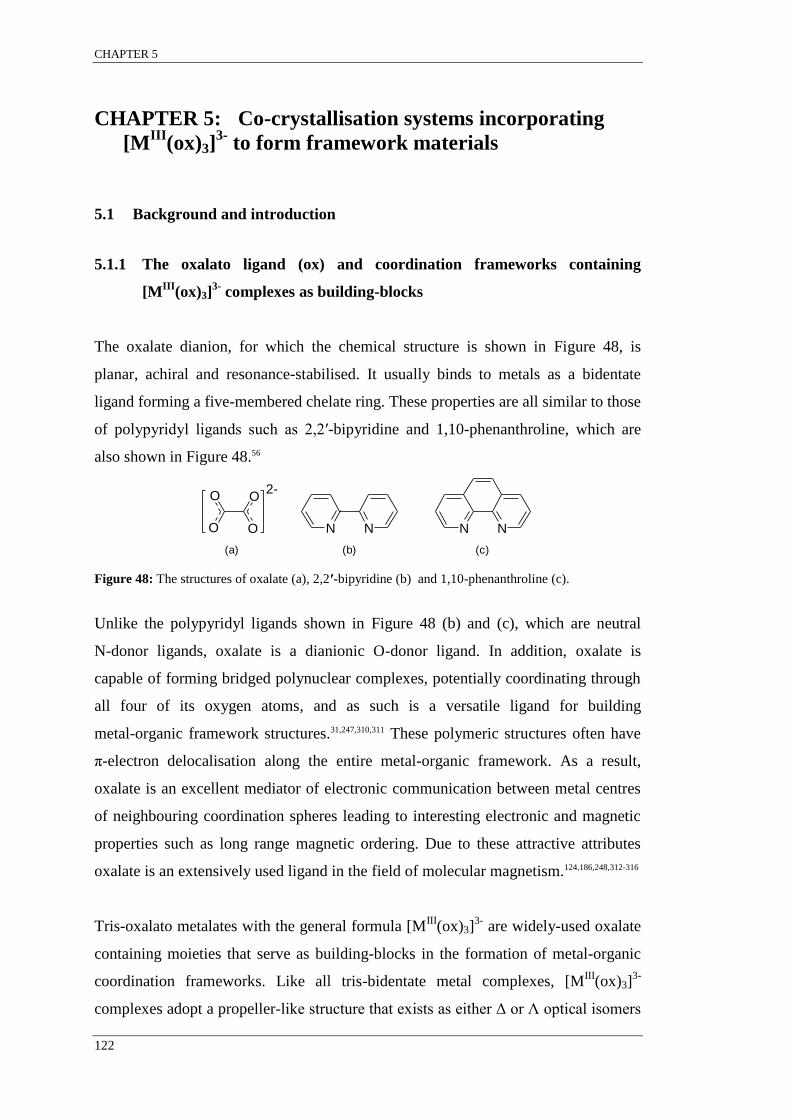
CHAPTER 5
122
CHAPTER 5: Co-crystallisation systems incorporating
[MIII
(ox)3]3-
to form framework materials
5.1 Background and introduction
5.1.1 The oxalato ligand (ox) and coordination frameworks containing
[MIII
(ox)3]3-
complexes as building-blocks
The oxalate dianion, for which the chemical structure is shown in Figure 48, is
planar, achiral and resonance-stabilised. It usually binds to metals as a bidentate
ligand forming a five-membered chelate ring. These properties are all similar to those
of polypyridyl ligands such as 2,2′-bipyridine and 1,10-phenanthroline, which are
also shown in Figure 48.56
Figure 48: The structures of oxalate (a), 2,2′-bipyridine (b) and 1,10-phenanthroline (c).
Unlike the polypyridyl ligands shown in Figure 48 (b) and (c), which are neutral
N-donor ligands, oxalate is a dianionic O-donor ligand. In addition, oxalate is
capable of forming bridged polynuclear complexes, potentially coordinating through
all four of its oxygen atoms, and as such is a versatile ligand for building
metal-organic framework structures.31,247,310,311 These polymeric structures often have
π-electron delocalisation along the entire metal-organic framework. As a result,
oxalate is an excellent mediator of electronic communication between metal centres
of neighbouring coordination spheres leading to interesting electronic and magnetic
properties such as long range magnetic ordering. Due to these attractive attributes
oxalate is an extensively used ligand in the field of molecular magnetism.124,186,248,312-316
Tris-oxalato metalates with the general formula [MIII
(ox)3]3-
are widely-used oxalate
containing moieties that serve as building-blocks in the formation of metal-organic
coordination frameworks. Like all tris-bidentate metal complexes, [MIII
(ox)3]3-
complexes adopt a propeller-like structure that exists as either Δ or Λ optical isomers
N N N N
O
OO
O2-
N N N N
O
OO
O2-
N N N N
O
OO
O2-
(a) (b) (c)
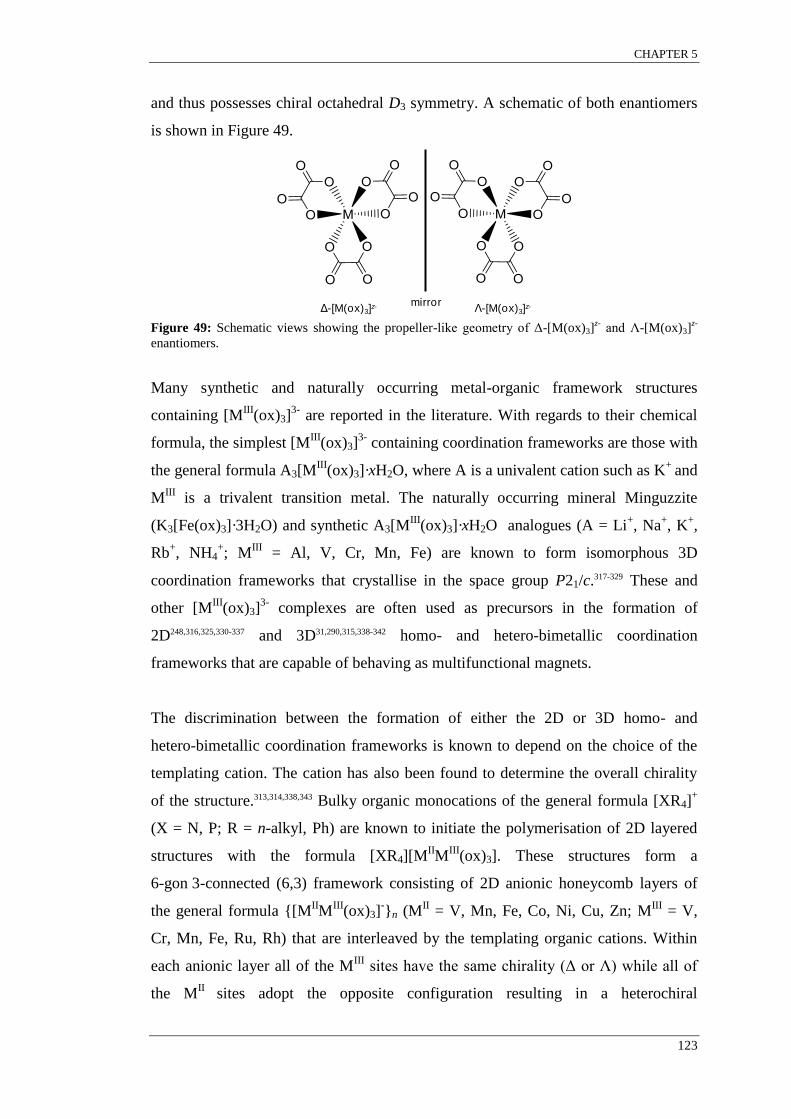
CHAPTER 5
123
and thus possesses chiral octahedral D3 symmetry. A schematic of both enantiomers
is shown in Figure 49.
Figure 49: Schematic views showing the propeller-like geometry of Δ-[M(ox)3]
z- and Λ-[M(ox)3]
z-
enantiomers.
Many synthetic and naturally occurring metal-organic framework structures
containing [MIII
(ox)3]3-
are reported in the literature. With regards to their chemical
formula, the simplest [MIII
(ox)3]3-
containing coordination frameworks are those with
the general formula A3[MIII
(ox)3]·xH2O, where A is a univalent cation such as K+
and
MIII
is a trivalent transition metal. The naturally occurring mineral Minguzzite
(K3[Fe(ox)3]·3H2O) and synthetic A3[MIII
(ox)3]·xH2O analogues (A = Li+, Na
+, K
+,
Rb+, NH4
+; M
III = Al, V, Cr, Mn, Fe) are known to form isomorphous 3D
coordination frameworks that crystallise in the space group P21/c.317-329 These and
other [MIII
(ox)3]3-
complexes are often used as precursors in the formation of
2D248,316,325,330-337 and 3D31,290,315,338-342 homo- and hetero-bimetallic coordination
frameworks that are capable of behaving as multifunctional magnets.
The discrimination between the formation of either the 2D or 3D homo- and
hetero-bimetallic coordination frameworks is known to depend on the choice of the
templating cation. The cation has also been found to determine the overall chirality
of the structure.313,314,338,343 Bulky organic monocations of the general formula [XR4]+
(X = N, P; R = n-alkyl, Ph) are known to initiate the polymerisation of 2D layered
structures with the formula [XR4][MIIM
III(ox)3]. These structures form a
6-gon 3-connected (6,3) framework consisting of 2D anionic honeycomb layers of
the general formula {[MIIM
III(ox)3]
-}n (M
II = V, Mn, Fe, Co, Ni, Cu, Zn; M
III = V,
Cr, Mn, Fe, Ru, Rh) that are interleaved by the templating organic cations. Within
each anionic layer all of the MIII
sites have the same chirality (Δ or Λ) while all of
the MII
sites adopt the opposite configuration resulting in a heterochiral
mirrorΔ-[M(ox)3]z- Λ-[M(ox)3]z-
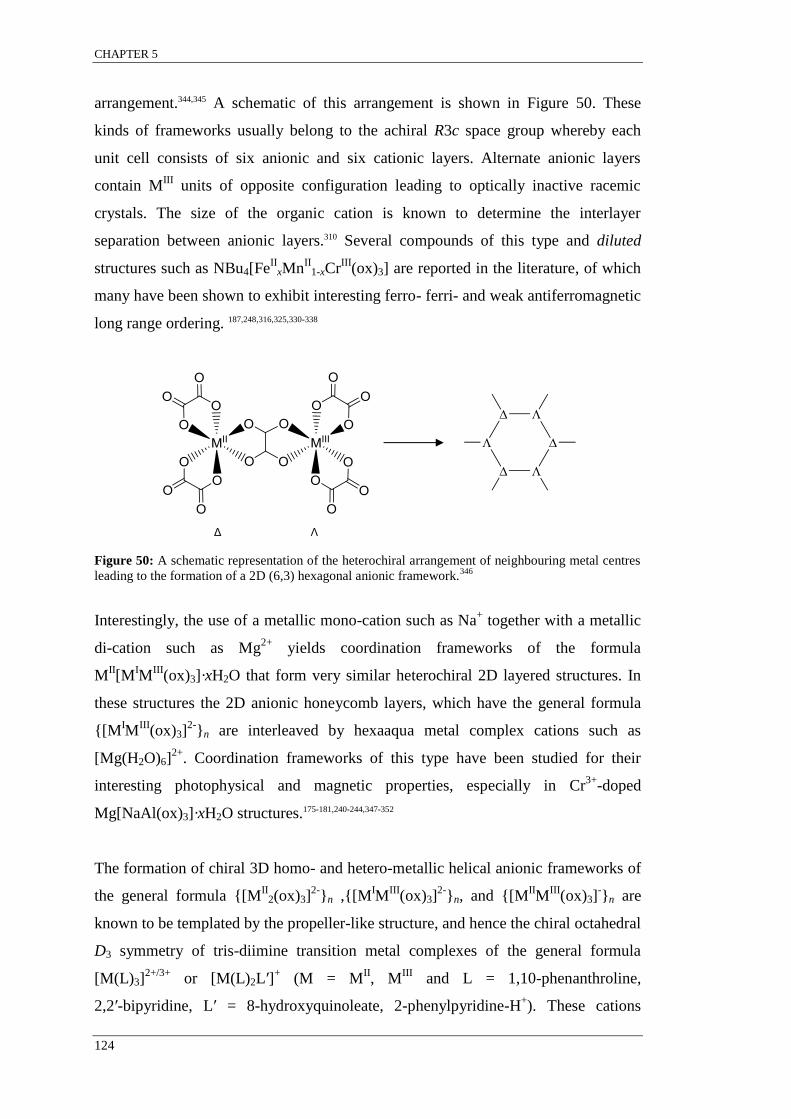
CHAPTER 5
124
arrangement.344,345 A schematic of this arrangement is shown in Figure 50. These
kinds of frameworks usually belong to the achiral R3c space group whereby each
unit cell consists of six anionic and six cationic layers. Alternate anionic layers
contain MIII
units of opposite configuration leading to optically inactive racemic
crystals. The size of the organic cation is known to determine the interlayer
separation between anionic layers.310 Several compounds of this type and diluted
structures such as NBu4[FeII
xMnII
1-xCrIII
(ox)3] are reported in the literature, of which
many have been shown to exhibit interesting ferro- ferri- and weak antiferromagnetic
long range ordering. 187,248,316,325,330-338
Figure 50: A schematic representation of the heterochiral arrangement of neighbouring metal centres
leading to the formation of a 2D (6,3) hexagonal anionic framework.346
Interestingly, the use of a metallic mono-cation such as Na+ together with a metallic
di-cation such as Mg2+
yields coordination frameworks of the formula
MII[M
IM
III(ox)3]·xH2O that form very similar heterochiral 2D layered structures. In
these structures the 2D anionic honeycomb layers, which have the general formula
{[MIM
III(ox)3]
2-}n are interleaved by hexaaqua metal complex cations such as
[Mg(H2O)6]2+
. Coordination frameworks of this type have been studied for their
interesting photophysical and magnetic properties, especially in Cr3+
-doped
Mg[NaAl(ox)3]·xH2O structures.175-181,240-244,347-352
The formation of chiral 3D homo- and hetero-metallic helical anionic frameworks of
the general formula {[MII
2(ox)3]2-
}n ,{[MIM
III(ox)3]
2-}n, and {[M
IIM
III(ox)3]
-}n are
known to be templated by the propeller-like structure, and hence the chiral octahedral
D3 symmetry of tris-diimine transition metal complexes of the general formula
[M(L)3]2+/3+
or [M(L)2L′]+ (M = M
II, M
III and L = 1,10-phenanthroline,
2,2′-bipyridine, L′ = 8-hydroxyquinoleate, 2-phenylpyridine-H+). These cations
Δ Λ

CHAPTER 5
125
template the formation of 10-gon 3-connected (10,3) anionic frameworks where the
metal ions are located at the ten vertices of a decagon and the [M(ox)3]z- moieties
behave as 3-point connecting nodes. The result is the formation of three sets of
interconnected helices of identical helicity where all of the metal sites in the
framework have the same chirality (all Δ or all Λ).344-346 A schematic of this
arrangement is shown in Figure 51.
Figure 51: A schematic representation of the homochiral arrangement of neighbouring metal centres
with Δ chirality (M1 = MI or M
II; M2 = M
II or M
III) leading to the formation of a 3D (10,3) helical
anionic framework. For clarity purposes only one helix is shown.310,346
The metal complex cations are situated within cavities created by the interconnected
anionic helices. The metal sites of the cationic metal complex guests have the same
chirality as the metal sites of the anionic framework resulting in a homochiral
structure such that each single crystal is enantiomerically pure. A schematic of this
host-guest arrangement between the anionic framework and the metal complex
cations is shown in Figure 52. The cavities are also flexible enough to accommodate
small monoanions (X-) such as ClO4
-, BF4
- or PF6
-. These ions are necessary for
structures such as [MII(L)3][M
IIM
III(ox)3]X, [M
III(L)3][M
IM
III(ox)3]X and
[MIII
(L)3][MII
2(ox)3]X where the combination of the anionic framework and
templating cation result in a net positive charge. These 3D coordination
metal-organic frameworks and those without the small monoanions (X-) usually
belong to enantiomorphic cubic space groups such as P4332 and P4132 for
homometallic structures containing {[MII
2(ox)3]2-
}n moieties and P213 for
heterometallic structures containing {[MIM
III(ox)3]
2-}n, or {[M
IIM
III(ox)3]
-}n
units.63,314,344,345 Several 3D coordination framework compounds of these types are
reported in the literature, of which many have been shown to exhibit properties such
as molecular magnetism and photophysics. 290,310,315,337-342,353-356
Δ Δ
M1(Δ)
M2(Δ)
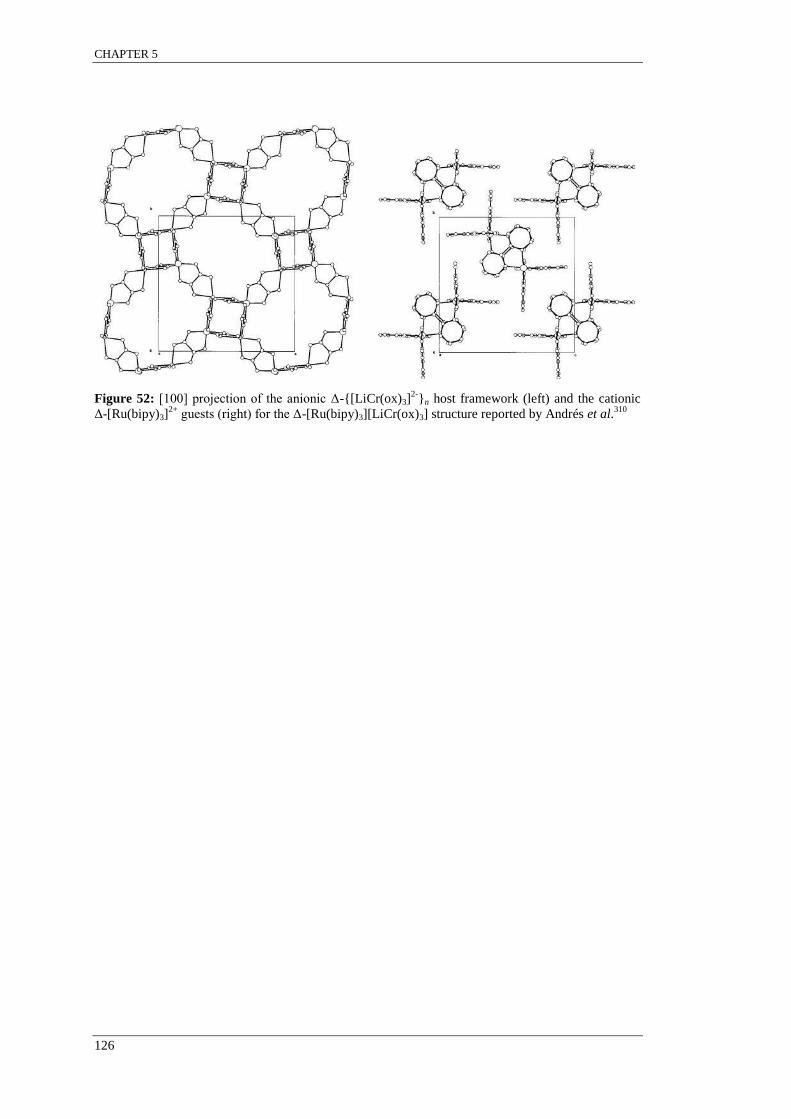
CHAPTER 5
126
Figure 52: [100] projection of the anionic Δ-{[LiCr(ox)3]2-
}n host framework (left) and the cationic
Δ-[Ru(bipy)3]2+
guests (right) for the Δ-[Ru(bipy)3][LiCr(ox)3] structure reported by Andrés et al.310

CHAPTER 5
127
5.2 Results and discussion
Thus far, co-crystallisation experiments discussed within this thesis have only
involved systems that yield single co-crystals that form structures with discrete
molecules. The term molecular structure describes crystal structures that exhibit
non-polymeric arrays. For these systems, metal complexes in the solid state generally
only interact through weak intermolecular forces to form supramolecular motifs.
Consequently, co-crystals of this type are usually soluble in common solvents and
once dissolved, dissociate to give the original metal complex ions. Co-crystals with
the formula [MA
xMB
1-x(L)n]X2 (MA, M
B = divalent metal cations; x = molar fraction
of MA relative to M
B in the crystalline state (as determined by SEM-EDX); L =
phen, bipy, terpy, terpyOH, terpyPh) are examples of molecular systems that have
been studied.261,306,307
Overall, it was found that the solid state compositions (i.e. the metal complex ratios
as determined by SEM-EDX) single co-crystals with the general formula
[MA
xMB
1-x(L)n]X2 varied from the metal complex ratios in solution i.e. xsolid ≠ xsolution.
In addition, it was found that for these systems, co-crystals grown from the same
solution ranged in composition i.e. xsolid single co-crystal 1 ≠ xsolid single co-crystal 2. These
results were attributed to a mechanism of supramolecular selection, which is thought
to be influenced by molecular recognition processes between the metal complexes
being co-crystallised during co-crystal growth. In the systems investigated thus far,
the supramolecular motifs have been mostly influenced by π-interactions between
ligands of neighbouring complexes. It should be noted, that of all the molecular
co-crystallisation systems investigated so far, only [MA
xMB
1-x(phen)3]X2 systems
were shown not to display supramolecular selection i.e. xsolid = xsolution and
xsolid single co-crystal 1 = xsolid single co-crystal 2, but further experiments have demonstrated that
this system is the exception rather than the rule. A detailed explanation of this
hypothesis can be found in Section 1.6.3.
For all of the homoleptic experiments conducted thus far that produced molecular
co-crystals, the geometric differences between the metal complexes being
co-crystallised in any one batch were almost negligible. For example, parameters
such as bite and twist angles for [MII(bipy)3]
2+ (M
II is a first or second row transition

CHAPTER 5
128
metal such Ni2+
or Ru2+
) vary by the smallest margins. It therefore very interesting
that the disparity between the metal centres in simple binary [MA
xMB
1-x(L)n]z systems
is being recognised beyond the point of difference, as intermolecular interactions
occur between the ligands of neighbouring coordinating spheres and not the metals.
Of all of the ligands used in the co-crystallisation experiments discussed thus far,
oxalate is the smallest at about half the size of 2,2′-bipyridine. The resulting
[MIII
(ox)3]3-
complexes are therefore also smaller than [MII(bipy)3]
2+. Ligand size is
thought to be a contributing factor influencing the degree of supramolecular selection
during co-crystallisation given that a greater relative structural change is imparted
when one metal centre is substituted for another. Previous results obtained from
simple binary homoleptic co-crystallisation experiments conducted by the candidate
indicated that complexes with smaller ligands exhibited greater supramolecular
selection: the metal centre accounted for a larger proportion of the metal complex.
For example, as introduced in Section 1.6.3, co-crystallisation experiments which
involved 2,2′-bipyridine to form [MA
xMB
1-x(bipy)3](PF6)2 co-crystals exhibited
supramolecular selection while those that involved the larger but very similar
1,10-phenanthroline ligand to form [MA
xMB
1-x(phen)3](PF6)2 co-crystals did not.35
The oxalato ligand and subsequently the [MIII
(ox)3]3-
complexes are negatively
charged; so far only cationic complexes have been the focus of co-crystallisation
experiments. Furthermore, metal centres of neighbouring coordinate spheres in
[MIII
(ox)3]3-
containing frameworks are linked through metal-oxygen bonds (M-O)
due to the bridging capability of the ligand. These recurring M-O bonds are stronger
(50-200 kJmol-1
) than the π interactions (0-50 kJmol-1
) found in the molecular
systems such as [MA
xMB
1-x(bipy)3](PF6)2.57 These factors are known to enhance the
electronic communication between the metal centres and may enhance the effects of
supramolecular selection through molecular recognition processes during
co-crystallisation.
Throughout this research, 3D co-crystalline metal-organic frameworks incorporating
[MIII
(ox)3]3-
complexes were prepared to examine the effects (if any) of bridging
neighbouring coordinating spheres on supramolecular selection. Section 5.2.1
discusses the co-crystallisation of two different [MIII
(ox)3]3-
metal complexes (MIII
=
CHAPTER 5
129
Cr, Mn, Fe, Ru, Rh) in the presence of K+ to form co-crystals of the general formula
K3[MA
xMB
1-x(ox)3]·xH2O. The results pertaining to epitaxial crystallisation
experiments involving the immersion of single crystal seeds of the formula
[MIII
(ox)3]·2.5H2O (MIII
= Cr, Fe) into saturated solutions of K3[MIII
(ox)3](aq/EtOH)
(MIII
= Cr, Fe or a 1:1 mixture) are also presented in this section. Section 5.2.2
discusses the co-crystallisation of [MIII
(ox)3]3-
(MIII
= Cr, Fe) with [MII(L)3]
2+ (M
II =
Ni, Ru; L = bipy, phen) in the presence of Na+ to form co-crystals of the general
formula [MA
xMB
1-x(L)3][NaMIII
(ox)3] and [MII(L)3][NaM
AxM
B1-x(ox)3].
5.2.1 Co-ordination frameworks of the type K3[MA
xMB
1-x(ox)3]
As mentioned throughout the introductory section to this chapter, the oxalato ligand
is a good mediator of long range magnetic order (ferro-, ferri- and
antiferromagnetism) between metal centres in polymeric structures. In simple
structures involving the [MIII
(ox)3]3-
subunit, magnetic behaviour is largely
dependent on the nature of the transition metal ion and the resulting crystal
structure.289,290,314,343,354,357 When recrystallised using the same method, crystals of the
formula K3[MIII
(ox)3]·3H2O (MIII
= Cr, Mn, Fe) are known to be isomorphous and
belong to the P21/c space group, while K3[MIII
(ox)3]·4.5H2O (MIII
= Ru, Rh) are
isomorphous, forming in the P1̄ space group.318-327,358,359 The PXRD patterns of the
pure complexes synthesised during this work are shown in Figure 53. This plot is
colour-coded so that each experimental pattern is paired with a matching pattern
simulated from literature SCXRD data. The formulae for the experimental patterns
(where known) were elucidated from microanalysis data. As expected the patterns
for K3[MIII
(ox)3]·3H2O (MIII
= Cr, Mn, Fe) are isomorphous belonging to the P21/c
space group, while the K3[Ru(ox)3]·xH2O pattern is observed to correlate well to the
simulated pattern from the P1̄ structure shown. The experimental pattern for
K3[Rh(ox)3]·2H2O did not match any of the K3[Rh(ox)3] literature patterns nor any of
the patterns simulated for K3[Ru(ox)3] but did correlate well with a pattern simulated
from data for K3[Co(ox)3]·2H2O (C2/c, CSD reference code DAZVUV).360
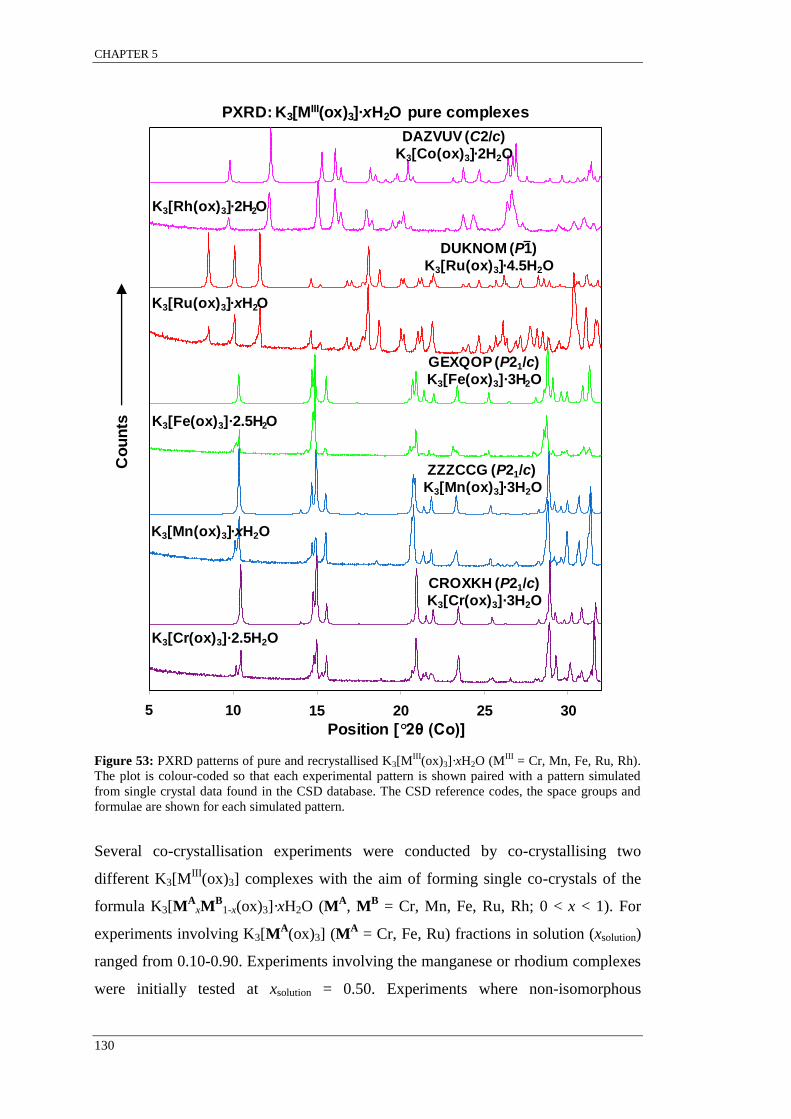
CHAPTER 5
130
Figure 53: PXRD patterns of pure and recrystallised K3[MIII
(ox)3]·xH2O (MIII
= Cr, Mn, Fe, Ru, Rh).
The plot is colour-coded so that each experimental pattern is shown paired with a pattern simulated
from single crystal data found in the CSD database. The CSD reference codes, the space groups and
formulae are shown for each simulated pattern.
Several co-crystallisation experiments were conducted by co-crystallising two
different K3[MIII
(ox)3] complexes with the aim of forming single co-crystals of the
formula K3[MA
xMB
1-x(ox)3]·xH2O (MA, M
B = Cr, Mn, Fe, Ru, Rh; 0 < x < 1). For
experiments involving K3[MA(ox)3] (M
A = Cr, Fe, Ru) fractions in solution (xsolution)
ranged from 0.10-0.90. Experiments involving the manganese or rhodium complexes
were initially tested at xsolution = 0.50. Experiments where non-isomorphous
5 10 15 20 25 30
PXRD: K3[MIII(ox)3]·xH2O pure complexes
K3[Cr(ox)3]·2.5H2O
K3[Mn(ox)3]·xH2O
Position [ 2θ (Co)]
5 10 15 20 25 30
Co
un
ts K3[Fe(ox)3]·2.5H2O
K3[Ru(ox)3]·xH2O
K3[Rh(ox)3]·2H2O
CROXKH (P21/c)
K3[Cr(ox)3]·3H2O
ZZZCCG (P21/c)
K3[Mn(ox)3]·3H2O
GEXQOP (P21/c)
K3[Fe(ox)3]·3H2O
DUKNOM (P1)
K3[Ru(ox)3]·4.5H2O
DAZVUV (C2/c)
K3[Co(ox)3]·2H2O
CHAPTER 5
131
complexes were co-crystallised were of particular interest due to the potential to tune
the co-crystalline phase based on the initial xsolution value i.e. observe if and at what
concentration of K3[MA(ox)3] one phase is preferred over the other. Also,
experiments where K3[MIII
(ox)3] (MIII
= first row transition metal) were
co-crystallised with K3[MIII
(ox)3] (MIII
= second row transition metal) were highly
desirable due to the difference in the electron densities about the metal ion. Electron
density differences are necessary to differentiate between metal ions in SCXRD and
also enhance the difference in the visible contrast observed in backscattered SEM
images. Although not a primary objective, it was also hoped that sensitive
K3[MIII
(ox)3] complexes such as K3[Fe(ox)3] could be stabilised through
co-crystallisation with stable K3[MIII
(ox)3] complexes such as K3[Cr(ox)3].
Co-crystallisations were conducted in the dark using the vapour diffusion method of
EtOH into H2O (1 cm3 of H2O for 20 mg of total solid). For exact preperative
experimental details, refer to Section 3.3.5.2.
Table 17 summarises the various binary co-crystallisation experiments that were
conducted and outlines the metal complexes involved, their stability (as indicated at
the foot of the table), the relative fraction of each complex in solution (xsolution) and
the results with respect to crystal stability and quality of the resulting solid material.
Each co-crystallisation batch was repeated at least three times. For example, the
experiment summarised in the second row describes five individual
co-crystallisations, each repeated at least three times giving a minimum number of 15
co-crystallisation batches. This table summarises 60 co-crystallisation experiments.

CHAPTER 5
132
Table 17: Summary of co-crystallisation experiments showing all metal complexes involved, their
relative solution concentrations and whether or not single crystals resulted. The notes at the foot of the
table outline the nature of the instability of the pure complexes.
Complex A
Complex B
Fraction of
A in solution
(xsolution)
Stable Single crystals
K3[Cr(ox)3]·2.5H2O K3[Mn(ox)3]·xH2O*
0.50 No
---
K3[Cr(ox)3]·2.5H2O
K3[Fe(ox)3]·2.5H2O†
0.10-0.90
in 0.20 increments Yes Yes
K3[Cr(ox)3]·2.5H2O K3[Ru(ox)3]·xH2O‡
0.10-0.90
in 0.20 increments No
No
§
K3[Cr(ox)3]·2.5H2O K3[Rh(ox)3]·2H2O 0.50 Yes No§
K3[Mn(ox)3]·xH2O* K3[Fe(ox)3]·2.5H2O
† 0.50 No
‡ ---
K3[Mn(ox)3]·xH2O*
K3[Ru(ox)3]·xH2O‡
0.50 No
---
K3[Fe(ox)3]·2.5H2O†
K3[Ru(ox)3]·xH2O‡
0.10-0.90
in 0.20 increments No
No
§
K3[Fe(ox)3]·2.5H2O† K3[Rh(ox)3]·2H2O 0.50 Yes No
§
*Solid and solution highly photosensitive and thermosensitive.
†Highly photosensitive solution state,
moderately photosensitive solid state. ‡Solid and solution highly photosensitive and air sensitive.
§Some microcrystalline material or complex crystalline aggregates were obtained ---Only amorphous
material was obtained
All of the experiments involving K3[Mn(ox)3] resulted in a chalky white amorphous
solid material, indicating the reduction of Mn3+
to Mn2+
. Some crystalline material
was observed to form from combinations with K3[Ru(ox)3] but a large proportion of
the solid material that resulted was black and tarry. Initial concentrations of more
than 0.30 of K3[Ru(ox)3] gave very little or no crystalline material after the three
days of co-crystallisation. Although materials containing [Mn(ox)3]3-
display very
interesting magnetic and electronic properties,290,316,361 it was excluded from any
further co-crystallisation experiments due to its high photosensitivity and rapid
decomposition. Co-crystals with K3[Ru(ox)3]·xH2O were desirable because Ru3+
is a
very heavy atom that is easily distinguishable in SCXRD from first row transition
metal complexes. Co-crystallisation experiments with the air- and photo-sensitive
K3[Ru(ox)3]·xH2O were also excluded from further co-crystallisations due to its
apparent decomposition during these experiments.
Unlike K3[Ru(ox)3], K3[Rh(ox)3] is stable as both a solid and in solution. It also
crystallises in a different space group to K3[MIII
(ox)3] (MIII
= Cr, Fe) and contains a
second row transition metal, all of which are attributes that are highly desirable for

CHAPTER 5
133
these experiments. However, the co-crystallisations were not reproducible with
respect to the quality of the crystals that resulted. Of the solid material that formed
from each batch, only a select few crystals had surfaces suitable for measurement by
SEM-EDX. An example of the various crystal habits and crystal aggregation that
resulted is shown in Figure 54, which is an SEM image of co-crystals formed from
an equimolar solution of K3[Fe(ox)3] and K3[Rh(ox)3]. Measurements of the flat
plate-like crystals showed highly variable fractions of iron over different areas on the
same co-crystals with values ranging from 0.12-0.85. The iron content in the
acicular-like cluster was lower than the initial solution concentration and ranged
from 0.16-0.34 from different areas on the same cluster. Based on the crystal
aggregation and differences in crystal habit, systems involving K3[Rh(ox)3] were
deemed unsuitable for these studies and as such combinations involving K3[Rh(ox)3]
were abandoned.
Figure 54: SEM secondary electron image showing crystal aggregation and the various crystal habits
resulting from the equimolar co-crystallisation between K3[Fe(ox)3] and K3[Rh(ox)3]. EDX analysis of
the plate like crystals gave an iron fraction anywhere between 0.12-0.85. The acicular like cluster (top
right) was found to contain an iron fraction ca. 0.25.
Of the experiments listed in Table 17, only those where K3[Cr(ox)3] was
co-crystallised with K3[Fe(ox)3] resulted in high quality single crystals. Co-crystals
grown from every batch were blue and formed with a thin rhombohedral prism habit.
Experiments with higher concentrations of K3[Cr(ox)3]·2.5H2O yielded crystals of a
darker hue. No green crystals were observed. As expected, the powder XRD patterns
of the co-crystals grown from solutions containing various relative fractions of

CHAPTER 5
134
K3[Cr(ox)3]·2.5H2O to K3[Fe(ox)3]·2.5H2O were found to be isomorphous, belonging
to the same phase as K3[Cr(ox)3]·2.5H2O and K3[Fe(ox)3]·2.5H2O. The PXRD
patterns of the co-crystals resulting from co-crystallisations, where
K3[Cr(ox)3]·2.5H2O xsolution values were 0.10, 0.50 and 0.90, can be found in
Appendix C. None of the patterns showed any evidence of K3[Fe(ox)3]·2.5H2O
decomposition, as none of the peaks attributed to Humboldtine ([FeII(ox)2]·2H2O),
potassium oxalate or oxalic acid, which are all known products from the
photodecomposition of K3[Fe(ox)3]·2.5H2O were observed in any of the patterns.362,363
All of the patterns appeared to indicate the formation of single-phased bulk samples.
Single crystal structures were not collected due to the similar electron densities of
Cr3+
and Fe3+
. Microscope images of K3[Cr(ox)3]·2.5H2O and K3[Fe(ox)3]·2.5H2O
single crystals as well as K3[CrxFe1-x(ox)3]·2.5H2O single co-crystals grown from a
solution containing an equimolar ratio of the two complexes are shown in Figure 55.
Figure 55: Microscope images showing the crystal habits and colours of pure K3[Cr(ox)3]·2.5H2O,
K3[Fe(ox)3]·2.5H2O single crystals (a and b) and single co-crystals of the formula
K3[CrxFe1-x(ox)3]·2.5H2O, which were grown from a solution containing a 1:1 ratio of K3[Cr(ox)3] and
K3[Fe(ox)3] (c). The inset image (outlined in red) shows the same co-crystals rotated ca. 90°
clockwise to highlight the blue iridescence of these crystals, which can be viewed at certain angles.
A sample of co-crystals from each of the five co-crystallisation experiments was
harvested, deposited onto aluminium stubs and carbon-coated in preparation for
SEM-EDX analysis, in the same method as described for the [MII(terpy)2]
2+ systems.
At least three co-crystals from each experiment were analysed in at least three
different areas by SEM-EDX giving a total of ca. 150 measurements. It was noted
that the crystals looked cracked and weathered immediately after carbon-coating and
completely crumbled after about 30 minutes under the vacuum of the SEM.
Therefore, each stub was prepared and analysed before the following group of
co-crystals was harvested from the mother liquor.

CHAPTER 5
135
The SEM-EDX results obtained for these samples were initially very confusing.
Measurements from the same co-crystal were found to differ by amounts greater than
what was seen for the systems previously investigated and what could be attributed
to instrumental error. Regardless of the starting ratio of the two complexes in
solution, the measurements taken from all of the co-crystals indicated the formation
of a heterogeneous surface with respect to the Cr:Fe ratio.
The intracrystal variation of the chromium content (xsolid) ranged from 0.06-0.13 and
0.84-0.95 for co-crystals grown from solutions containing initial K3[Cr(ox)3]
concentrations of 0.10 or 0.90 respectively. The range was larger at 0.19-0.35 and
0.59-0.77 for co-crystals grown from solutions containing initial K3[Cr(ox)3]
concentrations of 0.30 and 0.70 respectively. The intracrystal surface variation
observed for co-crystals grown from solutions containing an equimolar ratio of
K3[Cr(ox)3] and K3[Fe(ox)3] (xsolution = 0.50) was by far the most pronounced, with
chromium xsolid values ranging from 0.40-0.95. The areas measured during these
experiments were chosen at random. Furthermore, because only three areas were
measured per crystal, it was not known if the various chromium xsolid values that
were obtained were randomly distributed or the result of a concentration gradient. To
test for a concentration gradient another co-crystallisation experiment was
conducted. Since co-crystals with the greatest surface variation of metal ratios were
grown from equimolar solutions, only this experiment was repeated (giving a total of
four experiments where xsolution = 0.50). A total of ten co-crystals was analysed from
this batch each in at least six different areas. The areas analysed were noted using an
SEM image. Figure 56 shows an SEM image of a co-crystal grown from a solution
containing an equimolar ratio of K3[Cr(ox)3] and K3[Fe(ox)3] and highlights the
Cr:Fe ratio found and therefore the ratio between complexes for each of the areas
outlined in the coloured boxes.

CHAPTER 5
136
Figure 56: SEM secondary electron image of a co-crystal grown from a solution containing an
equimolar ratio of K3[Cr(ox)3] and K3[Fe(ox)3]. The Cr:Fe ratio found and therefore the ratio between
complexes for each of the areas outlined in the coloured boxes is given. Areas outlined in red and
yellow were found to be very rich in chromium. The areas outlined in green were found to have a
slight excess of chromium whereas the area outlined in blue was found to be slightly deficient in
chromium. Note also that the co-crystal appears to be cracked and weathered.
The results found for the co-crystal shown in Figure 56 infer the formation of a
surface concentration gradient. The centre of the face (outlined blue) was the only
area analysed that had a concentration bias in favour of K3[Fe(ox)3]. Areas nearest to
the face centre (green outline) were analysed to have K3[Cr(ox)3] concentrations at
about 60%. The areas outlined in yellow were found to have a K3[Cr(ox)3]
concentration of 75% while those outlined in red were found to have 90%
K3[Cr(ox)3]. All of the other nine co-crystals that were analysed showed very similar
results. None of the co-crystals had high levels of K3[Cr(ox)3] when analysed in the
centre of the face nor were any shown to have high levels of K3[Fe(ox)3] at the face
edges. As mentioned previously, the co-crystals appeared to deteriorate once placed
under vacuum. Looking at Figure 56 it is interesting to note the columnar
microstructure of these partially deteriorated co-crystals. This microstructure could
be due to directional damage or represent evidence of columnar aggregation during
crystal growth whereby each column is composed of the pure complex and the
ca. 0.90 K3[Cr(ox)3]
0.10 K3[Fe(ox)3]
ca. 0.75 K3[Cr(ox)3]
0.25 K3[Fe(ox)3]
ca. 0.60 K3[Cr(ox)3]
0.40 K3[Fe(ox)
3]
ca. 0.40 K3[Cr(ox)3]
0.60 K3[Fe(ox)3]
ca. 0.90 K3[Cr(ox)3]
0.10 K3[Fe(ox)3]
ca. 0.75 K3[Cr(ox)3]
0.25 K3[Fe(ox)3]
ca. 0.60 K3[Cr(ox)3]
0.40 K3[Fe(ox)
3]
ca. 0.40 K3[Cr(ox)3]
0.60 K3[Fe(ox)3]

CHAPTER 5
137
relative frequency of each type of column determines the relative concentration of
complexes found for a particular area.
The results obtained for these systems are very different to those that have been
observed for binary co-crystallisation experiments previously undertaken during this
work and during previous research undertaken by other members of the McMurtrie
group.35,261,306,307 Over the past few years, investigations into the composition of
crystals formed through binary co-crystallisation experiments have yielded one of
four results. The first is the formation of crystals containing only one of the metal
complexes that were present in solution. This occurs when the complexes being
co-crystallised are too different to coexist in the same structure i.e. supramolecular
selection leads to mutually exclusive crystallisation and is the premise behind the use
of recrystallisation as a purification technique. It is important to note that this system
involves complexes that have similar solubilities and hence is different from
fractional crystallisation. Fractional crystallisation is a method that is commonly used
to purify solutes based on differences in solubility whereby one solute is allowed to
crystallise before the other. Mutually exclusive crystallisation as a result of extreme
supramolecular selection was observed for experiments where [Ru(terpy)2](BF4)2
was co-crystallised with [Co(terpyO)(terpyOH)](BF4)2.
The second is the formation of stoichiometric co-crystals with respect to the ratio of
metal complexes present in solution i.e. xsolid = xsolution. This is the opposite of the first
scenario as the complexes being co-crystallised are indistinguishable to one another
resulting in a system with negligible supramolecular selection. Systems where
[MA(phen)3](PF6)2 complexes were co-crystallised with [M
B(phen)3](PF6)2 (M
A,
MB = Fe, Ni, Co, Cu, Ru) showed no supramolecular selection and formed
[MA
xMB
1-x(phen)2](PF6)2 co-crystals where xsolid = xsolution.
The third is an intermediate of the former two systems where complexes being
co-crystallised are similar enough to coexist in the same structure but different
enough to instigate a selection bias during co-crystallisation resulting in a system that
exhibits supramolecular selection where xsolid single co-crystal 1 ≠ xsolid single co-crystal 2.
Examples of systems that displayed supramolecular selection are those where
[MA(bipy)3](PF6)2 complexes were co-crystallised with [M
B(bipy)3](PF6)2 and
CHAPTER 5
138
[MA(terpy)2](PF6)2 complexes were co-crystallised with [M
B(terpy)2](PF6)2 (M
A, M
B
= Fe, Ni, Co, Cu, Ru). In each of the three systems described, the individual
co-crystals have a homogeneous concentration.
The fourth and the most complicated result that has been observed thus far is the
formation of co-crystals that have homogeneous surface measurements that differ
from surface measurements taken from other co-crystals from the same batch and
also differ from measurements taken from the co-crystal’s interior. Therefore, in
addition to exhibiting supramolecular selection these co-crystals also have a 3D
concentration gradient, which is thought to be caused due to a slight solubility
difference between the complexes being co-crystallised. Examples of systems that
involved complexes that had slightly different solubilities and that displayed
supramolecular selection are those where [Ru(terpy)2](BF4)2 complexes were
co-crystallised with [MII(terpyOH)2](BF4)2 (M
II = Fe, Ni, Cu).
Based on the SEM-EDX results for the co-crystal shown in Figure 56 and the nine
other co-crystals analysed from this same experiment, it is evident that the
composition of these co-crystals did not fit into any of these categories summarised
here. To our knowledge, this is the first example of co-crystals that have formed with
a concentration gradient on the surface. Since the co-crystals degrade under the
vacuum of the SEM after about 30 minutes, further analysis of the surfaces using
mapping techniques was not possible for co-crystals that had already been examined.
Therefore, another replicate batch of co-crystals from an equimolar ratio of
K3[Cr(ox)3] and K3[Fe(ox)3] was co-crystallised in the same method as described
earlier for the purpose of SEM-EDX 2D area mapping. However, it was realised that
due to the vacuum of the SEM, the co-crystals deteriorated before the area map could
be completed. The very short timeframe afforded by the SEM-EDX technique for the
analysis of these co-crystals meant that only line maps spanning diagonally across
the crystal face could be completed before the co-crystals collapsed. Since it was
highly desirable to quantitatively characterise as much of the surface as possible,
alternate methods capable of mapping were pursued.
Single crystal Raman spectroscopic mapping was found to be a suitable technique for
the quantitative characterisation of these samples. The Raman spectra collected from

CHAPTER 5
139
K3[Fe(ox)3]·2.5H2O and K3[Cr(ox)3]·2.5H2O pure crystals were very similar, with
the exception of a ca. 4 cm-1
difference in the position of the carbonyl stretching
frequency; 1722.97 and 1727.47 cm-1
for pure K3[Fe(ox)3]·2.5H2O and
K3[Cr(ox)3]·2.5H2O respectively. Figure 57 highlights the separation of the carbonyl
stretching bands of K3[Fe(ox)3]·2.5H2O and K3[Cr(ox)3]·2.5H2O.
Figure 57: Raman spectra highlighting the separation of the carbonyl stretching bands of
K3[Fe(ox)3]·2.5H2O and K3[Cr(ox)3]·2.5H2O at 1722.97 and 1727.47 cm-1
respectively. The
overlapping spectra shown in black were obtained from single crystals (10 from each
K3[Fe(ox)3]·2.5H2O and K3[Cr(ox)3]·2.5H2O). The spectra shown in green and blue were acquired
from powdered samples of pure crystals. The red spectrum was obtained from a single co-crystal
exhibiting a surface concentration gradient grown from a solution containing a 1:1 ratio of the two
complexes. The dotted spectrum was obtained from a powdered sample of a 1:1 ratio of the two
compounds. All spectra shown have been normalised to aid comparison.
The black spectra shown were taken from single crystals of pure samples as a check
of the instrument’s accuracy prior to each mapping session. The green and blue
spectra were obtained from powdered samples of pure K3[Fe(ox)3]·2.5H2O and
K3[Cr(ox)3]·2.5H2O. The similarity of the spectra acquired from the powdered
samples to those obtained from single crystals indicates that the crystal orientation
has little effect on the spectral profile in this region. This figure also shows
representative spectra from samples containing both metal complexes. The red
spectrum shown was measured from a co-crystal exhibiting a surface concentration
1700 1710 1720 1730 1740 1750
Raman Spectra showing the difference in the carbonyl stretching peak position between K3[Cr(ox)3]·2.5H2O and K3[Fe(ox)3]·2.5H2O
Wavenumber (cm-1)
Ram
an
In
ten
sit
y
1700 1710 1720 1730 1740 1750
K3[Fe(ox)3]·2.5H2O single crystals K3[Cr(ox)3]·2.5H2O single crystals
powdered K3[Fe(ox)3]·2.5H2O powdered K3[Cr(ox)3]·2.5H2O
K3[CrxFe1-x(ox)3]·2.5H2O
single co-crystalpowdered K3[Cr(ox)3]·2.5H2O and
K3[Fe(ox)3]·2.5H2O (1:1 ratio)
x = 1722.97 cm-1
s = 0.09
n = 10
x = 1727.47 cm-1
s = 0.09
n = 10
1700 1710 1720 1730 1740 1750
Raman Spectra showing the difference in the carbonyl stretching peak position between K3[Cr(ox)3]·2.5H2O and K3[Fe(ox)3]·2.5H2O
Wavenumber (cm-1)
Ram
an
In
ten
sit
y
1700 1710 1720 1730 1740 17501700 1710 1720 1730 1740 1750
K3[Fe(ox)3]·2.5H2O single crystals K3[Cr(ox)3]·2.5H2O single crystals
powdered K3[Fe(ox)3]·2.5H2O powdered K3[Cr(ox)3]·2.5H2O
K3[CrxFe1-x(ox)3]·2.5H2O
single co-crystalpowdered K3[Cr(ox)3]·2.5H2O and
K3[Fe(ox)3]·2.5H2O (1:1 ratio)
x = 1722.97 cm-1
s = 0.09
n = 10
x = 1722.97 cm-1
s = 0.09
n = 10
x = 1727.47 cm-1
s = 0.09
n = 10
x = 1727.47 cm-1
s = 0.09
n = 10
CHAPTER 5
140
gradient and was grown from a solution containing an equimolar ratio of K3[Fe(ox)3]
and K3[Cr(ox)3]. The spectrum represented by the dotted line was obtained from a
sample containing a 1:1 ratio of the two compounds, which were ground together to
form a fine powder. The peaks of both of these spectra which have a maxima at ca.
1725 cm-1
indicate the same ratio of the two compounds in the solid, however the
spectrum of the powdered sample has a FWHM much greater than that of the
co-crystal spectrum. A total of eight measurements were made from the manually
combined powdered sample all of which had peaks with similar FWHM to the
example spectrum shown. Similarly, the peak widths calculated for all of the
co-crystal measurements (hundreds) were of similar size to the red peak shown in
Figure 57. These results strongly indicate that the position of the carbonyl stretching
frequency in the Raman spectra of co-crystals is not simply a superposition of the
two peaks but instead a single crystal characteristic that could be exploited to gain
quantitative information i.e. the position of the peak is indicative of the ratio of the
two complexes in the co-crystals. The differences between the peak widths also
renders the notion of crystal growth via columnar aggregation i.e. aggregation of
columns composed of pure complex as highly unlikely. Instead, these results strongly
suggest that the concentration gradient observed is a change that occurs at the
molecular level and that the microstructure observed is likely a result of directional
damage because of the harsh condiditons in the SEM. Although beyond the scope of
this project, it would be interesting to investigate the composition of these types of
co-crystals at the nanoscale level using higher resolution characterisation techniques.
Using the position of this very prominent carbonyl stretching band in the Raman
spectrum, it was possible to measure and map the ratio of K3[Cr(ox)3]·2.5H2O to
K3[Fe(ox)3]·2.5H2O at a particular point on the co-crystal surface. This technique
was validated by first mapping the frequency of the carbonyl stretching peak and
then conducting another map along the same transect using SEM-EDX. Five
co-crystals were characterised using both techniques for the purpose of validating the
use of Raman spectroscopy as a qualitative characterisation technique for these
samples. One of the co-crystals analysed using Raman spectroscopy and SEM-EDX
is shown in Figure 58. The transect followed during Raman mapping is represented
by the dotted line between points A and B. The co-crystal region around B had
deteriorated by the time the EDX mapping software was programmed to analyse it.

CHAPTER 5
141
Therefore, no data were collected for this region resulting in a shorter transect for the
SEM-EDX map compared to the one collected using Raman. The results from both
Raman and SEM-EDX line maps are shown in Figure 59 and Figure 60 respectively.
Figure 58: Microscope image of a single co-crystal exhibiting a concentration gradient that was
co-crystallised from a solution containing an equimolar ratio of K3[Cr(ox)3] to K3[Fe(ox)3]. The
transect followed during Raman mapping is represented by the black dotted line between the points
marked A and B. The transect followed during SEM-EDX mapping (diagonally from A to B) was
shorter as the edge marked B had deteriorated under the SEM atmosphere. The ratios between the
complexes shown in the red and blue boxes were calculated using Raman carbonyl peak positions.
200 µm
10
0 µ
m
A
ca. 0.90 K3[Cr(ox)3]
0.10 K3[Fe(ox)3]
ca. 0.40 K3[Cr(ox)3]
0.60 K3[Fe(ox)3]
B
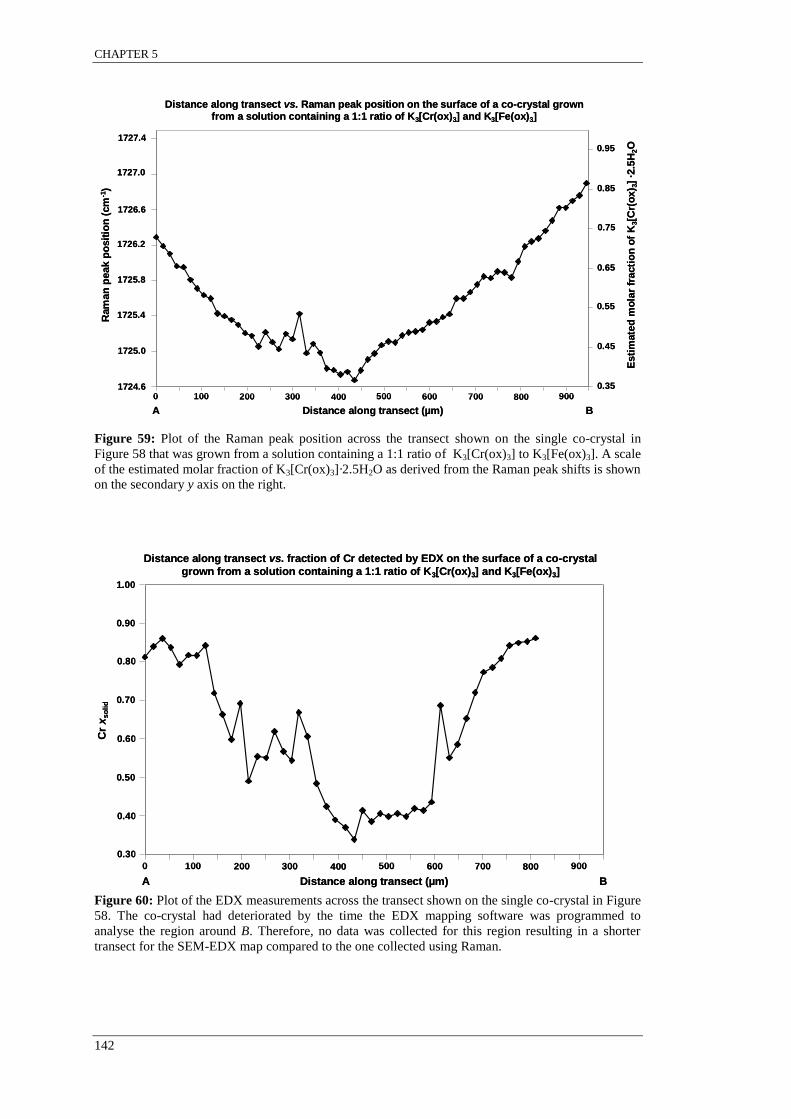
CHAPTER 5
142
Figure 59: Plot of the Raman peak position across the transect shown on the single co-crystal in
Figure 58 that was grown from a solution containing a 1:1 ratio of K3[Cr(ox)3] to K3[Fe(ox)3]. A scale
of the estimated molar fraction of K3[Cr(ox)3]·2.5H2O as derived from the Raman peak shifts is shown
on the secondary y axis on the right.
Figure 60: Plot of the EDX measurements across the transect shown on the single co-crystal in Figure
58. The co-crystal had deteriorated by the time the EDX mapping software was programmed to
analyse the region around B. Therefore, no data was collected for this region resulting in a shorter
transect for the SEM-EDX map compared to the one collected using Raman.
1724.6
1725.0
1725.4
1725.8
1726.2
1726.6
1727.0
1727.4
35
45
55
65
75
85
95
Distance along transect vs. Raman peak position on the surface of a co-crystal grown from a solution containing a 1:1 ratio of K3[Cr(ox)3] and K3[Fe(ox)3]
Ram
an
peak p
osit
ion
(cm
-1)
1724.6
1725.0
1725.4
1725.8
1726.2
1726.6
Esti
mate
d m
ola
r fr
acti
on
of
K3[C
r(o
x) 3
] ·2
.5H
2O
0.35
0.45
0.55
0.65
0.75
0.85
0.95
Distance along transect (µm)A B
100 200 300 400 500 600 700 800 9000
1727.0
1727.4
1724.6
1725.0
1725.4
1725.8
1726.2
1726.6
1727.0
1727.4
35
45
55
65
75
85
95
Distance along transect vs. Raman peak position on the surface of a co-crystal grown from a solution containing a 1:1 ratio of K3[Cr(ox)3] and K3[Fe(ox)3]
Ram
an
peak p
osit
ion
(cm
-1)
1724.6
1725.0
1725.4
1725.8
1726.2
1726.6
Esti
mate
d m
ola
r fr
acti
on
of
K3[C
r(o
x) 3
] ·2
.5H
2O
0.35
0.45
0.55
0.65
0.75
0.85
0.95
Distance along transect (µm)A B
100 200 300 400 500 600 700 800 9000
1727.0
1727.4
0.3
0.4
0.5
0.6
0.7
0.8
0.9
1
0
0
1
1
1
1
1
1
2 5 8 11 14 17 20 23 26 29 32 35 38 41 44 47 50 53
0.30
0.40
0.50
0.60
0.70
0.80
0.90
1.00
Cr
xs
oli
d
Distance along transect vs. fraction of Cr detected by EDX on the surface of a co-crystal
grown from a solution containing a 1:1 ratio of K3[Cr(ox)3] and K3[Fe(ox)3]
Distance along transect (µm)A B
100 200 300 400 500 600 700 800 90000.3
0.4
0.5
0.6
0.7
0.8
0.9
1
0
0
1
1
1
1
1
1
2 5 8 11 14 17 20 23 26 29 32 35 38 41 44 47 50 53
0.30
0.40
0.50
0.60
0.70
0.80
0.90
1.00
Cr
xs
oli
d
Distance along transect vs. fraction of Cr detected by EDX on the surface of a co-crystal
grown from a solution containing a 1:1 ratio of K3[Cr(ox)3] and K3[Fe(ox)3]
Distance along transect (µm)A B
100 200 300 400 500 600 700 800 9000
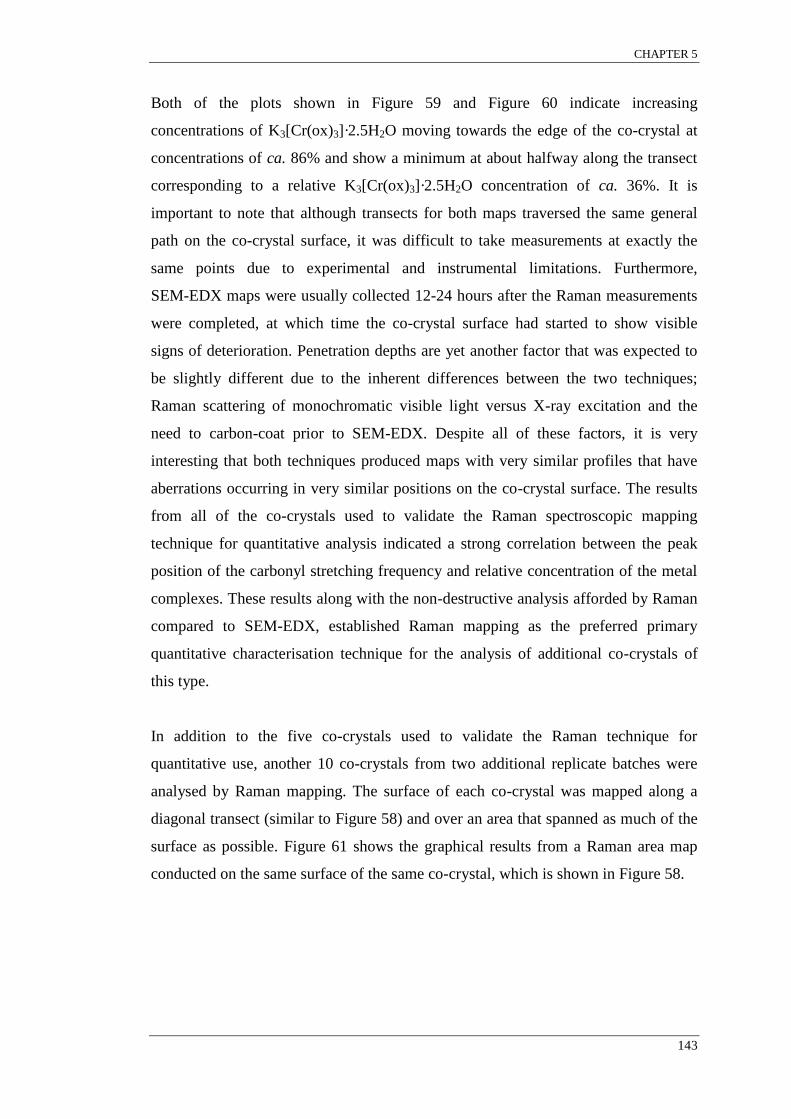
CHAPTER 5
143
Both of the plots shown in Figure 59 and Figure 60 indicate increasing
concentrations of K3[Cr(ox)3]·2.5H2O moving towards the edge of the co-crystal at
concentrations of ca. 86% and show a minimum at about halfway along the transect
corresponding to a relative K3[Cr(ox)3]·2.5H2O concentration of ca. 36%. It is
important to note that although transects for both maps traversed the same general
path on the co-crystal surface, it was difficult to take measurements at exactly the
same points due to experimental and instrumental limitations. Furthermore,
SEM-EDX maps were usually collected 12-24 hours after the Raman measurements
were completed, at which time the co-crystal surface had started to show visible
signs of deterioration. Penetration depths are yet another factor that was expected to
be slightly different due to the inherent differences between the two techniques;
Raman scattering of monochromatic visible light versus X-ray excitation and the
need to carbon-coat prior to SEM-EDX. Despite all of these factors, it is very
interesting that both techniques produced maps with very similar profiles that have
aberrations occurring in very similar positions on the co-crystal surface. The results
from all of the co-crystals used to validate the Raman spectroscopic mapping
technique for quantitative analysis indicated a strong correlation between the peak
position of the carbonyl stretching frequency and relative concentration of the metal
complexes. These results along with the non-destructive analysis afforded by Raman
compared to SEM-EDX, established Raman mapping as the preferred primary
quantitative characterisation technique for the analysis of additional co-crystals of
this type.
In addition to the five co-crystals used to validate the Raman technique for
quantitative use, another 10 co-crystals from two additional replicate batches were
analysed by Raman mapping. The surface of each co-crystal was mapped along a
diagonal transect (similar to Figure 58) and over an area that spanned as much of the
surface as possible. Figure 61 shows the graphical results from a Raman area map
conducted on the same surface of the same co-crystal, which is shown in Figure 58.

CHAPTER 5
144
Figure 61: Graphical representations of the data derived from a Raman area map conducted on the
surface of a single co-crystal. The image on the left shows the discrete areas analysed overlaid on the
microscope image of the co-crystal. The image on the right is a smoothed 3D representation of the
same data. The colour-coded scale used in both images is also shown (far right). The map results
indicate higher relative concentrations of K3[Cr(ox)3]·2.5H2O at the crystal’s edges (red/yellow areas)
than present in the centre (purple/blue).
The results shown in Figure 61 were typical of all maps conducted on each of the
co-crystals analysed. All results (both SEM-EDX and Raman) indicated that the
formation of a 2D directional surface concentration gradient was ubiquitous among
co-crystals grown from solutions containing a 1:1 ratio of K3[Cr(ox)3] and
K3[Fe(ox)3]. Using the Raman peak shifts to estimate the molar fractions at various
areas mapped,* it was found that K3[Cr(ox)3]·2.5H2O concentrations gradually
increased from ca. 35-40% at the face centre to ca. 85-90% at the co-crystal edge. At
no point on any co-crystalline surface was the relative concentration of
K3[Cr(ox)3]·2.5H2O lower than ca. 30%. This suggests that K3[Fe(ox)3] is slightly
less soluble than K3[Cr(ox)3] and therefore begins to crystallise first under the
conditions of these co-crystallisations. Therefore, it was postulated that due to the
apparent subtle solubility difference between the two complexes being
co-crystallised, that even lower relative concentrations of K3[Cr(ox)3]·2.5H2O,
perhaps even the co-crystal origin (i.e. 100% K3[Fe(ox)3]·2.5H2O) was present
somewhere below the surface.
Two methods were attempted at exposing a cross-section perpendicular to the
previously mapped external surface. The first involved manually cutting the
*Molar fractions derived from Raman peak shifts were calculated using a calibration curve where the
shifts of pure K3[Fe(ox)3]·2.5H2O and K3[Cr(ox)3]·2.5H2O equate to a relative K3[Cr(ox)3]·2.5H2O
concentration of 0 and 100% respectively.
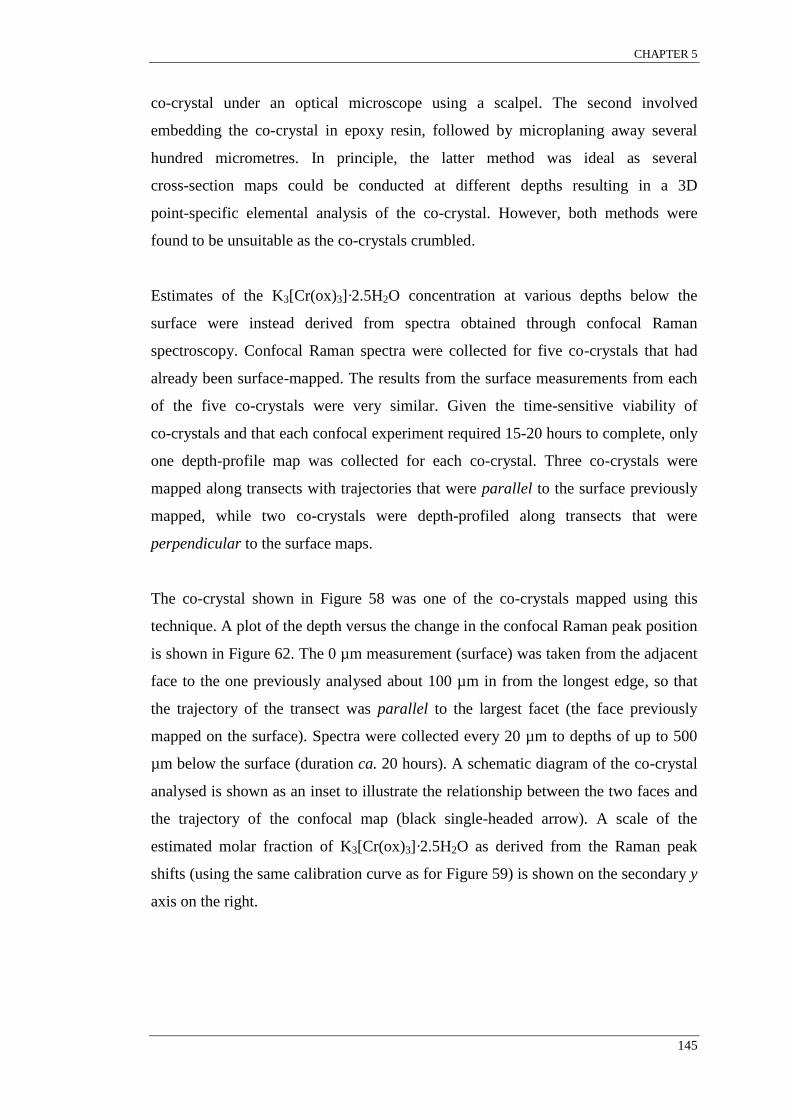
CHAPTER 5
145
co-crystal under an optical microscope using a scalpel. The second involved
embedding the co-crystal in epoxy resin, followed by microplaning away several
hundred micrometres. In principle, the latter method was ideal as several
cross-section maps could be conducted at different depths resulting in a 3D
point-specific elemental analysis of the co-crystal. However, both methods were
found to be unsuitable as the co-crystals crumbled.
Estimates of the K3[Cr(ox)3]·2.5H2O concentration at various depths below the
surface were instead derived from spectra obtained through confocal Raman
spectroscopy. Confocal Raman spectra were collected for five co-crystals that had
already been surface-mapped. The results from the surface measurements from each
of the five co-crystals were very similar. Given the time-sensitive viability of
co-crystals and that each confocal experiment required 15-20 hours to complete, only
one depth-profile map was collected for each co-crystal. Three co-crystals were
mapped along transects with trajectories that were parallel to the surface previously
mapped, while two co-crystals were depth-profiled along transects that were
perpendicular to the surface maps.
The co-crystal shown in Figure 58 was one of the co-crystals mapped using this
technique. A plot of the depth versus the change in the confocal Raman peak position
is shown in Figure 62. The 0 µm measurement (surface) was taken from the adjacent
face to the one previously analysed about 100 µm in from the longest edge, so that
the trajectory of the transect was parallel to the largest facet (the face previously
mapped on the surface). Spectra were collected every 20 µm to depths of up to 500
µm below the surface (duration ca. 20 hours). A schematic diagram of the co-crystal
analysed is shown as an inset to illustrate the relationship between the two faces and
the trajectory of the confocal map (black single-headed arrow). A scale of the
estimated molar fraction of K3[Cr(ox)3]·2.5H2O as derived from the Raman peak
shifts (using the same calibration curve as for Figure 59) is shown on the secondary y
axis on the right.

CHAPTER 5
146
Figure 62: A plot of the depth versus the change in the confocal Raman peak position. A schematic
diagram of the co-crystal analysed is shown as an inset to illustrate the dimensions and the
relationship between the face that was previously surface mapped (largest facet outlined in red) and
the starting surface position of the depth-profile map (solid arrow through the face shaded in grey). A
scale of the estimated molar fraction of K3[Cr(ox)3]·2.5H2O as derived from the Raman peak shifts is
shown on the secondary y axis on the right.
The confocal data presented in Figure 62 suggest a steady decrease of the
K3[Cr(ox)3]·2.5H2O concentration moving from the surface (ca. 57%) to a depth of
about 360 µm (39%) and then a slight increase from depths of 360-500 µm below the
surface. The K3[Cr(ox)3]·2.5H2O concentrations calculated from the confocal data
suggest a similar yet less pronounced concentration gradient (Δ 20%) to that found
on the surface (Δ 50%). The minimum K3[Cr(ox)3]·2.5H2O concentration at about
-360 µm approximately corresponds to the half-way point along the face outlined in
red in the schematic shown in Figure 62; the area where the minimum
K3[Cr(ox)3]·2.5H2O concentration was found on the surface. The slight increase in
the K3[Cr(ox)3]·2.5H2O concentration from depths of 360-500 µm also mimic the
trend observed from the areas map collected on the surface (Figure 61). Two other
co-crystals were mapped using confocal microscopy along depth-transects that were
parallel to their largest facet in approximately similar positions from the edges. The
results of both depth-profiles closely resemble the data presented in Figure 62.
Figure 63 is a plot of the depth versus the change in the confocal Raman peak
position acquired from two maps obtained from two different co-crystals. Spectra
0.38
0.40
0.42
0.44
0.46
0.48
0.50
0.52
0.54
0.56
0.58
-500-400-300-200-1000
0.38
0.40
0.42
0.44
0.46
0.48
0.50
0.52
0.54
0.56
0.58
Depth vs. Confocal Raman peak position
Depth (µm)
-100 -200 -300 -400 -500
Es
tim
ate
d m
ola
r fr
ac
tio
n o
f K
3[C
r(o
x) 3
] ·2
.5H
2O
0
Co
nfo
ca
l R
am
an
pe
ak
po
sit
ion
(c
m-1
)
1724.7
1725.1
1725.2
1725.3
1725.4
1725.5
1725.6
1724.8
1724.9
1725.0

CHAPTER 5
147
were collected every 10 µm to depths of up to 250 µm below the surface. The
depth-transects of the confocal maps for these two co-crystals had trajectories that
were perpendicular to the faces on which the surface mapping data were previously
collected. A schematic diagram illustrating the relationship between the face
previously mapped on the surface (red outlined face) and the starting positions
(0 µm) of the two confocal maps is shown as an inset in Figure 63. The data obtained
from the centre of one co-crystal (solid arrow) are plotted with the solid line, whereas
the data collected closer to the edge from another co-crystal (dashed arrow) are
plotted with the dotted line. Since both co-crystals had similar dimensions, only one
schematic is shown. As with previous plots, the scale of the estimated molar fraction
of K3[Cr(ox)3]·2.5H2O corresponding to the Raman peak shifts is shown on the
secondary y axis on the right.
Figure 63: A plot of the depth versus the change in the confocal Raman peak position acquired from
two depth-profile maps from two different co-crystals exhibiting surface concentration gradients. A
schematic diagram representing the co-crystals analysed is shown as an inset to illustrate the
dimensions and the relationship between the face that was previously surface mapped (outlined in red)
and the starting surface position of the confocal map (shaded in grey). The profile obtained from the
centre of one co-crystal (solid arrow) is plotted with the solid line, whereas the data collected closer to
the edge from another co-crystal (dashed arrow) is plotted with the dotted line. The scale of the
estimated molar fraction of K3[Cr(ox)3]·2.5H2O corresponding to the Raman peak shifts is shown on
the secondary y axis on the right.
The variation in the K3[Cr(ox)3]·2.5H2O concentration along each respective transect
shown in Figure 63 is very minimal at less than 0.10, compared to the variations
obtained from the parallel depth-profiles (Δ 0.20) and the surface maps (Δ 0.50). The
0.30
0.35
0.40
0.45
0.50
0.55
0.60
0.65
0.70
-250-200-150-100-500
1724.4
1724.6
1724.8
1725
1725.2
1725.4
1725.6
1725.8
1726
1726.2
Depth (µm)
0.30
0.35
0.40
0.45
0.50
0.55
0.60
0.65
0.70
Depth vs. Confocal Raman peak position
-50 -100 -150 -200 -250
Esti
mate
d m
ola
r fr
acti
on
of
K3[C
r(o
x) 3
] ·2
.5H
2O
0
1 mm
300 µ
m
Co
nfo
cal
Ram
an
peak p
osit
ion
(cm
-1)
1724.4
1725.2
1725.4
1725.6
1725.8
1726.0
1726.2
1724.6
1724.8
1725.0
0.30
0.35
0.40
0.45
0.50
0.55
0.60
0.65
0.70
-250-200-150-100-500
1724.4
1724.6
1724.8
1725
1725.2
1725.4
1725.6
1725.8
1726
1726.2
Depth (µm)
0.30
0.35
0.40
0.45
0.50
0.55
0.60
0.65
0.70
Depth vs. Confocal Raman peak position
-50 -100 -150 -200 -250
Esti
mate
d m
ola
r fr
acti
on
of
K3[C
r(o
x) 3
] ·2
.5H
2O
0
1 mm
300 µ
m
1 mm
300 µ
m
Co
nfo
cal
Ram
an
peak p
osit
ion
(cm
-1)
1724.4
1725.2
1725.4
1725.6
1725.8
1726.0
1726.2
1724.6
1724.8
1725.0
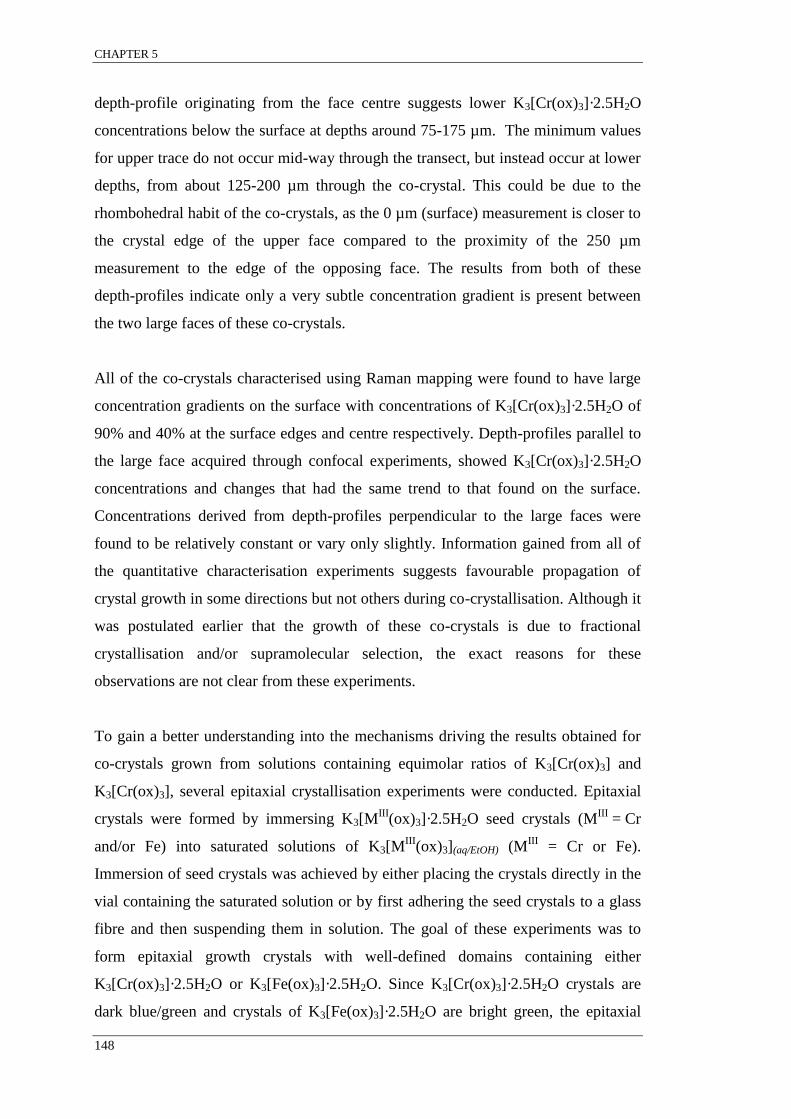
CHAPTER 5
148
depth-profile originating from the face centre suggests lower K3[Cr(ox)3]·2.5H2O
concentrations below the surface at depths around 75-175 µm. The minimum values
for upper trace do not occur mid-way through the transect, but instead occur at lower
depths, from about 125-200 µm through the co-crystal. This could be due to the
rhombohedral habit of the co-crystals, as the 0 µm (surface) measurement is closer to
the crystal edge of the upper face compared to the proximity of the 250 µm
measurement to the edge of the opposing face. The results from both of these
depth-profiles indicate only a very subtle concentration gradient is present between
the two large faces of these co-crystals.
All of the co-crystals characterised using Raman mapping were found to have large
concentration gradients on the surface with concentrations of K3[Cr(ox)3]·2.5H2O of
90% and 40% at the surface edges and centre respectively. Depth-profiles parallel to
the large face acquired through confocal experiments, showed K3[Cr(ox)3]·2.5H2O
concentrations and changes that had the same trend to that found on the surface.
Concentrations derived from depth-profiles perpendicular to the large faces were
found to be relatively constant or vary only slightly. Information gained from all of
the quantitative characterisation experiments suggests favourable propagation of
crystal growth in some directions but not others during co-crystallisation. Although it
was postulated earlier that the growth of these co-crystals is due to fractional
crystallisation and/or supramolecular selection, the exact reasons for these
observations are not clear from these experiments.
To gain a better understanding into the mechanisms driving the results obtained for
co-crystals grown from solutions containing equimolar ratios of K3[Cr(ox)3] and
K3[Cr(ox)3], several epitaxial crystallisation experiments were conducted. Epitaxial
crystals were formed by immersing K3[MIII
(ox)3]·2.5H2O seed crystals (MIII
= Cr
and/or Fe) into saturated solutions of K3[MIII
(ox)3](aq/EtOH) (MIII
= Cr or Fe).
Immersion of seed crystals was achieved by either placing the crystals directly in the
vial containing the saturated solution or by first adhering the seed crystals to a glass
fibre and then suspending them in solution. The goal of these experiments was to
form epitaxial growth crystals with well-defined domains containing either
K3[Cr(ox)3]·2.5H2O or K3[Fe(ox)3]·2.5H2O. Since K3[Cr(ox)3]·2.5H2O crystals are
dark blue/green and crystals of K3[Fe(ox)3]·2.5H2O are bright green, the epitaxial

CHAPTER 5
149
crystals and their domains were easily distinguished by eye from the pure crystals
that also formed during the experiment. Table 18 summarises the composition of the
seed crystals and saturated solutions used to form epitaxial crystals. Each epitaxial
experiment was repeated at least once to ensure reproducibility giving a total of at
least 16 experiments. A brief description of the method used to form and prepare
seed crystals and to prepare saturated solutions is provided as a footnote at the base
of the table. It is important to note that only saturated solutions were used to avoid
dissolution of the seed.
Table 18: Summary of the composition of the seed crystals and the saturated solutions used to
crystallise epitaxial growth crystals.
Epitaxial
system Seed crystal(s)
* Sat. solution(aq/EtOH)
†
1 K3[Fe(ox)3]·2.5H2O K3[Cr(ox)3]
2 K3[Cr(ox)3]·2.5H2O K3[Fe(ox)3]
3 K3[Cr(ox)3]·2.5H2O and K3[Fe(ox)3]·2.5H2O K3[Cr(ox)3]
4 K3[Cr(ox)3]·2.5H2O and K3[Fe(ox)3]·2.5H2O K3[Fe(ox)3]
*Seed crystals were grown as per the vapour diffusion recrystallisation method (EtOH into H2O).
†Saturated solutions were prepared by first dissolving the appropriate metal complex in H2O and then
quickly adding EtOH until the first sign of precipitation. The solution was then filtered through a
nylon filter fitted to a syringe. Saturated solutions were used immediately and any excess discarded.
The first epitaxial system described in Table 18 can be described as a discrete
version of K3[CrxFe1-x(ox)3]·2.5H2O co-crystals that spontaneously formed with
surface concentration gradients. Instead of a gradient increase in the
K3[Cr(ox)3]·2.5H2O relative concentration from the surface centre toward the edge,
these epitaxial crystals have an abrupt change of concentration from one domain to
the next. Figure 64 shows microscope images of an intact epitaxial crystal resulting
from placing a K3[Fe(ox)3]·2.5H2O seed into a saturated solution of
K3[Cr(ox)3](aq/EtOH).

CHAPTER 5
150
Figure 64: Optical microscope images of one epitaxial crystal grown by immersing a
K3[Fe(ox)3]·2.5H2O seed into a saturated solution of K3[Cr(ox)3](aq/EtOH). The crystal in the image on
the right was rotated ca. 90° anticlockwise to highlight the blue iridescence of the K3[Cr(ox)3]·2.5H2O
domain that can be viewed at certain angles. It is important to note that these images are of an intact
crystal and not of cross-section slices.
As mentioned throughout this section none of the K3[CrxFe1-x(ox)3]·2.5H2O
co-crystals that spontaneously formed with surface concentration gradients showed
higher amounts of K3[Cr(ox)3]·2.5H2O at the surface centre than at the surface edge.
Therefore, epitaxial crystals resulting from the second system described in Table 18
have surface centre and edge concentrations that are the inverse of what was
observed to occur spontaneously from solutions that contained both complexes.
Figure 65 shows microscope images of an intact epitaxial crystal resulting from
placing a K3[Cr(ox)3]·2.5H2O seed into a saturated solution of K3[Fe(ox)3](aq/EtOH).
Figure 65: Optical microscope images of one epitaxial crystal grown by immersing a
K3[Cr(ox)3]·2.5H2O seed into a saturated solution of K3[Fe(ox)3](aq/EtOH). The crystal in the image on
the right was flipped to show the underside. It is important to note that the crystal shown in this figure
is intact not a cross-section slice.
Although the seeds were all of different sizes and slightly different shapes due to the
different habits exhibited by K3[Cr(ox)3]·2.5H2O and K3[Fe(ox)3]·2.5H2O, all had
large faces on opposing sides of the crystals, that are denoted as the top and
underside for the purposes of describing epitaxial growth. Looking at the epitaxial
-90°
1 mm1 mm
-90°
1 mm1 mm
1 mm1 mm
180°
1 mm1 mm
180°
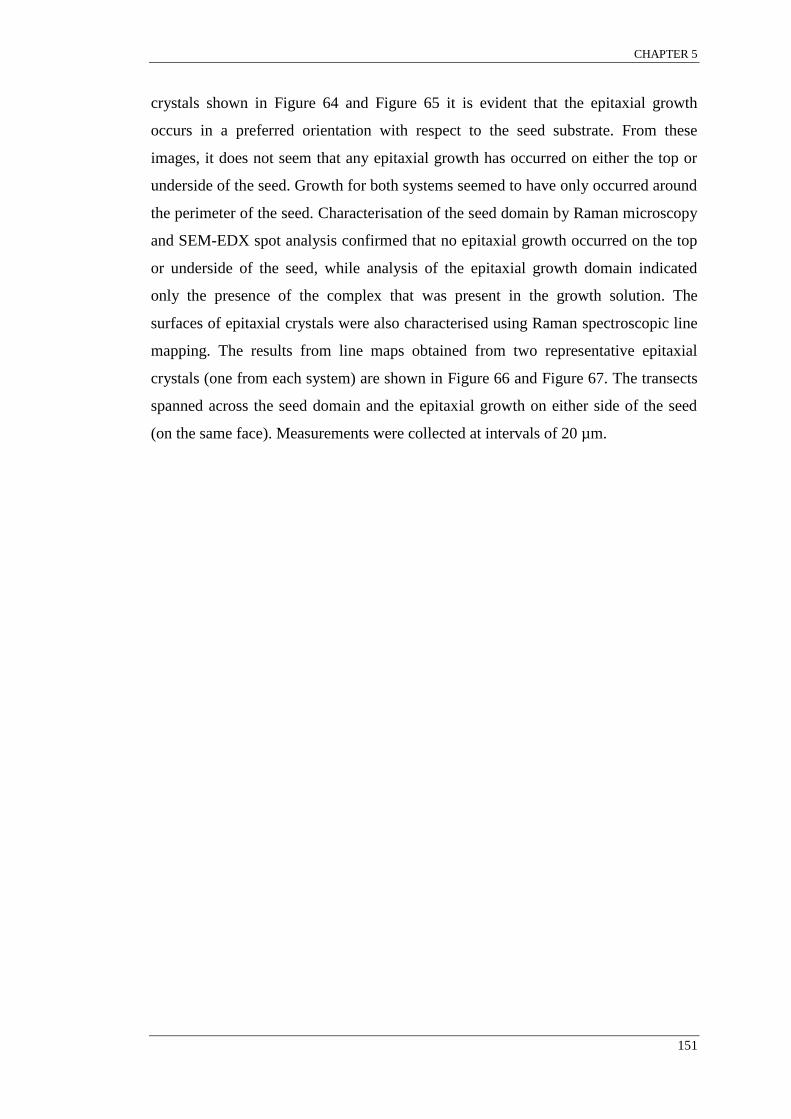
CHAPTER 5
151
crystals shown in Figure 64 and Figure 65 it is evident that the epitaxial growth
occurs in a preferred orientation with respect to the seed substrate. From these
images, it does not seem that any epitaxial growth has occurred on either the top or
underside of the seed. Growth for both systems seemed to have only occurred around
the perimeter of the seed. Characterisation of the seed domain by Raman microscopy
and SEM-EDX spot analysis confirmed that no epitaxial growth occurred on the top
or underside of the seed, while analysis of the epitaxial growth domain indicated
only the presence of the complex that was present in the growth solution. The
surfaces of epitaxial crystals were also characterised using Raman spectroscopic line
mapping. The results from line maps obtained from two representative epitaxial
crystals (one from each system) are shown in Figure 66 and Figure 67. The transects
spanned across the seed domain and the epitaxial growth on either side of the seed
(on the same face). Measurements were collected at intervals of 20 µm.
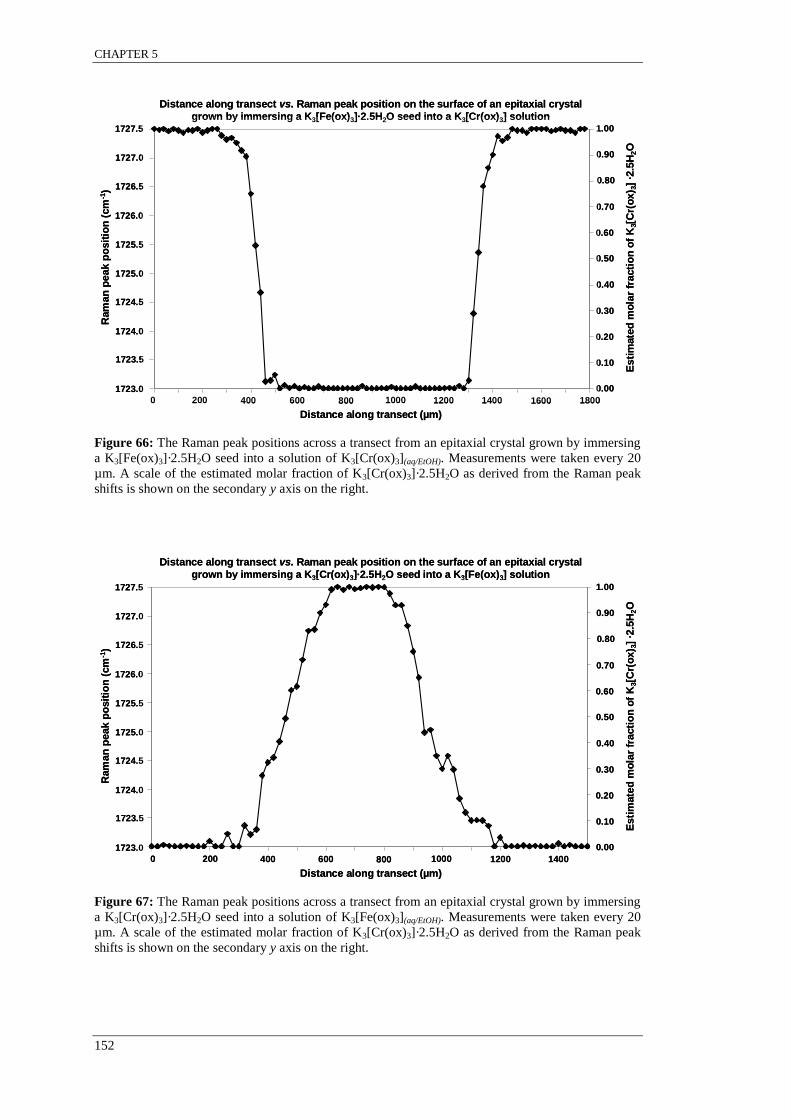
CHAPTER 5
152
Figure 66: The Raman peak positions across a transect from an epitaxial crystal grown by immersing
a K3[Fe(ox)3]·2.5H2O seed into a solution of K3[Cr(ox)3](aq/EtOH). Measurements were taken every 20
µm. A scale of the estimated molar fraction of K3[Cr(ox)3]·2.5H2O as derived from the Raman peak
shifts is shown on the secondary y axis on the right.
Figure 67: The Raman peak positions across a transect from an epitaxial crystal grown by immersing
a K3[Cr(ox)3]·2.5H2O seed into a solution of K3[Fe(ox)3](aq/EtOH). Measurements were taken every 20
µm. A scale of the estimated molar fraction of K3[Cr(ox)3]·2.5H2O as derived from the Raman peak
shifts is shown on the secondary y axis on the right.
1723.0
1723.5
1724.0
1724.5
1725.0
1725.5
1726.0
1726.5
1727.0
1727.5
0
0.1
0.2
0.3
0.4
0.5
0.6
0.7
0.8
0.9
1
Distance along transect vs. Raman peak position on the surface of an epitaxial crystal
grown by immersing a K3[Fe(ox)3]·2.5H2O seed into a K3[Cr(ox)3] solution R
am
an
peak p
osit
ion
(cm
-1)
1723.0
1725.0
1725.5
1726.0
1726.5
1727.0
Esti
mate
d m
ola
r fr
acti
on
of
K3[C
r(o
x) 3
] ·2
.5H
2O
0.00
0.10
0.20
0.30
0.40
0.50
0.60
1727.5
Distance along transect (µm)
200 400 600 800 1000 1200 1400 16000 1800
1723.5
1724.0
1724.5
0.70
0.80
0.90
1.00
1723.0
1723.5
1724.0
1724.5
1725.0
1725.5
1726.0
1726.5
1727.0
1727.5
0
0.1
0.2
0.3
0.4
0.5
0.6
0.7
0.8
0.9
1
Ram
an
peak p
osit
ion
(cm
-1)
1723.0
1725.0
1725.5
1726.0
1726.5
1727.0
Esti
mate
d m
ola
r fr
acti
on
of
K3[C
r(o
x) 3
] ·2
.5H
2O
0.00
0.10
0.20
0.30
0.40
0.50
0.60
1727.5
Distance along transect (µm)
200 400 600 800 1000 1200 14000
1723.5
1724.0
1724.5
0.70
0.80
0.90
1.00
Distance along transect vs. Raman peak position on the surface of an epitaxial crystal
grown by immersing a K3[Cr(ox)3]·2.5H2O seed into a K3[Fe(ox)3] solution
1723.0
1723.5
1724.0
1724.5
1725.0
1725.5
1726.0
1726.5
1727.0
1727.5
0
0.1
0.2
0.3
0.4
0.5
0.6
0.7
0.8
0.9
1
Ram
an
peak p
osit
ion
(cm
-1)
1723.0
1725.0
1725.5
1726.0
1726.5
1727.0
Esti
mate
d m
ola
r fr
acti
on
of
K3[C
r(o
x) 3
] ·2
.5H
2O
0.00
0.10
0.20
0.30
0.40
0.50
0.60
1727.5
Distance along transect (µm)
200 400 600 800 1000 1200 14000
1723.5
1724.0
1724.5
0.70
0.80
0.90
1.00
Distance along transect vs. Raman peak position on the surface of an epitaxial crystal
grown by immersing a K3[Cr(ox)3]·2.5H2O seed into a K3[Fe(ox)3] solution
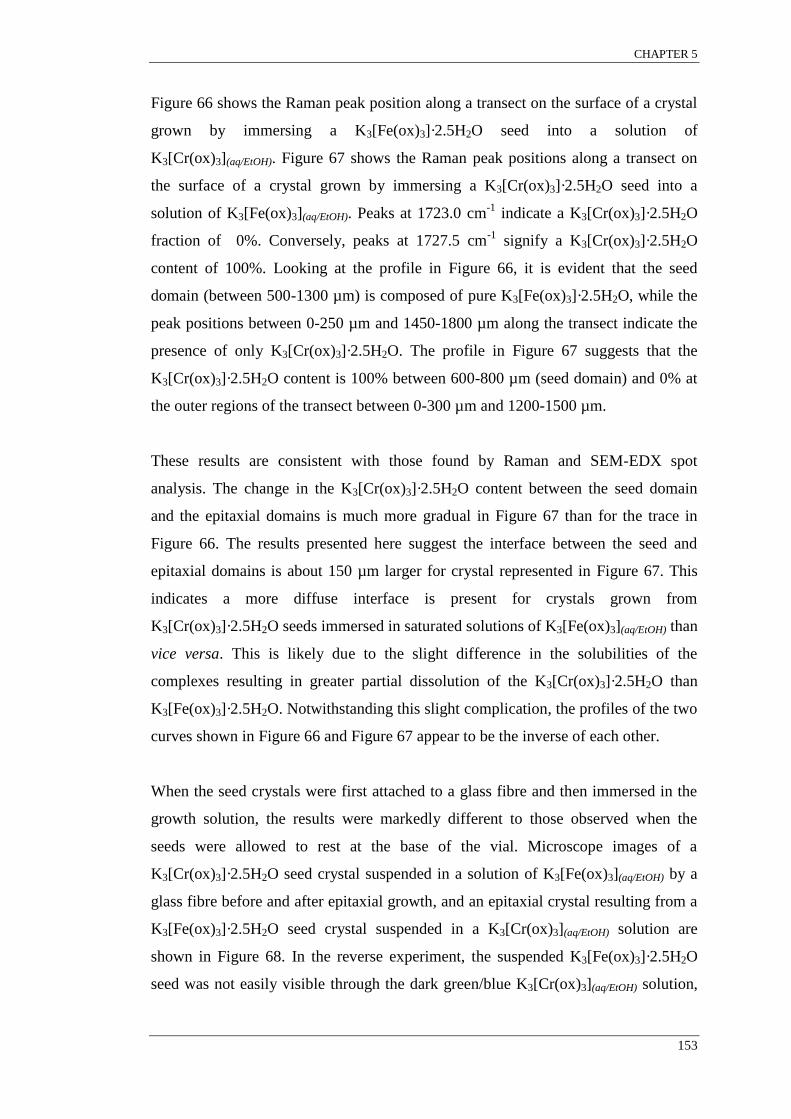
CHAPTER 5
153
Figure 66 shows the Raman peak position along a transect on the surface of a crystal
grown by immersing a K3[Fe(ox)3]·2.5H2O seed into a solution of
K3[Cr(ox)3](aq/EtOH). Figure 67 shows the Raman peak positions along a transect on
the surface of a crystal grown by immersing a K3[Cr(ox)3]·2.5H2O seed into a
solution of K3[Fe(ox)3](aq/EtOH). Peaks at 1723.0 cm-1
indicate a K3[Cr(ox)3]·2.5H2O
fraction of 0%. Conversely, peaks at 1727.5 cm-1
signify a K3[Cr(ox)3]·2.5H2O
content of 100%. Looking at the profile in Figure 66, it is evident that the seed
domain (between 500-1300 µm) is composed of pure K3[Fe(ox)3]·2.5H2O, while the
peak positions between 0-250 µm and 1450-1800 µm along the transect indicate the
presence of only K3[Cr(ox)3]·2.5H2O. The profile in Figure 67 suggests that the
K3[Cr(ox)3]·2.5H2O content is 100% between 600-800 µm (seed domain) and 0% at
the outer regions of the transect between 0-300 µm and 1200-1500 µm.
These results are consistent with those found by Raman and SEM-EDX spot
analysis. The change in the K3[Cr(ox)3]·2.5H2O content between the seed domain
and the epitaxial domains is much more gradual in Figure 67 than for the trace in
Figure 66. The results presented here suggest the interface between the seed and
epitaxial domains is about 150 µm larger for crystal represented in Figure 67. This
indicates a more diffuse interface is present for crystals grown from
K3[Cr(ox)3]·2.5H2O seeds immersed in saturated solutions of K3[Fe(ox)3](aq/EtOH) than
vice versa. This is likely due to the slight difference in the solubilities of the
complexes resulting in greater partial dissolution of the K3[Cr(ox)3]·2.5H2O than
K3[Fe(ox)3]·2.5H2O. Notwithstanding this slight complication, the profiles of the two
curves shown in Figure 66 and Figure 67 appear to be the inverse of each other.
When the seed crystals were first attached to a glass fibre and then immersed in the
growth solution, the results were markedly different to those observed when the
seeds were allowed to rest at the base of the vial. Microscope images of a
K3[Cr(ox)3]·2.5H2O seed crystal suspended in a solution of K3[Fe(ox)3](aq/EtOH) by a
glass fibre before and after epitaxial growth, and an epitaxial crystal resulting from a
K3[Fe(ox)3]·2.5H2O seed crystal suspended in a K3[Cr(ox)3](aq/EtOH) solution are
shown in Figure 68. In the reverse experiment, the suspended K3[Fe(ox)3]·2.5H2O
seed was not easily visible through the dark green/blue K3[Cr(ox)3](aq/EtOH) solution,

CHAPTER 5
154
therefore only a microscope image of the resulting epitaxial crystal is shown in this
figure.
Figure 68: Images of a K3[Cr(ox)3]·2.5H2O seed suspended by a glass fibre in a solution containing
K3[Fe(ox)3](aq/EtOH) before (a) and after (b) epitaxial growth. The image on the right (c) is of an
epitaxial crystal resulting from a K3[Fe(ox)3]·2.5H2O seed suspended by a glass fibre in a solution
containing K3[Cr(ox)3](aq/EtOH).
Looking at the crystals shown in Figure 68, it is clear that epitaxial growth occurred
on all faces of the seed substrate resulting in a completely enveloped seed.
Characterisation of areas on the surface using Raman and SEM-EDX showed that the
surface on all sides was composed entirely of the complex that was present in the
growth solution. The differences between the epitaxial crystals resulting from the
two methods of introducing the seed into the solution are quite remarkable. It seems
that epitaxial growth is only allowed around the perimeter of the seed when either the
top or underside of the seed is in contact with the base of the glass vial. The reasons
for this observation are not known but are thought to be attributed to local charging
effects occurring between the crystalline material and the glass of the vial during
crystallisation. The same effects could be present during the growth of
K3[CrxFe1-x(ox)3]·2.5H2O co-crystals, where concentration gradients were observed
to be highly pronounced in some directions but not others.
The two experiments that involved immersing seed crystals of each of
K3[Cr(ox)3]·2.5H2O and K3[Fe(ox)3]·2.5H2O into solutions of either
K3[Cr(ox)3](aq/EtOH) or K3[Fe(ox)3](aq/EtOH) were designed to test the selection process
for like and different complex molecules in solutions already containing crystals of
the same composition as the solution. Figure 69 shows seed crystals of
1 mm
(c)
(b)(a)
1 mm1 mm
(c)
(b)(a)
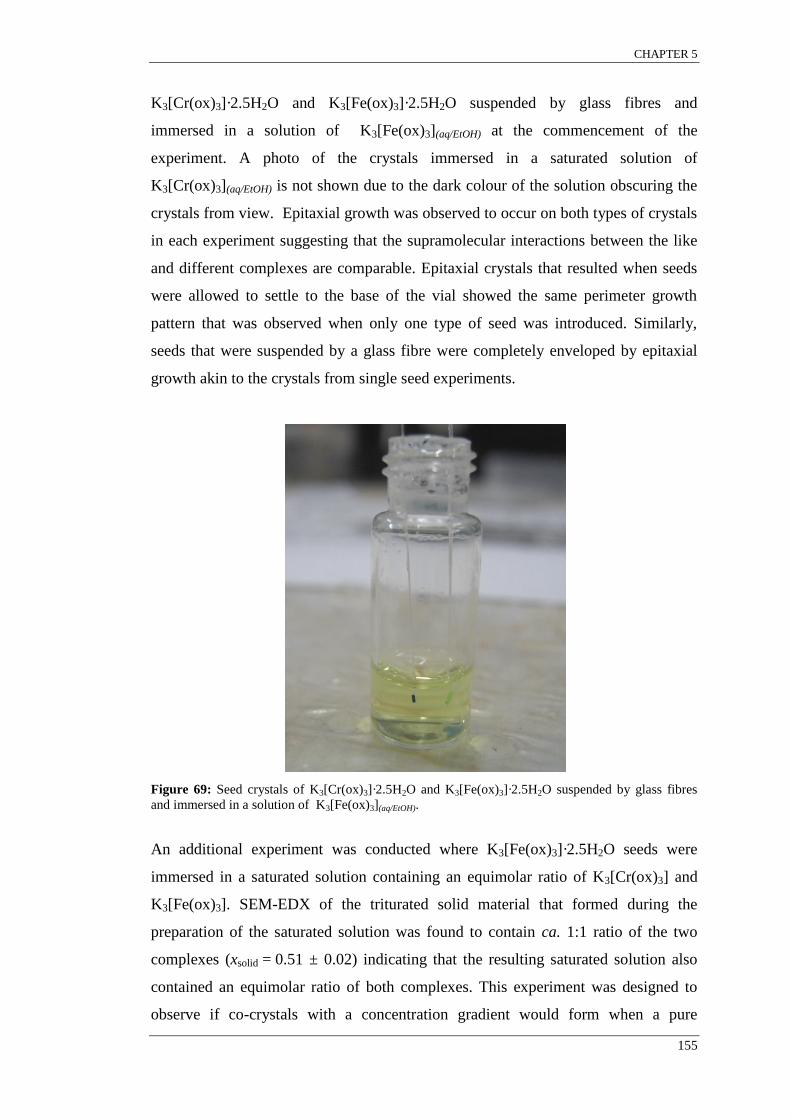
CHAPTER 5
155
K3[Cr(ox)3]·2.5H2O and K3[Fe(ox)3]·2.5H2O suspended by glass fibres and
immersed in a solution of K3[Fe(ox)3](aq/EtOH) at the commencement of the
experiment. A photo of the crystals immersed in a saturated solution of
K3[Cr(ox)3](aq/EtOH) is not shown due to the dark colour of the solution obscuring the
crystals from view. Epitaxial growth was observed to occur on both types of crystals
in each experiment suggesting that the supramolecular interactions between the like
and different complexes are comparable. Epitaxial crystals that resulted when seeds
were allowed to settle to the base of the vial showed the same perimeter growth
pattern that was observed when only one type of seed was introduced. Similarly,
seeds that were suspended by a glass fibre were completely enveloped by epitaxial
growth akin to the crystals from single seed experiments.
Figure 69: Seed crystals of K3[Cr(ox)3]·2.5H2O and K3[Fe(ox)3]·2.5H2O suspended by glass fibres
and immersed in a solution of K3[Fe(ox)3](aq/EtOH).
An additional experiment was conducted where K3[Fe(ox)3]·2.5H2O seeds were
immersed in a saturated solution containing an equimolar ratio of K3[Cr(ox)3] and
K3[Fe(ox)3]. SEM-EDX of the triturated solid material that formed during the
preparation of the saturated solution was found to contain ca. 1:1 ratio of the two
complexes (xsolid = 0.51 ± 0.02) indicating that the resulting saturated solution also
contained an equimolar ratio of both complexes. This experiment was designed to
observe if co-crystals with a concentration gradient would form when a pure

CHAPTER 5
156
K3[Fe(ox)3]·2.5H2O seed crystal was placed in a saturated solution containing an
equimolar ratio of both complexes. By using a saturated solution, the solubility
differences between the two complexes are minimised and therefore any
concentration gradient that formed could be largely attributed to supramolecular
selection, a bias for K3[Fe(ox)3] due to the seed rather than just fractional
crystallisation. Figure 70 shows microscope images of an intact epitaxial crystal
resulting from placing a K3[Cr(ox)3]·2.5H2O seed into a saturated solution containing
an equimolar ratio of K3[Cr(ox)3] and K3[Fe(ox)3]. Figure 71 plots the Raman peak
position along a transect that spanned across the seed domain and the epitaxial
growth on either side (on the same face). Measurements were taken at 20 µm
intervals.
Figure 70: Optical microscope images of an epitaxial crystal grown by immersing a
K3[Fe(ox)3]·2.5H2O seed into a saturated solution containing an equimolar ratio of K3[Cr(ox)3] and
K3[Fe(ox)3]. The crystal in the image on the right was rotated ca. 90° anticlockwise to highlight the
blue iridescence of the K3[Cr(ox)3]·2.5H2O present in the epitaxial growth domain that can be viewed
at certain angles. It is important to note that these images are of an intact crystal and not of
cross-section slices.
1 mm
-90°
1 mm1 mm
-90°
1 mm
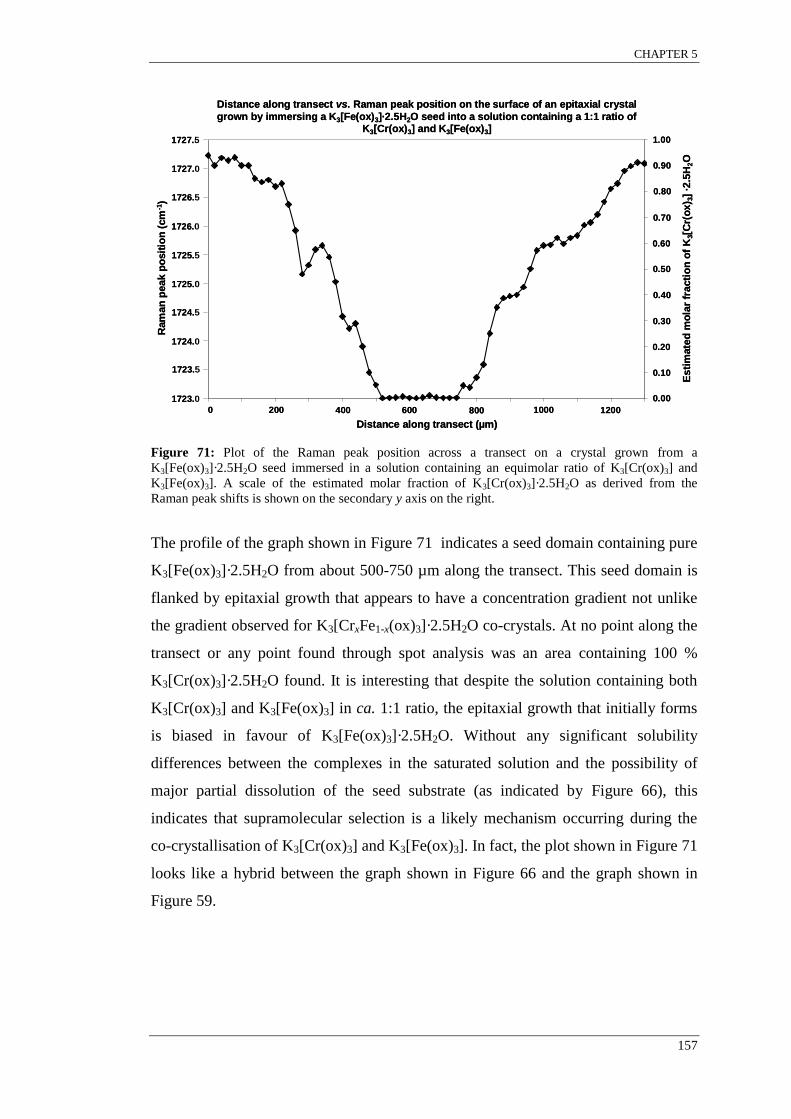
CHAPTER 5
157
Figure 71: Plot of the Raman peak position across a transect on a crystal grown from a
K3[Fe(ox)3]·2.5H2O seed immersed in a solution containing an equimolar ratio of K3[Cr(ox)3] and
K3[Fe(ox)3]. A scale of the estimated molar fraction of K3[Cr(ox)3]·2.5H2O as derived from the
Raman peak shifts is shown on the secondary y axis on the right.
The profile of the graph shown in Figure 71 indicates a seed domain containing pure
K3[Fe(ox)3]·2.5H2O from about 500-750 µm along the transect. This seed domain is
flanked by epitaxial growth that appears to have a concentration gradient not unlike
the gradient observed for K3[CrxFe1-x(ox)3]·2.5H2O co-crystals. At no point along the
transect or any point found through spot analysis was an area containing 100 %
K3[Cr(ox)3]·2.5H2O found. It is interesting that despite the solution containing both
K3[Cr(ox)3] and K3[Fe(ox)3] in ca. 1:1 ratio, the epitaxial growth that initially forms
is biased in favour of K3[Fe(ox)3]·2.5H2O. Without any significant solubility
differences between the complexes in the saturated solution and the possibility of
major partial dissolution of the seed substrate (as indicated by Figure 66), this
indicates that supramolecular selection is a likely mechanism occurring during the
co-crystallisation of K3[Cr(ox)3] and K3[Fe(ox)3]. In fact, the plot shown in Figure 71
looks like a hybrid between the graph shown in Figure 66 and the graph shown in
Figure 59.
1723.0
1723.5
1724.0
1724.5
1725.0
1725.5
1726.0
1726.5
1727.0
1727.5
0
0.1
0.2
0.3
0.4
0.5
0.6
0.7
0.8
0.9
1
Ram
an
peak p
osit
ion
(cm
-1)
1723.0
1725.0
1725.5
1726.0
1726.5
1727.0
Esti
mate
d m
ola
r fr
acti
on
of
K3[C
r(o
x) 3
] ·2
.5H
2O
0.00
0.10
0.20
0.30
0.40
0.50
0.60
1727.5
Distance along transect (µm)
200 400 600 800 1000 12000
1723.5
1724.0
1724.5
0.70
0.80
0.90
1.00
Distance along transect vs. Raman peak position on the surface of an epitaxial crystal
grown by immersing a K3[Fe(ox)3]·2.5H2O seed into a solution containing a 1:1 ratio of K3[Cr(ox)3] and K3[Fe(ox)3]
1723.0
1723.5
1724.0
1724.5
1725.0
1725.5
1726.0
1726.5
1727.0
1727.5
0
0.1
0.2
0.3
0.4
0.5
0.6
0.7
0.8
0.9
1
Ram
an
peak p
osit
ion
(cm
-1)
1723.0
1725.0
1725.5
1726.0
1726.5
1727.0
Esti
mate
d m
ola
r fr
acti
on
of
K3[C
r(o
x) 3
] ·2
.5H
2O
0.00
0.10
0.20
0.30
0.40
0.50
0.60
1727.5
Distance along transect (µm)
200 400 600 800 1000 12000
1723.5
1724.0
1724.5
0.70
0.80
0.90
1.00
Distance along transect vs. Raman peak position on the surface of an epitaxial crystal
grown by immersing a K3[Fe(ox)3]·2.5H2O seed into a solution containing a 1:1 ratio of K3[Cr(ox)3] and K3[Fe(ox)3]
CHAPTER 5
158
5.2.2 Co-ordination frameworks of the type [MII
(L)3][MIM
III(ox)3]
Three-dimensional metal-organic frameworks with the general formula
[MII(L)3][M
IM
III(ox)3] ( L = 2,2′-bipyridine, 1,10-phenanthroline) have been known
since 1971 and tend to crystallise in cubic space groups such as P213 and P4332.364
Since then, many coordination frameworks of this type have been synthesised to
yield similar structures. Interestingly, there are many more [MII(L)3][M
IM
III(ox)3]
type structures in the literature that contain [MII(bipy)3]
2+ than those that contain
[MII(phen)3]
2+. Table 19 summarises the crystal structures of coordination
frameworks that are available in the CSD with the general formula
[MII(L)3][M
IM
III(ox)3] or similar structures involving [M
II/III(L)3]
z+ with
{[MIM
III(ox)3]
2-}n , {[M
IIM
III(ox)3]
-}n, {[M
II2(ox)3]
2-}n or {[M
IM
III(dto)3]
2-}n,
(L = 2,2′-bipyridine, 1,10-phenanthroline, ox = oxalato, dto = 1,2-dithiooxalato).51
Unless it was indicted that enantiopure starting materials were used, the chirality
indicated in Table 19 is a result of spontaneous resolution during crystallisation from
racemic starting materials. Therefore, the bulk samples obtained from racemic
starting materials would contain both Δ and Λ single crystals.
.

CHAPTER 5
159
Table 19: Summary of crystal structures (in chronological order of publication) and crystallising
conditions of 3D coordination frameworks involving [MII/III
(L)3]z+
with either {[MIM
III(ox)3]
2-}n,
{[MIIM
III(ox)3]
-}n, {[M
II2(ox)3]
2-}n or {[M
IM
III(dto)3]
2-}n, (L = 2,2′-bipyridine, 1,10-phenanthroline and
ox = oxalato, dto = 1,2-dithiooxalato).
CSD
REFCODE Year Compound Formula
Space
Group
Cell
Dimensions Chirality
Crystallising
Conditions
PNIOCO* 1971 [Ni
II(phen)3][KCo
III(ox)3]·2H2O P213
a =
16.225(10) Λ
S.D. Me2CO /H2O
(5ºC)
using
enantiomerically pure
complexes
YAPPAG* 1993 [Fe
II(bipy)3][Fe
II2(ox)3] P4332 a = 15.392(2) Δ S.E. H2O/H3O
+, λUV
HEYTIO* 1994 [Ni
II(bipy)3][Mn
II2(ox)3] P4132 a = 15.579(2) Λ Gel S.D. H2O
HEYTOU* 1994 [Fe
II(bipy)3][NaFe
III(ox)3] P213 a = 15.507(3) Λ Gel S.D. H2O
HEYTUA* 1994 [Fe
II(bipy)3][LiCr
III(ox)3] P213 a = 15.262(4) Λ Gel S.D. H2O
TUNFAJ* 1996 [Ni
II(bipy)3][NaAl
III(ox)3] P213 a = 15.518(2) Λ Gel S.D. H2O
ZUQVAI* 1996 [Cr
III(bipy)3][NaCr
III(ox)3]ClO4
P213 a = 15.523(4) Λ Gel S.D. H2O
ZUQVEM* 1996 [Cr
III(bipy)3][Mn
II2(ox)3]ClO4 P4132 a = 15.564(3) Λ Gel S.D. H2O
ZUQVIQ* 1996 [Cr
III(bipy)3][Mn
II2(ox)3]BF4 P4132 a = 15.564(3) Λ Gel S.D. H2O
ZUQVOW* 1996 [Co
III(bipy)3][NaCr
III(ox)3]PF6 P213 a = 15.515(3) Δ Gel S.D. H2O
ZUQVUC* 1996 [Ni
II(phen)3][NaCo
III(dto)3]·Me2CO P212121
a = 16.238(4)
b = 16.225(4)
c = 18.371(5)
Δ Me2CO/H2O
PIMYUF* 1998 [Co
III(bipy)3][Co
II2(ox)3]ClO4 P4132 a = 15.287(2) Λ S.D. H2O
DAXXIJ* 1999 [Ru
II(bipy)3][LiCr
III(ox)3]·H2O P213 a = 15.289(2) Λ
Gel S.D. H2O using
enantiomerically pure
[Ru(bipy)3]2+
DAXZIL* 1999 [Ru
II(bipy)3][LiCr
III(ox)3]·H2O P213 a = 15.293(8) Δ
Gel S.D. H2O using
enantiomerically pure
[Ru(bipy)3]2+
DAYBAG* 1999 [Ni
II(bipy)3][LiCr
III(ox)3]·H2O P213 a = 15.380(5) Δ
Gel S.D. H2O using
enantiomerically pure
[Cr(ox)3]3-
GOLRII† 1999 [Ru
II(bipy)3][NaRu
III(ox)3] P213 a = 15.556(1) Λ Gel S.D. H2O
GOLROO* 1999 [Ru
II(bipy)3][NaRh
III(ox)3] P213 a = 15.515(2) Δ Gel S.D. H2O
GOLRUU* 1999 [Ru
II(bipy)3][NaAl
III(ox)3] P213 a = 15.407(4) Δ Gel S.D. H2O
CUFQOJ* 2000 [Zn
II(bipy)3][NaCr
III(ox)3] P213 a = 15.637(1) Δ Gel S.D. H2O
CUFROK* 2000 [Co
II(bipy)3][NaCr
III(ox)3] P213 a = 15.585(0) Λ Gel S.D. H2O
CUFRUQ‡ 2000 [Ru
II(bipy)3][LiCr
III(ox)3] P213 a = 15.309(0) Λ Gel S.D. H2O
CUFSAX§ 2000 [Co
II(bipy)3][LiCr
III(ox)3] P213 a = 15.309(1) Δ Gel S.D. H2O
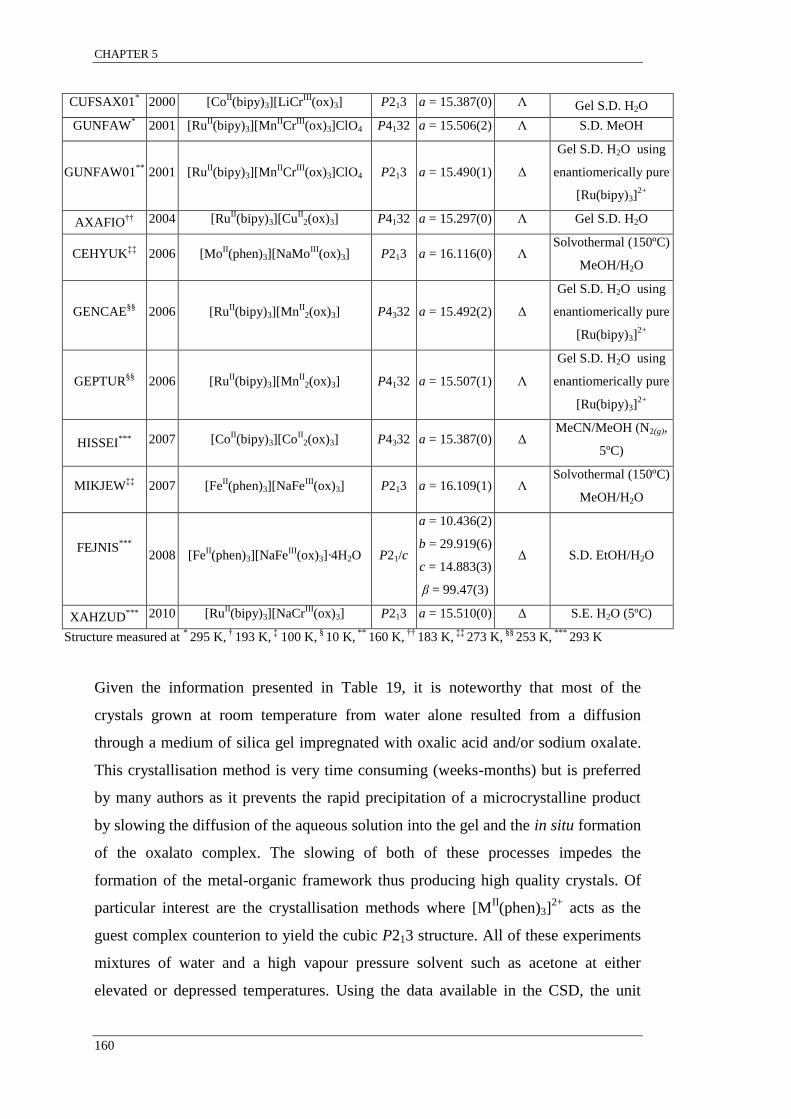
CHAPTER 5
160
CUFSAX01* 2000 [Co
II(bipy)3][LiCr
III(ox)3] P213 a = 15.387(0) Λ Gel S.D. H2O
GUNFAW* 2001 [Ru
II(bipy)3][Mn
IICr
III(ox)3]ClO4 P4132 a = 15.506(2) Λ S.D. MeOH
GUNFAW01**
2001 [RuII(bipy)3][Mn
IICr
III(ox)3]ClO4 P213 a = 15.490(1) Δ
Gel S.D. H2O using
enantiomerically pure
[Ru(bipy)3]2+
AXAFIO†† 2004 [Ru
II(bipy)3][Cu
II2(ox)3] P4132 a = 15.297(0) Λ Gel S.D. H2O
CEHYUK‡‡
2006 [MoII(phen)3][NaMo
III(ox)3] P213 a = 16.116(0) Λ
Solvothermal (150ºC)
MeOH/H2O
GENCAE§§
2006 [RuII(bipy)3][Mn
II2(ox)3] P4332 a = 15.492(2) Δ
Gel S.D. H2O using
enantiomerically pure
[Ru(bipy)3]2+
GEPTUR§§
2006 [RuII(bipy)3][Mn
II2(ox)3] P4132 a = 15.507(1) Λ
Gel S.D. H2O using
enantiomerically pure
[Ru(bipy)3]2+
HISSEI*** 2007 [Co
II(bipy)3][Co
II2(ox)3] P4332 a = 15.387(0) Δ
MeCN/MeOH (N2(g),
5ºC)
MIKJEW‡‡
2007 [FeII(phen)3][NaFe
III(ox)3] P213 a = 16.109(1) Λ
Solvothermal (150ºC)
MeOH/H2O
FEJNIS***
2008 [Fe
II(phen)3][NaFe
III(ox)3]·4H2O P21/c
a = 10.436(2)
b = 29.919(6)
c = 14.883(3)
β = 99.47(3)
Δ S.D. EtOH/H2O
XAHZUD*** 2010 [Ru
II(bipy)3][NaCr
III(ox)3] P213 a = 15.510(0) Δ S.E. H2O (5ºC)
Structure measured at * 295 K,
† 193 K,
‡ 100 K,
§ 10 K,
** 160 K,
†† 183 K,
‡‡ 273 K,
§§ 253 K,
*** 293 K
Given the information presented in Table 19, it is noteworthy that most of the
crystals grown at room temperature from water alone resulted from a diffusion
through a medium of silica gel impregnated with oxalic acid and/or sodium oxalate.
This crystallisation method is very time consuming (weeks-months) but is preferred
by many authors as it prevents the rapid precipitation of a microcrystalline product
by slowing the diffusion of the aqueous solution into the gel and the in situ formation
of the oxalato complex. The slowing of both of these processes impedes the
formation of the metal-organic framework thus producing high quality crystals. Of
particular interest are the crystallisation methods where [MII(phen)3]
2+ acts as the
guest complex counterion to yield the cubic P213 structure. All of these experiments
mixtures of water and a high vapour pressure solvent such as acetone at either
elevated or depressed temperatures. Using the data available in the CSD, the unit

CHAPTER 5
161
cells of these cubic P213 [MII(phen)3][M
IM
III(ox)3] structures are calculated to be ca.
500 Å3 larger than their 2,2′-bipyridine analogues yet still maintain the same crystal
packing.
Metal dilution experiments (MA
xMB
1-x, where MA and M
B share the same oxidation
number) for compounds of the type [MII(L)3][M
IM
III(ox)3] can occur at the M
II site
giving the general formula [MA
xMB
1-x(L)3][MIM
III(ox)3] or at the M
III site giving the
general formula [MII(L)3][M
IM
AxM
B1-x(ox)3]. The former system is described as a
cationic metal complex dilution, while the latter is an anionic metal complex
dilution. Figure 72 shows the crystal packing along the a axis that is typical for
cubic structures with the general formula [MII(L)3][M
IM
III(ox)3]. The cationic
[Ru(bipy)3]2+
guests are shown in black while the anionic {[NaCr(ox)3]2-
}n
framework is shown in red; this structure has the formula Δ-[Ru(bipy)3][NaCr(ox)3]
(CSD reference code XAHZUD).65
Figure 72: [100] projection of Δ-[Ru(bipy)3][NaCr(ox)3] reported for the 2010 structure by Hauser et
al. (XAHZUD) showing the crystal packing common to the P213 cubic structures listed in Table 19.
The cationic [Ru(bipy)3]2+
guests are shown in black while the anionic {[NaCr(ox)3]2-
}n framework is
shown in red.65

CHAPTER 5
162
Throughout this project, several co-crystalline coordination frameworks of these
types were synthesised following a modified literature procedure involving
[MII(L)3]
2+ (M
II = Ni, Ru; L = 2,2′-bipyridine, 1,10-phenanthroline) and [M
III(ox)3]
3-
(MIII
= Cr, Fe). Co-crystallisation experiments were designed so that metal dilutions
of either the cationic and anionic metal complexes could be examined. Table 20
summarises the co-crystallisation experiments that will be discussed within this
section and highlights all of the metal complexes involved, their relative solution
state concentrations (xsolution) and the formulae of the resulting solid state
co-crystalline coordination frameworks. The sodium chloride solution (0.02 M) was
used as a source of Na+ ions; all metal complexes shown in Table 20 are soluble in
water. The different types of experiments were conducted in triplicate to test
reproducibility and on a small scale (ca. 10 mg).* In addition to the 18 batches, some
co-crystallisations were repeated under different conditions in order to further
understand the results obtained from the triplicate experiments. The co-crystallisation
systems in Table 20 are numbered 1 to 6. These numbers will be used throughout to
simplify the discussion of the various results.
* A small scale was chosen to ensure a representative sample of crystals was analysed using the ca. 10
crystals that were harvested i.e. a greater proportion of the crystals that were formed during
crystallisation.
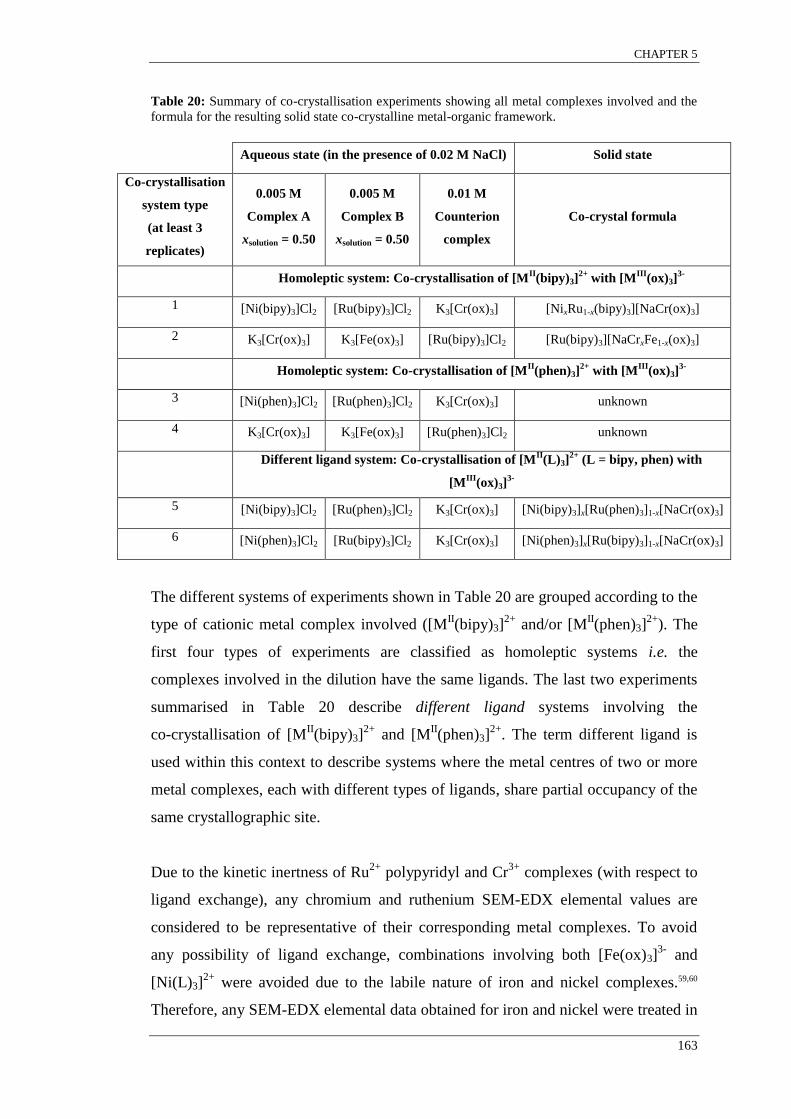
CHAPTER 5
163
Table 20: Summary of co-crystallisation experiments showing all metal complexes involved and the
formula for the resulting solid state co-crystalline metal-organic framework.
Aqueous state (in the presence of 0.02 M NaCl) Solid state
Co-crystallisation
system type
(at least 3
replicates)
0.005 M
Complex A
xsolution = 0.50
0.005 M
Complex B
xsolution = 0.50
0.01 M
Counterion
complex
Co-crystal formula
Homoleptic system: Co-crystallisation of [MII(bipy)3]
2+ with [M
III(ox)3]
3-
1 [Ni(bipy)3]Cl2 [Ru(bipy)3]Cl2 K3[Cr(ox)3] [NixRu1-x(bipy)3][NaCr(ox)3]
2 K3[Cr(ox)3] K3[Fe(ox)3] [Ru(bipy)3]Cl2 [Ru(bipy)3][NaCrxFe1-x(ox)3]
Homoleptic system: Co-crystallisation of [MII(phen)3]
2+ with [M
III(ox)3]
3-
3 [Ni(phen)3]Cl2
[Ru(phen)3]Cl2 K3[Cr(ox)3] unknown
4 K3[Cr(ox)3]
K3[Fe(ox)3] [Ru(phen)3]Cl2 unknown
Different ligand system: Co-crystallisation of [MII(L)3]
2+ (L = bipy, phen) with
[MIII
(ox)3]3-
5 [Ni(bipy)3]Cl2 [Ru(phen)3]Cl2 K3[Cr(ox)3] [Ni(bipy)3]x[Ru(phen)3]1-x[NaCr(ox)3]
6 [Ni(phen)3]Cl2 [Ru(bipy)3]Cl2 K3[Cr(ox)3] [Ni(phen)3]x[Ru(bipy)3]1-x[NaCr(ox)3]
The different systems of experiments shown in Table 20 are grouped according to the
type of cationic metal complex involved ([MII(bipy)3]
2+ and/or [M
II(phen)3]
2+). The
first four types of experiments are classified as homoleptic systems i.e. the
complexes involved in the dilution have the same ligands. The last two experiments
summarised in Table 20 describe different ligand systems involving the
co-crystallisation of [MII(bipy)3]
2+ and [M
II(phen)3]
2+. The term different ligand is
used within this context to describe systems where the metal centres of two or more
metal complexes, each with different types of ligands, share partial occupancy of the
same crystallographic site.
Due to the kinetic inertness of Ru2+
polypyridyl and Cr3+
complexes (with respect to
ligand exchange), any chromium and ruthenium SEM-EDX elemental values are
considered to be representative of their corresponding metal complexes. To avoid
any possibility of ligand exchange, combinations involving both [Fe(ox)3]3-
and
[Ni(L)3]2+
were avoided due to the labile nature of iron and nickel complexes.59,60
Therefore, any SEM-EDX elemental data obtained for iron and nickel were treated in

CHAPTER 5
164
the same way as the data obtained for chromium and ruthenium. This is because
although ligand exchange occurs, only one free bidentate ligand species is present in
solution and the formation of the chelated complex is thermodynamically favoured
due to the chelate effect. The products were characterised by SEM-EDX and where
possible by SCXRD and PXRD. Values such as MII:M
III ratios (where the M
III is
normalised to 1) and xsolid are reported as x̄ ± s (x̄ = sample mean; s = sample
standard deviation). Microscope images of representative co-crystals from systems 1,
3 and 5 are shown in Figure 73. For exact preparative experimental details, refer to
Section 3.3.7.
Figure 73: (a) Single co-crystals of the general formula [NixRu1-x(bipy)3][NaCr(ox)3] resulting from
the co-crystallisation of a 1:1:2 ratio of [Ni(bipy)3]2+
, [Ru(bipy)3]2+
and [Cr(ox)3]3-
in the presence of
NaCl (system 1), (b) single co-crystal resulting from the co-crystallisation of a 1:1:2 ratio of
[Ni(phen)3]2+
, [Ru(phen)3]2+
and [Cr(ox)3]3-
in the presence of NaCl (system 3) and (c) a single
co-crystal of the general formula [Ni(bipy)3]x[Ru(phen)3]1-x[NaCr(ox)3] resulting from the
co-crystallisation of a 1:1:2 ratio of [Ni(bipy)3]2+
, [Ruphen)3]2+
and [Cr(ox)3]3-
in the presence of
NaCl (system 5). All co-crystals grown from solutions containing [MII(bipy)3]
2+ had tetrahedral habits
while those that did not involve [MII(bipy)3]
2+ (systems 3 and 4) had rectangular prism habits. It is
noteworthy that the rectangular prism co-crystals crumbled shortly after removal from the mother
liquor as can be seen in (b); the tetrahedra appeared to uphold their structural integrity after removal
from solution. Regardless of the system, all of the experiments produced only red co-crystals.
Representative SEM-EDX statistical data for these systems are summarised in Table
21 and show the mean (x̄), standard deviation (s) and minimum (Min) and maximum
(Max) values for n crystals. The data in each row, determined by EDX, correspond to
the element highlighted in coloured text (either Ni or Cr). For example, the statistics
for the system in the first row relate to the nickel mole fraction relative to ruthenium
in the solid state, whereas the values in the second row relate to the chromium
content relative to iron. The formula for all co-crystals except those from experiment
types 3 and 4 (shaded cells) are included in the table. Structural information was not
collected for co-crystals resulting from experiment types 3 and 4 (shaded cells) due
to their structural instability once removed from the mother liquor and hence the
100 µm 100 µm100 µm
(c)(b)(a)
100 µm 100 µm100 µm100 µm 100 µm100 µm
(c)(b)(a)
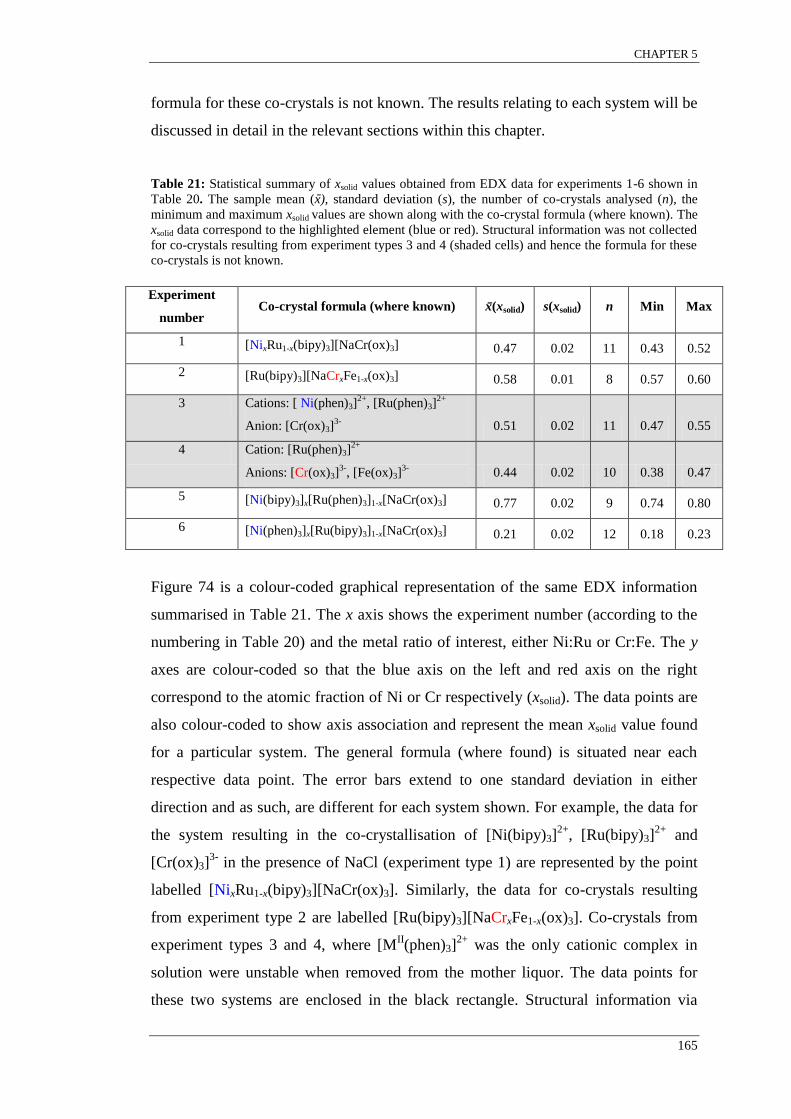
CHAPTER 5
165
formula for these co-crystals is not known. The results relating to each system will be
discussed in detail in the relevant sections within this chapter.
Table 21: Statistical summary of xsolid values obtained from EDX data for experiments 1-6 shown in
Table 20. The sample mean (x̄), standard deviation (s), the number of co-crystals analysed (n), the
minimum and maximum xsolid values are shown along with the co-crystal formula (where known). The
xsolid data correspond to the highlighted element (blue or red). Structural information was not collected
for co-crystals resulting from experiment types 3 and 4 (shaded cells) and hence the formula for these
co-crystals is not known.
Experiment
number Co-crystal formula (where known) x̄(xsolid) s(xsolid) n Min Max
1 [NixRu1-x(bipy)3][NaCr(ox)3] 0.47 0.02 11 0.43 0.52
2 [Ru(bipy)3][NaCrxFe1-x(ox)3] 0.58 0.01 8 0.57 0.60
3 Cations: [ Ni(phen)3]2+
, [Ru(phen)3]2+
Anion: [Cr(ox)3]3-
0.51 0.02 11 0.47 0.55
4 Cation: [Ru(phen)3]2+
Anions: [Cr(ox)3]3-
, [Fe(ox)3]3-
0.44 0.02 10 0.38 0.47
5 [Ni(bipy)3]x[Ru(phen)3]1-x[NaCr(ox)3] 0.77 0.02 9 0.74 0.80
6 [Ni(phen)3]x[Ru(bipy)3]1-x[NaCr(ox)3] 0.21 0.02 12 0.18 0.23
Figure 74 is a colour-coded graphical representation of the same EDX information
summarised in Table 21. The x axis shows the experiment number (according to the
numbering in Table 20) and the metal ratio of interest, either Ni:Ru or Cr:Fe. The y
axes are colour-coded so that the blue axis on the left and red axis on the right
correspond to the atomic fraction of Ni or Cr respectively (xsolid). The data points are
also colour-coded to show axis association and represent the mean xsolid value found
for a particular system. The general formula (where found) is situated near each
respective data point. The error bars extend to one standard deviation in either
direction and as such, are different for each system shown. For example, the data for
the system resulting in the co-crystallisation of [Ni(bipy)3]2+
, [Ru(bipy)3]2+
and
[Cr(ox)3]3-
in the presence of NaCl (experiment type 1) are represented by the point
labelled [NixRu1-x(bipy)3][NaCr(ox)3]. Similarly, the data for co-crystals resulting
from experiment type 2 are labelled [Ru(bipy)3][NaCrxFe1-x(ox)3]. Co-crystals from
experiment types 3 and 4, where [MII(phen)3]
2+ was the only cationic complex in
solution were unstable when removed from the mother liquor. The data points for
these two systems are enclosed in the black rectangle. Structural information via
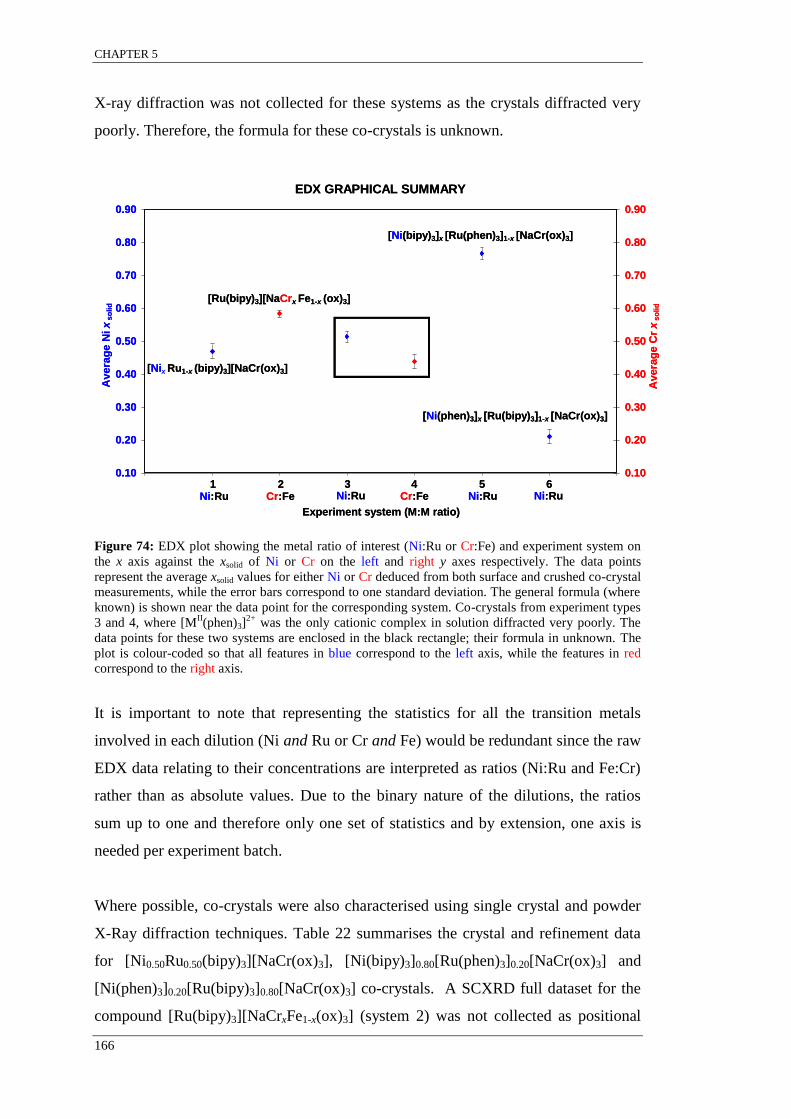
CHAPTER 5
166
X-ray diffraction was not collected for these systems as the crystals diffracted very
poorly. Therefore, the formula for these co-crystals is unknown.
Figure 74: EDX plot showing the metal ratio of interest (Ni:Ru or Cr:Fe) and experiment system on
the x axis against the xsolid of Ni or Cr on the left and right y axes respectively. The data points
represent the average xsolid values for either Ni or Cr deduced from both surface and crushed co-crystal
measurements, while the error bars correspond to one standard deviation. The general formula (where
known) is shown near the data point for the corresponding system. Co-crystals from experiment types
3 and 4, where [MII(phen)3]
2+ was the only cationic complex in solution diffracted very poorly. The
data points for these two systems are enclosed in the black rectangle; their formula in unknown. The
plot is colour-coded so that all features in blue correspond to the left axis, while the features in red
correspond to the right axis.
It is important to note that representing the statistics for all the transition metals
involved in each dilution (Ni and Ru or Cr and Fe) would be redundant since the raw
EDX data relating to their concentrations are interpreted as ratios (Ni:Ru and Fe:Cr)
rather than as absolute values. Due to the binary nature of the dilutions, the ratios
sum up to one and therefore only one set of statistics and by extension, one axis is
needed per experiment batch.
Where possible, co-crystals were also characterised using single crystal and powder
X-Ray diffraction techniques. Table 22 summarises the crystal and refinement data
for [Ni0.50Ru0.50(bipy)3][NaCr(ox)3], [Ni(bipy)3]0.80[Ru(phen)3]0.20[NaCr(ox)3] and
[Ni(phen)3]0.20[Ru(bipy)3]0.80[NaCr(ox)3] co-crystals. A SCXRD full dataset for the
compound [Ru(bipy)3][NaCrxFe1-x(ox)3] (system 2) was not collected as positional
0.10
0.20
0.30
0.40
0.50
0.60
0.70
0.80
0.90
0 1 2 3 4 5 6 7
Av
era
ge N
i x
so
lid
0.10
0.20
0.30
0.40
0.50
0.60
0.70
0.80
0.90
Av
era
ge C
r x
so
lid
Cr:FeCr:FeNi:Ru Ni:RuNi:Ru Ni:Ru
[Nix Ru1-x (bipy)3][NaCr(ox)3]
[Ni(phen)3]x [Ru(bipy)3]1-x [NaCr(ox)3]
[Ni(bipy)3]x [Ru(phen)3]1-x [NaCr(ox)3]
[Ru(bipy)3][NaCrx Fe1-x (ox)3]
EDX GRAPHICAL SUMMARY
Experiment system (M:M ratio)
1 2 3 4 5 60.10
0.20
0.30
0.40
0.50
0.60
0.70
0.80
0.90
0 1 2 3 4 5 6 7
Av
era
ge N
i x
so
lid
0.10
0.20
0.30
0.40
0.50
0.60
0.70
0.80
0.90
Av
era
ge C
r x
so
lid
Cr:FeCr:FeNi:Ru Ni:RuNi:Ru Ni:Ru
[Nix Ru1-x (bipy)3][NaCr(ox)3]
[Ni(phen)3]x [Ru(bipy)3]1-x [NaCr(ox)3]
[Ni(bipy)3]x [Ru(phen)3]1-x [NaCr(ox)3]
[Ru(bipy)3][NaCrx Fe1-x (ox)3]
EDX GRAPHICAL SUMMARY
Experiment system (M:M ratio)
1 2 3 4 5 6

CHAPTER 5
167
occupancy is an inaccurate indicator of the relative concentration of complexes
(i.e. xsolid) for atoms with similar electron density, such as with chromium and iron.
The attached CD contains the crystallographic information files (.cif) for these
crystal structures. Unlike SCXRD, PXRD is a bulk analysis technique and can be
used instead of, or in addition to, SCXRD to further understand the structural
properties of crystalline material. In lieu of SCXRD data, structural information for
co-crystals of the type [Ru(bipy)3][NaCrxFe1-x(ox)3] was ascertained using PXRD by
comparing the powder pattern with patterns simulated from SCXRD data of the other
systems. Powder patterns were also collected for [NixRu1-x(bipy)3][NaCr(ox)3],
[Ni(bipy)3]x[Ru(phen)3]1-x[NaCr(ox)3] and [Ni(phen)3]x[Ru(bipy)3]1-x[NaCr(ox)3]
co-crystals.
Figure 75 shows the PXRD patterns of co-crystals indexed against a pattern
simulated from SCXRD data collected from a [Ni0.50Ru0.50(bipy)3][NaCr(ox)3] single
co-crystal. The similarity between all of the experimental patterns shown in Figure
75 indicate that the co-crystals from these experiments form isomorphous structures.
There are no additional peaks observed for the experimental patterns when compared
to the simulated trace. This is a strong indicator that all of the co-crystals form with
the same structure i.e. no evidence of phase impurities. Detailed X-Ray data for the
various systems are discussed in the corresponding sections within this chapter.
Co-crystals resulting from solutions containing [Ni(phen)3]2+
, [Ru(phen)3]2+
and
[Cr(ox)3]3-
(system 3) and solutions containing [Ru(phen)3]2+
, [Cr(ox)3]3-
and
[Fe(ox)3]3-
(system 4) diffracted poorly. This was due to physical deterioration likely
caused by dehydration when the co-crystals were removed from the mother liquor.365
Consequently, diffraction data for co-crystals resulting from these systems were not
collected.
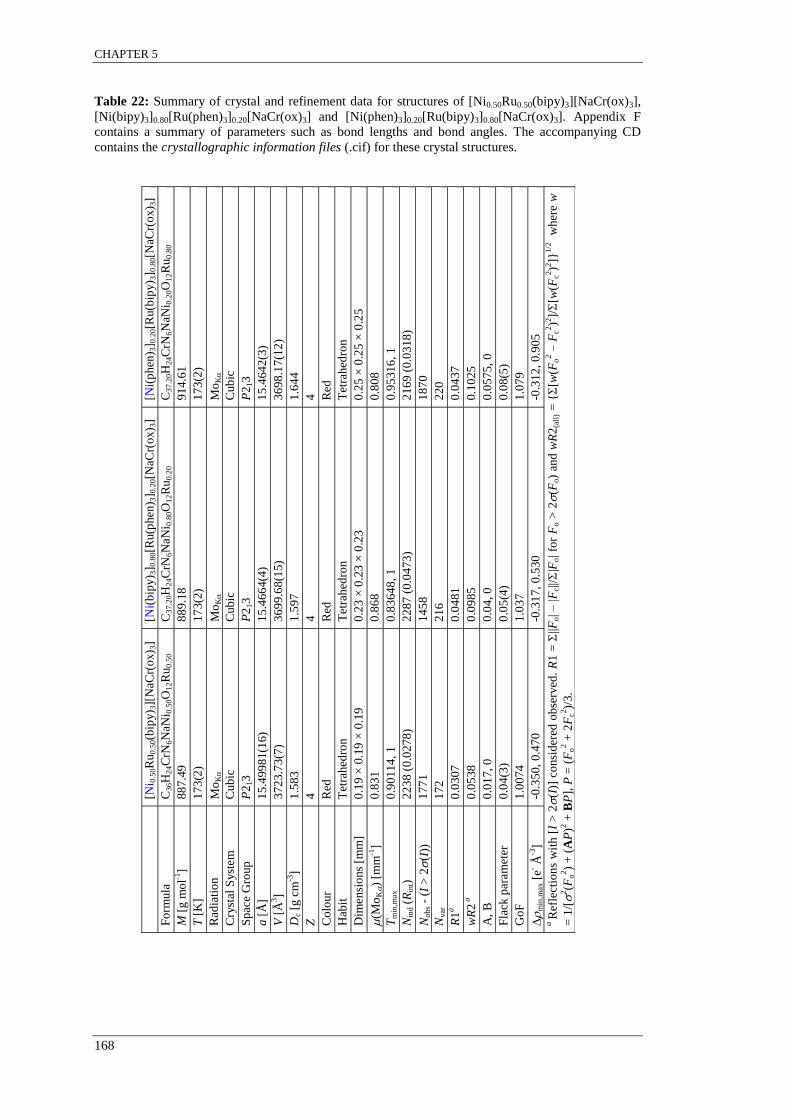
CHAPTER 5
168
Table 22: Summary of crystal and refinement data for structures of [Ni0.50Ru0.50(bipy)3][NaCr(ox)3],
[Ni(bipy)3]0.80[Ru(phen)3]0.20[NaCr(ox)3] and [Ni(phen)3]0.20[Ru(bipy)3]0.80[NaCr(ox)3]. Appendix F
contains a summary of parameters such as bond lengths and bond angles. The accompanying CD
contains the crystallographic information files (.cif) for these crystal structures.
Dgfs
hfd
hgdja
j
D
hja
juhta
jtaj
tr
[N
i 0.5
0R
u0
.50(b
ipy) 3
][N
aCr(
ox) 3
] [N
i(b
ipy) 3
] 0.8
0[R
u(p
hen
) 3] 0
.20[N
aCr(
ox) 3
]
[Ni(
phen
) 3] 0
.20[R
u(b
ipy) 3
] 0.8
0[N
aCr(
ox) 3
]
Fo
rmula
C
36H
24C
rN6N
aNi 0
.50O
12R
u0
.50
C
37
.20H
24C
rN6N
aNi 0
.80O
12R
u0
.20
C
37
.20H
24C
rN6N
aNi 0
.20O
12R
u0
.80
M [
g m
ol-1
] 8
87
.49
88
9.1
8
91
4.6
1
T [
K]
17
3(2
) 1
73
(2)
17
3(2
)
Rad
iati
on
M
oK
M
oK
Mo
K
Cry
stal
Syst
em
C
ub
ic
Cub
ic
Cub
ic
Sp
ace
Gro
up
P
213
P2
13
P2
13
a [
Å]
15
.499
81(1
6)
15
.466
4(4
) 1
5.4
64
2(3
)
V [
Å3]
37
23
.73
(7)
36
99
.68
(15
) 3
69
8.1
7(1
2)
Dc
[g c
m-3
] 1
.58
3
1.5
97
1.6
44
Z
4
4
4
Co
lour
Red
R
ed
Red
Hab
it
Tet
rahed
ron
Tet
rahed
ron
Tet
rahed
ron
Dim
ensi
ons
[mm
] 0
.19
× 0
.19
× 0
.19
0
.23
× 0
.23
× 0
.23
0
.25
× 0
.25
× 0
.25
(M
oK)
[mm
-1]
0.8
31
0.8
68
0.8
08
Tm
in,m
ax
0.9
011
4, 1
0
.83
64
8, 1
0
.95
31
6, 1
Nin
d (
Rin
t)
22
38
(0
.02
78
) 2
28
7 (
0.0
473
) 2
16
9 (
0.0
318
)
No
bs
- (I
> 2
(I))
1
77
1
14
58
18
70
Nvar
1
72
21
6
22
0
R1
a
0.0
307
0.0
481
0.0
437
wR
2 a
0.0
538
0.0
985
0.1
025
A,
B
0.0
17,
0
0.0
4, 0
0.0
575
, 0
Fla
ck p
aram
eter
0
.04
(3)
0.0
5(4
) 0
.08
(5)
Go
F
1.0
074
1.0
37
1.0
79
min
,max
[e- Å
-3]
-0.3
50
, 0.4
70
-0.3
17
, 0.5
30
-0.3
12
, 0.9
05
a R
efle
ctio
ns
wit
h [
I >
2
(I)]
co
nsi
der
ed o
bse
rved
. R
1 =
||F
o| –
|F
c||/
|Fo| fo
r F
o >
2
(Fo)
and
wR
2(a
ll)
= {
[w(F
o2 –
Fc2
)2]/
[w(F
c2)2
]}1
/2
wher
e w
= 1
/[
2(F
o2)
+ (
AP
)2 +
BP
], P
= (
Fo
2 +
2F
c2)/
3.

CHAPTER 5
169
Figure 75: PXRD patterns of co-crystals from systems 1, 2, 5, 6 (reading down) that were collected at
room temperature indexed against a simulated powder pattern collected from a
[Ni0.50Ru0.50(bipy)3][NaCr(ox)3] single co-crystal at 173K.
0
5000
10000
15000
20000
25000
5 10 15 20 25 30
PXRD: [MII(L)3][NaMIII(ox)3] frameworks
Simulated from SCXRD of
[Ni0.50Ru0.50(bipy)3][NaCr(ox)3]
(P213)
[NixRu1-x(bipy)3][NaCr(ox)3]
111
210
211
221
400411
Position [ 2θ (Cu)]5 10 15 20 25 30
Co
un
ts
[Ru(bipy)3][NaCrxFe1-x(ox)3]
[Ni(bipy)3]x[Ru(phen)3]1-x[NaCr(ox)3]
[Ni(phen)3]x[Ru(bipy)3]1-x[NaCr(ox)3]

CHAPTER 5
170
5.2.3 [NixRu1-x(bipy)3][NaCr(ox)3] (system 1)
Crystalline material was first observed four days after the initial mixing of the
various aqueous solutions listed in Table 20. Co-crystallisation was stopped at two
weeks after mixing, at which time the mother liquor was observed to be slightly
tinged with red, likely due to free [Ru(bipy)3]2+
in solution. These observations were
consistent for all of the replicate experiments attempted.
It is sometimes possible in systems where the pure compounds differ in colour or
habit to qualitatively assess the success or failure of co-crystallisation through simple
observation. The pure compound [Ru(bipy)3][NaCr(ox)3] crystallises as deep red
tetrahedra, while the nickel analogue, [Ni(bipy)3][NaCr(ox)3] crystallises as dichroic
pink/purple tetrahedra depending on the angle of view. The co-crystallisation of
[Ni(bipy)3]2+
with [Ru(bipy)3]2+
in the presence of [Cr(ox)3]3-
and NaCl produced
dark pink tetrahedral crystals of the formula [NixRu1-x(bipy)3][NaCr(ox)3]. Due to the
colour similarity between the co-crystals and the crystals of the pure compounds,
visual inspection was not a reliable screening technique to assess the success of
co-crystallisation. However, it is noteworthy that all of the co-crystals were red
indicating that no [Ni(bipy)3][NaCr(ox)3] crystals had formed.
The first attempt at synthesising these co-crystals produced a complicated and
intertwined mass of crystalline material. Figure 76 shows an SEM image taken of the
microcrystalline material formed from this first attempt.

CHAPTER 5
171
Figure 76: SEM image of intertwined mass of crystalline [NixRu1-x(bipy)3][NaCr(ox)3] co-crystals
(system 1). The areas outlined in red were analysed at close range due to their acceptable angle with
respect to the X-Ray beam.
Even though the crystals shown in Figure 76 were not single and most had an
undesirable orientation with respect to the X-ray beam, EDX analysis was carried out
on a few selected areas (outlined in red). Ideally, single crystal EDX spectra at high
magnification are measured on flat and smooth surfaces that are perpendicular to the
X-ray beam. Furthermore, analysis should be conducted on single crystals that have
well-defined edges. The surface angle with respect to the X-ray beam and the surface
topography influence the quantitative results from samples involving elements that
have spectral lines at low energy (< 4 keV) such as ruthenium (Lα and Lβ at 2.6 and
2.7 keV) (see Appendix A).
Therefore, due to the undesirable formation of these crystals, none of the EDX
results could be regarded as single crystal values. Regardless of their form, EDX
analysis of this sample was used to gather information regarding the composition of
the bulk material. Analysis at both close range and low magnification (bulk analysis)
yielded an average Ni:Ru ratio of ca. 0.50:0.50. Due to the quality of the co-crystals
obtained, this batch was not considered as part of the single crystal analysis for this
system but rather as a cursory test experiment. To encourage the formation of single
crystals, the vials containing the co-crystallising solutions for subsequent
experiments were allowed to stand completely undisturbed throughout the
experiment. Experiments for this particular system were repeated an additional time

CHAPTER 5
172
giving a total of four attempts, the last three of which produced single crystals with
well-defined edges and smooth surfaces. An SEM image of a single
[NixRu1-x(bipy)3][NaCr(ox)3] co-crystal is shown in Figure 77. The co-crystal in this
image is shown to be mounted upright to highlight the tetrahedral habit, however in
subsequent SEM-EDX sessions, co-crystals were mounted as inverted tetrahedra so
that a flat surface could be analysed.
Figure 77: SEM image of a representative [NixRu1-x(bipy)3][NaCr(ox)3] single co-crystal resulting
from the co-crystallisation of a 1:1:2 ratio of [Ni(bipy)3]2+
, [Ru(bipy)3]2+
and [Cr(ox)3]3-
in the
presence of NaCl (system 1). Most single co-crystals were found to have edges between 150-250 m
in length. The tetrahedra were observed to maintain their structural integrity under the vacuum,
exhibiting well-defined edges and smooth surfaces for the entire duration of the SEM-EDX session.
A representative EDX spectrum measured from a single co-crystal resulting from the
co-crystallisation of a 1:1:2 ratio of [Ni(bipy)3]2+
, [Ru(bipy)3]2+
and [Cr(ox)3]3-
in
the presence of NaCl (system 1) is shown in Figure 78. The raw atomic percentages
(At%) of the transition metals and their relative ratios are also shown. The co-crystal
from which this EDX spectrum was obtained was harvested from the same solution
as the co-crystal shown in Figure 77.

CHAPTER 5
173
Figure 78: EDX spectrum from a tetrahedral crystal with the formula [Ni0.49Ru0.51(bipy)3][NaCr(ox)3].
The blue shaded area highlights the presence of the Na Kα line at 1.1 keV. Quantitative EDX data for
the transition metals are shown as raw atomic percentages (At%).
The spectrum shown in Figure 78 exhibits peaks belonging to chromium (5.4 keV),
nickel (7.5 keV) and ruthenium (2.6 keV), indicating the presence of each respective
metal complex. The spectrum also shows nitrogen and oxygen peaks at 0.4 and 0.5
keV and a large carbon peak at 0.3 keV; the former two are attributed to the ligands
while the latter is caused by the carbon content in the ligands and in the
carbon-coating. A sodium peak at 1.1 keV is also observed.* Chlorine and potassium
peaks, which if present would occur at 2.6 and 3.3 keV respectively, are not
observed. The absence of potassium and chlorine peaks indicates that both K+ and
Cl- ions are left behind in the mother liquor. EDX spectra of the powder residues
resulting from the evaporated mother liquor show large peaks for both potassium and
chlorine (see Appendix B).
The quantitative EDX data reveal a Ni:Ru:Cr ratio of 1:1:2, which is consistent with
the ratio of the starting solution. Subsequent measurements from the same co-crystal
support this stoichiometry. The co-crystal represented by this EDX spectrum was one
of eleven co-crystals analysed from this batch (24 measurements). All spectral
characteristics discussed in relation to the spectrum in Figure 78 are applicable to the
spectra of the other co-crystals analysed from this batch and subsequent replicate
batches. This also applies to the quantitative EDX data as of all of the co-crystals
*The At% calculated for sodium is unreliable as the peak occurs at low energy and hence is influenced
by changes in the surface tilt with respect to the X-ray beam.
Formula
[Ni0.49Ru0.51(bipy)3][NaCr(ox)3]
Raw At% Solid Ratio
(Cr) 2.13 1
(Ni) 1.07 0.50
(Ru) 1.11 0.50
CHAPTER 5
174
yielded very similar results. The average (Ni+Ru):Cr ratio of single crystals for the
batch was consistently found to be 1:1 ((1.03 ± 0.03):1). Similarly, the mean nickel
xsolid value was calculated to be 0.47 ± 0.02 giving an average single crystal formula
of [Ni0.47Ru0.53(bipy)3][NaCr(ox)3]. The minimum and maximum nickel xsolid values
were found to be within two standard deviations of the mean at 0.43 and 0.52
respectively (refer to Table 21). The statistics for this system suggest that
xsolid ≈ xsolution with minimal to no supramolecular selection involved during the
synthesis of these co-crystals. This is in contrast to the previously studied
[NixRu1-x(bipy)3](PF6)2 molecular system, which was shown to display
supramolecular selection as indicated by the larger standard deviation
(0.51 ± 0.09).35,261
Since EDX is a surface technique, compositional homogeneity was examined by
measuring the EDX of a selection of crushed single co-crystals. The mean
(Ni+Ru):Cr ratio and nickel xsolid value for crushed single co-crystals were calculated
to be (1.00 ± 0.03):1 and 0.47 ± 0.02. These results are consistent with surface
measurements suggesting that co-crystals synthesised under these conditions, do so
without forming a concentration gradient. Due to the direct overlap of chlorine and
ruthenium peaks, the nickel xsolid values obtained from the solid residue resulting
from evaporating the solvent from the mother liquor are unreliable; however they do
suggest a final solution composition containing a 1:1 Ni:Ru ratio (0.54 ± 0.04).
Therefore, the results indicate that the composition of these co-crystals is largly
dependent on the composition of the solution and that the Ni:Ru ratio in solution
remains relatively unchanged, such that xsolution = xsolid at any point during
co-crystallisation.
It is interesting that [MII(bipy)3]
2+ complexes displayed significant supramolecular
selection during co-crystallisations that formed [NixRu1-x(bipy)3](PF6)2 co-crystals,
yet supramolecular selection for [NixRu1-x(bipy)3][NaCr(ox)3] co-crystals seems to be
almost negligible. A detailed discussion regarding the X-ray crystal structures for
[NixRu1-x(bipy)3](PF6)2 co-crystals has been published from research that was done
previously by the candidate.35 It was found that pairs of [MII(bipy)3]
2+ complexes in
[NixRu1-x(bipy)3](PF6)2 interact through a set of six EF π-interactions in much the
same way as for pure [MII(bipy)3](PF6)2 complexes. No such π-interactions are
CHAPTER 5
175
present between neighbouring [MII(bipy)3]
2+ complexes in any of the
[MII(bipy)3][NaCr(ox)3] structures listed in Table 19. Instead, [M
II(bipy)3]
2+
complexes in these structures occupy cavities formed by the anionic 3D polymeric
framework. X-ray diffraction data were collected for [NixRu1-x(bipy)3][NaCr(ox)3]
co-crystals in order to better comprehend the structural aspects of co-crystallisation.
Single crystal refinement data for the [Ni0.50Ru0.50(bipy)3][NaCr(ox)3] co-crystal are
provided in Table 22. A simulated pattern calculated from the single crystal data is
shown in Figure 75 and was used to index the experimental powder patterns shown.
The topology exhibited for the [Ni0.50Ru0.50(bipy)3][NaCr(ox)3] co-crystal shows a
chiral 3D arrangement where the formal [NaCr(ox)3]2-
units represent three
connecting nodes to form a 3-connected 10-gon (10, 3) framework. The structure for
this compound belongs to P213 space group and is isomorphous to the cubic
structures listed in Table 19. The unit cell parameters (a = 15.49981(16) Å,
V = 3723.73(7) Å3) are very similar to the parameters of the various pure structures
listed in Table 19 indicating that the dilution of the MII site does not greatly influence
the crystal packing.
There is a third of a formal [NaCr(ox)3]2-
unit i.e. one oxalato ligand bridging a Na+
and Cr3+
ion and a third of a [MII(bipy)3]
2+ molecule in the asymmetric unit. The
position of the metal centres in the [MII(bipy)3]
2+ molecule were modelled as a
disordered mixture of Ni and Ru and their relative occupancies were refined (with
fixed and equivalent displacement parameters) to be 0.47 Ni and 0.53 Ru. These
values are in very close agreement to those obtained by SEM-EDX results, which
showed that co-crystals of this type, formed from a solution containing an equimolar
ratio of [Ni(bipy)3]2+
and [Ru(bipy)3]2+
do so with nickel xsolid values close to 0.50.
When the relative occupancies were fixed at Ni 0.40 or Ni 0.60 prior to refinement,
only very minimal changes in the refinement residuals were observed. Therefore,
despite the electron density difference between Ni and Ru, simple refinement of
positional occupancy is not as reliable as the SEM-EDX technique to ascertain the
nickel xsolid concentration in these materials. Hence, the final refinement cycles were
conducted with the relative occupancies fixed at 0.50.
CHAPTER 5
176
Each oxalato ligand bridges adjacent Na+ and Cr
3+ ions in all three dimensions
resulting in a polymeric net consisting of connected helical strands (three connected
at each node). The [MII(bipy)3]
2+ cations are located within the voids produced by the
polymeric [NaCr(ox)3]2-
framework. Every [NaCr(ox)3]2-
subunit and [MII(bipy)3]
2+
molecule exhibits the same Δ-configuration. Spontaneous resolution during the
preparation of these types of materials when starting from racemic mixtures (such as
in this case) has been observed in previously reported structures due to the
templating effect of [MII(bipy)3]
2+. Some published structures report the presence of
water situated within cavities formed by three adjacent [MII(bipy)3]
2+ molecules; no
water was found within this structure despite containing a sufficient void volume of
314.5 Å3.
A comparison of the structures listed in Table 19 shows that the mean MII-N bond
lengths for [Ni(bipy)3]2+
guests are slightly longer at 2.088 Å than those for
[Ru(bipy)3]2+
guests (2.057 Å). The mean MII-N bond length found here, refined to
2.071(2) Å, approximately half-way between these two values. This length is slightly
longer than that found for the [NixRu1-x(bipy)3](PF6)2 system (2.066(2) Å).35 The
angle subtended at the MII site by the 2,2′-bipyridine ligand (bite angle) is 78.66(9)°.
Unlike the MII-N bond length, the bite angles for both complex species are very
similar; the angles for both types of complexes that are present in published
structures are clustered within a 1° range (78.39-79.39°). The distance between
Ni/Ru sites of neighbouring complexes was found to be 9.492 Å.
The mean Cr-O bond length present in this framework is refined to 1.968(2) Å, while
the average Na-O length is longer at 2.333(2) Å. These values are consistent with
bond lengths found for previously reported structures (Table 19) containing the
[NaCr(ox)3]2-
unit (average Cr-O = 1.965 Å, average Na-O = 2.336 Å). The O-Cr-O
bite angle is 83.50(8)°, while the angle subtended at the Na site is 74.11(7)°;
accounting for the uncertainty in the last decimal place, both values fall within the
ranges observed for literature compounds (83.27- 83.82 for O-Cr-O and 72.55-74.08
for O-Na-O). The [100] projections showing the host anionic net and the
[MII(bipy)3]
2+ guests are shown in Figure 79.

CHAPTER 5
177
Figure 79: [100] projection of {Δ-[NaCr(ox)3]2-
}n (left) and Δ-[Ni0.50Ru0.50(bipy)3]2+
(right) for the
Δ-[Ni0.50Ru0.50(bipy)3][NaCr(ox)3] compound.
Both the formal [NaCr(ox)3]2-
units and the [MII(bipy)3]
2+ cations possess D3 point
symmetry. A perfectly octahedral tris-bidentate complex, when viewed along its C3
axis, displays two perfectly staggered equilateral triangles (twist angle, Φ = 60°) of
sides s separated by a distance h (h = (2/3)1/2
s).* An s/h ratio greater than 1.22
describes a compressed octahedral geometry while those that are lower describe
elongated complexes (see Figure 80).366 The geometry around each metallic site for
the cubic structures listed in Table 19 can be described as trigonally distorted and
compressed octahedra; the MI sites are observed to exhibit the greatest distortion.
Figure 80: Diagram highlighting how one donor atom from each ligand is used to create the triangular
faces from, which the centroids are calculated in a tris-bidentate octahedral metal complex (far left).
The relationship between the two faces, defined by the twist angle, Φ is shown in the central
schematic; while the s and h parameters for regular octahedra are shown on the far right.
*The twist angle (Φ), is calculated by first creating centroids using donor oxygen (oxalato ligand) or
nitrogen (2,2′-bipyridine ligand) atoms from opposite triangular faces of the octahedron. The twist is
defined as the torsion angle between donor atoms from the same ligand through the centroids. The
length of the side (s) is the average distance between adjacent donor atoms from the same triangular
face while the height (h) is taken as the distance between the centroids.
MO
O O
O
O
O
Φ = 60°
h
s
≡90°
MO
O O
O
O
O
MO
O O
O
O
O
Φ = 60°Φ = 60°
h
s
h
s
≡90°

CHAPTER 5
178
The [Ni0.50Ru0.50(bipy)3]2+
guest complex in [Ni0.50Ru0.50(bipy)3][NaCr(ox)3] may be
described by a twist angle of 49.69° and an s/h ratio of 1.41 (s = 3.058 Å (mean
value), h = 2.165 Å). These values correspond to a trigonally twisted and
compressed octahedron. Despite the shared occupancy of the metal centre within the
guest [MII(bipy)3]
2+ complex, all geometric attributes bar the mean M
II-N bond
length are comparable to [MII(bipy)3]
2+ guests in the cubic frameworks shown in
Table 19 (MII = Ni, Ru).
The Cr3+
and Na+ environments in the [NaCr(ox)3]
2- fragment possess twist angles
of 53.24° and 45.83° respectively. Both complex fragments can be described as
compressed octahedra with s/h ratios of 1.31 for the chromium-centred complex and
1.50 for the Na+. These twist angles and s/h ratios indicate a greater twist and
compression distortion at the sodium-centred fragment than that present at the
chromium counterpart. All parameters regarding the [NaCr(ox)3]2-
polymeric net are
congruent with those for literature structures. A summary of bond lengths and angles
are provided in Appendix F.
The experimental powder pattern of [NixRu1-x(bipy)3][NaCr(ox)3] is shown in Figure
75 (red trace) directly below the simulated pattern generated from the single crystal
data. The positions and relative intensities of peaks in the experimental pattern agree
well with the profile of the simulated trace. Firstly, this indicates that the single
crystal simulation is representative of the bulk phase and that only one phase is
present in the bulk sample. The similarities in the relative intensities of peaks
between the two patterns also signify that preferred orientation, which is a common
issue for highly crystalline samples prepared as thin films such as this one is not a
factor here. Furthermore, the similarity of the powder pattern to the simulation
indicates that the phase and unit cell dimensions remain relatively constant between
room temperature and 173 K.
Qualitatively, the peaks in the experimental pattern appear to be narrow. The full
width at half maximum (FWHM) of the peaks do not appear to be significantly large
with values between 0.0836 and 0.1171°2θ. For example, the [210] reflection at
around 12.8°2θ, which is the most intense peak in this pattern has a FWHM of
0.1004°2θ.

CHAPTER 5
179
This is interesting because peak broadening has been observed for systems that
displayed supramolecular selection such as [NixRu1-x(bipy)3](PF6)2.35,261 It was found
that [Ni(bipy)3](PF6)2 single crystals had slightly larger unit cells than
[Ru(bipy)3](PF6)2. SCXRD was collected for several single co-crystals of the type
[NixRu1-x(bipy)3](PF6)2 grown from a 0.50:0.50 solution and each had a slightly
different set of unit cell parameters (all the same phase). This was not surprising
since each had different ratios of Ni:Ru as ascertained by SEM-EDX. Therefore, it
was postulated that the collected powder patterns were an overlay of several patterns
each with only slight differences in peak positions resulting in broadening due to
peak coalescence. The absence of broad peaks for [NixRu1-x(bipy)3][NaCr(ox)3]
provides further evidence that composition of the co-crystals is dependent on the
composition of the solution and therefore the entire batch of crystals can be
represented as [Ni0.50Ru0.50(bipy)3][NaCr(ox)3] instead of
[NixRu1-x(bipy)3][NaCr(ox)3].
5.2.4 [Ru(bipy)3][NaCrxFe1-x(ox)3] (system 2)
The pure compounds [Ru(bipy)3][NaCr(ox)3] and [Ru(bipy)3][NaFe(ox)3] both
crystallise as deep red tetrahedra as does the co-crystal compound
[Ru(bipy)3][NaCrxFe1-x(ox)3]. Due to the similarity between the co-crystals and the
crystals of the pure compounds, visual inspection was not utilised to assess the
success of co-crystallisation. Crystalline material was first observed four days after
the initial mixing of the various aqueous solutions listed in Table 20.
Co-crystallisation was stopped at two weeks after mixing, at which time the mother
liquor was observed to be slightly tinged with red, likely due to a small amount of
free [Ru(bipy)3]2+
in solution. These observations were consistent for all of the
replicate experiments attempted.
The vial containing the solutions for the first attempt at synthesising
[Ru(bipy)3][NaCrxFe1-x(ox)3] co-crystals was disturbed during the co-crystallisation
period. As a result, many of the crystals that formed were not single. Figure 81
shows an SEM image taken of the crystalline material formed from this first attempt.

CHAPTER 5
180
Figure 81: SEM image of crystalline [Ru(bipy)3][NaCrxFe1-x(ox)3] (system 2). The areas outlined in
red were analysed at close range due to their acceptable angle with respect to the X-Ray beam. The
area outlined in blue highlights an area that was overexposed to the X-ray beam during close range
analysis by EDX resulting in slight surface erosion (after a live time of 60 seconds).
None of the EDX results from this batch were treated as single crystal values.
However, analysis at both close range and low magnification (bulk analysis) yielded
an average Cr:Fe ratio of ca. 0.60:0.40. Experiments for this particular system,
starting with a solution containing an equimolar ratio of [Cr(ox)3]3-
and [Fe(ox)3]3-
were repeated an additional time giving a total of four attempts; three of which
produced single crystals with well-defined edges and smooth surfaces that closely
resembled the [Ni0.50Ru0.50(bipy)3][NaCr(ox)3] co-crystal that is shown in Figure 73
(a) and Figure 77).
This system involves the dilution of the trivalent metal centre in the anionic
tris-oxalato complex. The metal dilution component of this experiment can be
likened to the K3[CrxFe1-x(ox)3] system (discussed in Section 5.2.1), which was found
to yield co-crystals that contained concentration gradients prompted most likely by
solubility differences between the two [MIII
(ox)3]3-
complexes. A representative
spectrum taken from a [Ru(bipy)3][NaCrxFe1-x(ox)3] co-crystal is shown in Figure 82.
The raw atomic percentages (At%) of the transition metals and their relative ratios
are included as insets.

CHAPTER 5
181
Figure 82: EDX spectrum from a tetrahedral [Ru(bipy)3][NaCr0.59Fe0.41(ox)3] co-crystal. The blue
shaded areas highlight the position of the Na Kα line at 1.1 keV. Quantitative EDX data for the
transition metals are given as atomic percentages (At%).
The spectrum shown in Figure 82 shows peaks belonging to chromium, iron (6.4
keV) and ruthenium, which are all attributed to the presence of the respective metal
complexes. The low energy area of the spectrum between 0-1.5 keV closely
resembles that of the [NixRu1-x(bipy)3][NaCr(ox)3]. Chlorine and potassium peaks are
also not observed in the spectra for co-crystals of these systems. EDX spectra of the
powder residues resulting from the evaporated mother liquor show large peaks for
both potassium and chlorine (see Appendix B).
The quantitative EDX data, which are shown as an inset in Figure 82 gives a
Ru:(Cr+Fe) ratio of 1:1 (1.04:1) and a Cr:Fe ratio of 0.60:0.40 (chromium
xsolid = 0.59) for this particular co-crystal. Subsequent measurements from the same
co-crystal gave very similar results. Multiple EDX measurements of other single
co-crystals in this batch (8 co-crystals and 18 measurements) averaged a surface
Ru:(Cr+Fe) ratio of 1:1 ((1.09 ± 0.06):1) and a chromium xsolid value of 0.58 ± 0.01.
The minimum and maximum chromium xsolid values were found to be within two
standard deviations of the mean at 0.57 and 0.60 respectively (refer to Table 21). As
EDX is a surface technique (reaching depths ca. 5-6 µm), selected single co-crystals
that were previously analysed at the surface were crushed and carbon-coated to test
for the presence of a concentration gradient. The mean Ru:(Cr+Fe) ratio and
chromium xsolid value for crushed single co-crystals were calculated to be 1.00 ±
Formula
[Ru(bipy)3][NaCr0.59Fe0.41(ox)3]
Raw At% Solid Ratio
(Cr) 1.22 0.60
(Fe) 0.86 0.40
(Ru) 2.16 1
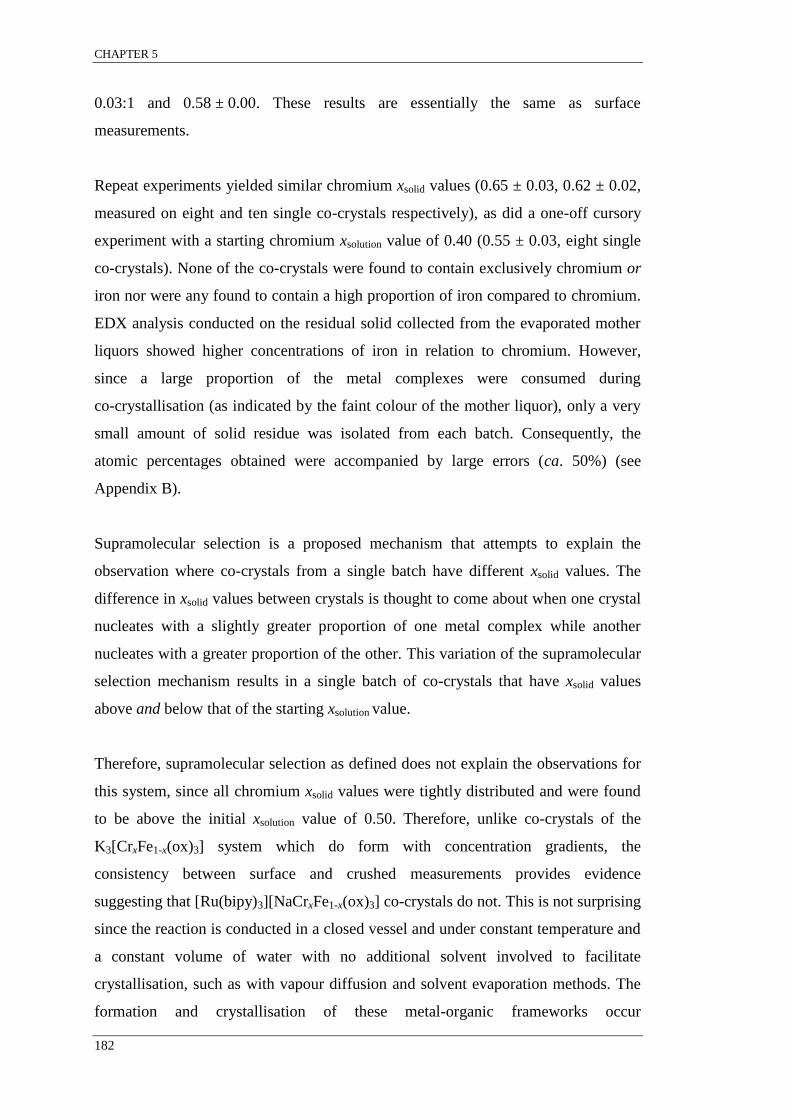
CHAPTER 5
182
0.03:1 and 0.58 ± 0.00. These results are essentially the same as surface
measurements.
Repeat experiments yielded similar chromium xsolid values (0.65 ± 0.03, 0.62 ± 0.02,
measured on eight and ten single co-crystals respectively), as did a one-off cursory
experiment with a starting chromium xsolution value of 0.40 (0.55 ± 0.03, eight single
co-crystals). None of the co-crystals were found to contain exclusively chromium or
iron nor were any found to contain a high proportion of iron compared to chromium.
EDX analysis conducted on the residual solid collected from the evaporated mother
liquors showed higher concentrations of iron in relation to chromium. However,
since a large proportion of the metal complexes were consumed during
co-crystallisation (as indicated by the faint colour of the mother liquor), only a very
small amount of solid residue was isolated from each batch. Consequently, the
atomic percentages obtained were accompanied by large errors (ca. 50%) (see
Appendix B).
Supramolecular selection is a proposed mechanism that attempts to explain the
observation where co-crystals from a single batch have different xsolid values. The
difference in xsolid values between crystals is thought to come about when one crystal
nucleates with a slightly greater proportion of one metal complex while another
nucleates with a greater proportion of the other. This variation of the supramolecular
selection mechanism results in a single batch of co-crystals that have xsolid values
above and below that of the starting xsolution value.
Therefore, supramolecular selection as defined does not explain the observations for
this system, since all chromium xsolid values were tightly distributed and were found
to be above the initial xsolution value of 0.50. Therefore, unlike co-crystals of the
K3[CrxFe1-x(ox)3] system which do form with concentration gradients, the
consistency between surface and crushed measurements provides evidence
suggesting that [Ru(bipy)3][NaCrxFe1-x(ox)3] co-crystals do not. This is not surprising
since the reaction is conducted in a closed vessel and under constant temperature and
a constant volume of water with no additional solvent involved to facilitate
crystallisation, such as with vapour diffusion and solvent evaporation methods. The
formation and crystallisation of these metal-organic frameworks occur

CHAPTER 5
183
simultaneously. The geometric dimensions of [Cr(ox)3]3-
and [Fe(ox)3]3-
in these
types of structures are very similar with parameters such as MIII
-O bond lengths and
bite angles only varying by ca. 1.5%.65,290,340 However minute these differences, the
findings under these reaction conditions imply that [Cr(ox)3]3-
is slightly more
energetically favoured over [Fe(ox)3]3-
during the formation of the
[Ru(bipy)3][NaCrxFe1-x(ox)3] metal-organic framework.
SCXRD data were not collected for this system as the electron densities of Fe3+
and
Cr3+
are very similar to one another. Structural information was instead gauged using
PXRD data. The experimental powder pattern for [Ru(bipy)3][NaCrxFe1-x(ox)3]
co-crystals is shown in Figure 75 (green trace). The positions, relative intensities of
peaks and the FWHM in the experimental pattern are almost identical to the
experimental [Ni0.50Ru0.50(bipy)3][NaCr(ox)3] pattern indicating the formation of an
isomorphous structure consistent throughout the bulk sample. Although SCXRD data
were not collected for this system, a phase change between room temperature and
173 K is unlikely given the similarity of the pattern to the
[Ni0.50Ru0.50(bipy)3][NaCr(ox)3] simulated trace.
5.2.5 Homoleptic cationic and anionic metal dilutions involving [MII
(phen)3]2+
and [MIII
(ox)3]3-
(systems 3 and 4)
Both the cationic and anionic metal dilution experiments of [MII(phen)3]
2+ and
[MIII
(ox)3]3-
in the presence of NaCl (1:1:2 ratio) produced red rectangular prismatic
co-crystals. Compounds obtained from the crystallisation of [Ru(phen)3]2+
with
either [Cr(ox)3]3-
or [Fe(ox)3]3-
and [Ni(phen)3]2+
with [Cr(ox)3]3-
in the presence of
NaCl produced red and dark pink rectangular prism shaped crystals respectively. It
was therefore difficult to use visual inspection as a means to qualitatively screen for
co-crystallisation. Co-crystals for both systems began to form one week after the
initial mixing of the various solutions listed in Table 20. Co-crystallisation was
stopped two weeks after mixing, at which time, the mother liquor was observed to be
of the same colour and intensity as the starting solution. On average, only a few
co-crystals had formed per batch in comparison to batches of

CHAPTER 5
184
[MII(bipy)3][NaM
III(ox)3]. All co-crystals appeared to have well-defined edges and
lustrous surfaces.
The co-crystals that formed, were found to be unstable and decomposed to a powder
shortly after removal from the mother liquor. The characterisation protocol was
altered to accommodate this complication. Instead of viewing the crystals under the
microscope while placed on slides, the crystals were visually examined while still
immersed in the mother liquor. Several attempts were made to collect both single
crystal and powder XRD data for these crystals; all attempts resulted in the collection
of very poor data. Consequently, XRD was omitted from the protocol for the
remaining replicates and hence no structural data are available for these systems.
SEM-EDX was the only characterisation technique performed for co-crystals
resulting from these systems.
Analysis of single crystals was achieved by transferring the crystals (via pipette, one
at a time) directly onto the aluminium stubs, bypassing viewing under the optical
microscope. Once adhered to the carbon tape, the crystals were quickly washed with
water to remove the residual mother liquor (via pipette) then carbon-coated.
SEM-EDX analysis was limited to only a few minutes. Despite the precautions
taken, all of the crystals appeared to be physically weathered within moments of
analysis. An SEM image of a rectangular prismatic crystal formed by the
co-crystallisation of a 1:1:2 ratio of [Ni(phen)3]2+
, [Ru(phen)3]2+
and [Cr(ox)3]3-
in
the presence of NaCl (system 3) is shown in Figure 83.

CHAPTER 5
185
Figure 83: SEM image of a single co-crystal formed by the co-crystallisation of a 1:1:2 ratio of
[Ni(phen)3]2+
, [Ru(phen)3]2+
and [Cr(ox)3]3-
in the presence of NaCl (system 3). All rectangular
prismatic crystals were observed to structurally deteriorate under the SEM vacuum.
Figure 84 showcases representative EDX spectra measured from two single
co-crystals resulting from the co-crystallisations of [MII(phen)3]
2+ and [M
III(ox)3]
3-
in the presence of NaCl (experiment types 3 and 4). Within each spectrum, the
solution compositions with respect to the metal complexes are shown in addition to
the raw EDX data, which are given as atomic percentages (At%) of the transition
metals present in the solid state. Relative ratios involving MII and M
III and associated
complexes present in both the solution and solid states are also shown.

CHAPTER 5
186
Figure 84: EDX spectra collected from rectangular prism shaped crystals grown from solutions
containing [MII(phen)3]
2+ and [M
III(ox)3]
3- in the presence of NaCl. The starting solution for the
cationic metal dilution experiment (a) contained a 1:1:2 ratio of [Ni(phen)3]2+
, [Ru(phen)3]2+
, and
[Cr(ox)3]3-
. The anionic metal dilution experiment (b) had a 2:1:1 ratio of [Ru(phen)3]2+
, [Cr(ox)3]3-
,
and [Fe(ox)3]3-
in the starting solution. The blue shaded areas at 1.1 keV highlight the position of the
Na (K) line. Atomic percentages for the transition metals (At%) are given as insets within each
spectrum.
Complex Solution Ratio
[Ni(phen)3]2+ 0.50
[Ru(phen)3]2+ 0.50
[Cr(ox)3]3- 1
Raw At% Solid Ratio
(Cr) 0.92 1
(Ni) 0.70 0.75
(Ru) 0.68 0.75
(a)
Complex Solution Ratio
[Ru(phen)3]2+ 1
[Cr(ox)3]3- 0.50
[Fe(ox)3]3- 0.50
Raw At% Solid Ratio
(Cr) 0.66 0.40
(Fe) 0.83 0.60
(Ru) 2.28 1.50
(b)

CHAPTER 5
187
The spectrum shown in Figure 84 (a) is very similar to that shown in Figure 78
([NixRu1-x(bipy)3][NaCr(ox)3]), while the spectrum shown in Figure 84 (b) closely
resembles the spectrum shown in Figure 82 ([Ru(bipy)3][NaCrxFe1-x(ox)3]). Each
spectrum exhibits peaks that are associated with the metal complexes that were
present in solution, namely, Ni (K), Ru (Lβ) and Cr (K) peaks in the upper spectrum
(a) and Ru (Lβ), Cr (K) and Fe (K) peaks for the lower (b). As with previous
systems of the type [MII(bipy)3][NaM
III(ox)3] that were discussed, both of the spectra
in Figure 84 do not have peaks associated with potassium and chlorine. However,
unlike these previously discussed systems, peaks associated with sodium at 1.1 keV
are absent from these spectra (blue shaded areas). EDX of the solid residue obtained
by evaporating the solvent from the mother liquor found sodium, potassium and
chlorine in abundance. This is strong evidence to conclude that the crystals formed
from these solutions do so without incorporating any sodium or potassium. The
absence of a monocation within these crystals forbids a 1:1 stoichiometric
relationship between [MII(phen)3]
2+ and [M
III(ox)3]
3- in the solid state, given the
necessary charge balance required between the two ionic species. This finding
indicates that the formation of a framework polymer is improbable.
The quantitative EDX data generated from the spectrum in Figure 84 (a) yields a
(Ni+Ru):Cr ratio of about 1.5:1 and a Ni:Ru ratio close to 1:1 (nickel xsolid = 0.51).
Measurements from different areas on the same co-crystal yielded similar values.
The ratios obtained and the charges of the metal complexes in solution suggest the
formation of co-crystals with the formula [Ni0.50Ru0.50(phen)3]3[Cr(ox)3]2. Similar
compounds with the general formula [MII(phen)3]3[M
III(ox)3]2·xH2O have been
previously reported, synthesised by the simple stoichiometric mixing of aqueous
solutions containing [MII(phen)3]
2+ and [M
III(ox)3]
3-. Hydration of these materials is
described by the authors as “extensive”; where consistent values via elemental
microanalysis were only possible when the crystals were allowed to dry. The authors
report dried formulae of [MII(phen)3]3[M
III(ox)3]2·15H2O.365
A total of eleven co-crystals were measured from this batch (23 measurements), all
exhibiting similar EDX spectral profiles and data. The relative ratios between the
various transition metals were found to be consistent across all eleven co-crystals.
The mean (Ni+Ru):Cr ratio for single crystals in this batch was found to be

CHAPTER 5
188
1.55 ± 0.06:1. The mean nickel xsolid value was calculated to be 0.51 with a standard
deviation of 0.02. All xsolid values were found to be within two standard deviations of
the mean, with minimum and maximum values of 0.47 and 0.55 respectively (refer to
Table 21). The statistics for this system are akin to those for the
[NixRu1-x(phen)3](PF6)2 molecular system (0.50 ± 0.01).35,261 Based on these results,
the extent of supramolecular selection for this system is almost negligible given the
tight distribution of nickel xsolid values centred around 0.50.
Single crystal homogeneity was assessed using EDX measurements from crushed
single co-crystals. The EDX measurements from the crushed samples yielded a
(Ni+Ru):Cr ratio of (1.50 ± 0.09):1 and a nickel xsolid value of 0.49 ± 0.02. Both of
these values correspond well to those acquired from surface single crystals
measurements. This suggests the formation of co-crystals without concentration
gradients, likely due to the similar solubilities of the two [MII(phen)3]
2+ in water
under these conditions. Again, the nickel xsolid values measured from the residue
obtained from the evaporated mother liquor are unreliable due to the direct overlap of
chlorine and ruthenium peaks. However, EDX conducted on the residues suggest a
final solution composition containing a 1:1 Ni:Ru ratio (0.51 ± 0.02). All of the EDX
data collected from this system strongly indicate that the nickel content of the
co-crystal and by extension [Ni(phen)3]2+
, is dependent on the [Ni(phen)3]2+
(or
[Ru(phen)3]2+
) concentration in solution. These results are similar to those found for
the previously reported [Ni0.50Ru0.50(phen)3](PF6)2 molecular system.
The quantitative EDX data shown as an inset in Figure 84 (b) reveals a Ru:(Cr+Fe)
ratio of 1.53:1 and a Cr:Fe ratio close to 0.40:0.60 (chromium xsolid = 0.44).
Subsequent measurements from different areas on the same co-crystal yield similar
values indicating a homogeneous surface composition. A total of ten co-crystals were
measured from this batch, each in two areas giving rise to a total of 20
measurements. All of the EDX results were consistent with the featured spectrum in
Figure 84 (b). The mean Ru:(Cr+Fe) ratio for the batch was found to be
(1.67 ± 0.08):1, while the average chromium xsolid value in single crystals was
calculated to be 0.44 ± 0.02. All xsolid values were within three standard deviations of
the mean with minimum and maximum values of 0.38 and 0.47 respectively. Repeat
experiments consistently gave slightly lower chromium xsolid values (0.47 ± 0.01,

CHAPTER 5
189
0.48 ± 0.02, ten crystals measured from each). Chromium xsolid values taken from the
residue obtained by the evaporation of the mother liquor suggest a final solution
containing a higher proportion of chromium (0.62 ± 0.02). This is fitting since the
co-crystals that formed were found to be richer in iron.
The EDX measurements taken from the crushed samples yielded a chromium xsolid
value of 0.43 ± 0.01. This correlates well to the chromium xsolid value obtained from
surface measurements (0.44 ± 0.02). Therefore, unlike co-crystals of the
K3[CrxFe1-x(ox)3] system, which do form with concentration gradients, co-crystals
with the suspected formula [Ru(phen)3]3[CrxFe1-x(ox)3]2 have a homogeneous
composition. This result further asserts the conclusion made earlier that under these
conditions (i.e. constant temperature and water volume), [Cr(ox)3]3-
and [Fe(ox)3]3-
have very similar solubilities.
As with the [Ru(bipy)3][NaCrxFe1-x(ox)3] system, supramolecular selection (as
defined within this work) does not explain the observations made here, since all the
chromium xsolid values were below the initial xsolution value. The slightly biased
distribution of the xsolid values below 0.50, suggests a minor preference for [Fe(ox)3]3-
over [Cr(ox)3]3-
during the formation of these co-crystals. It is worth noting however,
that the xsolid values for this system favour [Fe(ox)3]3-
, whereas the xsolid values for the
[Ru(bipy)3][NaCrxFe1-x(ox)3] system favour [Cr(ox)3]3-
. The similarity between the
two crystallising environments suggests a bias created by a genuine preference for
one [MIII
(ox)3]3-
complex over the other during the formation of these compounds.
Again, it seems that a structural difference is being recognised beyond the point of
difference even when the variation imparts a very minute change to the overall shape
and size of the complex.
The Ru:(Cr+Fe) ratio of 1.49 ± 0.06:1 found for crushed co-crystals compares better
than the ratio of 1.67 ± 0.08:1 that was calculated from surface measurements due to
the stoichiometry needed to balance the charges between the cationic and anionic
complexes. It was mentioned earlier within this section that handling the rectangular
prism shaped crystals was problematic, likely due to dehydration. It is likely that
these factors largely contributed to the change in the surface topology during
analysis, transforming a flat and smooth surface into one that contained many flaws.

CHAPTER 5
190
Surface irregularities affect measurements of elements at the lower end of EDX
spectra, such as ruthenium (2.6 keV) in the much the same way as the tilt or slant of
a sample (see discussion regarding tilt). This known shortcoming of the EDX
technique together with the values obtained on crushed samples best explain the
overestimated ruthenium content in the surface measurements. Therefore, since the
crushed co-crystals are dehydrated and then powdered before being re-coated and
re-analysed, the possibility of structural changes during analysis is reduced.
Given the repeated exclusion of sodium from co-crystals resulting from this system,
experiments of both systems were repeated twice more (in addition to the triplicates);
once with a NaCl concentration of 0.04 M and once without any added NaCl. The
EDX results of the co-crystals resulting from the system containing the extra NaCl
closely resembled the EDX data of co-crystals formed from the triplicate
experiments. The experiment without added NaCl failed to produce any solid
material. The syntheses reported for the compounds [MII(phen)3]3[M
III(ox)3]2·15H2O,
do not include NaCl or any additional salt. The authors describe solutions twice as
concentrated as those described for this work but do not stipulate the quality of the
crystals that resulted, i.e. large single crystals or a microcrystalline product, nor do
they mention the duration of the experiment.365 This suggests that although sodium
and chloride are excluded from the co-crystals, one or both of these ions facilitate
and/or accelerate co-crystal formation in very dilute solutions.
5.2.6 [Ni(bipy)3]x[Ru(phen)3]1-x[NaCr(ox)3] (system 5) and
[Ni(phen)3]x[Ru(bipy)3]1-x[NaCr(ox)3] (system 6)
Unlike experiment types 1-4, which are described as homoleptic co-crystallisations,
experiment types 5 and 6 are described as different ligand co-crystallisation
experiments as they simultaneously attempted to co-crystallise [MII(bipy)3]
2+ with
[MII(phen)3]
2+ (M
II = Ni, Ru) in the presence of [Cr(ox)3]
3- and NaCl. Different
ligand experiments involving [MII(bipy)3]
2+ and [M
II(phen)3]
2+ with PF6
- as the
counterion have been attempted in previous projects but failed to produce single
co-crystals of homogeneous compositions. Instead, red/orange co-crystals were
observed where block-shaped crystals appeared to be penetrated by a rod-shaped

CHAPTER 5
191
crystal, such that the resulting complicated crystalline morphology resembled that of
a necklace.154 Secondary and backscattered SEM images of crystals obtained from a
previous experiment that were grown from a solution containing a 0.50:0.50 mixture
of [Ni(phen)3](PF6)2 and [Ru(bipy)3](PF6)2 are shown in Figure 85. SEM-EDX
analyses of blocks indicated a [Ni(phen)3](PF6)2 concentration of ca. 90% (i.e. 10%
[Ru(bipy)3](PF6)2), while the needles were found to contain ca. 90%
[Ru(bipy)3](PF6)2. Approximately equimolar ratios of both complexes were found at
the interface between the two crystal morphologies.261,306
Figure 85: SEM images of “necklace” co-crystals that were grown from a solution containing an
equimolar mixture of [Ru(bipy)3](PF6)2 and [Ni(phen)3](PF6)2 detected using secondary electrons (a
and b) and backscattered electrons (c and d). The upper images show a single well-defined block
shaped crystal penetrated by a needle; the lower images show a much more complicated morphology.
The backscattered images clearly show the contrast between ruthenium-rich/nickel-poor (bright) and
ruthenium poor/nickel rich (dark) areas.261,306
The EDX spectra of two single co-crystals, grown from solutions containing
equimolar concentration of both [MII(bipy)3]
2+ and [M
II(phen)3]
2+ (M
II = Ni or Ru)
are shown in Figure 86. The top spectrum (a) was obtained from a crystal grown
from a solution containing [Ni(bipy)3]2+
and [Ru(phen)3]2+
(experiment type 5); the
crystal from which the lower spectrum (b) was measured was grown from a solution
(b)
(a) (c)
(d)

CHAPTER 5
192
containing [Ni(phen)3]2+
and [Ru(bipy)3]2+
(experiment type 6). Both types of
crystals were grown in the presence of [Cr(ox)3]3-
and NaCl resulting in a solution
Ni:Ru:Cr:Na ratio of 0.50:0.50:1:2. All crystals resulting from these experiments
were red, of similar size and exhibited a tetrahedral crystal habit. The formula and
raw atomic percentages (At%) of the transition metals and their relative ratios are
included as insets in each spectrum.
Figure 86: EDX spectra measured from crystals grown from co-crystallisation types 5 (a) and 6 (b)
with the formula [Ni(bipy)3]0.80[Ru(phen)3]0.20[NaCr(ox)3] and
[Ni(phen)3]0.20[Ru(bipy)3]0.80[NaCr(ox)3] respectively. Note that in both spectra the peak intensity of
the metal associated with the [MII(phen)3]
2+ complex much less than for the peak associated with the
metal of the [MII(bipy)3]
2+ complex. Quantitative EDX data for the transition metals are given as
atomic percentages (Raw At%).
(b)
(a) Formula
[Ni(bipy)3]0.80[Ru(phen)3]0.20 [NaCr(ox)3]
Raw At% Solid Ratio
(Cr) 1.77 1
(Ni) 1.38 0.80
(Ru) 0.39 0.20
Formula
[Ni(phen)3]0.20[Ru(bipy)3]0.80 [NaCr(ox)3]
Raw At% Solid Ratio
(Cr) 1.83 1
(Ni) 0.36 0.20
(Ru) 1.46 0.80

CHAPTER 5
193
The two spectra shown in Figure 86 are very similar to one another in a qualitative
sense. They both contain peaks belonging to chromium, nickel and ruthenium,
indicating that each of the co-crystals contained [Cr(ox)3]3-
, [MII(bipy)3]
2+ and
[MII(phen)3]
2+. Furthermore, both spectra show evidence of sodium but neither
contains peaks attributed to chlorine or potassium. EDX spectra of the powder
residues resulting from the evaporated mother liquors show large peaks for both
potassium and chlorine (see appendix B).
The atomic percentages generated from both the upper and lower spectra shown in
Figure 86 give (Ni+Ru):Cr ratios close to 1:1. The nickel xsolid values of 0.78 (a) and
0.20 (b) suggest a strong bias towards the [MII(bipy)3]
2+ complex during
co-crystallisation. Subsequent measurements from different areas on these
co-crystals confirm these values, as do the measurements made from other
co-crystals within the respective batches. Mean (Ni+Ru):Cr ratios were found to be
1.06 ± 0.03:1 and 1.04 ± 0.04:1 for systems 5 and 6 respectively.
Multiple EDX measurements taken from nine [Ni(bipy)3]x[Ru(phen)3]1-x[NaCr(ox)3]
single co-crystals (18 measurements) averaged a surface nickel xsolid value of
0.77 ± 0.02. The minimum and maximum nickel xsolid values were found to be within
two standard deviations of the mean at 0.74 and 0.80 respectively. EDX analysis
conducted on twelve [Ni(phen)3]x[Ru(bipy)3]1-x[NaCr(ox)3] single co-crystals (25
measurements) revealed a mean nickel xsolid value of 0.20 ± 0.03. All nickel xsolid
values for this system were within one standard deviation of the mean with minimum
and maximum values calculated to be 0.18 and 0.23 respectively. Statistical data for
both systems are summarised in Table 21.
The nickel xsolid values calculated for co-crystals of both systems suggest that under
these conditions, the inclusion of [MII(bipy)3]
2+ complexes are favoured over
[MII(phen)3]
2+ in the solid state by a ratio of 4:1. All three triplicate
co-crystallisations (nickel xsolution of 0.50) for both of these systems yielded the same
4:1 ratio between [MII(bipy)3]
2+ and [M
II(phen)3]
2+. No co-crystals were found to
exclusively contain nickel or ruthenium. Supramolecular selection as defined earlier
does not explain these observations, since all nickel xsolution values were tightly
distributed around 0.80 for [Ni(bipy)3]x[Ru(phen)3]1-x[NaCr(ox)3] (system 5) and
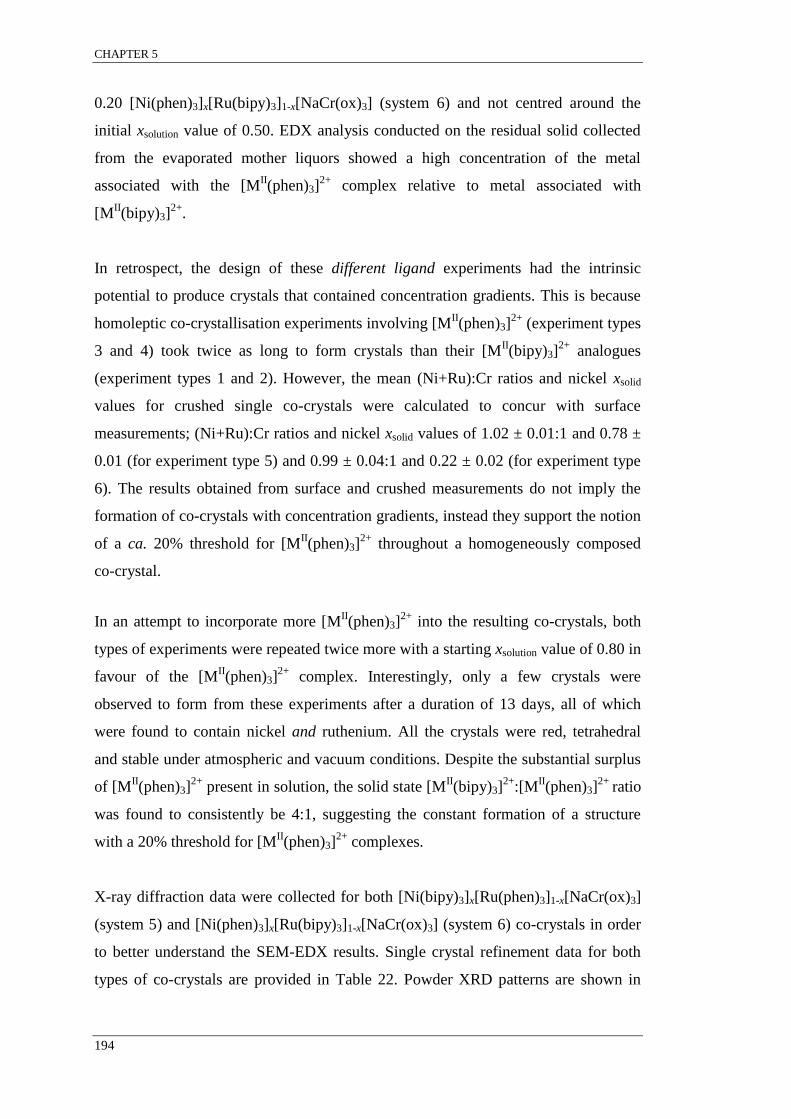
CHAPTER 5
194
0.20 [Ni(phen)3]x[Ru(bipy)3]1-x[NaCr(ox)3] (system 6) and not centred around the
initial xsolution value of 0.50. EDX analysis conducted on the residual solid collected
from the evaporated mother liquors showed a high concentration of the metal
associated with the [MII(phen)3]
2+ complex relative to metal associated with
[MII(bipy)3]
2+.
In retrospect, the design of these different ligand experiments had the intrinsic
potential to produce crystals that contained concentration gradients. This is because
homoleptic co-crystallisation experiments involving [MII(phen)3]
2+ (experiment types
3 and 4) took twice as long to form crystals than their [MII(bipy)3]
2+ analogues
(experiment types 1 and 2). However, the mean (Ni+Ru):Cr ratios and nickel xsolid
values for crushed single co-crystals were calculated to concur with surface
measurements; (Ni+Ru):Cr ratios and nickel xsolid values of 1.02 ± 0.01:1 and 0.78 ±
0.01 (for experiment type 5) and 0.99 ± 0.04:1 and 0.22 ± 0.02 (for experiment type
6). The results obtained from surface and crushed measurements do not imply the
formation of co-crystals with concentration gradients, instead they support the notion
of a ca. 20% threshold for [MII(phen)3]
2+ throughout a homogeneously composed
co-crystal.
In an attempt to incorporate more [MII(phen)3]
2+ into the resulting co-crystals, both
types of experiments were repeated twice more with a starting xsolution value of 0.80 in
favour of the [MII(phen)3]
2+ complex. Interestingly, only a few crystals were
observed to form from these experiments after a duration of 13 days, all of which
were found to contain nickel and ruthenium. All the crystals were red, tetrahedral
and stable under atmospheric and vacuum conditions. Despite the substantial surplus
of [MII(phen)3]
2+ present in solution, the solid state [M
II(bipy)3]
2+:[M
II(phen)3]
2+ ratio
was found to consistently be 4:1, suggesting the constant formation of a structure
with a 20% threshold for [MII(phen)3]
2+ complexes.
X-ray diffraction data were collected for both [Ni(bipy)3]x[Ru(phen)3]1-x[NaCr(ox)3]
(system 5) and [Ni(phen)3]x[Ru(bipy)3]1-x[NaCr(ox)3] (system 6) co-crystals in order
to better understand the SEM-EDX results. Single crystal refinement data for both
types of co-crystals are provided in Table 22. Powder XRD patterns are shown in
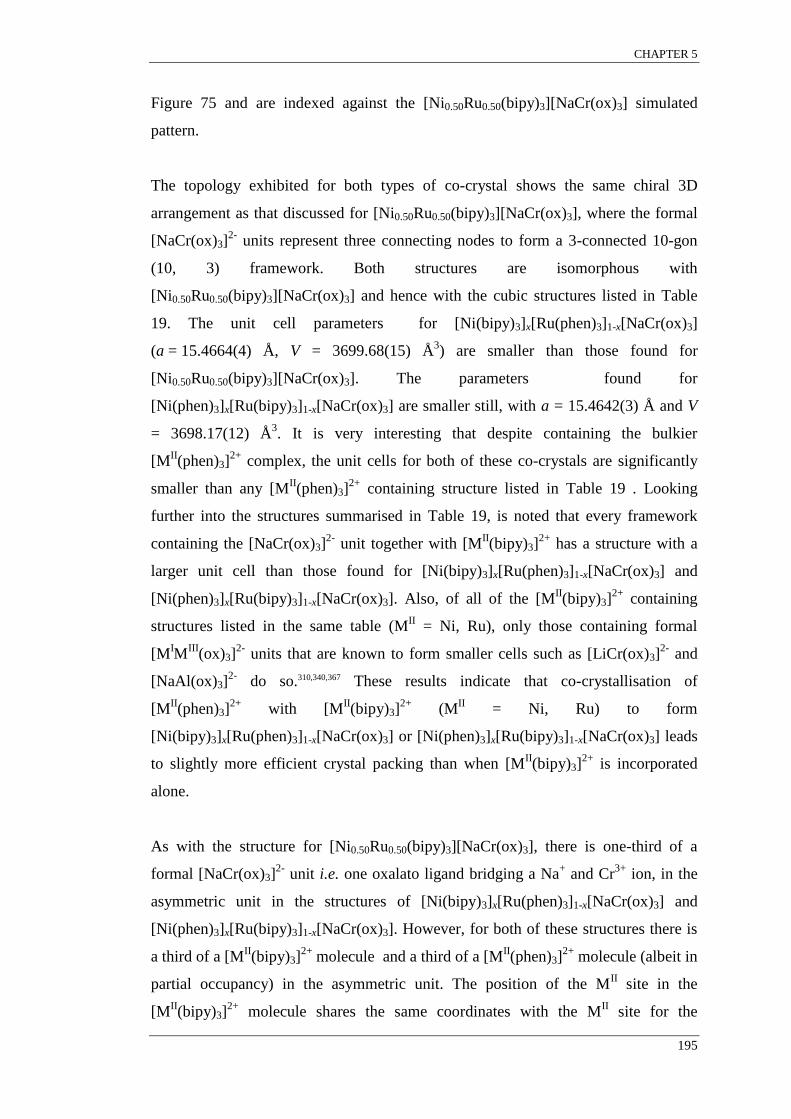
CHAPTER 5
195
Figure 75 and are indexed against the [Ni0.50Ru0.50(bipy)3][NaCr(ox)3] simulated
pattern.
The topology exhibited for both types of co-crystal shows the same chiral 3D
arrangement as that discussed for [Ni0.50Ru0.50(bipy)3][NaCr(ox)3], where the formal
[NaCr(ox)3]2-
units represent three connecting nodes to form a 3-connected 10-gon
(10, 3) framework. Both structures are isomorphous with
[Ni0.50Ru0.50(bipy)3][NaCr(ox)3] and hence with the cubic structures listed in Table
19. The unit cell parameters for [Ni(bipy)3]x[Ru(phen)3]1-x[NaCr(ox)3]
(a = 15.4664(4) Å, V = 3699.68(15) Å3) are smaller than those found for
[Ni0.50Ru0.50(bipy)3][NaCr(ox)3]. The parameters found for
[Ni(phen)3]x[Ru(bipy)3]1-x[NaCr(ox)3] are smaller still, with a = 15.4642(3) Å and V
= 3698.17(12) Å3. It is very interesting that despite containing the bulkier
[MII(phen)3]
2+ complex, the unit cells for both of these co-crystals are significantly
smaller than any [MII(phen)3]
2+ containing structure listed in Table 19 . Looking
further into the structures summarised in Table 19, is noted that every framework
containing the [NaCr(ox)3]2-
unit together with [MII(bipy)3]
2+ has a structure with a
larger unit cell than those found for [Ni(bipy)3]x[Ru(phen)3]1-x[NaCr(ox)3] and
[Ni(phen)3]x[Ru(bipy)3]1-x[NaCr(ox)3]. Also, of all of the [MII(bipy)3]
2+ containing
structures listed in the same table (MII = Ni, Ru), only those containing formal
[MIM
III(ox)3]
2- units that are known to form smaller cells such as [LiCr(ox)3]
2- and
[NaAl(ox)3]2-
do so.310,340,367 These results indicate that co-crystallisation of
[MII(phen)3]
2+ with [M
II(bipy)3]
2+ (M
II = Ni, Ru) to form
[Ni(bipy)3]x[Ru(phen)3]1-x[NaCr(ox)3] or [Ni(phen)3]x[Ru(bipy)3]1-x[NaCr(ox)3] leads
to slightly more efficient crystal packing than when [MII(bipy)3]
2+ is incorporated
alone.
As with the structure for [Ni0.50Ru0.50(bipy)3][NaCr(ox)3], there is one-third of a
formal [NaCr(ox)3]2-
unit i.e. one oxalato ligand bridging a Na+ and Cr
3+ ion, in the
asymmetric unit in the structures of [Ni(bipy)3]x[Ru(phen)3]1-x[NaCr(ox)3] and
[Ni(phen)3]x[Ru(bipy)3]1-x[NaCr(ox)3]. However, for both of these structures there is
a third of a [MII(bipy)3]
2+ molecule and a third of a [M
II(phen)3]
2+ molecule (albeit in
partial occupancy) in the asymmetric unit. The position of the MII site in the
[MII(bipy)3]
2+ molecule shares the same coordinates with the M
II site for the

CHAPTER 5
196
[MII(phen)3]
2+. The position of the Ni/Ru site in
[Ni(bipy)3]x[Ru(phen)3]1-x[NaCr(ox)3] was modelled as a disordered mixture of Ni
and Ru; the relative occupancies were refined (with fixed and equivalent
displacement parameters) to be 0.79 Ni and 0.21 Ru. The refined occupancy of the
Ni/Ru site for [Ni(phen)3]x[Ru(bipy)3]1-x[NaCr(ox)3] was modelled using the same
method and was found to be 0.19 Ni and 0.81 Ru. These values agree very closely
with those obtained by the SEM-EDX results, which showed a 4:1 solid state ratio of
[MII(bipy)3]
2+ to [M
II(phen)3]
2+ in co-crystals that crystallise from solutions
containing an equimolar ratio of the two complexes. Therefore, the final refinement
cycles were conducted with the relative occupancies fixed at 0.80 in favour of the
metal associated with the [MII(bipy)3]
2+ complex.
It has been well established since the inception of these framework materials that the
chirality of the [MII(L)3]
2+ complex (L = 2,2′-bipyridine, 1,10-phenanthroline) serves
as a chiral template for the formation of the 3D helical {[MIM
III(ox)3]
2-}n anionic
framework. When a Δ-[MII(L)3]
2+ complex is used, the metal centres about each
[MIM
III(ox)3]
2- complex unit also exhibit a Δ configuration (and vice versa). When a
racemic mixture is used (such as within this research), spontaneous resolution is
observed whereby each single crystal is homochiral however the bulk sample
contains single crystals of both Δ and Λ chirality. This was the result obtained for the
[Ni0.50Ru0.50(bipy)3][NaCr(ox)3] co-crystallisation system.
It is therefore extremely surprising that co-crystallisation experiments involving
[MII(bipy)3]
2+ and [M
II(phen)3]
2+ with [NaCr(ox)3]
2- resulted in heterochiral single
co-crystals of the formula [Ni(bipy)3]0.80[Ru(phen)3]0.20[NaCr(ox)3] and
[Ni(phen)3]0.20[Ru(bipy)3]0.80[NaCr(ox)3]. In these systems the [MII(bipy)3]
2+
complex is observed to exhibit the opposite chirality to the [MII(phen)3]
2+ units, such
that none of the carbon atoms associated with 2,2′-bipyridine shares coordinates with
those belonging to 1,10-phenanthroline. The coordinates of the nitrogen atoms are
observed to remain constant regardless of the metal complex occupying the cavity.
However, nitrogen atoms associated with each of the observed 1,10-phenanthroline
ligands belong to two 2,2′-bipyridine ligands (and vice versa). Therefore, the relative
occupancies of the nitrogen atoms associated with [MII(bipy)3]
2+ and [M
II(phen)3]
2+
were fixed at 0.80 and 0.20 respectively. The configurations of the metal centres of
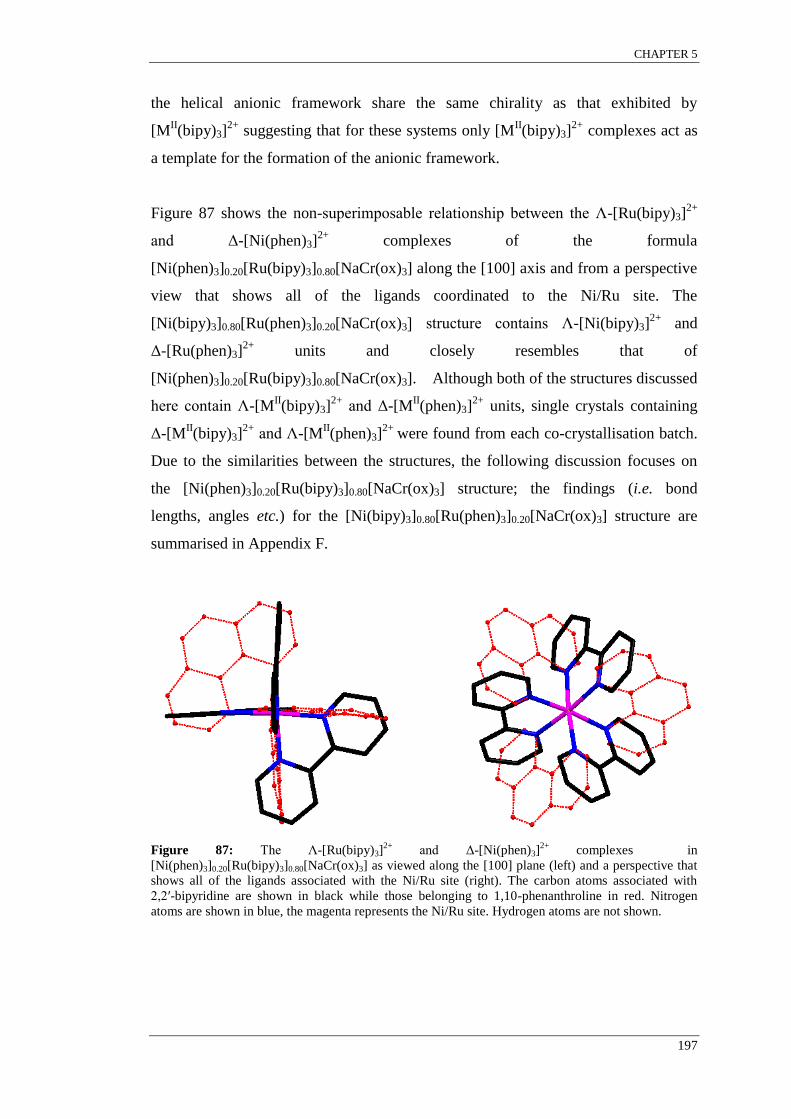
CHAPTER 5
197
the helical anionic framework share the same chirality as that exhibited by
[MII(bipy)3]
2+ suggesting that for these systems only [M
II(bipy)3]
2+ complexes act as
a template for the formation of the anionic framework.
Figure 87 shows the non-superimposable relationship between the Λ-[Ru(bipy)3]2+
and Δ-[Ni(phen)3]2+
complexes of the formula
[Ni(phen)3]0.20[Ru(bipy)3]0.80[NaCr(ox)3] along the [100] axis and from a perspective
view that shows all of the ligands coordinated to the Ni/Ru site. The
[Ni(bipy)3]0.80[Ru(phen)3]0.20[NaCr(ox)3] structure contains Λ-[Ni(bipy)3]2+
and
Δ-[Ru(phen)3]2+
units and closely resembles that of
[Ni(phen)3]0.20[Ru(bipy)3]0.80[NaCr(ox)3]. Although both of the structures discussed
here contain Λ-[MII(bipy)3]
2+ and Δ-[M
II(phen)3]
2+ units, single crystals containing
Δ-[MII(bipy)3]
2+ and Λ-[M
II(phen)3]
2+ were found from each co-crystallisation batch.
Due to the similarities between the structures, the following discussion focuses on
the [Ni(phen)3]0.20[Ru(bipy)3]0.80[NaCr(ox)3] structure; the findings (i.e. bond
lengths, angles etc.) for the [Ni(bipy)3]0.80[Ru(phen)3]0.20[NaCr(ox)3] structure are
summarised in Appendix F.
Figure 87: The Λ-[Ru(bipy)3]2+
and Δ-[Ni(phen)3]2+
complexes in
[Ni(phen)3]0.20[Ru(bipy)3]0.80[NaCr(ox)3] as viewed along the [100] plane (left) and a perspective that
shows all of the ligands associated with the Ni/Ru site (right). The carbon atoms associated with
2,2′-bipyridine are shown in black while those belonging to 1,10-phenanthroline in red. Nitrogen
atoms are shown in blue, the magenta represents the Ni/Ru site. Hydrogen atoms are not shown.
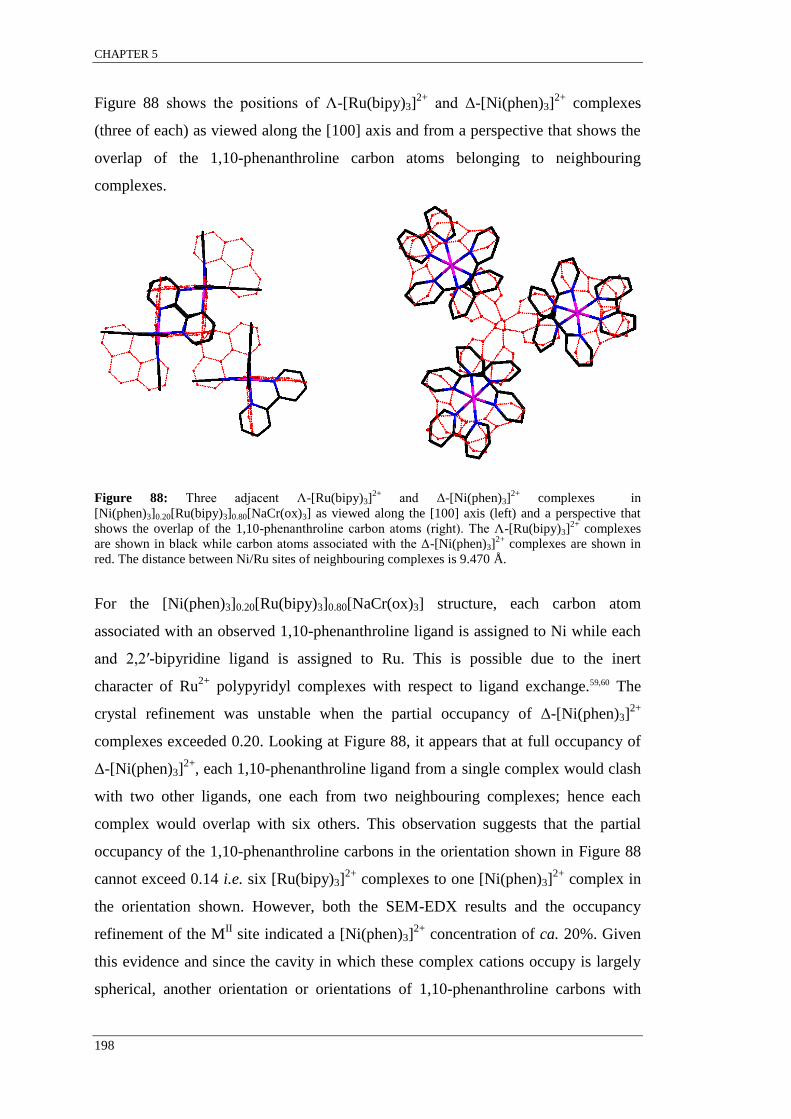
CHAPTER 5
198
Figure 88 shows the positions of Λ-[Ru(bipy)3]2+
and Δ-[Ni(phen)3]2+
complexes
(three of each) as viewed along the [100] axis and from a perspective that shows the
overlap of the 1,10-phenanthroline carbon atoms belonging to neighbouring
complexes.
Figure 88: Three adjacent Λ-[Ru(bipy)3]2+
and Δ-[Ni(phen)3]2+
complexes in
[Ni(phen)3]0.20[Ru(bipy)3]0.80[NaCr(ox)3] as viewed along the [100] axis (left) and a perspective that
shows the overlap of the 1,10-phenanthroline carbon atoms (right). The Λ-[Ru(bipy)3]2+
complexes
are shown in black while carbon atoms associated with the Δ-[Ni(phen)3]2+
complexes are shown in
red. The distance between Ni/Ru sites of neighbouring complexes is 9.470 Å.
For the [Ni(phen)3]0.20[Ru(bipy)3]0.80[NaCr(ox)3] structure, each carbon atom
associated with an observed 1,10-phenanthroline ligand is assigned to Ni while each
and 2,2′-bipyridine ligand is assigned to Ru. This is possible due to the inert
character of Ru2+
polypyridyl complexes with respect to ligand exchange.59,60 The
crystal refinement was unstable when the partial occupancy of Δ-[Ni(phen)3]2+
complexes exceeded 0.20. Looking at Figure 88, it appears that at full occupancy of
Δ-[Ni(phen)3]2+
, each 1,10-phenanthroline ligand from a single complex would clash
with two other ligands, one each from two neighbouring complexes; hence each
complex would overlap with six others. This observation suggests that the partial
occupancy of the 1,10-phenanthroline carbons in the orientation shown in Figure 88
cannot exceed 0.14 i.e. six [Ru(bipy)3]2+
complexes to one [Ni(phen)3]2+
complex in
the orientation shown. However, both the SEM-EDX results and the occupancy
refinement of the MII site indicated a [Ni(phen)3]
2+ concentration of ca. 20%. Given
this evidence and since the cavity in which these complex cations occupy is largely
spherical, another orientation or orientations of 1,10-phenanthroline carbons with
CHAPTER 5
199
partial occupancies totalling 0.06 must also be present. These carbon atoms were not
observed and hence not modelled in the crystal refinement. Assuming that only one
additional orientation of 1,10-phenanthroline carbons is present, a carbon atom at 6%
occupancy would equate to an electron density of about a third of a hydrogen atom.
Therefore, the final refinement cycles were conducted with the relative occupancies
of the 1,10-phenthroline carbons (in the orientation shown in Figure 88) fixed at
0.14.
The distance between Ni/Ru sites of neighbouring complexes is 9.470 Å (9.471 Å for
[Ni(bipy)3]0.80[Ru(phen)3]0.20[NaCr(ox)3]), which is shorter than the distance found
between Ni/Ru sites in [Ni0.50Ru0.50(bipy)3][NaCr(ox)3] (9.492 Å) despite the larger
size of the 1,10-phenanthroline ligand compared to 2,2′-bipyridine.
Just as for the [Ni0.50Ru0.50(bipy)3][NaCr(ox)3] structure, each oxalato ligand bridges
adjacent Na+ and Cr
3+ ions in all three dimensions giving rise to the well established
anionic helical framework. The [MII(bipy)3]
2+/[M
II(phen)3]
2+ are located within the
voids produced by the polymeric [NaCr(ox)3]2-
framework. These structures do not
contain a void volume; hence, it is not surprising that water was not found within
these structures.
The mean MII-N bond length of 2.063(3) Å found for the
[Ni(phen)3]0.20[Ru(bipy)3]0.80[NaCr(ox)3] structure is closer to the average Ru-N
bond length present in [Ru(bipy)3]2+
complexes (2.057 Å). This is fitting since a
large proportion of the cationic guests are [Ru(bipy)3]2+
. The average MII-N bond
length present in the [Ni(bipy)3]0.80[Ru(phen)3]0.20[NaCr(ox)3] structure is longer at
2.077(4) Å, a value closer to the literature values for Ni-N bond lengths for
[Ni(bipy)3]2+
guests (2.088 Å). The 2,2′-bipyridine bite angles of 81.28(15)° and
80.45(15)° for [Ni(phen)3]0.20[Ru(bipy)3]0.80[NaCr(ox)3] and
[Ni(bipy)3]0.80[Ru(phen)3]0.20[NaCr(ox)3] respectively are larger than those
previously observed for [Ni(bipy)3]2+
or [Ru(bipy)3]2+
(78.39-79.39°). The deviation
from the norm in the bite angle is more greatly pronounced for the [MII(phen)3]
2+
complex in both of these structures with values refining close to 90°. The
[Ru(bipy)3]2+
guest complex in [Ni(phen)3]0.20[Ru(bipy)3]0.80[NaCr(ox)3] may be
described by a twist angle of 54.12° and an s/h ratio of 1.41. Although the twist angle

CHAPTER 5
200
for the [Ni(phen)3]2+
guest complex is much larger at 65.88°, a value quite unusual
for these complexes, the centroids and nitrogen atoms used to calculate the s and h
values remain the same and hence the s/h ratio is the identical for both. The twist
angle for the [Ni(bipy)3]2+
and [Ru(phen)3]2+
guest complexes in the
[Ni(bipy)3]0.80[Ru(phen)3]0.20[NaCr(ox)3] are measured to be similar to those of
[Ni(phen)3]0.20[Ru(bipy)3]0.80[NaCr(ox)3] at 52.81° and 67.19° respectively. The s/h
for this structure is also calculated to be 1.41. These values correspond to a trigonally
twisted and compressed octahedron. The inclusion of the bulkier [MII(phen)3]
2+
complex seems to have caused some structural strain in these compounds but not
enough to form crystals of a different phase to [Ni0.50Ru0.50(bipy)3][NaCr(ox)3].
The Cr-O and Na-O bond lengths do not vary significantly from those discussed
regarding [Ni0.50Ru0.50(bipy)3][NaCr(ox)3], nor do the bite and twist angles and s/h
ratios. The similarities in the various parameters of the anionic net between
[Ni0.50Ru0.50(bipy)3][NaCr(ox)3] and the [MII(phen)3]
2+ containing structures
indicates that the framework is unperturbed by the inclusion of the bulker cationic
complex. All of the measurements and crystal parameters regarding all three
structures discussed within this chapter are summarised in Table 22 and Appendix F.
The experimental powder patterns for these [MII(phen)3]
2+ containing co-crystals are
shown in Figure 75 (purple and blue traces). The positions of peaks in the
experimental patterns agree well with the profiles of the
[Ni0.50Ru0.50(bipy)3][NaCr(ox)3] simulated trace. This indicates that the single crystal
data are representative of the bulk phase and that only one phase is present in the
bulk sample. The relative intensity of the [210] and [211] peaks from the same peaks
in the other patterns is the only notable difference between the patterns in Figure 75.
The FWHM of the peaks in the experimental pattern are also comparable to those of
the other patterns in Figure 75. Again, the similarity of the powder patterns to the
simulated pattern indicates that the phase and unit cell dimensions remain relatively
constant between room temperature and 173 K.

CHAPTER 5
201
5.3 Chapter summary and conclusions
Several novel framework co-crystals and crystals exhibiting epitaxial growth were
prepared using [MIII
(ox)3]3-
metal complexes as molecular building-blocks (MIII
= Cr,
Fe; ox = oxalate). Co-crystals with the formula K3[CrxFe1-x(ox)3]·2.5H2O were
analysed using single crystal surface and confocal Raman spectroscopic mapping,
SEM-EDX and PXRD and were found to exhibit directional intracrystal
concentration gradients. Different epitaxial growth patterns were observed depending
on the method used to immerse the seed crystals into the solution. Epitaxial
experiments also indicated that supramolecular interactions between like and
different complexes are similar enough to allow simultaneously growth to occur on
both types of crystals but that interactions between like complexes are slightly more
favourable.
Four different [MII(L)3][NaM
III(ox)3] co-crystals were prepared by co-crystallising
[MII(L)3]Cl2 (M
II = Ni, Ru; L = 2,2′-bipyridine (bipy), 1,10-phenanthroline (phen))
with K3[MIII
(ox)3] (MIII
= Cr, Fe) in the presence of NaCl. Co-crystals were
characterised using SEM-EDX, SCXRD and PXRD. All four of these coordination
frameworks were found to be isomorphous. [Ni0.50Ru0.50(bipy)3][NaCr(ox)3]
co-crystals were found to have the same ratio of the metal complexes that was
present in solution indicating that [MII(bipy)3]
2+ complexes engaged in negligible
supramolecular selection. Results for [Ru(bipy)3][NaCr0.60Fe0.40(ox)3] co-crystals
suggested that K3[Cr(ox)3] was slightly favoured over K3[Fe(ox)3].
A [MII(bipy)3]
2+: [M
II(phen)3]
2+ ratio of 4:1 was found for co-crystals of both
[MA(bipy)3]0.80[M
B(phen)3]0.20[NaCr(ox)3] (M
A, M
B = Ni, Ru) despite some
experiments containing a four-fold excess of the [MII(phen)3]
2+ complex. These
results indicated a ca. 20% threshold for [MII(phen)3]
2+ is allowed in the framework
structure of these materials. It was also discovered that the [MII(phen)3]
2+ molecules
in both structures exhibited the opposite chirality to the [MII(bipy)3]
2+ complexes
such that single co-crystals had the general formula
Λ-[MA(bipy)3]0.80Δ-[M
B(phen)3]0.20Λ-[NaCr(ox)3].

CHAPTER 6
202
CHAPTER 6: Project Summary and conclusions
6.1 Overall project summary and conclusions
Several novel co-crystalline materials, which have the potential to exhibit tunable
properties and/or multifunctionality, were engineered through the exploitation of
known supramolecular motifs and architectures. The synthesis of these new materials
was achieved by incorporating known amounts of different metal complexes into
single crystals to form single co-crystals.
For each system examined, the aim was to gain a deeper understanding of crystal
engineering and factors influencing molecular recognition and in turn supramolecular
selection. Specific focus was placed on the influence of several factors, which were
postulated could affect the ability for metal complexes to engage in molecular
recognition for like complexes, such as ligand type and size, metal complex charge,
mode of intermolecular interaction and the dimensionality of the eventuating
structures. The influences of these factors on supramolecular selection were
investigated through the preparation of various binary homoleptic and different
ligand experiments. Through the study of these experiments, a greater understanding
of the limits of co-crystallisation has been achieved.
Of particular interest were the syntheses of co-crystalline materials that are known to
form molecular structures such as those that propagate using the 2D terpy embrace.
Those that are known to form 3D framework structures through the polymerisation
of [MIII
(ox)3]3-
building-blocks were also of specific focus. Each type of experiment
provided the potential to yield single co-crystals that were capable of exhibiting
tunable properties and/or multifunctionality due to the nature of the metal complexes
involved. The following subsections summarise the results and provide conclusions
specific for each type of co-crystallisation system that was examined.
CHAPTER 6
203
6.2 Novel molecular co-crystals formed through the use of the 2D terpy motif
A series of co-crystallisation experiments was conducted involving complexes that
exhibit the 2D terpy embrace. Experiments ranged from homoleptic experiments and
different ligand experiments involving only complexes with S4 molecular symmetry
to different ligand experiments involving the co-crystallisation of complexes with S4
symmetry with those of D3 symmetry. Co-crystals were characterised using
SEM-EDX, SCXRD and PXRD techniques.
Co-crystals of the general formula [MII
xRu1-x(terpy)2](PF6)2 (MII = Fe, Co, Ni, Cu)
were found to form without concentration gradients, as SEM-EDX analysis showed
that measurements made from the same co-crystal (surface and crushed
measurements) were similar. However, the SEM-EDX results showed that
co-crystals grown from the same solution were found to have a range of
concentrations such that xsolid single crystal 1 ≠ xsolid single crystal 2. This result is indicative of
supramolecular selection between complexes where intermolecular interactions
between like complex pairs are slightly more energetically favoured than interactions
between different complexes. Variations between xsolid values found for co-crystals
harvested from the same batch for [MII
xRu1-x(terpy)2](PF6)2 (MII = Co, Ni or Cu)
were comparable to one another and significantly larger than for
[FexRu1-x(terpy)2](PF6)2. This strongly suggests that [Fe(terpy)2](PF6)2 and
[Ru(terpy)2](PF6)2 metal complexes engage in the least amount of supramolecular
selection during co-crystallisation compared to the other systems.
The results obtained from these experiments with regard to supramolecular selection
are very interesting, as regardless of the metal centre, various [MII(terpy)2]
2+
complexes have very similar dimensions. Furthermore, the intermolecular
interactions involved in the 2D terpy embrace occur between the ligands of
neighbouring coordination spheres of complex pairs. Hence, the results obtained here
suggest that even a relatively small change (difference in metal centres) is being
recognised beyond the point of difference resulting in molecular recognition and
therefore supramolecular selection during co-crystallisation. This is despite the point
of difference being completely shrouded by the ligands.

CHAPTER 6
204
Powder XRD data revealed different crystal structures were possible for the various
[MII
xRu1-x(terpy)2](PF6)2 co-crystals despite the similarities between the systems i.e.
the isomorphous relationship of [MII(terpy)2](PF6)2 complexes (M
II = Co, Ni, Cu).
Co-crystals of the formula [FexRu1-x(terpy)2](PF6)2 were found to adopt the
[Fe(terpy)2](PF6)2 phase without any evidence of phase impurities. Co-crystals of
[CuxRu1-x(terpy)2](PF6)2 were found to predominantly adopt the [Cu(terpy)2](PF6)2
phase with the possibility of only minor phase impurities. The powder XRD patterns
for [CoxRu1-x(terpy)2](PF6)2 and [NixRu1-x(terpy)2](PF6)2 were very similar
suggesting the two are isomorphous but did not match either [MII(terpy)2](PF6)2
(MII = Co, Ni) nor [Ru(terpy)2](PF6)2. This suggests that [CoxRu1-x(terpy)2](PF6)2 and
[NixRu1-x(terpy)2](PF6)2 co-crystals formed a new structure as a result of
co-crystallisation. PXRD patterns suggested that the [Ru(terpy)2](PF6)2 phase was
absent from every [MII
xRu1-x(terpy)2](PF6)2 batch. This is not surprising as each
co-crystal was found to contain both metal complexes and introducing even the
slightest change into the high symmetry [Ru(terpy)2](PF6)2 lattice would force the
cell into a lower symmetry crystal structure.
Co-crystals of the general formula [MII(terpyOH)2]x[Ru(terpy)2]1-x(BF4)2 were found
to have slight concentration gradients, as measurements from crushed samples
showed slightly higher ratios of [MII(terpyOH)2](BF4)2 than was found on the
surface. Analysis of the residue obtained from evaporating the mother liquors found
high proportions of ruthenium, indicating that [Ru(terpy)2](BF4)2 is more soluble in
the co-crystallisation solutions than [MII(terpyOH)2](BF4)2. SEM-EDX analysis of
[MII(terpyOH)2]x[Ru(terpy)2]1-x(BF4)2 systems found that single co-crystals grown
from the same solution ranged in composition i.e. xsolid single crystal 1 ≠ xsolid single crystal 2.
Like the [MII
xRu1-x(terpy)2](PF6)2 systems, this is indicative of supramolecular
selection for like complexes during co-crystal growth. Systems where MII = Fe, Cu
displayed less supramolecular selection than when MII = Ni. This suggest that
[Ru(terpy)2]2+
has more favourable intermolecular interactions with [Fe(terpyOH)2]2+
and [Cu(terpyOH)2]2+
than with [Ni(terpyOH)2]2+
.
Despite the larger differences between the complexes, the variations between xsolid
values from [MII(terpyOH)2]x[Ru(terpy)2]1-x(BF4)2 co-crystals harvested from the
same solution were comparable or smaller than the variations found for

CHAPTER 6
205
[MII
xRu1-x(terpy)2](PF6)2 systems. This is likely due to the solubility of
[Ru(terpy)2](BF4)2 complexes relative to [MII(terpyOH)2](BF4)2 as a larger
proportion of [Ru(terpy)2](BF4)2 was left behind in solution. Hence, more
[MII(terpyOH)2]
2+ complexes were present in the co-crystals at every stage of
co-crystallisation leading to the selection bias towards [MII(terpyOH)2]
2+ during
co-crystal growth.
Single crystal and powder XRD analysis of each
[MII(terpyOH)2]x[Ru(terpy)2]1-x(BF4)2 batch found the co-crystals to be isomorphous
with the respective pure [MII(terpyOH)2](BF4)2 compound that was present in
solution. The XRD patterns showed no evidence of the [Ru(terpy)2](BF4)2 phase in
any of the batches formed from 0.50:0.50 solutions. This strongly suggests that the
2D terpy supramolecular motif for [MII(terpyOH)2](BF4)2 was the dominate motif
and therefore more robust than that of [Ru(terpy)2](BF4)2 as it was the structure
favoured in co-crystals resulting from each experiment.
Experiments where [MII(terpyOH)2]x[Ru(terpy)2]1-x(BF4)2 co-crystals were formed
from solutions containing 5% [MII(terpyOH)2](BF4)2 (M
II = Fe, Cu) were found to
adopt exclusively the tetragonal I41/a [Ru(terpy)2](BF4)2 phase. Analogous
experiments containing 5% [Ni(terpyOH)2](BF4)2 formed monoclinic co-crystals
(P21). This signifies that a larger proportion of [MII(terpyOH)2]
2+ complexes (M
II =
Fe, Cu) can be accommodated into the [Ru(terpy)2](BF4)2 structure than can
[Ni(terpyOH)2]2+
. The powder XRD patterns suggest that the [Ru(terpy)2](BF4)2 2D
terpy supramolecular motif was the dominant motif when the concentration of
[MII(terpyOH)2]
2+ (M
II = Fe, Cu) complexes were ca. 5%. The powder XRD results
from experiments where [Ni(terpyOH)2](BF4)2 was co-crystallised with
[Ru(terpy)2](BF4)2 in 0.50:0.50 and 0.05:0.95 ratios suggested that the resulting
co-crystals were isomorphous with crystals of pure [Ni(terpyOH)2](BF4)2. This
indicates that perhaps the [Ni(terpyOH)2](BF4)2 structure is more robust compared to
the other [MII(terpyOH)2](BF4)2 as it was maintained even when ca. 95% of the
complexes in the co-crystals were [Ru(terpy)2](BF4)2.
It is interesting that the combinations that produced co-crystals of the I41/a
[Ru(terpy)2](BF4)2 phase were the same as the 0.50:0.50

CHAPTER 6
206
[MII(terpyOH)2]x[Ru(terpy)2]1-x(BF4)2 experiments that displayed the least
supramolecular selection. This is further evidence to suggest that [Ru(terpy)2](BF4)2
complexes are structurally more similar to [MII(terpyOH)2](BF4)2 complexes when
MII = Fe, Cu than when M
II = Ni.
Experiments where [Co(terpyO)(terpyOH)](BF4)2 was co-crystallised with
[Ru(terpy)2](BF4)2 resulted in samples that contained only pure crystals of both
complexes. Crystals of pure complexes were also obtained from experiments where
[MII(terpyPh)2](PF6)2 (M
II = Fe, Ni, Cu) were co-crystallised with [Ru(terpy)2](PF6)2
and experiments where [Ni(L)3](PF6)2 (L = phen, bipy) were co-crystallised with
[Ru(terpy)2](PF6)2 or [Ru(terpyPh)2](PF6)2. Regardless of the differences between
each of the complexes involved, the molecular structures of complexes in the each
pair were theoretically capable of engaging in some combination of intermolecular
interactions to yield co-crystals containing both complexes. However, the results
suggest that exclusive supramolecular selection occurred, as only pure crystals
eventuated from these experiments, most likely because the supramolecular
interactions of the two complexes in each experiment were too different. These
combinations are therefore beyond the limit for which molecular recognition
processes can be confused into co-crystallising different molecules. It is important to
note that exclusive supramolecular selection is the usual result of recrystallisation
and is why recrystallisation is considered such a good technique for purification.
Ultimately, it seems that the supramolecular motifs of the complexes in each
combination were not robust enough to allow both types of complex to exist in the
same lattice.
6.3 Co-crystallisations using the K3[MIII
(ox)3] metal complex building-block to
form novel co-crystalline metal-organic frameworks.
A variety of co-crystallisation and epitaxial experiments involving the K3[MIII
(ox)3]
metal complex building-block were conducted. Single crystals of five novel
co-crystalline coordination frameworks were prepared and characterised using single
crystal and bulk measurement techniques. Another five novel crystals exhibiting
epitaxial growth were prepared and characterised.

CHAPTER 6
207
Several homoleptic experiments, which involved the co-crystallisation of two
different K3[MIII
(ox)3]·xH2O complexes (MIII
= Mn, Cr, Fe, Ru and Rh and
xsolution = 0.10 to 0.90 in fractional increments of 0.20) to form co-crystals of the
general formula K3[MA
xMB
1-x(ox)3]·xH2O were conducted.
Only experiments where solutions of K3[Cr(ox)3] were mixed with solutions of
K3[Fe(ox)3] produced single co-crystals. All other combinations produced either
polycrystalline, amorphous or decomposed materials. Experiments involving the
stable K3[Cr(ox)3] that produced decomposed products indicated that K3[Cr(ox)3] did
not have a stabilising effect during co-crystallisation. Powder XRD measurements of
K3[CrxFe1-x(ox)3]·2.5H2O co-crystals resulting from all batches indicated that the
co-crystal phase was isomorphous with pure K3[Cr(ox)3]·2.5H2O and
K3[Fe(ox)3]·2.5H2O and without phase impurities. This was not surprising as
K3[Cr(ox)3]·2.5H2O and K3[Fe(ox)3]·2.5H2O are isomorphous, belonging to the P21/c
space group.
The solid state compositions (xsolid) of K3[CrxFe1-x(ox)3]·2.5H2O single co-crystals
from all batches were initially examined using SEM-EDX spot analysis. The relative
ratios from the same co-crystal were found to differ, with the largest variations
observed for co-crystals formed from equimolar solutions (xsolution = 0.50). Further
analysis of co-crystals grown from an additional batch where xsolution = 0.50 implied
the presence of a directional surface concentration gradient, where the fraction of
K3[Cr(ox)3]·2.5H2O was always found to be greater near the edges (ca. 90%) than at
the centre of the co-crystal face (ca. 40%). Line maps conducted along transects
spanning diagonally across the largest facet confirmed the formation of a directional
concentration gradient. SEM-EDX analysis was limited to ca. 30 minutes per
co-crystal, at which time the co-crystals were observed to have deteriorated
completely.
Molar fractions of K3[Cr(ox)3]·2.5H2O and K3[Fe(ox)3]·2.5H2O in single co-crystals
were instead estimated using the position of the Raman carbonyl stretching peak.
This characterisation method was first calibrated using the positions of the peaks for
the pure samples, and then validated using SEM-EDX measurements obtained from
similar locations on the same co-crystals. Fractions estimated from the Raman
CHAPTER 6
208
spectra were found to correlate well with SEM-EDX results. Therefore, single crystal
Raman spectroscopic mapping was found to be a suitable alternative analytical
technique to SEM-EDX for the quantitative characterisation of these samples.
All co-crystals were observed to contain a directional concentration gradient on the
surface of the largest facet. It was found that K3[Cr(ox)3]·2.5H2O concentrations
gradually increased from ca. 35-40% at the face centre to ca. 85-90% at the edge.
Estimates of the K3[Cr(ox)3]·2.5H2O concentration at various depths below the
surface were obtained using confocal Raman microscopy. Depth-profiles from
measurements taken along transects parallel to the largest facet showed a steady
decrease of the K3[Cr(ox)3]·2.5H2O concentration towards the centre of the
co-crystal. These results followed the same trend as that obtained from surface maps;
however, they were not as pronounced. The variations in the K3[Cr(ox)3]·2.5H2O
concentrations were found to be very minimal along transects that were
perpendicular to the largest facet. None of the co-crystals analysed where found to
have areas on or below the surface with K3[Cr(ox)3]·2.5H2O concentrations of less
than 30%. The large concentration gradients found on the surface of
K3[CrxFe1-x(ox)3]·2.5H2O co-crystals and the difference between the results obtained
by the parallel and perpendicular confocal experiments suggested favourable
propagation of crystal growth in some directions but not others during
co-crystallisation. The presence of a concentration gradient presents the potential for
a single crystal to display an infinitely varying degree of multifunctionality.
Epitaxial crystal growth experiments where seed crystals of the general formula
K3[MIII
(ox)3]·2.5H2O (MIII
= Cr and/or Fe) were immersed into saturated solutions of
K3[MIII
(ox)3](aq/EtOH) (MIII
= Cr, Fe or a 1:1 mixture) were conducted to help explain
the results obtained from K3[CrxFe1-x(ox)3]·2.5H2O co-crystalisation experiments.
Results showed different epitaxial growth patterns depending on the method used to
immerse the seed into the growth solution. When the seeds were allowed to rest at
the base of the glass vial, growth only occurred around the perimeter of the seed.
Raman spectroscopic mapping and SEM-EDX results confirmed the absence of any
epitaxial growth on the top or underside of the seed. However, the seeds were
observed to be completely enveloped by epitaxial growth when they were affixed to
glass fibres and suspended in the growth solution. The results obtained from these

CHAPTER 6
209
epitaxial experiments provide great insight as to why concentration gradients in
K3[CrxFe1-x(ox)3]·2.5H2O co-crystals were consistently found to be more pronounced
in some directions but not others. The results suggested that perhaps local charging
effects occurring between the crystals and the glass of the vial during crystallisation
inhibit crystal growth in some directions leading to preferential growth occurring
around the perimeter.
It was also demonstrated that it is possible to form epitaxial crystals that have seed
domains containing K3[Cr(ox)3]·2.5H2O surrounded by epitaxial growth composed
of K3[Fe(ox)3]·2.5H2O. The arrangement of metal complexes in these types of
crystals is essentially the inverse to what was observed to occur spontaneously from
solutions that contained both complexes. The interface between the seed and
epitaxial domains for these types of crystals were found to be more diffuse than
crystals grown by immersing K3[Fe(ox)3]·2.5H2O seeds into K3[Cr(ox)3](aq/EtOH)
saturated solutions. This result suggests that K3[Cr(ox)3]·2.5H2O crystal are slightly
more soluble than K3[Fe(ox)3]·2.5H2O crystals resulting a greater partial dissolution
of the former compared to the latter.
Similar epitaxial growth patterns to experiments containing only one type of seed
were observed when seeds of both K3[Cr(ox)3]·2.5H2O and K3[Fe(ox)3]·2.5H2O were
immersed in solutions of either K3[Cr(ox)3](aq/EtOH) or K3[Fe(ox)3](aq/EtOH). For these
experiments both types of seeds were observed to have epitaxial growth. This
indicates that the supramolecular interactions between the like and different
complexes are similar enough to allow growth to occur on both types of crystals
simultaneously.
An additional epitaxial crystal growth experiment demonstrated that a concentration
gradient similar to the one observed for K3[CrxFe1-x(ox)3]·2.5H2O co-crystals resulted
when K3[Fe(ox)3]·2.5H2O seeds were immersed in a saturated solution containing an
equimolar ratio of K3[Cr(ox)3] and K3[Fe(ox)3]. Through the use of a saturated 1:1
solution the solubility differences between the two complexes were minimised.
Therefore, the results suggest that the concentration gradient that formed was likely
due to supramolecular selection as a result of a bias for K3[Fe(ox)3] rather than just
fractional crystallisation. For the K3[CrxFe1-x(ox)3]·2.5H2O system the bias was likely

CHAPTER 6
210
initiated by the solubility differences between the complexes while for the epitaxial
system the bias was initiated by the presence of the pure K3[Fe(ox)3]·2.5H2O seed.
These results suggest that K3[Cr(ox)3] and K3[Fe(ox)3] complexes are structurally
similar enough to co-crystallise but different enough such that supramolecular
interactions between like complexes are slightly more favourable. The
supramolecular selection which appears to have occurred for these systems has
manifested differently to the selection observed for discrete molecular systems such
as [MII
xRu1-x(terpy)2](PF6)2, as each K3[CrxFe1-x(ox)3]·2.5H2O co-crystal batch was
found to be similar i.e. all displayed a similar concentration gradient.
Four different co-crystalline 3D coordination frameworks of the type
[MII(L)3][NaM
III(ox)3] were prepared through the co-crystallisation of [M
II(L)3]Cl2
(MII = Ni, Ru; L = 2,2′-bipyridine, 1,10-phenanthroline) with K3[M
III(ox)3]
(MIII
= Cr, Fe) in the presence of NaCl and characterised using SEM-EDX, XRD.
Analogous cation and anion metal dilution experiments where [MII(phen)3]
2+
(MII = Ni, Ru) and [M
III(ox)3]
3- (M
III = Cr, Fe) were co-crystallised in the presence of
NaCl produced unstable rectangular prism shaped co-crystals. SEM-EDX analysis
suggested the formation of metal complex salts with the general formula
[MII(phen)3]3[M
III(ox)3]2·xH2O. Results suggested that [M
II(phen)3]
2+ complexes do
not engage in supramolecular selection during the formation of
[Ni0.50Ru0.50(phen)3]3[Cr(ox)3]2 as the ratio of complexes in the solid-state was equal
to the concentration in solution. Results for the [Ru(phen)3]3[Cr0.40Fe0.60(ox)3]2
system suggest a genuine preference for [Fe(ox)3]3-
during the formation of this
compound.
Co-crystals of all four coordination frameworks formed with a tetrahedral habit and
were found to be isomorphous, crystallising in the P213 cubic space group. The unit
cell parameters were found to be very similar to the parameters of the various
non-diluted structures listed in the literature. Interestingly, co-crystals incorporating
both [MII(bipy)3]
2+ and [M
II(phen)3]
2+ complexes had unit cell dimensions slightly
smaller when compared to co-crystals without the bulkier [MII(phen)3]
2+ complex.
This is counterintuitive given the added bulk of the 1,10-phenanthroline ligand yet
these results suggest more efficient crystal packing for
[MA(bipy)3]0.80[M
B(phen)3]0.20[NaCr(ox)3] co-crystals (M
A = Ni, M
B = Ru and vice

CHAPTER 6
211
versa) compared to [Ni0.50Ru0.50(bipy)3][NaCr(ox)3] co-crystals. Furthermore, the Ni
and Ru relative occupancy refinement values for all three types of co-crystals were in
very close agreement to those obtained by SEM-EDX. PXRD patterns were indexed
against a pattern simulated from experimental SCXRD data. No additional peaks
were observed nor were the peaks significantly broader than those in the simulated
pattern suggesting the presence of a single phase and a tight distribution of xsolid
values.
Co-crystals of [Ni0.50Ru0.50(bipy)3][NaCr(ox)3] were found to have the same ratio of
the metal complexes in the solid state that was present in solution. These results
indicate that [MII(bipy)3]
2+ complexes engage in negligible supramolecular selection
during co-crystallisation and therefore the solid state concentration is a random
distribution of complexes, which is statistically dependant on the stoichiometry of
complexes in solution. Conversely, the results for co-crystals of the formula
[Ru(bipy)3][NaCr0.60Fe0.40(ox)3] suggest that K3[Cr(ox)3] was slightly favoured over
and K3[Fe(ox)3]. The results obtained from these two seemingly similar experiments
strongly affirm that intermolecular interactions between complexes is a key
proponent in the proposed mechanism(s) of supramolecular selection.
Although both [Ni(bipy)3]2+
and [Ru(bipy)3]2+
have extremely similar geometric
dimensions, varying only by the slightest margins, previous co-crystallisation
experiments such as those that produced [NixRu1-x(bipy)3](PF6)2 co-crystals have
demonstrated that even the slightest differences between complexes are recognised
beyond the point of difference resulting in significant supramolecular selection.
Complex pairs in the previously reported [NixRu1-x(bipy)3](PF6)2 system interact
through six EF π-interactions. In these P213 framework structures the [MII(bipy)3]
2+
complexes occupy cavities created by the 3D anionic framework and as a result
[MII(bipy)3]
2+ complexes do not interact with one another. Without these
supramolecular interactions occurring between pairs of complexes these minor
differences go unnoticed and as a result both complexes are relatively equal with
respect to their ability to template the anionic framework.
Contrary to the arrangement of the [MII(bipy)3]
2+ complexes in these 3D polymeric
structures, the metal centres of the {[NaMIII
(ox)3]2-
}n building-blocks are linked in

CHAPTER 6
212
three dimensions by oxalato ligands. It is well known in the literature that the oxalato
ligands in these structures facilitate and enhance the electronic communication
between the metal sites. Furthermore, although both [Cr(ox)3]3-
and [Fe(ox)3]3-
have
very similar geometric dimensions, the relative structural change imparted when one
metal centre is substituted for another is greater for [MIII
(ox)3]3-
complexes than
[MII(bipy)3]
2+ due to the smaller size of the oxalato ligand and consequently the
[MIII
(ox)3]3-
complex. It is possible that these factors amplified the minor structural
differences between the complexes and consequently the ability for complexes to
engage in the molecular recognition process involved during the formation of the
anionic framework. Overall, the results obtained for this system imply that however
minor the differences between the complexes, it seems that [Cr(ox)3]3-
was slightly
more energetically favoured over [Fe(ox)3]3-
during the formation of the
[Ru(bipy)3][NaCrxFe1-x(ox)3] metal-organic framework.
The [MII(bipy)3]
2+: [M
II(phen)3]
2+ ratio in [Ni(bipy)3]0.80[Ru(phen)3]0.20[NaCr(ox)3]
and [Ni(phen)3]0.20[Ru(bipy)3]0.80[NaCr(ox)3] co-crystals was found to be 4:1. This
ratio was found to be consistent despite co-crystallising solutions containing up to a
four-fold excess of [MII(phen)3]
2+ compared to [M
II(bipy)3]
2+. These results indicate
the formation of co-crystals with a ca. 20% threshold for [MII(phen)3]
2+ is allowed in
the framework structure. Interestingly, far fewer co-crystals were observed to form in
experiments with a substantial excess of [MII(phen)3]
2+. For each experiment neither
[Ni(bipy)3][NaCr(ox)3] nor [Ru(bipy)3][NaCr(ox)3] crystals were found to form from
either system and all crystals analysed were found to contain both nickel and
ruthenium.
Through SCXRD it was found that at full occupancy of [MII(phen)3]
2+ each complex
would overlap with six others. Hence, only 14% of the [MII(phen)3]
2+ molecules
could be accounted for in the orientation modelled in the refinement. However, since
both the SEM-EDX results and the occupancy refinement of the MII site indicated a
[MII(phen)3]
2+ concentration of ca. 20%, another orientation or orientations with
partial occupancies totalling 0.06 must also be present. The carbon atoms of the
complexes in these orientations were not observed and subsequently not modelled as
at 6% occupancy would have electron densities less than half of those of hydrogen
atoms.
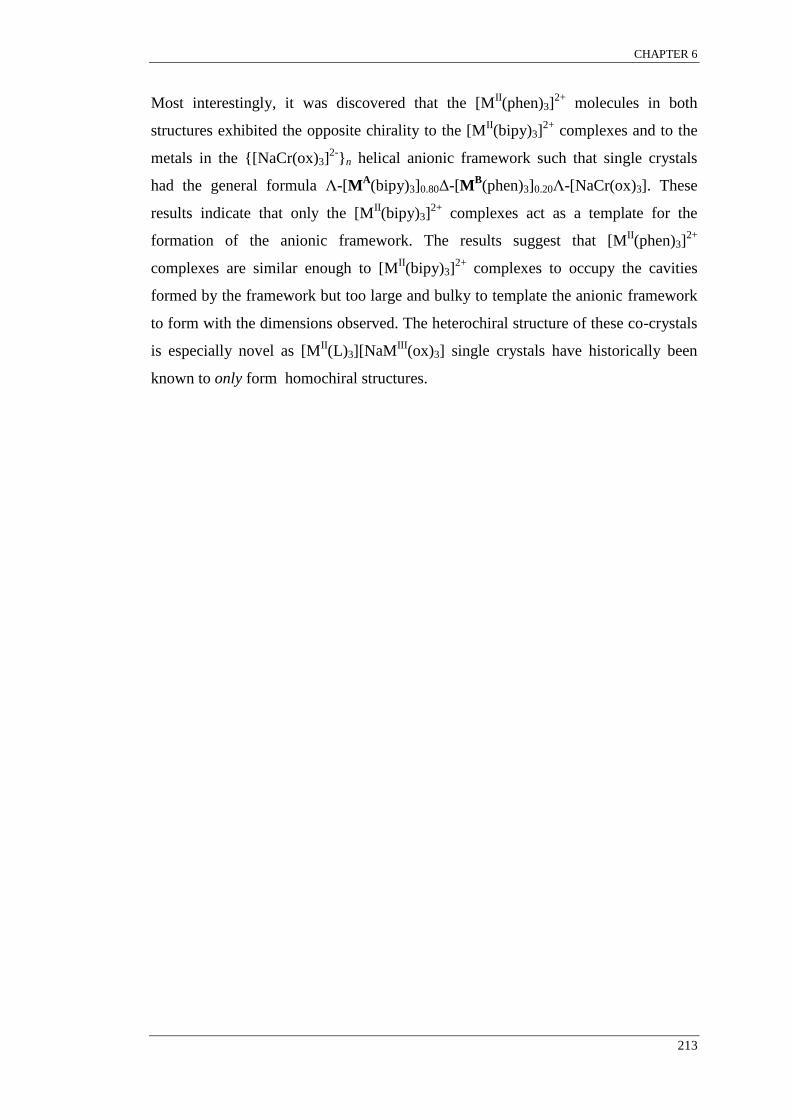
CHAPTER 6
213
Most interestingly, it was discovered that the [MII(phen)3]
2+ molecules in both
structures exhibited the opposite chirality to the [MII(bipy)3]
2+ complexes and to the
metals in the {[NaCr(ox)3]2-
}n helical anionic framework such that single crystals
had the general formula Λ-[MA(bipy)3]0.80Δ-[M
B(phen)3]0.20Λ-[NaCr(ox)3]. These
results indicate that only the [MII(bipy)3]
2+ complexes act as a template for the
formation of the anionic framework. The results suggest that [MII(phen)3]
2+
complexes are similar enough to [MII(bipy)3]
2+ complexes to occupy the cavities
formed by the framework but too large and bulky to template the anionic framework
to form with the dimensions observed. The heterochiral structure of these co-crystals
is especially novel as [MII(L)3][NaM
III(ox)3] single crystals have historically been
known to only form homochiral structures.

CHAPTER 7
214
CHAPTER 7: Directions for future research
Using the methods discussed within this thesis, the scope for synthesising single
co-crystals that are capable of displaying tunable properties is infinite. For example,
analogous experiments to those discussed within this research could be undertaken
where experimental conditions such as temperature, solute concentration or solvent
are altered so that a better understanding of the thermodynamic and kinetic
mechanisms governing co-crystallisation could be gained. Similarly, the scope for
investigating the limitations of supramolecular selection is extremely broad as only a
few select systems were analysed within this work in order to highlight this
remarkable newly discovered phenomenon. The prevalence of supramolecular
selection could be investigated for by performing co-crystallisation experiments
involving other known systems. However, in regards to the overall objective of this
work i.e. engineering novel co-crystalline materials with potentially tunable
properties and in light of the results obtained, two avenues of research are of
particular interest. The first is the use of heteroleptic metal complexes in co-
crystallisation experiments and the second is the design of new crystallisation
techniques to intentionally form co-crystals that contain concentration gradients.
Experiments where [MII(bipy)3]
2+ (M
II = Ni, Ru) was co-crystallised with
[MIII
(ox)3]3-
(MIII
= Cr, Fe) in the presence of NaCl produced single co-crystals of the
3D coordination framework [MII(bipy)3][NaM
III(ox)3]. However when [M
II(phen)3]
2+
(MII = Ni, Ru) was used in lieu of [M
II(bipy)3]
2+ only unstable co-crystals suspected
to be the metal complex salt [MII(phen)3]3[M
III(ox)3]2·xH2O formed. It would
therefore be interesting to observe if the 3D coordination framework or the metal
complex salt formed when heteroleptic complexes of [MII(bipy)2(phen)]
2+ or
[MII(bipy)(phen)2]
2+ are co-crystallised with [M
III(ox)3]
3- in the presence of NaCl.
Experiments that involved both [MII(bipy)3]
2+ and [M
II(phen)3]
2+ produced single
co-crystals of the heterochiral 3D coordination framework
Λ-[MA(bipy)3]0.80Δ-[M
B(phen)3]0.20Λ-[NaCr(ox)3], where the threshold of
[MII(phen)3]
2+ complexes was found to be ca. 20%, despite solutions containing a
four-fold excess of [MII(phen)3]
2+. Should co-crystals of the 3D coordination
framework form when either [MII(bipy)2(phen)]
2+ or [M
II(bipy)(phen)2]
2+ are

CHAPTER 7
215
substituted in solution for [MII(phen)3]
2+, it would be curious to see if the thresholds
for the heteroleptic complexes are larger than that of [MII(phen)3]
2+ given their
reduced bulk. It would also be interesting to see if heterochiral or the traditional
homochiral structures formed.
Throughout this research, two systems were identified as having spontaneously
formed co-crystals that contained intracrystal solid-state concentration gradients;
co-crystals of [MII(terpyOH)2]x[Ru(terpy)2]1-x(BF4)2 (M
II = Fe, Ni, Cu) and
K3[CrxFe1-x(ox)3]·2.5H2O. Co-crystals that contain concentration gradients have the
potential to display a continuum of concentration dependant properties. Furthermore,
co-crystals that contain concentration gradients defy the generally accepted definition
needed to classify a solid as a crystal:
“a homogenous solid formed by a repeating, three-dimensional pattern of atoms,
ions, or molecules”.
For example, co-crystals of [MII(terpyOH)2]x[Ru(terpy)2]1-x(BF4)2 (M
II = Fe, Cu)
were found to adopt the [MII(terpyOH)2](BF4)2 phase when xsolution = 0.50 yet adopt
the [Ru(terpy)2](BF4)2 when xsolution = 0.05. In each case, the concentration gradient
that spontaneously formed was relatively modest. However, if experiments were
designed so that the concentration in solution was controlled and constantly changing
to yield co-crystals with concentration gradients ranging from 0.05-0.50 of
[MII(terpyOH)2](BF4)2 it may be possible to form a multiphase crystal. In this
scenario it would be very intriguing to analyse the crystal structure of these
co-crystals. Would the phase differences between the zones in such a crystal be
gradual or abrupt and how would these crystals be categorised? By manipulating the
concentration of the complexes during co-crystallisation it would also be possible to
grow co-crystals containing concentration gradients that would otherwise not
spontaneously form with concentration gradients. The ability for a single crystal to
display zone specific properties, such as phase, spin state, magnetism and chirality
would be a significant advancement in the engineering of multifunctional crystalline
materials.

REFERENCES
216
REFERENCES
In text references
(1) Lehn, J.-M. Proc. Natl. Acad. Sci. USA 2002, 99, 4763-4768.
(2) Lehn, J.-M. Science 2002, 295, 2400-2403.
(3) Lehn, J.-M. Chem. Soc. Rev. 2007, 36, 151-160.
(4) Fischer, E. Ber. Dtsch. Chem. Ges. 1894, 27, 2985-2993.
(5) Pedersen, C. J. Science 1988 241, 536-540
(6) Lehn, J.-M. Science 1985, 227, 849-856.
(7) Lehn, J.-M.; Rigault, A.; Siegel, J.; Harrowfield, J.; Chevrier, B.; Moras, D.
Proc. Natl. Acad. Sci. USA 1987, 84, 2565-2569.
(8) Cram, D. J. Angew. Chem., Int. Ed. Engl. 1988, 27, 1009-1020.
(9) Cram, D. J. Angew. Chem. 1988, 100, 1041-1052.
(10) Lehn, J.-M. Angew. Chem. 1988, 100, 91-116.
(11) Lehn, J.-M. Angew. Chem., Int. Ed. Engl. 1988, 27, 89-112.
(12) Pedersen, C. J. J. Am. Chem. Soc. 1967, 89, 2495-2496.
(13) Pedersen, C. J. J. Am. Chem. Soc. 1967, 89, 7017-7036.
(14) Lehn, J.-M. Pure Appl. Chem. 1978, 50, 871-892.
(15) Lehn, J. Science 1993, 260, 1762-1763.
(16) Lehn, J.-M. Supramolecular Chemistry: Concepts and Perspectives; Wiley-
VCH Weinheim, 1995.
(17) Decurtins, S. Philos. Trans. R. Soc. London, Ser. A 1999, 357, 3025-3040.
(18) Brammer, L. Chem. Soc. Rev. 2004, 00033, 476-490.
(19) Erk, P.; Hengelsberg, H.; Haddow, M. F.; Gelder, R. v. Cryst. Eng. Comm.
2004, 6, 475-484.
(20) Kitagawa, S.; Kitaura, R.; Noro, S.-i. Angew. Chem. Int. Ed. 2004, 43, 2334-
2375.
(21) Braga, D.; Grepioni, F. Making Crystals by Design: Methods, Techniques and
Applications; Wiley-VCH: Weinheim, 2006.
(22) Desiraju, G. R.; Vittal, J. J.; Ramanan, A. Crystal Engineering: A Textbook;
World Scientific: Singapore, 2011.
(23) Schmidt, G. M. J. Pure Appl. Chem. 1971, 27, 647-678.
(24) Pepinsky, R. Phys. Rev. 1955, 100, 971-971.

REFERENCES
217
(25) Authier, A. Early Days of X-ray Crystallography; Oxford University Press:
Oxford, 2013.
(26) Aakeröy, C. B.; Beatty, A. M. Aust. J. Chem. 2001, 54, 409-421.
(27) Desiraju, G. R. Angew. Chem., Int. Ed. Engl. 1995, 34, 2311-2327.
(28) Noveron, J. C.; Lah, M. S.; Del Sesto, R. E.; Arif, A. M.; Miller, J. S.; Stang,
P. J. J. Am. Chem. Soc. 2002, 124, 6613-6625.
(29) Carbonera, C.; Kilner, C. A.; Letard, J.-F.; Halcrow, M. A. Dalton Trans.
2007, 1284-1292.
(30) Fei, H.; Han, C. S.; Robins, J. C.; Oliver, S. R. J. Chem. Mater. 2013, 25,
647-652.
(31) Milos, M.; Hauser, A. J. Lumin. 2013, 133, 15-20.
(32) McMurtrie, J.; Dance, I. Cryst. Eng. Comm. 2005, 7, 216-229.
(33) McMurtrie, J.; Dance, I. CrystEngComm 2009, 11, 1141-1149.
(34) McMurtrie, J.; Dance, I. CrystEngComm 2010, 12, 2700-2710.
(35) Bouzaid, J.; Schultz, M.; Lao, Z.; Bartley, J.; Bostrom, T.; McMurtrie, J.
Cryst. Growth Des. 2012, 12, 3906-3916.
(36) Desiraju, G. R. Crystal Engineering: The Design of Organic Solids; Elsevier:
Amsterdam, 1989; Vol. 54.
(37) Desiraju, G. J. Chem. Sci. 2010, 122, 667–675.
(38) Desiraju, G. R. Angew. Chem. Int. Ed. 2007, 46, 8342-8356.
(39) Braga, D.; Curzi, M.; Giaffreda, S. L.; Grepioni, F.; Maini, L.; Pettersen, A.;
Polito, M. In Organic Nanostructures; Atwood, J. L., Steed, J. W., Eds.;
Wiley-VCH Verlag GmbH & Co. KGaA: 2008, p 155-177.
(40) Corey, E. J. Pure and Appl. Chem. 1967, 14, 19-37.
(41) Thalladi, V. R.; Goud, B. S.; Hoy, V. J.; Allen, F. H.; Howard, J. A. K.;
Desiraju, G. R. Chem. Commun. 1996, 401-402.
(42) Marchi-Artzner, V.; Gulik-Krzywicki, T.; Guedeau-Boudeville, M.-A.;
Gosse, C.; Sanderson, J. M.; Dedieu, J.-C.; Lehn, J.-M. Chem. Phys. Chem.
2001, 2, 367-376.
(43) Braga, D.; Grepioni, F. NATO ASI Ser., Ser. C 1999, 538, 421-441.
(44) Etter, M. C. J. Am. Chem. Soc. 1987, 109, 7786-7797.
(45) Robson, R.; Abrahams, B. F.; Batten, S. R.; Gable, R. W.; Hoskins, B. F.;
Liu, J. ACS Symp. Ser. 1992, 499, 256-273.
(46) Robson, R. Compr. Supramol. Chem. 1996, 6, 733-755.

REFERENCES
218
(47) Braga, D. Chem. Commun. 2003, 2751-2754.
(48) Dunitz, J. D. Chem. Commun. 2003, 545-548.
(49) Maddox, J. Nature 1988, 335, 201.
(50) Whitesell, J. K.; Davis, R. E.; Wong, M. S.; Chang, N. L. J. Am. Chem. Soc.
1994, 116, 523-527.
(51) Allen, F. H. Acta Cryst. 2002, B58, 380-388.
(52) Braga, D.; Grepioni, F.; Desiraju, G. R. Chem. Rev. 1998, 98, 1375-1405.
(53) Holliday, B. J.; Mirkin, C. A. Angew. Chem., Int. Ed. Engl. 2001, 40, 2022-
2043.
(54) Dunitz, J. D. Pure Appl. Chem. 1991, 63, 177-185.
(55) Gavezzotti, A. Modelling Simul. Mater. Sci. Eng. 2002, 10, R1-R29.
(56) Cotton, F. A.; Wilkinson, G.; Murillo, C. A.; Bochmann, M. Advanced
Inorganic Chemistry; 6th ed.; Wiley: New York, 1999.
(57) Steed, J. W.; Atwood, J. L. Supramolecular Chemistry; John Wiley & Sons:
Chichester, 2000.
(58) Abrahams, S. C.; Bernstein, J. L. Acta Cryst. 1965, 18, 926 - 932.
(59) Erras-Hanauer, H.; Clark, T.; van Eldik, R. Coord. Chem. Rev. 2003, 238–
239, 233-253.
(60) Diebler, H.; Eigen, M.; Ilgenfritz, G.; Maass, G.; Winkler, R. Pure Appl.
Chem 1969, 20, 93-116.
(61) Halcrow, M. A. Chem. Commun. 2010, 46, 4761-4763.
(62) Chastanet, G.; Tovee, C. A.; Hyett, G.; Halcrow, M. A.; Letard, J.-F. Dalton
Trans. 2012, 41, 4896-4902.
(63) Pointillart, F.; Train, C.; Gruselle, M.; Villain, F.; Schmalle, H. W.; Talbot,
D.; Gredin, P.; Decurtins, S.; Verdaguer, M. Chem. Mater. 2004, 16, 832-
841.
(64) von Arx, M. E.; Burattini, E.; Hauser, A.; Van Pieterson, L.; Pellaux, R.;
Decurtins, S. J. Phys. Chem. A 2000, 104, 883-893.
(65) Milos, M.; Penhouet, T.; Pal, P.; Hauser, A. Inorg. Chem. 2010, 49, 3402-
3408.
(66) Rabaste, S.; Amstutz, N.; Hauser, A.; Pillonnet, A. Appl. Phys. Lett. 2005, 87,
251904/251901-251904/251903.
(67) Steiner, T. Angew. Chem., Int. Ed. Engl. 2002, 41, 48-76.

REFERENCES
219
(68) Melendez, R. E.; Carr, A. J.; Linton, B. R.; Hamilton, A. D. Struct. Bonding
2000, 96, 31-61.
(69) Krische, M. J.; Lehn, J.-M. Struct. Bonding 2000, 96 3-29.
(70) Fyfe, M. C. T.; Stoddart, J. F. Acc. Chem. Res. 1997, 30, 393-401.
(71) Lawrence, D. S.; Jiang, T.; Levett, M. Chem. Rev. 1995, 95, 2229-2260.
(72) Aakeröy, C. B.; Seddon, K. R. Chem. Soc. Rev. 1993, 22, 397-407.
(73) Aakeröy, C. B.; Beatty, A. M.; Leinen, D. S. Angew. Chem. Int. Ed. 1999, 38,
1815-1819.
(74) MacDonald, J. C.; Dorrestein, P. C.; Pilley, M. M.; Foote, M. M.; Lundburg,
J. L.; Henning, R. W.; Schultz, A. J.; Manson, J. L. J. Am. Chem. Soc. 2000,
122, 11692-11702.
(75) Thalladi, V. R.; Smolka, T.; Gehrke, A.; Boese, R.; Sustmann, R. New J.
Chem. 2000, 24, 143-147.
(76) Ziener, U.; Breuning, E.; Lehn, J.-M.; Wegelius, E.; Rissanen, K.; Baum, G.;
Fenske, D.; Vaughan, G. Chem. Eur. J. 2000, 6, 4132-4139.
(77) MacDonald, J. C.; Dorrestein, P. C.; Pilley, M. M. Cryst. Growth Des. 2001,
1, 29-38.
(78) Halder, G. J.; Kepert, C. J.; Moubaraki, B.; Murray, K. S.; Cashion, J. D.
Science 2002, 298, 1762-1765.
(79) Ferlay, S.; Hosseini, W. Chem. Commun. 2004, 788-789.
(80) Dechambenoit, P.; Ferlay, S.; Hosseini, M. W. Cryst. Growth Des. 2005, 5,
2310-2312.
(81) Aakeröy, C. B.; Chopade, P. D. Supramol. Chem. Mol. Nanomater. 2012, 6,
2975-2992.
(82) Burrows, A. D.; Chan, C.-W.; Chowdhry, M. M.; McGrady, J. E.; Mingos, D.
M. P. Chem. Soc. Rev. 1995, 24, 329-339.
(83) Subramanian, S.; Zaworotko, M. J. Coord. Chem. Rev. 1994, 137, 357-401.
(84) Jeffery, G. A. Introduction to Hydrogen Bonding; Oxforsd University Press:
Oxford, 1997.
(85) Jeffrey, G. A.; Saenger, W. Hydrogen Bonding in Biological Structures;
Springer: Berlin, 1991.
(86) Aakeröy, C. B.; Beatty, A. M.; Leinen, D. S.; Lorimer, K. R. Chem. Commun.
2000, 935-936.

REFERENCES
220
(87) Aakeröy, C. B.; Beatty, A. M.; Lorimer, K. Mol. Cryst. Liq. Cryst. 2006, 456,
163-174.
(88) Aakeröy, C. B.; Hussain, I.; Forbes, S.; Desper, J. Cryst. Eng. Comm. 2007,
9, 46-54.
(89) Yakovchuk, P.; Protozanova, E.; Frank-Kamenetskii, M. D. Nucleic Acids
Res. 2006, 34, 564-574.
(90) Isaksson, J.; Acharya, S.; Barman, J.; Cheruku, P.; Chattopadhyaya, J.
Biochemistry 2004, 43, 15996-16010.
(91) Claessens, C. G.; Stoddart, J. F. J. Phys. Org. Chem. 1997, 10, 254-272.
(92) Dance, I.; Scudder, M. J. Chem. Soc., Dalton Trans. 1996, 3755-3769.
(93) Wang, R.; Han, L.; Xu, L.; Gong, Y.; Zhou, Y.; Hong, M.; Chan, A. S. C.
Eur. J. Inorg. Chem. 2004, 3751-3763.
(94) McMurtrie, J. Doctor of Philosophy, University of New South Wales, 2003.
(95) Dance, I. CrystEngComm 2003, 5, 208-221.
(96) Dance, I. Mol. Cryst. Liq. Cryst. 2005, 440, 265-293.
(97) Nishio, M.; M. Hirota; Umezawa, Y. The CH/π interaction: evidence, nature
and consequences; John Wiley & Sons: New York, 1998.
(98) Lightfoot, M. P.; Mair, F. S.; Pritchard, R. G.; Warren, J. E. Chem. Commun.
1999, 1945-1946.
(99) Brown, S. P.; Schnell, I.; Brand, J. D.; Mullen, K.; Spiess, H. W. J. Am.
Chem. Soc. 1999, 121, 6712-6718.
(100) Dance, I.; Scudder, M. Chem. Eur. J. 1996, 2, 481-486.
(101) Hunter, C. A. Angew. Chem., Int. Ed. Engl. 1993, 32, 1584-1586.
(102) Hunter, C. A.; Sanders, J. K. M. J. Am. Chem. Soc. 1990, 112, 5525-5534.
(103) Hunter, C. A.; Singh, J.; Thornton, J. M. J. Mol. Biol. 1991, 218, 837-846.
(104) Guckian, K. M.; Schweitzer, B. A.; Ren, R. X. F.; Sheils, C. J.; Tahmassebi,
D. C.; Kool, E. T. J. Am. Chem. Soc. 2000, 122, 2213-2222.
(105) Takahashi, H.; Tsuboyama, S.; Umezawa, Y.; Honda, K.; Nishio, M.
Tetrahedron 2000, 56, 6185-6191.
(106) Suezawa, H.; Yoshida, T.; Ishihara, S.; Umezawa, Y.; Nishio, M. Cryst. Eng.
Comm. 2003, 5, 514-518.
(107) Nishio, M. Cryst. Eng. Comm. 2004, 6, 130-158.
(108) Nishio, M. Tetrahedron 2005, 61, 6923-6950.

REFERENCES
221
(109) Mühldorf, A. V.; Engen, D. V.; Warner, J. C.; Hamilton, A. D. J. Am. Chem.
Soc. 1988, 110, 6561-6562.
(110) Waters, M. L. Curr. Opin. Chem. Biol. 2002, 6, 736-741.
(111) Janiak, C. J. Chem. Soc. Dal. Trans. 2000, 3885-3896.
(112) Burley, S. K.; Petsko, G. A. Science 1985, 229, 23-28.
(113) Ohta, K.; Yamazaki, H.; Pichierri, F.; Kawahata, M.; Yamaguchi, K.; Endo,
Y. Tetrahedron 2007, 63, 12160-12165.
(114) Hobza, P.; Zahradnik, R. Intermolecular Complexes: The Role of van der
Waals Systems in Physical Chemistry and the Biodisciplines; Elselvier: New
York, 1988.
(115) Dance, I.; Scudder, M. Dalton Trans. 1998, 1998, 1341-1350.
(116) Dance, I. G.; Scudder, M. L. J. Chem. Soc., Chem. Comm. 1995, 1039-1040.
(117) Lewis, G. R.; Dance, I. G. J. Chem. Soc., Dalton Trans. 2000, 3176-3185.
(118) Dance, I. G.; Scudder, M. L. J. Chem. Soc., Dalton Trans. 2000, 1579-1586.
(119) Russell, V. M.; Scudder, M. L.; Dance, I. G. J. Chem. Soc., Dalton Trans.
2001, 789-799.
(120) Scudder, M. L.; Dance, I. G. J. Chem. Soc., Dalton Trans. 2000, 2909-2915.
(121) Scudder, M. L.; Goodwin, H. A.; Dance, I. G. New J. Chem. 1999, 23, 695-
705.
(122) Lewis, G. R.; Dance, I. G. J. Chem. Soc., Dalton Trans. 2000, 299-306.
(123) Wells, A. F. Structural Inorganic Chemistry 5th ed.; Clarendon Press:
Oxford, 1984.
(124) Decurtins, S.; Pellaux, R.; Antorrena, G.; Palacio, F. Coord. Chem. Rev.
1999, 190-192, 841-854.
(125) Batten, S. R.; Champness, N. R.; Chen, X.-M.; Garcia-Martinez, J.;
Kitagawa, S.; Öhrström, L.; O’Keeffe, M.; Suh, M. P.; Reedijk, J.
CrystEngComm 2012, 14, 3001-3004.
(126) Batten, S. R.; Champness, N. R.; Chen, X.-M.; Garcia-Martinez, J.;
Kitagawa, S.; Öhrström, L.; O’Keeffe, M.; Suh, M. P.; Reedijk, J. Pure Appl.
Chem. 2013, 85, 1715-1724.
(127) Aakeröy, C. B.; Desper, J.; Fasulo, M.; Hussain, I.; Levin, B.; Schultheiss, N.
Cryst. Eng. Comm. 2008, 10, 1816-1821.
(128) Blagden, N.; Berry, D. J.; Parkin, A.; Javed, H.; Ibrahim, A.; Gavan, P. T.;
De Matos, L. L.; Seaton, C. C. New J. Chem. 2008, 32, 1659-1672.
REFERENCES
222
(129) Bond, A. D. Cryst. Eng. Comm. 2007, 9, 833-834.
(130) Braga, D.; Grepioni, F.; Maini, L.; Polito, M. Struct. Bonding 2009, 132, 25-
50.
(131) Desiraju, G. R. Cryst. Eng. Comm. 2003, 5, 466-467.
(132) Dunitz, J. D. Cryst. Eng. Comm. 2003, 5, 506.
(133) Zaworotko, M. J. Cryst. Growth Des. 2006, 7, 4-9.
(134) Stahly, G. P. Cryst. Growth Des. 2007, 7, 1007-1026.
(135) Stahly, G. P. Cryst. Growth Des. 2009, 9, 4212-4229.
(136) Braga, D.; Grepioni, F.; Maini, L. Chem. Commun. 2010, 46, 6232-6242.
(137) Aitipamula, S.; Banerjee, R.; Bansal, A. K.; Biradha, K.; Cheney, M. L.;
Choudhury, A. R.; Desiraju, G. R.; Dikundwar, A. G.; Dubey, R.; Duggirala,
N.; Ghogale, P. P.; Ghosh, S.; Goswami, P. K.; Goud, N. R.; Jetti, R. R. K.
R.; Karpinski, P.; Kaushik, P.; Kumar, D.; Kumar, V.; Moulton, B.;
Mukherjee, A.; Mukherjee, G.; Myerson, A. S.; Puri, V.; Ramanan, A.;
Rajamannar, T.; Reddy, C. M.; Rodriguez-Hornedo, N.; Rogers, R. D.; Row,
T. N. G.; Sanphui, P.; Shan, N.; Shete, G.; Singh, A.; Sun, C. C.; Swift, J. A.;
Thaimattam, R.; Thakur, T. S.; Kumar Thaper, R.; Thomas, S. P.; Tothadi, S.;
Vangala, V. R.; Variankaval, N.; Vishweshwar, P.; Weyna, D. R.;
Zaworotko, M. J. Cryst. Growth Des. 2012, 12, 2147-2152.
(138) Anderson, K. M.; Probert, M. R.; Whiteley, C. N.; Rowland, A. M.; Goeta, A.
E.; Steed, J. W. Cryst. Growth Des. 2009, 9, 1082-1087.
(139) Bhatt, P. M.; Azim, Y.; Thakur, T. S.; Desiraju, G. R. Cryst. Growth Des.
2009, 9, 951-957.
(140) Braga, D.; Maini, L.; Grepioni, F. Chem. Soc. Rev. 2013, 42, 7638-7648.
(141) Childs, S. L.; Zaworotko, M. J. Cryst. Growth Des. 2009, 9, 4208-4211.
(142) Desiraju, G. R. RSC Drug Discovery Series 2012, 16, 1-8.
(143) Rajput, L.; Sanphui, P.; Desiraju, G. R. Cryst. Growth Des. 2013, 13, 3681-
3690.
(144) Vishweshwar, P.; McMahon, J. A.; Bis, J. A.; Zaworotko, M. J. J Pharm Sci.
2006, 95, 499-516.
(145) Schmidt, J.; Snipes, W. Int. J. Radiat. Biol. 1968, 13, 101-109.
(146) Bott, S. G.; Fahlman, B. D.; Pierson, M. L.; Barron, A. R. J. Chem. Soc.,
Dalton Trans. 2001, 2148-2152.
(147) Sorai, M.; Ensling, J.; Gütlich, P. Chem. Phys. 1976, 18, 199-209.

REFERENCES
223
(148) Gütlich, P.; Köppen, H.; Link, R.; Steinhaeuser, H. G. J. Chem. Phys. 1979,
70, 3977-3983.
(149) Gütlich, P. Adv. Chem. Ser. 1981, 194, 405-452.
(150) Ganguli, P.; Gütlich, P. Journal de Physique, Colloque 1980, 313-314.
(151) Bode, K.; Gütlich, P.; Köppen, H. Inorg. Chim. Acta 1980, 42, 281-284.
(152) Desaix, A.; Roubeau, O.; Jeftic, J.; Haasnoot, J. G.; Boukheddaden, K.;
Codjovi, E.; Linares, J.; Nogues, M.; Varret, F. Eur. Phys. J. B 1998, 6, 183-
193.
(153) Tovee, C. A.; Kilner, C. A.; Thomas, J. A.; Halcrow, M. A. Cryst. Eng.
Comm. 2009, 11, 2069-2077.
(154) Dechambenoit, P.; Ferlay, S.; Kyritsakas, N.; Hosseini, M. W. Chem.
Commun. 2010, 46, 868-870.
(155) Spiering, H.; Meissner, E.; Köppen, H.; Müller, E. W.; Gütlich, P. Chem.
Phys. 1982, 68, 65-71.
(156) Ganguli, P.; Gütlich, P.; Müller, E. W. Inorg. Chem. 1982, 21, 3429-3433.
(157) Maeda, Y.; Tomokiyo, M.; Kitazaki, K.; Takashima, Y. Bull. Chem. Soc. Jpn.
1988, 61, 1953-1958.
(158) Constant-Machado, H.; Linares, J.; Varret, F.; Haasnoot, J. G.; Martin, J. P.;
Zarembowitch, J.; Dworkin, A.; Bousseksou, A. J. Phys. I 1996, 6, 1203-
1216.
(159) Constant, H.; Linares, J.; Shteto, I.; Despan, D.; Varret, F.; Haasnoot, J. G.;
Martin, J. P.; Zarembowitch, J. Conf. Proc. - Ital. Phys. Soc. 1996, 50, 371-
374.
(160) Balde, C.; Desplanches, C.; Wattiaux, A.; Guionneau, P.; Gütlich, P.; Letard,
J.-F. Dalton Trans. 2008, 2702-2707.
(161) Lebedev, G.; Pillet, S.; Balde, C.; Guionneau, P.; Desplanches, C.; Letard, J.
F. IOP Conf. Ser. Mater. Sci. Eng. 2009, 5, 012025/012021-012025/012029.
(162) Balde, C.; Desplanches, C.; Gütlich, P.; Freysz, E.; Letard, J. F. Inorg. Chim.
Acta 2008, 361, 3529-3533.
(163) Balde, C.; Desplanches, C.; Grunert, M.; Wei, Y.; Gütlich, P.; Letard, J.-F.
Eur. J. Inorg. Chem. 2008, 5382-5389.
(164) Paradis, N.; Chastanet, G.; Varret, F.; Letard, J.-F. Eur. J. Inorg. Chem. 2013,
2013, 968-974.

REFERENCES
224
(165) Krivokapic, I.; Chakraborty, P.; Bronisz, R.; Enachescu, C.; Hauser, A.
Angew. Chem. Int. Ed. 2010, 49, 8509-8512.
(166) Krivokapic, I.; Chakraborty, P.; Enachescu, C.; Bronisz, R.; Hauser, A. Inorg.
Chem. 2011, 50, 1856-1861.
(167) Chakraborty, P.; Enachescu, C.; Hauser, A. Eur. J. Inorg. Chem. 2013, 2013,
770-780.
(168) Zheng, S.; Siegler, M. A.; Sanchez Costa, J.; Fu, W.-T.; Bonnet, S. Eur. J.
Inorg. Chem. 2013, 2013, 1033-1042.
(169) Rotaru, A.; Dirtu, M. M.; Enachescu, C.; Tanasa, R.; Linares, J.; Stancu, A.;
Garcia, Y. Polyhedron 2009, 28, 2531-2536.
(170) Rao, P. S.; Reuveni, A.; McGarvey, B. R.; Ganguli, P.; Gütlich, P. Inorg.
Chem. 1981, 20, 204-207.
(171) Braun, D.; Gallhuber, E.; Hensler, G.; Yersin, H. Mol. Phys. 1989, 67, 417-
430.
(172) Jang, H. G.; Kaji, K.; Sorai, M.; Wittebort, R. J.; Geib, S. J.; Rheingold, A.
L.; Hendrickson, D. N. Inorg. Chem. 1990, 29, 3547-3556.
(173) Tsushima, M.; Ikeda, N.; Nozaki, K.; Ohno, T. J. Phys. Chem. A 2000, 104,
5176-5180.
(174) Tsushima, M.; Ikeda, N.; Yoshimura, A.; Nozaki, K.; Ohno, T. Coord. Chem.
Rev. 2000, 208, 299-308.
(175) Kawasaki, Y.; Forster, L. S. J. Chem. Phys. 1969, 50, 1010-1013.
(176) Piper, T. S.; Carlin, R. L. J. Chem. Phys. 1961, 35, 1809-1815.
(177) Bernheim, R. A.; Reichenbecher, E. F. J. Chem. Phys. 1969, 51, 996-1001.
(178) Hughes, J. L.; Riesen, H. J. Phys. Chem. A 2002, 107, 35-42.
(179) Lewis, M. L.; Riesen, H. J. Phys. Chem. A 2002, 106, 8039-8045.
(180) Schönherr, T.; Spanier, J.; Schmidtke, H. H. J. Phys. Chem. 1989, 93, 5969-
5972.
(181) Milos, M.; Hauser, A. J. Phys. Chem. A 2010, 114, 4169-4172.
(182) Milos, M.; Pal, P.; Hauser, A. ChemPhysChem 2010, 11, 3161-3166.
(183) Gütlich, P.; Link, R.; Steinhaeuser, H. G. Inorg. Chem. 1978, 17, 2509-2514.
(184) Iijima, S.; Koner, S.; Mizutani, F. J. Radioanal. Nucl. Chem. 1999, 239, 245-
249.
(185) Iijima, S.; Mizutani, F. Mol. Cryst. Liq. Cryst. Sci. Technol., Sect. A 1999,
335, 855-864.
REFERENCES
225
(186) Iijima, S.; Mizutani, F. Mol. Cryst. Liq. Cryst. Sci. Technol., Sect. A 2000,
343, 199-204.
(187) Iijima, S.; Mizutani, F. Mol. Cryst. Liq. Cryst. Sci. Technol., Sect. A 2002,
379, 235-240.
(188) Jung, J.; Schmitt, G.; Wiehl, L.; Hauser, A.; Knorr, K.; Spiering, H.; Gütlich,
P. Z. Phys. B: Condens. Matter 1996, 100, 523-534.
(189) Jeftic, J.; Hauser, A. J. Phys. Chem. B 1997, 101, 10262-10270.
(190) Jeftic, J.; Hinek, R.; Capelli, S. C.; Hauser, A. Inorg. Chem. 1997, 36, 3080-
3087.
(191) Hauser, A. Chem. Phys. Lett. 1993, 202, 173-178.
(192) von Arx, M. E.; Langford, V. S.; Oetliker, U.; Hauser, A. J. Phys. Chem. A
2002, 106, 7099-7105.
(193) Nakashima, S.; Dote, T.; Atsuchi, M.; Inoue, K. J. Phys. Conf. Ser. 2010,
217, 1-5.
(194) Nakashima, S.; Morita, T.; Inoue, K. Hyperfine Interact. 2012, 205, 47-50.
(195) Dote, H.; Nakashima, S. Hyperfine Interact. 2012, 205, 27-30.
(196) Martin, J.-P.; Zarembowitch, J.; Bousseksou, A.; Dworkin, A.; Haasnoot, J.
G.; Varret, F. Inorg. Chem. 1994, 33, 6325-6333.
(197) Martin, J.-P.; Zarembowitch, J.; Dworkin, A.; Haasnoot, J. G.; Codjovi, E.
Inorg. Chem. 1994, 33, 2617-2623.
(198) Chakraborty, P.; Enachescu, C.; Walder, C.; Bronisz, R.; Hauser, A. Inorg.
Chem. 2012, 51, 9714-9722.
(199) MacDonald, J. C.; Luo, T.-J. M.; Palmore, G. T. R. Cryst. Growth Des. 2004,
4, 1203-1209.
(200) Braga, D.; Paolucci, D.; Cojazzi, G.; Grepioni, F. Chem. Commun. 2001,
803-804.
(201) Dechambenoit, P.; Ferlay, S.; Kyritsakas, N.; Hosseini, M. W. Chem.
Commun. 2009, 1559-1561.
(202) Huang, H.; Li, X.; Xia, Y.; Dun, Z.; He, Y.; Liang, F. Guangxi Shifan Daxue
Xuebao, Ziran Kexueban 2009, 27, 50-53.
(203) Yang, J. Solid State Commun. 1990, 76, 1235-1237.
(204) Tiwari, A.; Gaur, N. K.; Singh, R. K. J. Phys. Chem. Solids 2010, 71, 717-
721.
(205) Petrusevski, V. M.; Sherman, W. F. J. Mol. Struct. 1993, 294, 171-174.
REFERENCES
226
(206) Shenoy, P.; Bangera, K. V.; Shivakumar, G. K. Cryst. Res. Technol. 2010, 45,
825-829.
(207) Knorr, K.; Volkmann, U. G.; Loidl, A. Phys. Rev. Lett. 1986, 57, 2544-2547.
(208) Bahadur, R. A Handbook of Precious Stones; 1 ed. India, 1943.
(209) Basun, S. A.; Meltzer, R. S.; Imbusch, G. F. J. Lumin. 2007, 125, 31-39.
(210) Imbusch, G. F. Phys. Rev. 1967, 153, 326-337.
(211) Imbusch, G. F.; Yen, W. H. In Lasers, spectroscopy, and new ideas: a tribute
to Arthur L. Schawlow; Springer-Verlag: Berlin, 1987; Vol. 54, p 248-267.
(212) Aakeröy, C. B.; Desper, J.; Fasulo, M. E. Cryst. Eng. Comm. 2006, 8, 586-
588.
(213) Aakeröy, C. B.; Desper, J.; Helfrich, B. A. Cryst. Eng. Comm. 2004, 6, 19-24.
(214) Aakeröy, C. B.; Desper, J.; Scott Benjamin, M. T. Chem. Commun. 2006,
1445-1447.
(215) Aakeröy, C. B.; Salmon, D. J. CrystEngComm 2005, 7, 439-448.
(216) Aakeroy, C. B.; Schultheiss, N.; Desper, J.; Moore, C. New J. Chem. 2006,
30, 1452-1460.
(217) Aakeröy, C. B.; Schultheiss, N. C.; Rajbanshi, A.; Desper, J.; Moore, C.
Cryst. Growth Des. 2009, 9, 432-441.
(218) Sada, K.; Inoue, K.; Tanaka, T.; Epergyes, A.; Tanaka, A.; Tohnai, N.;
Matsumoto, A.; Miyata, M. Angew. Chem. Int. Ed. 2005, 44, 7059-7062.
(219) Dabros, M.; Emery, Paul R.; Thalladi, Venkat R. Angew. Chem. Int. Ed.
2007, 46, 4132-4135.
(220) Lemmerer, A.; Adsmond, D. A.; Bernstein, J. Cryst. Growth Des. 2011, 11,
2011-2019.
(221) Lemmerer, A.; Adsmond, D. A.; Esterhuysen, C.; Bernstein, J. Cryst. Growth
Des. 2013, 13, 3935-3952.
(222) Sanner, I.; Meissner, E.; Köppen, H.; Spiering, H.; Gütlich, P. Chem. Phys.
1984, 86, 227-233.
(223) Adler, P.; Wiehl, L.; Meissner, E.; Köhler, C. P.; Spiering, H.; Gütlich, P. J.
Phys. Chem. Solids 1987, 48, 517-525.
(224) Jakobi, R.; Spiering, H.; Wiehl, L.; Gmelin, E.; Gütlich, P. Inorg. Chem.
1988, 27, 1823-1827.
(225) Köppen, H.; Meissner, E.; Wiehl, L.; Spiering, H.; Gütlich, P. Hyperfine
Interact. 1989, 52, 29-45.

REFERENCES
227
(226) Köhler, C. P.; Jakobi, R.; Meissner, E.; Wiehl, L.; Spiering, H.; Gütlich, P. J.
Phys. Chem. Solids 1990, 51, 239-247.
(227) Hauser, A.; Gütlich, P.; Spiering, H. Inorg. Chem. 1986, 25, 4245-4248.
(228) Decurtins, S.; Gütlich, P.; Hauser, A.; Spiering, H. Photochem. Photophys.
Coord. Compd. 1987, 9-15.
(229) Jung, J.; Spiering, H.; Yu, Z.; Gütlich, P. Hyperfine Interact. 1995, 95, 107-
128.
(230) Jeftic, J.; Hauser, A. Chem. Phys. Lett. 1996, 248, 458-463.
(231) Jeftic, J.; Romstedt, H.; Hauser, A. J. Phys. Chem. Solids 1996, 57, 1743-
1750.
(232) Jung, J.; Bruchhaeuser, F.; Feile, R.; Spiering, H.; Gütlich, P. Z. Phys. B
Condens. Matter 1996, 100, 517-522.
(233) Hauser, A.; Vef, A.; Adler, P. J. Chem. Phys. 1991, 95, 8710.
(234) Balde, C.; Desplanches, C.; Nguyen, O.; Letard, J.-F.; Freysz, E. J. Phys.:
Conf. Ser 2009, 148, 1-9.
(235) Varma, V.; Fernandes, J. R. Chem. Phys. Lett. 1990, 167, 367-370.
(236) Roubeau, O.; Haasnoot, J. G.; Linares, J.; Varret, F. Mol. Cryst. Liq. Cryst.
Sci. Technol., Sect. A 1999, 335, 1253-1262.
(237) Varret, F.; Boukheddaden, K.; Jeftic, J.; Roubeau, O. Mol. Cryst. Liq. Cryst.
Sci. Technol., Sect. A 1999, 335, 1273-1284.
(238) Negre, N.; Consejo, C.; Goiran, M.; Bousseksou, A.; Varret, F.; Tuchagues, J.
P.; Barbaste, R.; Askenazy, S.; Haasnoot, J. G. Physica B 2001, 294&295,
91-95.
(239) Doetschman, D. C.; McCool, B. J. Chem. Phys. 1975, 8, 1-16.
(240) Lewis, M. L.; Riesen, H. PhysChemComm 2001, 4, 133-135.
(241) Riesen, H.; Hughes, J. L. Chem. Phys. Lett. 2003, 370, 26-31.
(242) Riesen, H.; Rae, A. D. Dalton Trans. 2008, 4717-4722.
(243) Kittilstved, K. R.; Sorgho, L. A.; Amstutz, N.; Tregenna-Piggott, P. L. W.;
Hauser, A. Inorg. Chem. 2009, 48, 7750-7764.
(244) Kittilstved, K. R.; Hauser, A. J. Lumin. 2009, 129, 1493-1496.
(245) Bhattacharjee, A.; Iijima, S.; Mizutani, F.; Katsura, T.; Matsumoto, N.;
Okawa, H. Jpn. J. Appl. Phys., Part 1 1995, 34, 1521-1525.
(246) Bhattacharjee, A.; Feyerherm, R.; Steiner, M. Phys. Status Solidi A 1999,
175, 683-691.

REFERENCES
228
(247) Bhattacharjee, A.; Bhakat, D. Phys. B 2009, 404, 3448-3451.
(248) Bhattacharjee, A.; Iijima, S.; Mizutani, F. J. Magn. Magn. Mater. 1996, 153,
235-240.
(249) Bhattacharjee, A.; Iljima, S. Phys. Status Solidi A 1997, 159, 503-508.
(250) Bhattacharjee, A.; Iijima, S. J. Mater. Sci. Lett. 1999, 18, 885-887.
(251) von Arx, M. E.; Hauser, A.; Riesen, H.; Pellaux, R.; Decurtins, S. Phys. Rev.
B Condens. Matter 1996, 54, 15800-15807.
(252) Langford, V. S.; Von Arx, M. E.; Hauser, A. J. Phys. Chem. A 1999, 103,
7161-7169.
(253) Zerara, M.; Hauser, A. ChemPhysChem 2004, 5, 395-399.
(254) Milos, M.; Kairouani, S.; Rabaste, S.; Hauser, A. Coord. Chem. Rev. 2008,
252, 2540-2551.
(255) Luo, T.-J. M.; MacDonald, J. C.; Palmore, G. T. R. Chem. Mater. 2004, 16,
4916-4927.
(256) Bres, E. F.; Ferlay, S.; Dechambenoit, P.; Leroux, H.; Hosseini, M. W.;
Reyntjens, S. J. Mater. Chem. 2007, 17, 1559-1562.
(257) Olmsted, B. K.; Ferlay, S.; Dechambenoit, P.; Hosseini, M. W.; Ward, M. D.
Cryst. Growth Des. 2009, 9, 2841-2847.
(258) Furukawa, S.; Hirai, K.; Nakagawa, K.; Takashima, Y.; Matsuda, R.;
Tsuruoka, T.; Kondo, M.; Haruki, R.; Tanaka, D.; Sakamoto, H.; Shimomura,
S.; Sakata, O.; Kitagawa, S. Angew. Chem. Int. Ed. 2009, 48, 1766-1770.
(259) Furukawa, S.; Hirai, K.; Takashima, Y.; Nakagawa, K.; Kondo, M.;
Tsuruoka, T.; Sakata, O.; Kitagawa, S. Chem. Commun. 2009, 5097-5099.
(260) Dehghanpour, S.; Mahmoudi, A.; Najafi, L.; Khalafbeigi, M.; Jahani, K.
Polyhedron 2013, 53, 91-97.
(261) Bouzaid, J. Honours, Queensland University of Technology, 2007.
(262) Oxford-Diffraction Abingdon, Oxfordshire, England, 2007.
(263) Altomare, A. B., M. C.; Camalli, M.; Cascarano, G. L.; Giocovazzo, C.;
Guagliardi, A.; Moliterni, A. G. C.; Polidori, G.; Spagna, S. J. J. Appl.
Crystallogr. 1999, 32, 115.
(264) Sheldrick, G. M. Acta Crystallogr., Sect. A: Found. Crystallogr. 2008, 64,
112-124.
(265) Farrugia, L. J. J. Appl. Crystallogr. 1999, 32, 837–838.
REFERENCES
229
(266) Constable, E. C.; Lewis, J.; Liptrot, M. C.; Raithby, P. R. Inorg. Chim. Acta
1990, 178, 47-54.
(267) Moya, S. A.; Pastene, R.; Le Bozec, H.; Baricelli, P. J.; Pardey, A. J.;
Gimeno, J. Inorg. Chim. Acta 2001, 312, 7-14.
(268) Cave, G. W. V.; Raston, C. L. J. Chem. Soc., Perkin Trans. 1 2001, 3258-
3264.
(269) Schubert, U. S.; Eschbaumer, C.; Andres, P.; Hofmeier, H.; Weidl, C. H.;
Herdtweck, E.; Dulkeith, E.; Morteani, A.; Hecker, N. E.; Feldmann, J. Synth.
Met. 2001, 121, 1249-1252.
(270) Chambers, J.; Eaves, B.; Parker, D.; Claxton, R.; Ray, P. S.; Slattery, S. J.
Inorg. Chim. Acta 2006, 359, 2400-2406.
(271) McMurtrie, J.; Dance, I. Cryst. Eng. Comm. 2005, 7, 230-236.
(272) Sullivan, B. P.; Calvert, J. M.; Meyer, T. J. Inorg. Chem. 1980, 19, 1404-
1407.
(273) Constable, E. C.; Thompson, A. M. W. C. J. Chem. Soc., Dalton Trans. 1994,
1409-1418.
(274) Constable, E. C.; Thompson, A. M. W. C.; Tocher, D. A.; Daniels, M. A. M.
New J. Chem. 1992, 16, 855-867.
(275) Evans, I. P.; Spencer, A.; Wilkinson, G. J. Chem. Soc., Dalton Trans. 1973,
204-209.
(276) Zhou, Z.; Sarova, G. H.; Zhang, S.; Ou, Z.; Tat, F. T.; Kadish, K. M.;
Echegoyen, L.; Guldi, D. M.; Schuster, D. I.; Wilson, S. R. Chem. Eur. J.
2006, 12, 4241-4248.
(277) Saha, B.; Stanbury, D. M. Inorg. Chem. 2000, 39, 1294-1300.
(278) Kauffman, G. B.; Takahashi, L. T. Inorg. Syn. 1966, 8, 227-232.
(279) Morgan, G. T.; Burstall, F. H. J. Chem. Soc. 1931, 2213-2218.
(280) Brewer, B.; Brooks, N. R.; Abdul-Halim, S.; Sykes, A. G. J. Chem.
Crystallogr. 2003, 33, 651-662.
(281) Sullivan, B. P.; Salmon, D. J.; Meyer, T. J. Inorg. Chem. 1978, 17, 3334-
3341.
(282) Wang, P.; Zhu, G.; Wu, Y. Fenxi Huaxue 1998, 26, 1474-1477.
(283) Birchall, J. D.; O’Donoghue, T. D.; Wood, J. R. Inorg. Chim. Acta 1979, 37,
L461-L463.
REFERENCES
230
(284) Sun, P.; MacDonnell, F. M.; Armstrong, D. W. Inorg. Chim. Acta 2009, 362,
3073-3078.
(285) Cartledge, G. H.; Ericks, W. P. J. Am. Chem. Soc. 1936, 58, 2061.
(286) Bailar, J. C., Jr.; Jones, E. M. Inorg. Synth. 1939, 1, 35-38.
(287) Johnson, R. C. J. Chem. Educ. 1970, 47, 702.
(288) Kaziro, R.; Hambley, T. W.; Binstead, R. A.; Beattie, J. K. Inorg. Chim. Acta
1989, 164, 85-91.
(289) Coronado, E.; Galan-Mascaros, J. R.; Marti-Gastaldo, C.; Martinez, A. M.
Dalton Trans. 2006, 3294-3299.
(290) Decurtins, S.; Schmalle, H. W.; Schneuwly, P.; Ensling, J.; Gütlich, P. J. Am.
Chem. Soc. 1994, 116, 9521-9528.
(291) Morgan, G. T.; Burstall, F. H. J. Chem. Soc. 1932, 20-30.
(292) Morgan, G. T.; Burstall, F. H. J. Chem. Soc. 1934, 1498-1500.
(293) Morgan, G.; Burstall, F. H. J. Chem. Soc. 1937, 1649-1655.
(294) Figgis, B. N.; Kurcharski, E. S.; White, A. H. A. J. of Chem. 1983, 36, 1537-
1561.
(295) Kou, H.-Z.; Sato, O. Inorg. Chem. 2007, 46, 9513-9515.
(296) Oshio, H.; Spiering, H.; Ksenofontov, V.; Renz, F.; Gütlich, P. Inorg. Chem.
2001, 40, 1143-1150.
(297) Takusagawa, F.; Yohannes, P. G.; Mertes, K. B. Inorg. Chim. Acta 1986,
114, 165-169.
(298) Galet, A.; Gaspar, A. B.; Munoz, M. C.; Real, J. A. Inorg. Chem. 2006, 45,
4413-4422.
(299) Raston, C. L.; White, A. H. J. Chem. Soc., Dalton Trans. 1976, 7-12.
(300) Maslen, E. N.; Raston, C. L.; White, A. H. J. Chem. Soc., Dalton Trans.
1974, 1803-1807.
(301) Tershansy, M. A.; Goforth, A. M.; Peterson, L.; Burns, M. C.; Smith, M. D.;
zur Loye, H.-C. Solid State Sci. 2007, 9, 895-906.
(302) Luo, J.; Zhang, X.-R.; Qiu, L.-J.; Liu, B.-S.; Zhang, Z.-Y. Acta Crystallogr.,
Sect. E Struct. Rep. Online 2009, E65, m455-m456.
(303) Gaspar, A. B.; Munoz, M. C.; Niel, V.; Real, J. A. Inorg. Chem. 2001, 40, 9-
10.
(304) Scudder, M.; Dance, I. Cryst. Eng. Comm. 1999, 1, 33-35.
(305) McMurtrie, J.; Dance, I. CrystEngComm 2010, 12, 3207-3217.

REFERENCES
231
(306) Lao, Z. Honours, Queensland University of Technology, 2006.
(307) Harding, T. Honours, Queensland University of Technology, 2010.
(308) Wiberg, E.; Wiberg, N.; Holleman, A. F. Inorganic chemistry; Academic
Press: San Diego, 2001.
(309) Arriortua, M. I.; Rojo, T.; Amigo, J. M.; Germain, G.; Declercq, J. P. Acta
Crystallogr., Sect. B: Struct. Sci. 1982, 38, 1323-1324.
(310) Andrés, R.; Gruselle, M.; Malézieux, B.; Verdaguer, M.; Vaissermann, J.
Inorg. Chem. 1999, 38, 4637-4646.
(311) Decurtins, S. Spec. Publ. - R. Soc. Chem. 2000, 252, 169-184.
(312) Day, P. J. Chem. Soc., Dalton Trans. 1997, 701-705.
(313) Pilkington, M.; Decurtins, S. In Magnetism: Molecules to Materials; Wiley-
VCH 2003, p 339-356.
(314) Clement, R.; Decurtins, S.; Gruselle, M.; Train, C. Monatsh. Chem. 2003,
134, 117-135.
(315) Andres, R.; Brissard, M.; Gruselle, M.; Train, C.; Vaissermann, J.;
Malezieux, B.; Jamet, J.-P.; Verdaguer, M. Inorg. Chem. 2001, 40, 4633-
4640.
(316) Coronado, E.; Ramon Galan-Mascaros, J.; Marti-Gastaldo, C. J. Mater.
Chem. 2006, 16, 2685-2689.
(317) Herpin, P. Bull. Minéral. 1958, 81, 245-256.
(318) Junk, P. C. J. Coord. Chem. 2006, 58, 355-361.
(319) Taylor, D. Aust. J. Chem. 1978, 31, 1455-1462.
(320) Wartchow, R. Z. Kristallogr. - New Cryst. Struct. 1997, 212, 83-84.
(321) Gillard, R. D.; Laurie, S. H.; Mitchell, P. R. J. Chem. Soc. A 1969, 3006-
3011.
(322) Merrachi, E. H.; Chassagneux, F.; Mentzen, B. F. Powder Diffr. 1987, 2, 102-
103.
(323) Merrachi, E. H.; Mentzen, B. F.; Chassagneux, F. Revue de Chimie Minerale
1986, 23, 329-342.
(324) Fenn, R. H.; Graham, A. J.; Gillard, R. D. Nature 1967, 213, 1012-1013.
(325) Min, K. S.; Rhinegold, A. L.; Miller, J. S. Inorg. Chem. 2005, 44, 8433-8441.
(326) Lis, T.; Matuszewski, J. Acta Crystallogr., Sect. B 1980, B36, 1938-1940.
(327) Matuszewski, J.; Lis, T.; Jezowska-Trzebiatowska, B. Acta Crystallogr., Sect.
A 1978, 34, S132.

REFERENCES
232
(328) Delgado, G.; Mora, A. J.; Sagredo, V. Physica B 2002, 320, 410-412.
(329) van Niekerk, J. N.; Schoening, F. R. L. Acta Cryst. 1952, 5, 196-202.
(330) Okawa, H.; Matsumoto, N.; Tamaki, H.; Ohba, M. Mol. Cryst. Liq. Cryst.
1993, 233, 257-262.
(331) Coronado, E.; Galán-Mascarós, J. R.; Gómez-García, C. J.; Laukhin, V.
Nature 2000, 408, 447-449.
(332) Bénard, S.; Yu, P.; Coradin, T.; Rivière, E.; Nakatani, K.; Clément, R. Adv.
Mater. 1997, 9, 981-984.
(333) Pellaux, R.; Schmalle, H. W.; Huber, R.; Fischer, P.; Hauss, T.; Ouladdiaf,
B.; Decurtins, S. Inorg. Chem. 1997, 36, 2301-2308.
(334) Larionova, J.; Mombelli, B.; Sanchiz, J.; Kahn, O. Inorg. Chem. 1998, 37,
679-684.
(335) Tamaki, H.; Zhong, Z. J.; Matsumoto, N.; Kida, S.; Koikawa, M.; Achiwa,
N.; Hashimoto, Y.; Okawa, H. J. Am. Chem. Soc. 1992, 114, 6974-6979.
(336) Decurtins, S.; Schmalle, H. W.; Oswald, H. R.; Linden, A.; Ensling, J.;
Gütlich, P.; Hauser, A. Inorg. Chim. Acta 1994, 216, 65-73.
(337) Decurtins, S.; Schmalle, H. W.; Schneuwly, P.; Pellaux, R.; Ensling, J. Mol.
Cryst. Liq. Cryst. 1995, 273, 167-174.
(338) Decurtins, S.; Schmalle, H.; Pellaux, R. New J. Chem. 1998, 22, 117-121.
(339) Coronado, E.; Galan-Mascaros, J. R.; Gomez-Garcia, C. J.; Martinez-Agudo,
J. M. Inorg. Chem. 2001, 40, 113-120.
(340) Sieber, R.; Decurtins, S.; Stoeckli-Evans, H.; Wilson, C.; Yufit, D.; Howard,
J. A. K.; Capelli, S. C.; Hauser, A. Chem. Eur. J. 2000, 6, 361-368.
(341) Hauser, A.; von Arx, M. E.; Langford, V. S.; Oetliker, U.; Kairouani, S.;
Pillonnet, A. Top. Curr. Chem. 2004, 241, 65-96.
(342) Pointillart, F.; Train, C.; Boubekeur, K.; Gruselle, M.; Verdaguer, M.
Tetrahedron: Asymmetry 2006, 17, 1937-1943.
(343) Decurtins, S.; Pellaux, R.; Hauser, A.; Von Arx, M. E. In NATO ASI Ser.,
Ser. C 1996; Vol. 484, p 487-508.
(344) Clemente-León, M.; Coronado, E.; Martí-Gastaldoza, C.; Romero, F. M.
Chem. Soc. Rev. 2011, 40, 473-497.
(345) Decurtins, S.; Schmalle, H. W.; Pellaux, R.; Hauser, A.; Arx, M. E. v.;
Fischer, P. Synth. Met. 1997, 85, 1689-1694.

REFERENCES
233
(346) Gruselle, M.; Train, C.; Boubekeur, K.; Gredin, P.; Ovanesyan, N. Coord.
Chem. Rev. 2006, 250, 2491-2500.
(347) Riesen, H.; Hughes, J. L. Chem. Phys. Lett. 2003, 372, 563-568.
(348) Riesen, H. Coord. Chem. Rev. 2006, 250, 1737-1754.
(349) Kittilstved, K. R.; Hauser, A. Coord. Chem. Rev. 2010, 254, 2663-2676.
(350) Lahiry, S.; Kakkar, R. Chem. Phys. Lett. 1982, 88, 499-502.
(351) Mortensen, O. S. J. Chem. Phys. 1967, 47, 4215-4222.
(352) Schönherr, T. In Electronic and Vibronic Spectra of Transition Metal
Complexes II; Yersin, H., Ed.; Springer Berlin Heidelberg: 1997; Vol. 191, p
87-152.
(353) Coronado, E.; Galán-Mascarós, J. R.; Gómez-García, C. J.; Martínez-Ferrero,
E.; Almeida, M.; Waerenborgh, J. C. Eur. J. Inorg. Chem. 2005, 2005, 2064-
2070.
(354) Hernandez-Molina, M.; Lloret, F.; Ruiz-Perez, C.; Julve, M. Inorg. Chem.
1998, 37, 4131-4135.
(355) Hauser, A.; Von Arx, M. E.; Pellaux, R.; Decurtins, S. Mol. Cryst. Liq. Cryst.
Sci. Technol., Sect. A 1996, 286, 547-552.
(356) von Arx, M. E.; Hauser, A. J. Phys. Chem. A 2002, 106, 7106-7112.
(357) Kahn, O. Molecular Magnetism; 1 ed.; VCH: Weinheim, 1993.
(358) Faure, R.; Duc, G.; Deloume, J. P. Acta Crystallogr., Sect. C: Cryst. Struct.
Commun. 1986, 42, 982-984.
(359) Dalzell, B. C.; Eriks, K. J. Am. Chem. Soc. 1971, 93, 4298-4300.
(360) Okazaki, H.; Kushi, Y.; Yoneda, H. J. Am. Chem. Soc. 1985, 107, 4183-4189.
(361) Bazuev, G. V.; Korolyov, A. V. J. Magn. Magn. Mater. 2008, 320, 2262-
2268.
(362) Mohamed, M. A.; Halawy, S. A.; Salem, M. A. J. Anal. Appl. Pyrolysis 2000,
55, 55-67.
(363) Savelyev, G. G.; Medvinskii, A. A.; Shtsherinskii, V. L.; Gevlitch, L. P.;
Gavryusheva, N. I.; Pavlyukhin, Y. T.; Stepanova, L. I. J. Solid State Chem.
1975, 12, 92-101.
(364) Snow, M. R.; Butler, K. R. J. Chem. Soc. A 1971, 565-569.
(365) König, E.; Ritter, G.; Goodwin, H. A. Inorg. Chem. 1981, 20, 3677-3682.
(366) Stiefel, E. I.; Brown, G. F. Inorg. Chem. 1972, 11, 434-436.

REFERENCES
234
(367) Pellaux, R.; Decurtins, S.; Schmalle, H. W. Acta Crystallogr., Sect. C: Cryst.
Struct. Commun. 1999, 55, 1075-1079.
CSD reference code references
Section 4.1
BARRAP Scarborough, C. C.; Lancaster, K. M.; DeBeer, S.; Weyhermuller,
T.; Sproules, S.; Wieghardt, K. Inorg. Chem. 2012, 51,
3718-3732.
BEJPUB Arriortua, M. I.; Rojo, T.; Amigó, J. M.; Germain, G.; Declercq, J.
P. Acta Crystallogr., Sect. B: Struct. Sci. 1982, 38, 1323-1324.
BIKJUA Arriortua, M. I.; Rojo, T.; Amigó, J. M.; Germain, G.; Declercq, J.
P. Bull. Soc. Chim. Belg. 1982, 91, 337-338.
BINZAA Rompel, A.; Bond, A. D.; McKenzie, C. J. Acta Crystallogr., Sect.
E: Struct. Rep. Online 2004, 60, m1759-m1760.
BIYJOI Henke, W.; Kremer, S. Inorg. Chim. Acta 1982, 65, L115-L117.
BIYJOI01 Oshio, H.; Spiering, H.; Ksenofontov, V.; Renz, F.; Gütlich, P.
Inorg. Chem. 2001, 40, 1143-1150.
CAPSAN Figgis, B. N.; Kucharski, E. S.; White, A. H. Aust. J. Chem. 1983,
36, 1537-1561.
CAPXUN McMurtrie, J.; Dance, I. Cryst. Eng. Comm. 2005, 7, 230-236.
CAPYEY McMurtrie, J.; Dance, I. Cryst. Eng. Comm. 2005, 7, 230-236.
CAPYIC McMurtrie, J.; Dance, I. Cryst. Eng. Comm. 2005, 7, 230-236.
CAPYOI McMurtrie, J.; Dance, I. Cryst. Eng. Comm. 2005, 7, 230-236.
CASXID Figgis, B. N.; Kucharski, E. S.; White, A. H. Aust. J. Chem. 1983,
36, 1527-1535.
CAZJUJ Scudder, M. L.; Craig, D. C.; Goodwin, H. A. Cryst. Eng. Comm.
2005, 7, 642-649.
REFERENCES
235
DANMOU
Baker, A. T.; Goodwin, H. A. Aust. J. Chem. 1985, 38, 207-214.
FADJAW Takusagawa, F.; Yohannes, P. G.; Mertes, K. B. Inorg. Chim. Acta
1986, 114, 165-169.
FAGGOL McMurtrie, J.; Dance, I. Cryst. Eng. Comm. 2010, 12, 2700-2710.
FAGHAY McMurtrie, J.; Dance, I. Cryst. Eng. Comm. 2010, 12, 2700-2710.
GOGDIP Craig, D. C.; Scudder, M. L.; McHale, W.-A.; Goodwin, H. A.
Aust. J. Chem. 1998, 51, 1131-1140.
GOGDOV Craig, D. C.; Scudder, M. L.; McHale, W.-A.; Goodwin, H. A.
Aust. J. Chem. 1998, 51, 1131-1140.
GUHPIJ Walstrom, A. G.; Pink, M.; Yang, X.; K.G.Caulton Dalton Trans.
2009, 6001-6006.
LIDTUO Tang, L.; Yang, X.-G.; Li, D.-S.; Wang, J.-J.; Gao, X.-M.; Wang,
J.-W. Z. Kristallogr. New Cryst. Struct. 2007, 222, 59-60.
LOCREA Pyo, S.; Perez-Cordero, E.; Bott, S. G.; Echegoyen, L. Inorg.
Chem. 1999, 38, 3337-3343.
MIWQAL Misra, P.; Liao, C.-Y.; Wei, H.-H.; Mohanta, S. Polyhedron 2008,
27, 1185-1192.
NAVGEX Nayak, M.; Koner, R.; Stoeckli-Evans, H.; Mohanta, S. Cryst.
Growth Des. 2005, 5, 1907-1912.
NELKEU Valdes-Martinez, J.; Toscano, R. A.; Salazar-Mendoza, D. Acta
Crystallogr., Sect. E: Struct. Rep. Online 2001, 57, m331-m332.
OMUTUM Yan, C.; Chen, Q.; Chen, L.; Feng, R.; Shan, X.; Jiang, F.; Hong,
M. Aust. J. Chem. 2011, 64, 104-118.
PEJHOC
Galet, A.; Gaspar, A. B.; Munoz, M. C.; Real, J. A. Inorg. Chem.
2006, 45, 4413-4422.
PEJHOC01
Galet, A.; Gaspar, A. B.; Munoz, M. C.; Real, J. A. Inorg. Chem.
2006, 45, 4413-4422.
REFERENCES
236
PEJJIY Galet, A.; Gaspar, A. B.; Munoz, M. C.; Real, J. A. Inorg. Chem.
2006, 45, 4413-4422.
PEJJOE Galet, A.; Gaspar, A. B.; Munoz, M. C.; Real, J. A. Inorg. Chem.
2006, 45, 4413-4422.
QUNZAB Tovee, C. A.; Kilner, C. A.; Thomas, J. A.; Halcrow, M. A. Cryst.
Eng. Comm. 2009, 11, 2069-2077.
SIBWEF Folgado, J.-V.; Henke, W.; Allmann, R.; Stratemeier, H.; Beltrá n-
Porter, D.; Rojo, T.; Reinen, D. Inorg. Chem. 1990, 29,
2035-2042.
SUVGAR Lashgari, K.; Kritikos, M.; Norrestam, R.; Norrby, T. Acta
Crystallogr., Sect. C: Cryst. Struct. Commun. 1999, 55, 64-67.
TERPCO Raston, C. L.; White, A. H. J. Chem. Soc. Dal. Trans. 1976, 7-12.
TERPYC01 Raston, C. L.; White, A. H. J. Chem. Soc. Dal. Trans. 1976, 7-12.
TPYCOB Maslen, E. N.; Raston, C. L.; White, A. H. J. Chem. Soc. Dal.
Trans. 1974, 1803-1807.
WALVEM Kilner, C. A.; Halcrow, M. A. Dalton Trans. 2010, 39, 9008-9012.
WOWZEN Gaspar, A. B.; Munoz, M. C.; Niel, V.; Real, J. A. Inorg. Chem.
2001, 40, 9-10.
XAHFAP Constable, E. C.; Harris, K.; Housecroft, C. E.; Neuburger, M.;
Zampese, J. A. Cryst. Eng. Comm. 2010, 12, 2949-2961.
XAHLIC Baffert, C.; Romero, I.; Pecaut, J.; Llobet, A.; Deronzier, A.;
Collomb, M.-N. Inorg. Chim. Acta 2004, 357, 3430-3436.
XAJVOU McMurtrie, J.; Dance, I. Cryst. Eng. Comm. 2005, 7, 216-229.
XAJVUA McMurtrie, J.; Dance, I. Cryst. Eng. Comm. 2005, 7, 216-229.
XAMMUU
Calatayud, M. L.; Sletten, J.; Julve, M.; Castro, I. J. Mol. Struct.
2005, 741, 121-128.
REFERENCES
237
XENWAO
Oshio, H.; Spiering, H.; Ksenofontov, V.; Renz, F.; Gütlich, P.
Inorg. Chem. 2001, 40, 1143-1150.
XENWES Oshio, H.; Spiering, H.; Ksenofontov, V.; Renz, F.; Gütlich, P.
Inorg. Chem. 2001, 40, 1143-1150.
ZARNIP Baker, A. T.; Craig, D. C.; Rae, A. D. Aust. J. Chem. 1995, 48,
1373-1378.
Section 5.2.1
CROXKH Taylor, D. Aust. J. Chem. 1978, 31, 1455-1462.
DAZVUV Okazaki, H.; Kushi, Y.; Yoneda, H. J. Am. Chem. Soc. 1985, 107,
4183-4189.
DUKNOM Faure, R.; Duc, G.; Deloume, J. P. Acta Crystallogr., Sect. C:
Cryst. Struct. Commun. 1986, 42, 982-984.
GEXQOP Wartchow, R. Z. Kristallogr. - New Cryst. Struct. 1997, 212,
83-84.
ZZZCCG Matuszewski, J.; Lis, T.; Jezowska-Trzebiatowska, B. Acta
Crystallogr., Sect. A 1978, 34, S132. Lis, T.; Matuszewski, J. Acta
Crystallogr., Sect. B 1980, B36, 1938-1940.
Section 5.2.2
AXAFIO Pointillart, F.; Train, C.; Gruselle, M.; Villain, F.; Schmalle, H.
W.; Talbot, D.; Gredin, P.; Decurtins, S.; Verdaguer, M. Chem.
Mater. 2004, 16, 832-841.
CEHYUK
Lu, X.; Liu, B.; Wang, S.; Deng, Y. Inorg. Chem. Commun. 2006,
9, 403-406.

REFERENCES
238
CUFQOJ
Sieber, R.; Decurtins, S.; Stoeckli-Evans, H.; Wilson, C.; Yufit,
D.; Howard, J. A. K.; Capelli, S. C.; Hauser, A. Chem. Eur. J.
2000, 6, 361-368.
CUFROK Sieber, R.; Decurtins, S.; Stoeckli-Evans, H.; Wilson, C.; Yufit,
D.; Howard, J. A. K.; Capelli, S. C.; Hauser, A. Chem. Eur. J.
2000, 6, 361-368.
CUFRUQ Sieber, R.; Decurtins, S.; Stoeckli-Evans, H.; Wilson, C.; Yufit,
D.; Howard, J. A. K.; Capelli, S. C.; Hauser, A. Chem. Eur. J.
2000, 6, 361-368.
CUFSAX Sieber, R.; Decurtins, S.; Stoeckli-Evans, H.; Wilson, C.; Yufit,
D.; Howard, J. A. K.; Capelli, S. C.; Hauser, A. Chem. Eur. J.
2000, 6, 361-368.
CUFSAX01 Sieber, R.; Decurtins, S.; Stoeckli-Evans, H.; Wilson, C.; Yufit,
D.; Howard, J. A. K.; Capelli, S. C.; Hauser, A. Chem. Eur. J.
2000, 6, 361-368.
DAXXIJ Andrés, R.; Gruselle, M.; Malézieux, B.; Verdaguer, M.;
Vaissermann, J. Inorg. Chem. 1999, 38, 4637-4646.
DAXZIL Andrés, R.; Gruselle, M.; Malézieux, B.; Verdaguer, M.;
Vaissermann, J. Inorg. Chem. 1999, 38, 4637-4646.
DAYBAG Andrés, R.; Gruselle, M.; Malézieux, B.; Verdaguer, M.;
Vaissermann, J. Inorg. Chem. 1999, 38, 4637-4646.
FEJNIS Armentano, D.; De Munno, G.; Lloret, F.; Julve, M. Cryst. Eng.
Comm. 2005, 7, 57-66.
GENCAE Pointillart, F.; Train, C.; Boubekeur, K.; Gruselle, M.; Verdaguer,
M. Tetrahedron: Asymmetry 2006, 17, 1937-1943.
GEPTUR
Pointillart, F.; Train, C.; Boubekeur, K.; Gruselle, M.; Verdaguer,
M. Tetrahedron: Asymmetry 2006, 17, 1937-1943.

REFERENCES
239
GOLRII
Pellaux, R.; Decurtins, S.; Schmalle, H. W. Acta Crystallogr.,
Sect. C: Cryst. Struct. Commun. 1999, 55, 1075-1079.
GOLROO Pellaux, R.; Decurtins, S.; Schmalle, H. W. Acta Crystallogr.,
Sect. C: Cryst. Struct. Commun. 1999, 55, 1075-1079.
GOLRUU Pellaux, R.; Decurtins, S.; Schmalle, H. W. Acta Crystallogr.,
Sect. C: Cryst. Struct. Commun. 1999, 55, 1075-1079.
GUNFAW Coronado, E.; Galan-Mascaros, J. R.; Gomez-Garcia, C. J.;
Martinez-Agudo, J. M. Inorg. Chem. 2001, 40, 113-120.
GUNFAW01 Andres, R.; Brissard, M.; Gruselle, M.; Train, C.; Vaissermann, J.;
Malezieux, B.; Jamet, J.-P.; Verdaguer, M. Inorg. Chem. 2001, 40,
4633-4640.
HEYTIO Decurtins, S.; Schmalle, H. W.; Schneuwly, P.; Ensling, J.;
Gütlich, P. J. Am. Chem. Soc. 1994, 116, 9521-9528.
HEYTOU Decurtins, S.; Schmalle, H. W.; Schneuwly, P.; Ensling, J.;
Gütlich, P. J. Am. Chem. Soc. 1994, 116, 9521-9528.
HEYTUA Decurtins, S.; Schmalle, H. W.; Schneuwly, P.; Ensling, J.;
Gütlich, P. J. Am. Chem. Soc. 1994, 116, 9521-9528.
HISSEI Li, Y.; Zhang, Z.-X.; Li, K.-C.; Song, W.-D.; Li, Q.-S. Inorg.
Chem. Commun. 2007, 10, 1557-1560.
MIKJEW Li, P.-Z.; Lu, X.-m.; Liu, B.; Wang, S.; Wang, X.-j. Inorg. Chem.
2007, 46, 5823-5825.
PIMYUF Hernandez-Molina, M.; Lloret, F.; Ruiz-Perez, C.; Julve, M.
Inorg. Chem. 1998, 37, 4131-4135.
PNIOCO Snow, M. R.; Butler, K. R. J. Chem. Soc. A 1971, 565-569.
TUNFAJ Román, P.; Guzmán-Miralles, C.; Luque, A. J. Chem. Soc. Dal.
Trans. 1996, 3985-3989.
XAHZUD Milos, M.; Penhouet, T.; Pal, P.; Hauser, A. Inorg. Chem. 2010,
49, 3402-3408.

REFERENCES
240
YAPPAG Decurtins, S.; Schmalle, H. W.; Schneuwly, P.; Oswald, H. R.
Inorg. Chem. 1993, 32, 1888-1892.
ZUQVAI Decurtins, S.; Schmalle, H. W.; Pellaux, R.; Schneuwly, P.;
Hauser, A. Inorg. Chem. 1996, 35, 1451-1460.
ZUQVEM Decurtins, S.; Schmalle, H. W.; Pellaux, R.; Schneuwly, P.;
Hauser, A. Inorg. Chem. 1996, 35, 1451-1460.
ZUQVIQ Decurtins, S.; Schmalle, H. W.; Pellaux, R.; Schneuwly, P.;
Hauser, A. Inorg. Chem. 1996, 35, 1451-1460.
ZUQVOW Decurtins, S.; Schmalle, H. W.; Pellaux, R.; Schneuwly, P.;
Hauser, A. Inorg. Chem. 1996, 35, 1451-1460.
ZUQVUC Decurtins, S.; Schmalle, H. W.; Pellaux, R.; Schneuwly, P.;
Hauser, A. Inorg. Chem. 1996, 35, 1451-1460.

APPENDICES

APPENDIX A
241
APPENDIX A: The use of SEM-EDX for quantitative analysis
Over the past few years members of the McMurtrie group have quantitatively
characterised the co-crystals resulting from various co-crystallisation experiments
ranging from simple binary homoleptic systems to more complex heteroleptic and
different ligand combinations. Single crystal SEM-EDX was the characterisation
technique used to quantify the mole fractions of the various metals and by extension
the metal complexes in the co-crystals.
The EDX technique relies upon a high energy beam (in this case a beam of electrons)
to eject an electron within the sample from an inner atomic shell into an excited state
thereby creating a hole. This hole is then filled by an electron from an outer atomic
shell of higher energy; and the difference between the two energies of the respective
shells can be released as measurable X-rays. The number/energy of emitted X-rays
observed for any given element is different because each atomic structure is unique.
The result is a set of characteristic patterns of spectral peaks for each different
element, which can then be used for elemental analysis.
As mentioned throughout the body of this thesis SEM-EDX is a surface technique.
The thickness of the material that is analysed i.e. the X-ray excitation depth (Rx) can
be calculated using Anderson’s equation.
Rx = range (depth) over which the particular X-ray line is produced (µm)
E0 = incident beam energy (kV)
Ec = critical excitation energy for a particular X-ray line (KeV)
= sample density (g/cm3)
So for an instrument set at an incident beam energy (E0) of 20 keV to analyse a
sample with a density of 1.5 g/cm3 the value of the excitation depth (depth of X-ray
production) for the co-crystals discussed in this thesis is 4.8-5.6 µm.
)E-(E 0.064 1.68
c
1.68
0xR
APPENDIX A
242
For elemental analysis to be considered quantitative, several aspects of the technique
must be tuned in favour of the samples being analysed. The first is peak overlap,
which is a common concern with any technique. EDX distribution functions rely on
the mathematic integration of spectral peaks and the fitting of those peaks to
theoretical profiles in order to generate an elemental composition. Therefore, any
peak overlap or even lack of baseline resolution could have the potential to produce
unreliable data. An example that is particularly noteworthy for this project is the
overlap of Ru and Cl peaks and to a lesser extent Ru and P peaks, although peaks of
any element have the possibility to overlap with another, particularly if that element
has many observable bands (e.g. iodine has peaks that range from 3-5 keV).
As mentioned previously, spectral bands are a result of the perturbation of the atom’s
electronic structure that is caused by a focused beam of high energy electrons. Holes
that are created in the innermost electron shell (principal quantum number, n = 1)
give rise to either K or Kβ peaks, however those created in outer shells (n = 2 or 3)
generate lower energy L, Lβ and M, Mβ peaks. The and β represent the number of
shells, one or two respectively, traversed by the electron filling the hole. Ideally, the
perfect EDX analysis is one that uses only baseline-resolved high energy K lines. In
practice however, this is rarely possible. The instrument used throughout this
research was capable of producing accurate standardised spectra within the range of
0-10 keV and therefore throughout in this project, it was necessary to rely upon Ru
L and Lβ lines because the K peaks were well beyond the capabilities of the
instrument (19.3 keV). Issues regarding the accuracy and reproducibility of this
analysis technique using Ru L and Lβ excitation lines have already been addressed
during the candidate’s Honours project and were shown to be accurately quantitative
for samples of this type, providing the standardisation protocol was followed. Other
metals present in co-crystals analysed, (e.g. Fe, Co, Ni, Cu), have observable K
excitation lines within the spectral range specified.
In addition to the spectral hurdles discussed above, an unexpected complication
emerged when analyses of single co-crystals generated mass percent totals that were
much higher or lower than 100% and/or yielded stoichiometrically invalid data. This
is because a large proportion of the elements that constitute these materials are
APPENDIX A
243
relatively light (C, N, O, F and P). These light elements have observable K peaks at
or below 2 keV, are prone to absorption problems, which can manifest when the
specimen geometry is improperly aligned with the detector. Although it is possible to
correct for absorption, the accuracy of the analysis of low energy X-ray peaks
remains questionable. A remedy for this, which was employed in the project, was to
physically tilt the sample into the correct position. This is illustrated using the EDX
data shown in Figure A1 taken from the same area on the same co-crystal, which was
grown from a solution containing a 1:1:1:1:1 ratio of
[Fe(phen)3]2+
:[Co(phen)3]2+
:[Ni(phen)3]2+
:[Cu(phen)3]2+
: [Ru(phen)3]2+
. Using the
equation to convert the absolute At% values to relative ratios (x) the
formula of this co-crystal and every other co-crystal analysed from this batch was
found to be [Fe0.20Co0.20Ni0.20Cu0.20Ru0.20(phen)3](PF6)2 (within ± 0.02).
II
II
M
M
At%
At%
x

APPENDIX A
244
Figure A1: EDX spectra collected from the same area on the same co-crystal with the formula
[Fe0.20Co0.20Ni0.20Cu0.20Ru0.20(phen)3](PF6)2 that was grown from a solution containing a 1:1:1:1:1 ratio
of [Fe(phen)3]2+
:[Co(phen)3]2+
:[Ni(phen)3]2+
:[Cu(phen)3]2+
: [Ru(phen)3]2+
at stage tilts of (a) 0°, (b)
-5° and (c) +5°. The Raw At% and the normalised Fe:Co:Ni:Cu:Ru ratios are shown. The Raw At%
values for F and P and the F:P and P:ΣMII ratios are also shown.
[Fe0.20Co0.20Ni0.20Cu0.20Ru0.20(phen)3](PF6)2 at 0° stage tilt
Raw At% Fe:Co:Ni:Cu:Ru Ratio(Fe) 0.38 0.21(Co) 0.38 0.21(Ni) 0.36 0.20(Cu) 0.37 0.20(Ru) 0.35 0.19Σ(MII) 1.84
Raw At% F:P Ratio(F) 21.41 6.10:1(P) 3.51
P:(ΣMII) Ratio1.91:1
(a)
(b) [Fe0.20Co0.20Ni0.20Cu0.20Ru0.20(phen)3](PF6)2 at -5° stage tilt
Raw At% Fe:Co:Ni:Cu:Ru Ratio(Fe) 0.44 0.20(Co) 0.47 0.21(Ni) 0.43 0.20(Cu) 0.44 0.20(Ru) 0.42 0.19Σ(MII) 2.20
Raw At% F:P Ratio(F) 19.58 5.55:1(P) 3.53
P:(ΣMII) Ratio1.60:1
(c) [Fe0.20Co0.20Ni0.20Cu0.20Ru0.20(phen)3](PF6)2 at +5° stage tilt
Raw At% Fe:Co:Ni:Cu:Ru Ratio(Fe) 0.33 0.20(Co) 0.35 0.21(Ni) 0.33 0.20(Cu) 0.35 0.21(Ru) 0.31 0.19Σ(MII) 1.67
Raw At% F:P Ratio(F) 21.98 7.35:1(P) 2.99
P:(ΣMII) Ratio1.79:1
APPENDIX A
245
Because the co-crystals are analogues of known compounds, it is possible to use the
known chemical stoichiometry to check the validity of the data and the degree of tilt
needed. For example, for the sample whose EDX data are shown in Figure A1 it is
possible to use the F:P and P:ΣMII ratios. For the co-crystal shown in Figure A1 the
F:P and P:ΣMII ratios should be 6:1 and 2:1 respectively. However, the data shown in
Figure A1 illustrate that these ratios can change depending on the tilt of the sample
relative to the detector. More importantly to this thesis, what this data also show is
that despite the tilt, the relative ratios of the transition metals (x) remain largely
unaffected. This suggests that providing the data are within reasonable limits with
respect to stoichiometry such as the F:P ratio, the relative values obtained are reliable
and therefore are valid for quantitative use.

APPENDIX B
246
APPENDIX B: EDX analysis of the residues obtained by the evaporation of the
mother liquors for co-crystallisation experiments involving [MII
(L)3]2+
and
[MIII
(ox)3]3-
The depletion state of the various solutes at the time of co-crystal harvest is an
estimation of experimental yield and can be very crudely gauged in two ways; visual
inspection of the coloured solution and from EDX measurements taken from the
powder residues obtained by evaporating the solvent from the mother liquors.
Initially the solutions of all experiment types were intensely coloured due to the
presence of [Ru(L)3]2+
and [Cr(ox)3]3-
both of which are highly absorbing in the
visible region. As these species are consumed to form co-crystals, their
concentration in solution depletes, which according to Beer’s Law translates to a
decrease in absorbance. After 13 days, the mother liquors for the
[Ni0.47Ru0.53(bipy)3][NaCr(ox)3] system (experiment type 1) and the
[Ru(bipy)3][NaCr0.58Fe0.42(ox)3] system (experiment type 2) were nearly colourless.
It is interesting that the initial [Ru(bipy)3]2+
concentration for the latter was double
that of the former, yet the colours of the mother liquors at the time of crystal harvest
were very similar. These observations suggest that after 13 days, a large proportion
of the highly absorptive complexes had been consumed. The appearance of the
mother liquors for the remaining experiments, i.e. for experiments involving
[MII(phen)3]
2+ complexes, were visually very similar and still intensely coloured.
These observations suggest that these systems form less solid material (i.e. crystals)
than those that do not involve [MII(phen)3]
2+ and thus a large proportion of material
remains in solution.
The Ni:Ru or Cr:Fe ratios calculated from the EDX measurements from these
powdered residues cannot easily be used to gauge a co-crystallisation’s completion.
These ratios are only valid if one of the metals in the ratio is not detected (i.e. 1:0 or
0:1) or if the exact weights of the starting materials, co-crystals and the residue are
known. The latter condition must be met, as even a 0.50:0.50 initial concentration
can yield a 0.50:0.50 final concentration when only a small number of crystals are
formed with xsolid values ≠ 0.50. Weighing the crystals would unavoidably involve
the loss of some of the mother liquor, which would impact on the final weight of the
residue. Given the co-crystallisation experiments are done on a very small scale (ca.

APPENDIX B
247
20 mg), this loss would be a significant source of random error. A alternate method is
to use the known 3:1 K:MIII
ratio in K3[MIII
(ox)3] starting material(s) (MIII
= Cr, Fe)
as a basis. Since potassium is not consumed during co-crystallisation, its
concentration in the mother liquor remains constant throughout the entire
experiment. Therefore, at t0 the EDX values reflect the 3:1 K:MIII
ratio. As
co-crystallisation progresses and MIII
is consumed to form co-crystals, the amount of
MIII
gradually depletes as does its concentration relative to potassium. Theoretically,
at 100% co-crystal yield, the EDX of the powder residue would show a dominant
potassium peak but no peaks attributed to chromium and/or iron. Representative
EDX spectra of the residues obtained by evaporating the mother liquors from all six
experiment types are shown in Figure B1.
(a) Experiment type 1 Complexes in solution
Cation(s): [Ni(bipy)3]2+
[Ru(bipy)3]2+
Anion(s): [Cr(ox)3]3-
(b) Experiment type 2 Complexes in solution
Cation(s): [Ru(bipy)3]2+
Anion(s): [Cr(ox)3]3-
[Fe(ox)3]3-
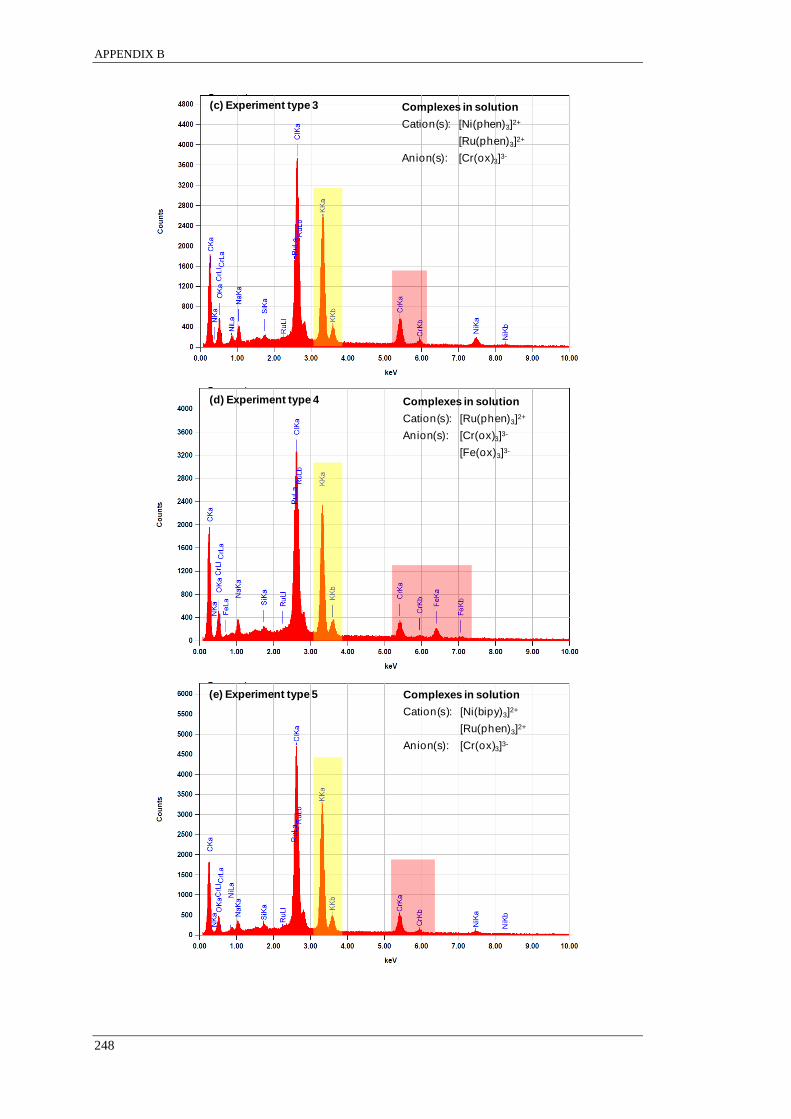
APPENDIX B
248
(c) Experiment type 3 Complexes in solution
Cation(s): [Ni(phen)3]2+
[Ru(phen)3]2+
Anion(s): [Cr(ox)3]3-
(d) Experiment type 4 Complexes in solution
Cation(s): [Ru(phen)3]2+
Anion(s): [Cr(ox)3]3-
[Fe(ox)3]3-
(e) Experiment type 5 Complexes in solution
Cation(s): [Ni(bipy)3]2+
[Ru(phen)3]2+
Anion(s): [Cr(ox)3]3-

APPENDIX B
249
Figure B1: SEM-EDX spectra measured from the power residues which were obtained by
evaporating the mother liquors to dryness from experiment types 1-6. The complexes that were in
solution are listed as insets in each spectrum.
It is serendipitous that for all six systems, the potassium peak (highlighted in yellow)
does not overlap with any other signals. Since co-crystals from each experiment were
harvested after 13 days and given that experiments seldom achieve absolute
completion, this method may be a useful way to rank the various experiment types
according to their degree of completion. Depending on the type of experiment, the
K:MIII
ratio is calculated by dividing the atomic percentage (At%) for potassium by
the At% for MIII
(chromium alone or chromium and iron combined). Table B1 lists
the experiment types in descending order according to the mean found K:MIII
ratio.
The standard deviations are also shown.
(f) Experiment type 6 Complexes in solution
Cation(s): [Ni(phen)3]2+
[Ru(bipy)3]2+
Anion(s): [Cr(ox)3]3-

APPENDIX B
250
Table B1: Ranking of experiment systems from most depleted to least depleted according to the
K:MIII
values deduced from SEM-EDX data of the powder residues. The co-crystal formula are shown
(where known).
Experiment system Co-crystal formula (where known) x̄ ± s (K:MIII
) from residue at t13days
2 [Ru(bipy)3][NaCr0.58Fe0.42(ox)3] (25.1 ± 6.7):1
1 [Ni0.47Ru0.53(bipy)3][NaCr(ox)3] (13.9 ± 1.6):1
6 [Ni(phen)3]0.20[Ru(bipy)3]0.80[NaCr(ox)3] (4.7 ± 0.8):1
5 [Ni(bipy)3]0.77[Ru(phen)3]0.23[NaCr(ox)3] (4.4 ± 0.6):1
4 Cation: [Ru(phen)3]
2+
Anions: [Cr(ox)3]3-
, [Fe(ox)3]3-
(3.6 ± 0.4):1
3 Cations: [ Ni(phen)3]
2+, [Ru(phen)3]
2+
Anion: [Cr(ox)3]3-
(3.2 ± 0.2):1
The information presented in Table B1 suggests that after 13 days, experiment types
1 and 2 had the least amount of [MIII
(ox)3]3-
remaining in the respective mother
liquors as indicated by their large K:MIII
ratios. By comparison, the systems
involving [MII(phen)3]
2+ have the smallest K:M
III ratios. This suggests that a greater
proportion of co-crystals by weight (experimental yield) are formed in systems not
involving [MII(phen)3]
2+. In other words, these results imply that the inclusion of
[MII(phen)3]
2+ hinders the progress of the experiment. This conclusion is in
agreement with the visual assessment regarding the colour intensities of the various
mother liquors at the time of co-crystal harvest.
As mentioned earlier this method is a crude estimation of co-crystallisation yield.
This is partly because of the errors associated with measuring small amounts of
material and software fitting errors for very small EDX peaks both of which are
issues when measuring these residues. The standard deviations shown in Table B1
encompass all of these errors and therefore the system with the least amount of MIII
remaining in solution and hence the largest mean K:MIII
also has the greatest
standard deviation; the opposite is true for the system with the smallest K:MIII
ratio.
Because of the standard deviations, the relatively small K:MIII
values for systems
involving [MII(phen)3]
2+ overlap. Therefore, this table divides the experiment types
into two groups, those that involve [MII(phen)3]
2+ and those that do not rather than
ranking them in a specific order.

APPENDIX C
251
APPENDIX C: PXRD of K3[CrxFe1-x(ox)3]·2.5H2O co-crystals
Figure C1: PXRD of K3[MIII
(ox)3]·2.5H2O K3 (MIII
= Cr, Fe) and [CrxFe1-x(ox)3]·2.5H2O co-crystals
(x = 0.90, 0.50, 0.10).
5 10 15 20 25 30
Position [ 2θ (Co)]
5 10 15 20 25 30
Co
un
ts
K3[Fe(ox)3]·2.5H2O
K3[Cr(ox)3]·2.5H2O
PXRD: K3[CrxFe1-x(ox)3]·2.5H2O co-crystals
xsolution = 0.90
xsolution = 0.50
xsolution = 0.10

APPENDIX D
252
APPENDIX D: Literature SCXRD refinement data for
[Fe(terpyOH)2](BF4)2·H2O, [Cu(terpyOH)2](BF4)2·H2O (CAPXUN, CAPYIC)
and experimental data for [Ni(terpyOH)2](BF4)2·H2O and
[Ru(terpy)2](BF4)2·H2O
dfs
fhjd
jgd
jfgjh
fjk
hd
kd
hk
dgk
hd
gk
dk
lhs
Hd
jhd
jgd
jfjf
jdk
gh
kgd
kg
kgjd
kjg
kjg
dglj
dlj
[F
e(te
rpyO
H) 2
](B
F4) 2
·H2O
[C
u(t
erp
yO
H) 2
](B
F4) 2
·H2O
[N
i(te
rpyO
H) 2
](B
F4) 2
·H2O
[R
u(t
erp
y) 2
](B
F4) 2
·H2O
CS
D R
efC
od
e C
AP
XU
N
CA
PY
IC
Fo
rmula
C
30H
24N
6O
3B
2F
8F
e
C3
0H
24N
6O
3B
2F
8C
u
C3
0H
24N
6O
3B
2F
8N
i C
30H
24N
6O
B2F
8R
u
M [
g m
ol-1
] 7
46
.00
75
3.7
1
74
8.8
8
75
9.2
6
T [
K]
29
3
29
3
17
3(2
) 1
73
(2)
Rad
iati
on
M
oK
Mo
K
Mo
K
Mo
K
Cry
stal
Syst
em
T
ricl
inic
M
ono
clin
ic
Mo
no
clin
ic
Tet
rago
nal
Sp
ace
Gro
up
P
1̄
P2
1
P2
1
I41/a
a [
Å]
8.6
68(5
) 8
.80
6(2
) 8
.74
15
(4)
12
.392
7(2
)
b [
Å]
9.2
78(6
) 9
.04
7(1
) 8
.97
73
(4)
12
.392
7(2
)
c [Å
] 2
0.2
14
(9)
20
.163
(4)
19
.981
6(9
) 3
9.2
66
7(1
2)
α [
°]
78
.80(4
) 9
0
90
90
β [
°]
78
.24(4
) 9
8.3
8(1
) 9
9.0
63
(4)
90
γ [°
] 8
7.9
3(3
) 9
0
90
90
V [
Å3]
15
61(1
) 1
58
9.2
(5)
15
48
.48
(12
) 6
03
0.5
(3)
Dc
[g c
m-3
] 1
.59
1.5
7
1.6
06
Z
2
2
2
4
Co
lour
purp
le
Blu
e/gre
en
b
row
n
red
Hab
it
Rec
tan
gula
r p
rism
R
ecta
ng
ula
r p
rism
R
ecta
ng
ula
r p
rism
p
late
Dim
ensi
ons
[mm
]
0
.47
× 0
.41
× 0
.17
0
.34
× 0
.17
× 0
.08
(M
oK)
[mm
-1]
0.5
70
0.7
74
0.7
19
Tm
in,m
ax
No
co
rrec
tio
n
No
Co
rrec
tio
n
0.1
71,
0.8
83
Nin
d (
Rin
t)
54
14
(0
.01
2)
30
58
(0
.01
3)
81
81
(0
.03
29
)
No
bs
- (I
> 2
(I))
4
17
4
29
72
73
35
Nvar
1
49
15
5
43
0
R1
0
.05
3a
0.0
51
a
0.0
509
b
wR
2
0.0
81
a
0.0
68
a
0.1
113
b
A,
B
0.0
2, 3
Fla
ck p
aram
eter
–
–
0
.04
4(1
4)
Go
F
1.9
5
1.2
7
1.0
85
min
,max
[e- Å
-3]
-1.1
1,
0.0
81
-0
.66
, .5
6
-0.8
00
, 0.8
10
a R
efle
cti
ons
wit
h [
I >
3
(I)]
co
nsi
der
ed o
bse
rved
. R
efle
cti
on w
eights
use
d w
ere
1/
2(F
o)
wit
h
2(F
o)
bei
ng d
eriv
ed f
rom
(I
o)
= [
2(I
o)
+
(0.0
4I o
)2]1
/2.
Rw
= (
Σw
Δ2/
Σw
F2)1
/2.
b R
efle
ctio
ns
wit
h [
I >
2
(I)]
co
nsi
der
ed o
bse
rved
. R
1 =
||F
o|
– |
Fc||/
|Fo|
for
Fo >
2
(Fo)
and
wR
2(a
ll)
=
{
[w(F
o2 –
Fc2
)2]/
[w(F
c2)2
]}1/2
w
her
e w
= 1
/[
2(F
o2)
+ (
AP
)2 +
BP
], P
= (
Fo
2 +
2F
c2)/
3.

APPENDIX E
253
APPENDIX E: SCXRD refinement data for [MII
(terpyOH)2]x[Ru(terpy)2]1-
x(BF4)2·H2O (MII
= Fe, Ni, Cu) co-crystals
S
hdjh
dgjg
jjkaj
kar
kar
yk
yrk
[F
e(te
rpyO
H) 2
] x[R
u(t
erp
y) 2
] 1-x
(BF
4) 2
·H2O
[N
i(te
rpyO
H) 2
] x[R
u(t
erp
y) 2
] 1-x
(BF
4) 2
·H2O
[C
u(t
erp
yO
H) 2
] x[R
u(t
erp
y) 2
] 1-x
(BF
4) 2
·H2O
Fo
rmula
C
30H
24N
6O
2.2B
2F
8F
e 0.6
0R
u0.4
0
C30H
24N
6O
2.2B
2F
8N
i 0.6
0R
u0.4
0
C30H
24N
6O
2B
2F
8C
u0.5
0R
u0.5
0
M [
g m
ol-1
] 7
51
.30
75
3.0
0
75
6.4
7
T [
K]
17
3(2
) 1
73
(2)
17
3(2
)
Rad
iati
on
M
oK
M
oK
Mo
K
Cry
stal
Syst
em
T
ricl
inic
M
ono
clin
ic
Mo
no
clin
ic
Sp
ace
Gro
up
P
1̄
P2
1
P2
1
a [
Å]
8.6
573
(2)
8.7
473
(2)
8.7
360
(2)
b [
Å]
9.1
018
(2)
8.9
128
0(1
0)
8.9
198
(2)
c [Å
] 2
0.1
72
6(2
) 1
9.9
01
6(4
) 1
9.8
67
8(4
)
α [
°]
79
.726
(5)
90
90
β [
°]
78
.315
(5)
99
.391
9(1
9)
98
.929
(2)
γ [°
] 8
8.3
70
(5)
90
90
V [
Å3]
15
31
.60
(6)
15
30
.79
(5)
15
29
.40
(6)
Dc
[g c
m-3
] 1
.63
9
1.6
43
1.6
43
Z
2
2
2
Co
lour
Dar
k p
urp
le
Red
D
ark r
ed
Hab
it
Rec
tan
gula
r p
rism
R
ecta
ng
ula
r p
rism
C
olu
mn
ar p
rism
Dim
ensi
ons
[mm
] 0
.20
× 0
.21
× 0
.35
0.1
2 ×
0.1
5 ×
0.4
2
0.4
0 ×
0.1
0 ×
0.0
7
(M
oK)
[mm
-1]
0.5
93
0.6
64
0.7
03
Tm
in,m
ax
0.9
864
6, 1
0.9
383
2, 1
0.9
496
5, 1
Nin
d (
Rin
t)
68
08
(0
.01
54
) 6
87
0 (
0.0
275
) 6
81
3 (
0.0
281
)
Nobs
- (I
> 2
(I))
5
93
9
62
26
58
59
Nvar
4
98
42
9
42
7
R1
a
0.0
468
0.0
487
0.0
491
wR
2 a
0.1
009
0.1
145
0.0
914
A,
B
0.0
001
, 4
0.0
5, 3
0.0
05,
4
Fla
ck p
aram
eter
–
0
.20
(2)
0.3
7(2
)
Go
F
1.0
46
1.0
11
1.0
09
min
,max
[e- Å
-3]
-0.8
70
, 0.7
91
-1
.04
5,
0.9
76
-0.7
10
, 0.8
17
a R
efle
ctio
ns
wit
h [
I >
2
(I)]
co
nsi
der
ed o
bse
rved
. R
1 =
||F
o|
– |
Fc||/
|Fo|
for
Fo >
2
(Fo)
and
wR
2(a
ll)
= {
[w(F
o2 –
Fc2
)2]/
[w(F
c2)2
]}1/2
w
here
w =
1/[
2(F
o2)
+ (
AP
)2 +
BP
], P
= (
Fo2 +
2F
c2)/
3.
hdsj
hdtg
jrjy
rajk
yrk
yrk
yark
yk

APPENDIX F
254
APPENDIX F: Additional SCXRD refinement data for co-crystals of
[Ni0.50Ru0.50(bipy)3][NaCr(ox)3], [Ni(bipy)3]0.80[Ru(phen)3]0.20[NaCr(ox)3] and
[Ni(phen)3]0.20[Ru(bipy)3]0.80[NaCr(ox)3]
[N
i 0.5
0R
u0
.50(b
ipy) 3
][N
aCr(
ox) 3
] [N
i(b
ipy) 3
] 0.8
0[R
u(p
hen
) 3] 0
.20[N
aCr(
ox) 3
] [N
i(p
hen
) 3] 0
.20[R
u(b
ipy) 3
] 0.8
0[N
aCr(
ox) 3
]
Fo
rm
ula
C
36H
24C
rN6N
aNi 0
.50O
12R
u0
.50
C
37
.20H
24C
rN6N
aNi 0
.80O
12R
u0
.20
C
37
.20H
24C
rN6N
aNi 0
.20O
12R
u0
.80
a [
Å]
15
.499
81
(16)
15
.466
4(4
) 1
5.4
64
2(3
)
V [
Å3]
37
23
.73
(7)
36
99
.68
(15
) 3
69
8.1
7(1
2)
Ch
ira
lity
[MII(b
ipy) 3
]2+
Δ
Λ
Λ
[MII(p
hen) 3
]2+
–
Δ
Δ
Bo
nd
len
gth
s [Å
]
MII
N1
2
.07
4(2
) 2
.07
1(4
) 2
.06
0(3
)
MII–
N2
2
.06
8(2
) 2
.08
3(4
) 2
.06
6(3
)
Cr–
O1
1
.96
7(2
) 1
.96
0(4
) 1
.96
2(3
)
Cr–
O2
1
.96
9(2
) 1
.96
2(4
) 1
.96
7(3
)
Na–
O3
2
.32
7(3
) 2
.31
8(4
) 2
.34
1(4
)
Na–
O4
2
.33
8(2
) 2
.34
2(4
) 2
.32
1(4
)
Bit
e a
ng
les
[°]
(Oh
: 9
0°)
[MII(b
ipy) 3
]2+ (
N1
MII
N2
) 7
8.6
6(9
) 8
0.4
5(1
5)
81
.28(1
5)
[MII(p
hen) 3
]2+ (
N1
MII
N2
′)
–
89
.51(1
5)
88
.70(1
5)
[NaC
r(o
x) 3
]2- (
O1
Cr
O2
) 8
3.5
0(8
) 8
3.7
8(1
4)
83
.48(1
4)
[Na
Cr(
ox) 3
]2- (
O3
Na
O4)
74
.11(7
) 7
3.6
8(1
3)
73
.96(1
2)
Tw
ist
an
gle
s [°
] (O
h:
60
°)
[MII(b
ipy) 3
]2+
49
.69
52
.81
5
4.1
2
[MII(p
hen) 3
]2+
–
67
.19
6
5.8
8
[NaC
r(o
x) 3
]2-
53
.24
5
3.5
7
53
.53
[Na
Cr(
ox) 3
]2-
45
.83
4
5.7
6
45
.77
s/h
(O
h:
1.2
2)
[MII(L
) 3]2
+
1.4
1
1.4
1
1.4
1
[NaC
r(o
x) 3
]2-
1.3
1
1.3
1
1.3
2
[Na
Cr(
ox) 3
]2-
1.5
0
1.5
1
1.5
0
Hel
ix a
ng
les
[°]
30
.41
30
.40
30
.40
Vo
id v
olu
me
[Å3]
3
14
.5
0
0