supporting information - royal society of chemistry · supporting information supramolecular...
TRANSCRIPT
Supporting Information
Supramolecular coordination polymers using a close to ‘V-shaped’ fluorescent 4-amino-1,8-naphthalimide Tröger’s base scaffold Sankarasekaran Shanmugaraju,*a Chris S. Hawes,a Aramballi J. Savyasachi,a Salvador Blasco,a Jonathan A. Kitchen,b and Thorfinnur Gunnlaugsson*a
aSchool of Chemistry and Trinity Biomedical Sciences Institute (TBSI), Trinity College Dublin, The University of Dublin, Dublin 2, Ireland. bChemistry, Faculty of Natural and Environmental Sciences, University of Southampton-Highfield, Southampton, SO17 1BJ, UK.
Table of Contents: Page NoExperimental Details 2→61H NMR spectrum of 1 713C NMR spectrum of 1 7HRMS spectrum of 1 81H NMR spectrum of L 813C NMR spectrum of L 9HRMS spectrum of L 9Infrared spectrum of 1 10Infrared spectrum of L 10UV-visible absorption spectra of L in different polar solvents 11Summary of UV/vis absorption and emission spectral data for L 11Histogram plot of Cl-Co-Cl angles in TB-Co-CP 12The packing of adjacent chains of complex TB-Co-CP 12X-ray powder diffraction pattern of complex TB-Co-CP 13Thermogravimetric analysis for TB-Co-CP 13Extended structure of TB-Cd-CP viewed parallel to the chain axis 14Thermogravimetric analysis for TB-Cd-CP 14X-ray powder diffraction pattern of complex TB-Cd-CP 15The solid-state CP/MAS 13C-NMR spectrum obtained from TB-Cd-CP 15SEM images of complexes TB-Co-CP and TB-Cd-CP 16Fluorescence emission spectra obtained from TB-Cd-CP in different solvents 16Crystallographic data and refinement parameters 17
Electronic Supplementary Material (ESI) for ChemComm.This journal is © The Royal Society of Chemistry 2017

2
Experimental section
Materials and methods. All reagents, solvents, and starting materials were purchased from
Sigma-Aldrich, Merck, or Fisher Scientific, were of reagent grade and were used as received.
Solvents used were HPLC grade unless otherwise stated. 4-Nitro-1,8-naphthalic anhydride, 3-
Picolylamine, Palladium on carbon (10 wt % loading), Paraformaldehyde, Trifluoroacetic acid and
all metal salts were purchased from Sigma-Aldrich and used as received. Deuterated solvent
(CD3)2SO used for NMR analyses were purchased from Sigma-Aldrich or Apollo Scientific. N-
[(3-pyridyl)methyl]-4-nitro-1,8-naphthalimide precursor was synthesized following the procedure
reported in the literature.1,2
Melting point was determined using an Electrochemical IA9000 digital melting point apparatus in
an unsealed capillary tube.
The elemental analysis for C, H and N were performed on an Exeter analytical CE-450 elemental
analyzer at University College Dublin (UCD).
FT-IR spectra were recorded in the range 4000 550 cm-1 on a Perkin-Elmer spectrometer equipped
with a universal ATR sampling accessory.
All NMR spectra were recorded on a Bruker-DPX-Avance spectrometer operating at 400/600
MHz for 1H NMR and 100/150 MHz for 13C NMR in commercially available deuterated solvent.
Chemical shifts are reported in parts-per million (ppm) relative to the internal solvent (CD3)2SO =
2.5 ppm signal. All NMR data were processed with Bruker Win-NMR 5.0, Topspin and
MestReNova softwares. Multiplicities were abbreviated as follows: singlet (s), doublet (d), doublet
of doublet (dd), triplet (t), multiplet (m).
The solid-state CP/MAS 13C-NMR spectrum of the degraded TB-Cd-CP was acquired using a 3.2
mm double-resonance MAS probe. The spectrum was acquired under magic angle spinning (MAS)
at 60 kHz, if not otherwise specified, using ramped-amplitude cross-polarization, and SPINAL64
decoupling with a 1H-decoupling field of about 80 kHz. A 3 ms contact time and a pulse delay of
5 s were used. Chemical shifts were calibrated setting the 13C low field signal of adamantane to
38.48 ppm.
APCI-ESI mass spectra were acquired on a Bruker microTOF-Q III spectrometer interfaced to a
Dionex UltiMate 3000 LC or direct insertion probe. The instrument was operated in positive or
negative mode as required. Agilent tuning mix APCI-TOF was used to calibrate the system. The
3
m/z values were recorded over a range of 100-1600. MicroTof control and HyStar software were
used to carry out the analysis. HPLC-grade CH3CN or CH3OH or DMSO were used as carrier
solvents.
Thermogravimetric analysis (TGA) were performed on an analyzer equipped with an ultra-
microbalance with a sensitivity of 0.1 μg. The temperature range was from 25°C to 800°C with a
scan rate of 10°C/min under N2 purge.
X-ray powder diffraction patterns were collected using a Bruker D2 Phaser instrument with Cu Kα
radiation (λ = 1.5418 Å). Samples were ground and mounted on silicon sample holders, and data
were collected in the 2θ range 5−55° at room temperature. The patterns were compared with those
simulated from the single-crystal data collected at 100 K
Morphological features were imaged by field-emission scanning electron microscopy (FE-SEM)
using Zeiss ULTRA Plus with an SE2 or in-lens detector in the Advanced Microscopy Laboratory,
CRANN, Trinity College Dublin. The samples for FE-SEM were prepared by drop-casting the
suspension of TB-Co-CP and TB-Cd-CP from their corresponding reaction mixture on silica
wafers, then coated with Au and dried under vacuum before the imaging.
UV-visible absorption spectra were recorded in 1 cm quartz cuvettes (Hellma) on a Varian Cary
50 spectrometer. Baseline correction was applied for all spectra.
Emission spectra were recorded on a Varian Cary Eclipse Fluorimeter. The temperature was kept
constant throughout the measurements at 298 K by using thermostated unit block. Solid-state
emission spectra were measured at room temperature with powdered samples casted on a quartz
plates.
Confocal fluorescence microscopy images of L and TB-Cd-CP were obtained using Leica SP8
STED confocal microscopy with a 40X oil immersion lens. Image analysis was performed using
FluoView Version 7.1 Software.
Synthesis and Characterization of Ligand L
N-[(3-pyridyl)methyl]-4-amino-1,8-naphthalimide (1): N-[(3-pyridyl) methyl]-4-nitro-1,8-
naphthalimide (200 mg, 0.60 mmol) was reduced by catalytic hydrogenation using Pd/C (10%,
20 mg) at 3 atm of H2 in DMF (10 mL) for 12 h. The reaction mixture was then filtered through
celite and washed several times with fresh DMF until the washings ran clear. The solvents were
removed under reduced pressure to isolate compound 1 (174 mg, 0.57 mmol, 96%) as an orange

4
solid after trituration with cold-diethyl ether. Melting point 295–297 ºC (decomp.). HRMS (APCI)
m/z: calcd for C18H14N3O2 [M+H+] 304.1086, found 304.1083; 1H NMR (400 MHz, (CD3)2SO) δ
8.65-8.60 (1H, dd, J = 8.4 Hz, Ar-H), 8.46 (1H, s, Pyridyl-H), 8.44-8.43 (1H, d, J = 4.8 Hz, Ar-H),
8.23-8.21 (1H, d, J = 8.4 Hz, Ar-H), 7.73-7.71 (1H, d, J = 8.0 Hz, Ar-H), 7.69-7.65 (1H, t, J = 8.0
Hz, Ar-H), 7.52 (2H, s, Ar-NH2), 7.34-7.30 (1H, dd, J = 7.9, 4.8 Hz, Pyridyl-H), 6.87-6.85 (1H, d,
J = 8.4 Hz, Pyridyl-H), 5.24 (2H, s, Pyridyl-CH2); 13C NMR (100 MHz, (CD3)2SO) δ 164.34,
163.34, 153.52, 149.70, 148.65, 135.89, 134.75, 134.06, 131.79, 130.32, 130.09, 124.49, 123.97,
122.01, 119.85, 108.74, 107.59, 31.13; FT-IR υmax (ATR, cm-1) 3660, 2980, 2890, 1703, 1656,
1624, 1579, 1526, 1478, 1462, 1428, 1377, 1339, 1318, 1232, 1179, 1166, 1120, 1099, 1028, 976,
955, 934, 883, 870, 829, 787, 761, 732, 713, 670, 645, 631, 612, 585, 554.
Bis-[N-(3-pyridyl)methyl)]-9,18-methano-1,8-naphthalimide-[b,f][1,5]diazocine (L):
Compound 1 (200 mg, 0.66 mmol, 1 equiv.) and paraformaldehyde (30 mg, 0.99 mmol, 1.5 equiv.)
were flushed with argon. Trifluoroacetic acid (4 mL) was added at 0°C and the solution was stirred
at room temperature for 12 h under an inert atmosphere. The reaction mixture was added dropwise
to aqueous ammonium hydroxide (100 mL) at 0°C and ammonia solution was added until a pH >
10 was achieved. Dichloromethane (2 × 200 mL) was added and the organic layer was extracted
and washed with saturated NaHCO3 (2 × 100 mL), brine (2 × 100 mL) and H2O (2 × 100 mL). The
solution was dried over MgSO4 and the solvents were removed under reduced pressure to isolate
compound L (186 mg, 0.27 mmol, 83%) as a bright yellow solid after trituration with cold-diethyl
ether. Anal. Calcd (%) for C39H26N6O4·0.4CH2Cl2: C, 69.94; H, 3.99; N, 12.42: Found C, 70.21;
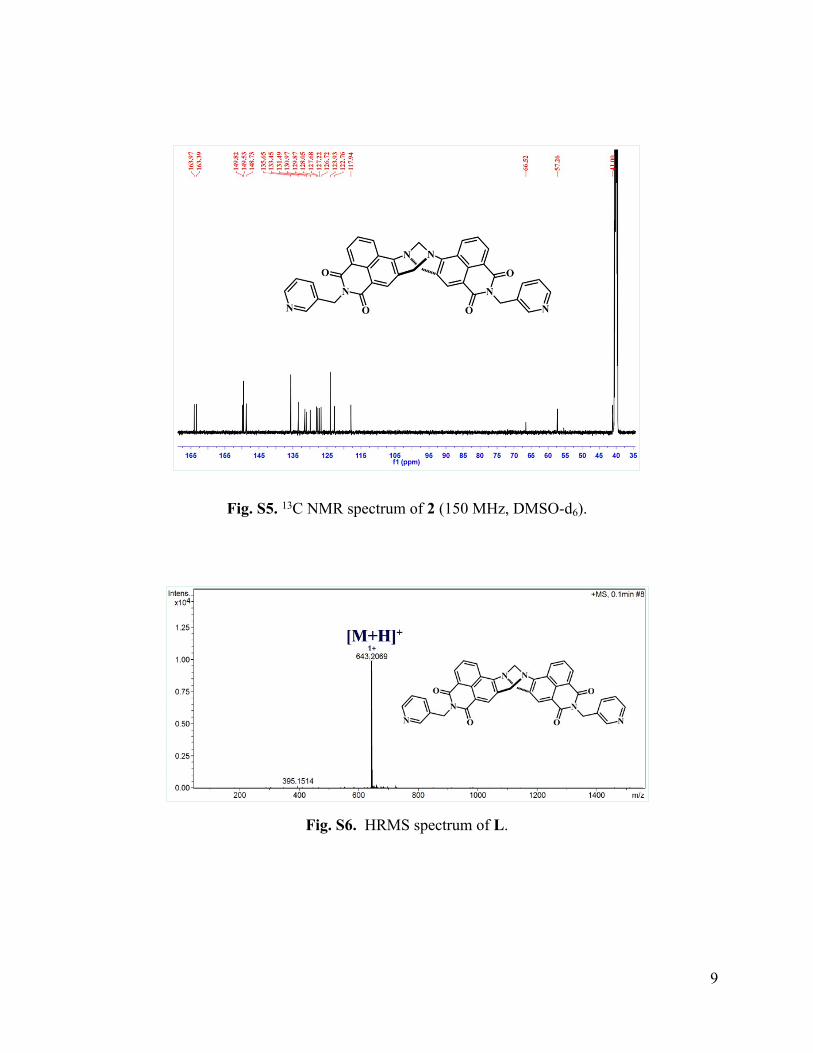
H, 3.91; N, 12.53. Melting point 283–285 ºC (decomp.). HRMS (APCI) m/z: calcd for C39H27N6O4
[M+H+] 643.2094, found 643.2069; 1H NMR (600 MHz, (CD3)2SO) δ 8.75-8.73 (2H, d, J = 8.9
Hz, Ar-H), 8.53 (2H, s, Pyridyl-H), 8.49-8.48 (2H, d, J = 7.3 Hz, Ar-H), 8.40-8.39 (2H, d, J = 6.2
Hz, Pyridyl-H), 8.13 (2H, s, Ar-H), 8.00-7.93 (2H, m, Ar-H), 7.64-7.62 (2H, d, J = 8.0 Hz, Pyridyl-
H), 7.26-7.23 (2H, dd, J = 7.9, 4.8 Hz, Pyridyl-H), 5.17 (4H, s, Pyridyl-CH2), 5.18-5.15 (2H, d, J
= 17.4 Hz, NCH2), 4.72 (2H, s, NCH2), 4.68-4.65 (2H, d, J = 17.4 Hz, NCH2); 13C NMR (150
MHz, (CD3)2SO) δ 163.97, 163.39, 149.82, 149.53, 148.73, 135.65, 133.45, 131.48, 130.97,
129.87, 128.05, 127.68, 127.22, 126.71, 123.93, 122.76, 117.94, 66.52, 57.26, 4100; FT-IR υmax
(ATR, cm-1) 3038, 2156, 1971, 1702, 1654, 1624, 1594, 1581, 1517, 1478, 1460, 1428, 1405,
1378, 1335, 1319, 1231, 1180, 1168, 1120, 1098, 1027, 975, 934, 869, 828, 786, 761, 732, 711,
674, 630, 613,586.
5
poly-[CoCl2(L)].2.666 H2O (TB-Co-CP): Compound L (20 mg, 29.6 μmol) and cobalt(II)
chloride hexahydrate (7.0 mg, 29.6 μmol) were combined in 2 mL of DMF. The mixture was
briefly sonicated, capped, and heated at 100°C for 48 h. Green-rod shaped crystals were isolated
by filtration, washed with fresh DMF (2 × 2 mL) and dried in air. Yield: 8 mg (41%). Anal. Calcd
(%) for C39H26N6O4Cl2Co·2⅔H2O: C, 57.09; H, 3.85; N, 10.24: Found C, 56.84; H, 3.61; N, 10.63.
FT-IR υmax (ATR, cm-1) 2980, 1695, 1648, 1617, 1596, 1569, 1510, 1484, 1457, 1436, 1401, 1373,
1350, 1334, 1314, 1257, 1232, 1169, 1156, 1130, 1104, 1088, 1051, 1026, 966, 913, 871, 844,
812, 792, 782, 767, 757, 711, 703, 689, 668, 660, 621, 591, 580, 569, 555.
poly-[Cd(L)2(NO3)0.5(H2O)1.5].1.5(NO3)·4CH2Cl2 (TB-Cd-CP): Compound L (20 mg, 29.6
μmol) and cadmium(II) nitrate tetrahydrate (9.1 mg, 29.6 μmol) were combined in a mixture of
CH2Cl2-CH3OH-CH3CN (3 mL in 1:1:1 volume ratio) and the mixture was kept for slow
evaporation at room temperature. After 72 hours, yellow block shaped crystals of the product were
isolated by filtration, washed with CH3CN (2 × 3 mL) and dried in air. Yield: 11 mg (55%). Anal.
Calcd (%) for C78H52N14O14Cd.1.5H2O·4CH2Cl2: C, 52.15; H, 3.36; N, 10.38: Found C, 51.73; H,
2.91; N, 10.68. CP-MAS 13C-NMR: δC (400 MHz) 163, 149, 132, 126, 121, 117, 66, 57, 40. FT-IR
υmax (ATR, cm-1) 3064, 2981, 2159, 1968, 1701, 1656, 1622, 1595, 1580, 1516, 1478, 1460, 1428,
1405, 1378, 1337, 1318, 1257, 1230, 1181, 1169, 1120, 1099, 1027, 976, 935, 914, 870, 828, 787,
761, 733, 711, 670, 630, 610, 586, 554, 529.
X-Ray Crystallography
All diffraction data were collected with a Bruker Apex-II Duo instrument using microfocus Cu Kα
radiation (λ = 1.54178 Å, TB-Co-CP) or graphite-monochromated Mo Kα radiation (λ = 0.71073
Å, TB-Cd-CP). All data collections were carried out at 120 K or 100 K with sample temperature
maintained using a Cobra cryostream. Data collection and processing were carried out using the
Bruker APEX-3 suite of programs3 with multi-scan absorption corrections applied using
SADABS.4 All data were solved on F2 using SHELXT within the OLEX-2 software package,5,6
and refined using full-matrix least squares procedures with SHELXL-2014.7 The functions
minimized were Σw(F2o-F2
c), with w=[σ2(F2o)+aP2+bP]-1, where P=[max(Fo)2+2F2
c]/3. All non-
hydrogen atoms were refined with anisotropic displacement parameters. Hydrogen atoms were
placed in calculated positions and refined with a riding model, with Ueq equal to 1.2 or 1.5 times
the isotropic equivalent of the carrier atom, where appropriate. For both structures, the SQUEEZE
routine within PLATON was employed8,9 to provide more representative refinement statistics for
6
the framework atoms in the presence of large areas of diffuse electron density, which was identified
using supporting methods (see text). In the case of TB-Cd-CP, significant disorder was present
involving the coordinating and non-coordinating nitrate anions, and these were modelled in
chemically representative positions using Uij and position/distance restraints and constraints as
necessary to provide a chemically sensible model. The mixed nitrato/aqua coordination of Cd2 was
modelled with two site-shared oxygen atoms (total occupancy 1.0), constrained with x, y, z and
Uij equal, representing a statistical mixture of substitution throughout the crystal. Hydrogen atoms
for the aqua ligands in this structure could not be sensibly modelled, but were nonetheless included
in the moiety formula. Specific refinement strategies are outlined in the combined crystallographic
(CCDC: 1568817 1568818) information file.
References:
1. J. I. Lovitt. C. S. Hawes, A. D. Lynes, B. Haffner, M. E. Mobius and T. Gunnlaugsson. T, Inorg. Chem. Front., 2017, 4, 296-308.
2. H. Shaki, K. Gharanjig, S. Rouhani and A. Khosravi. J. Photochem. Photobiol. A., 2010, 216, 44-50.
3. Bruker APEX-3, Bruker-AXS Inc., Madison, WI, 2016.
4. SADABS, Bruker-AXS Inc., Madison, WI, 2016.
5. G. M. Sheldrick, Acta Crystallogr. Sect. A. 2015, 71, 3-8.
6. G. M. Sheldrick, Acta Crystallogr. Sect. C. 2015, 71, 3-8.
7. O. V. Dolomanov, L. J. Bourhis, R. J. Gildea, J. A. K. Howard and H. Puschmann, J. Appl. Cryst. 2009, 42, 339-341.
8. A. L. Spek, Acta Crystallogr. Sect. C. 2015, 71, 9-18.
9. A. L. Spek, Acta Crystallogr. Sect. D. 2009, 65, 148-155.

7
Fig. S1. 1H NMR spectrum of 1 (400 MHz, DMSO-d6).
Fig. S2. 13C NMR spectrum of 1 (100 MHz, DMSO-d6).

8
Fig. S3. HRMS spectrum of 1.
Fig. S4. 1H NMR spectrum of L (600 MHz, DMSO-d6).
9
Fig. S5. 13C NMR spectrum of 2 (150 MHz, DMSO-d6).
Fig. S6. HRMS spectrum of L.

10
Fig. S7. Infrared spectrum of 1.
Fig. S8. Infrared spectrum of L.
11
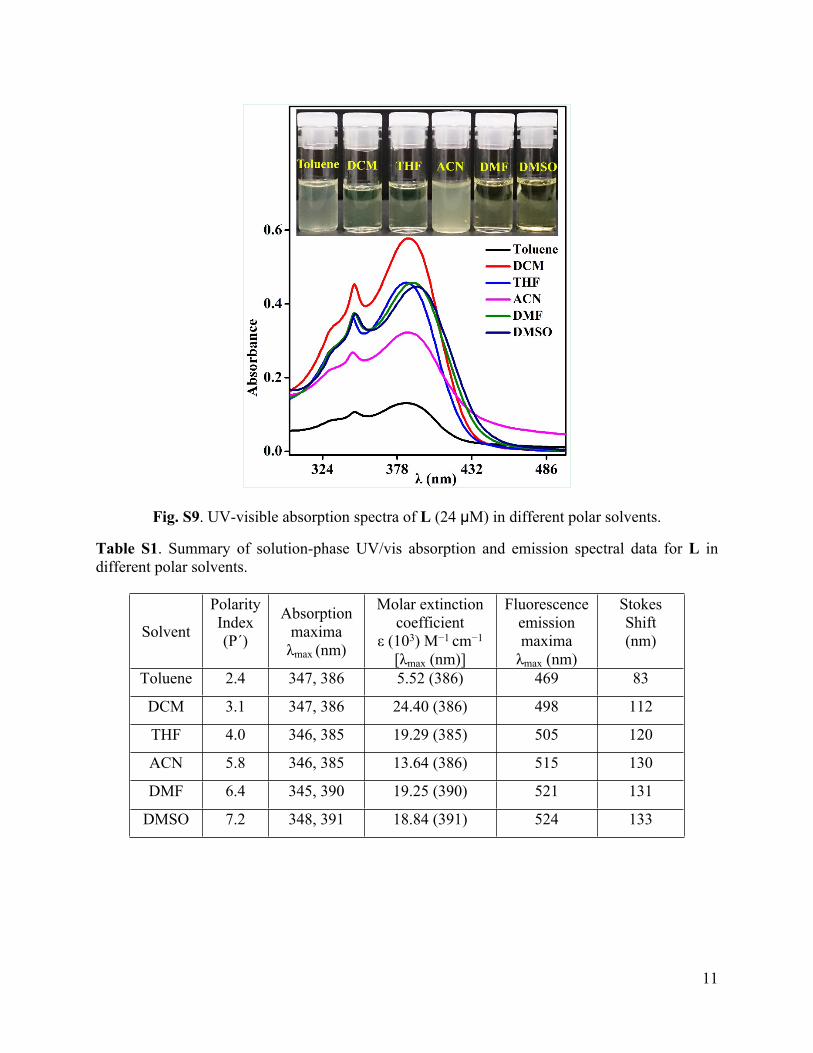
Fig. S9. UV-visible absorption spectra of L (24 µM) in different polar solvents.
Table S1. Summary of solution-phase UV/vis absorption and emission spectral data for L in different polar solvents.
Solvent
PolarityIndex (P´)
Absorptionmaxima
λmax (nm)
Molar extinctioncoefficient
ε (103) M−1 cm−1
[λmax (nm)]
Fluorescenceemission maxima
λmax (nm)
Stokes Shift (nm)
Toluene 2.4 347, 386 5.52 (386) 469 83
DCM 3.1 347, 386 24.40 (386) 498 112
THF 4.0 346, 385 19.29 (385) 505 120
ACN 5.8 346, 385 13.64 (386) 515 130
DMF 6.4 345, 390 19.25 (390) 521 131
DMSO 7.2 348, 391 18.84 (391) 524 133
12
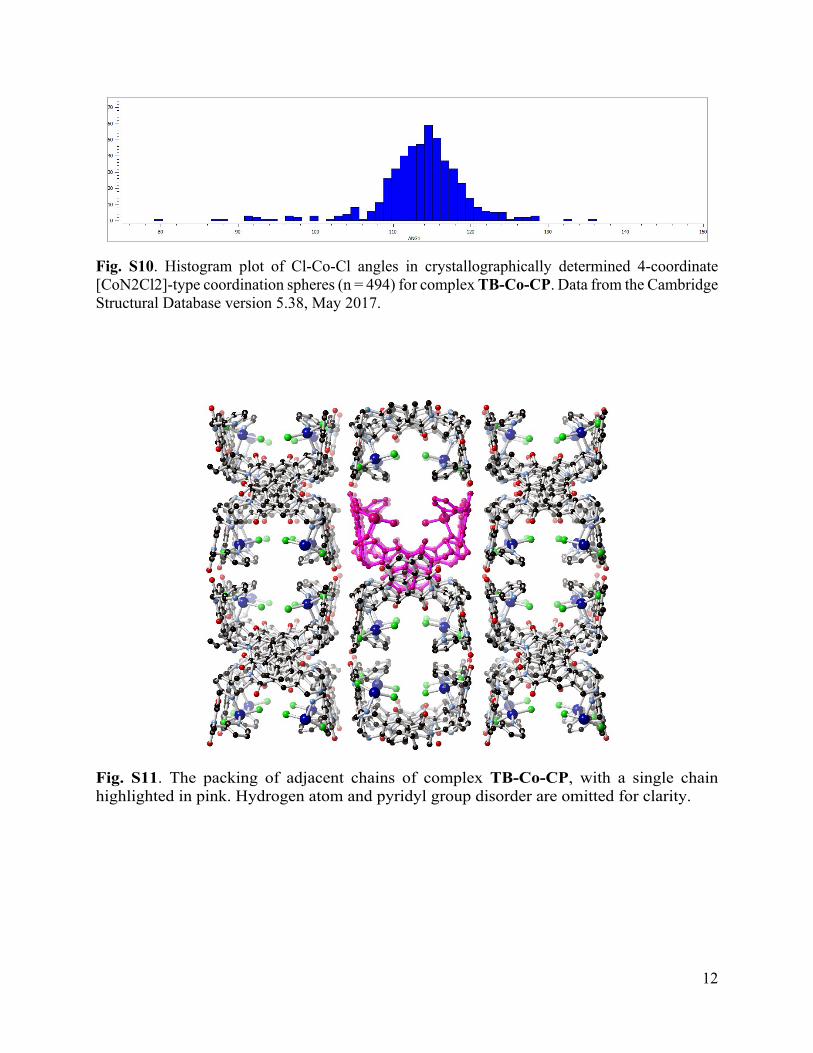
Fig. S10. Histogram plot of Cl-Co-Cl angles in crystallographically determined 4-coordinate [CoN2Cl2]-type coordination spheres (n = 494) for complex TB-Co-CP. Data from the Cambridge Structural Database version 5.38, May 2017.
Fig. S11. The packing of adjacent chains of complex TB-Co-CP, with a single chain highlighted in pink. Hydrogen atom and pyridyl group disorder are omitted for clarity.
13
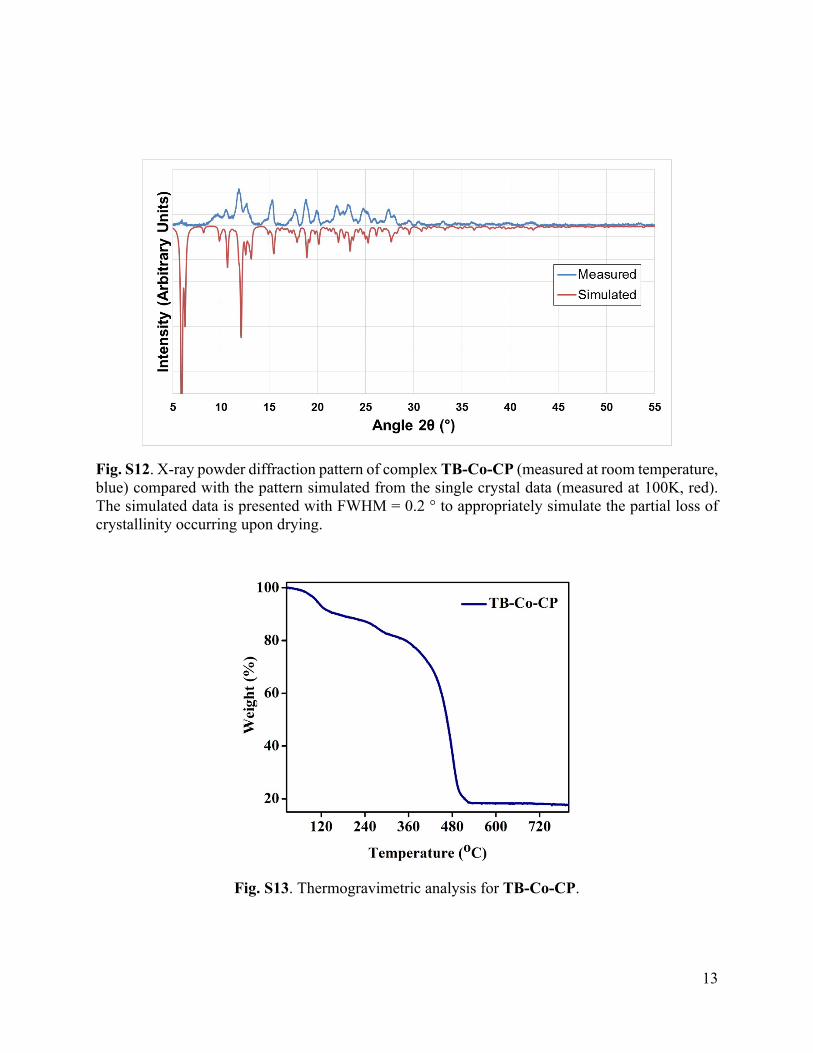
Fig. S12. X-ray powder diffraction pattern of complex TB-Co-CP (measured at room temperature, blue) compared with the pattern simulated from the single crystal data (measured at 100K, red). The simulated data is presented with FWHM = 0.2 ° to appropriately simulate the partial loss of crystallinity occurring upon drying.
Fig. S13. Thermogravimetric analysis for TB-Co-CP.

14
Fig. S14. Extended structure of TB-Cd-CP viewed parallel to the chain axis, showing interaction between adjacent chains and the associated solvent channels, with a single chain highlighted. All hydrogen atoms are omitted for clarity.
Fig. S15. Thermogravimetric analysis for TB-Cd-CP.

15
Fig. S16. X-ray powder diffraction pattern of complex TB-Cd-CP (measured at room temperature, blue) compared with the pattern simulated from the single crystal data (measured at 100 K, red), showing the loss of crystallinity accompanying the drying process.
Fig. S17. (A) The solid-state (CP-MAS, 400 MHz) 13C NMR spectrum obtained after drying a sample of TB-Cd-CP. (B) The 13C NMR (DMSO-d6, 600 MHz) spectrum of L.
16
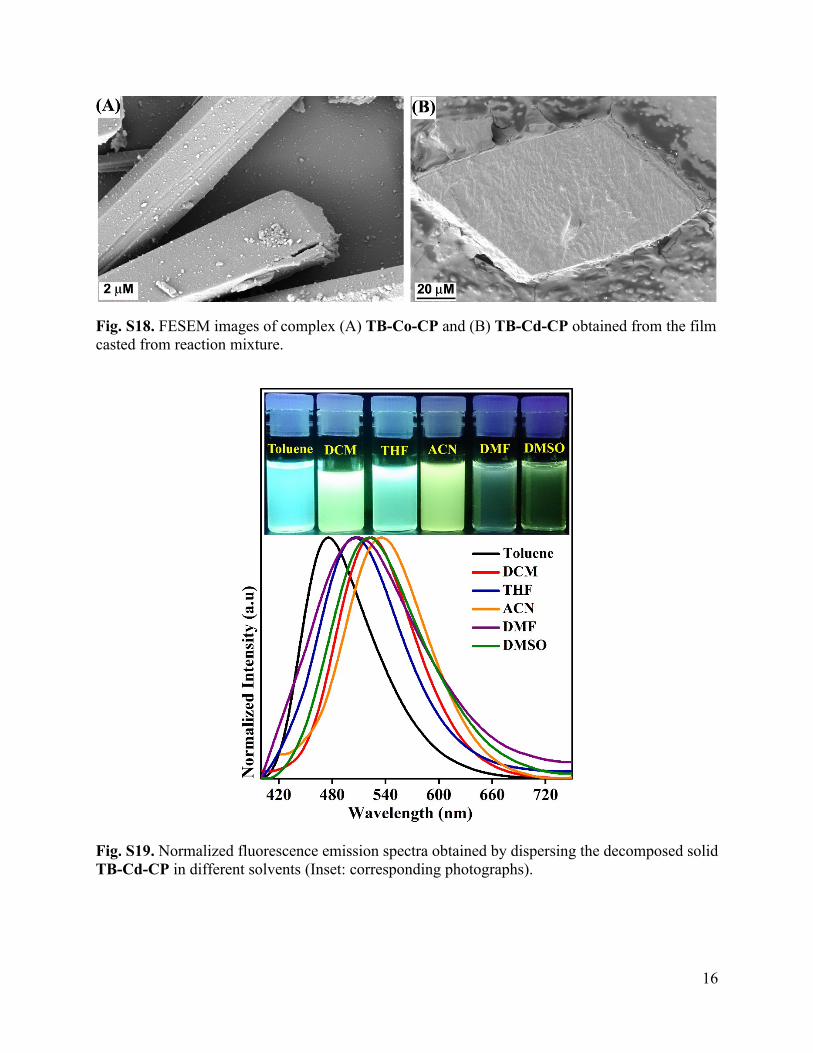
Fig. S18. FESEM images of complex (A) TB-Co-CP and (B) TB-Cd-CP obtained from the film casted from reaction mixture.
Fig. S19. Normalized fluorescence emission spectra obtained by dispersing the decomposed solid TB-Cd-CP in different solvents (Inset: corresponding photographs).
17
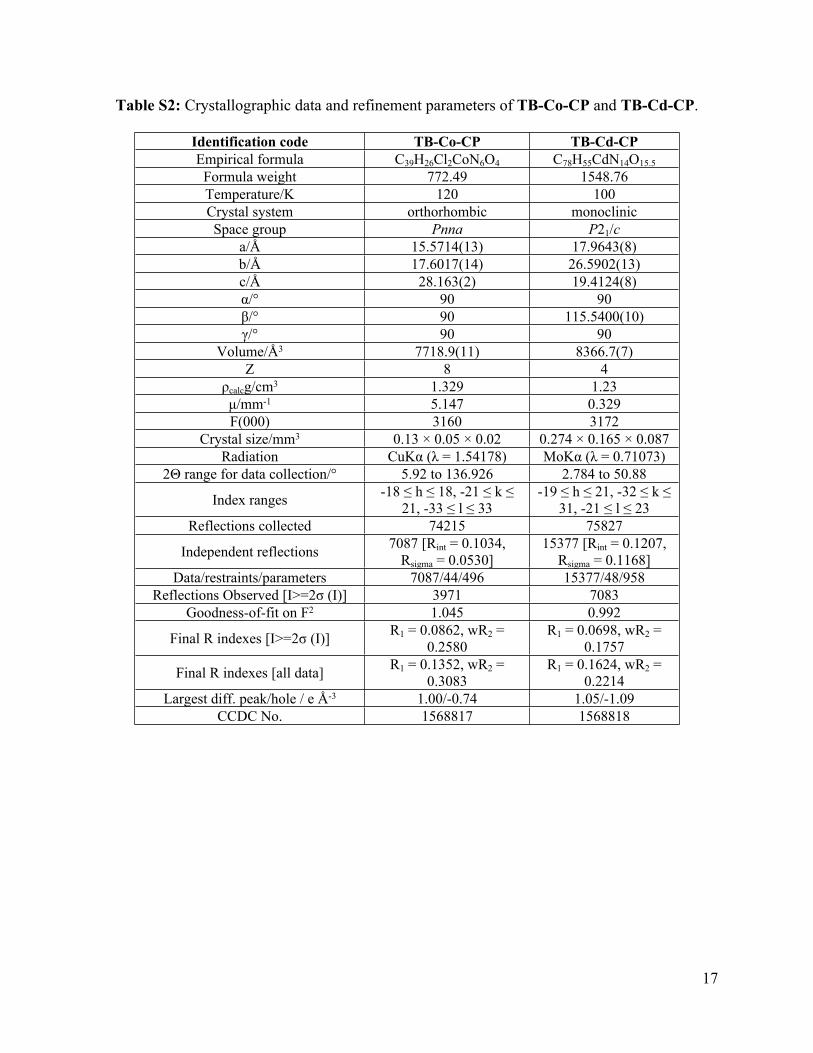
Table S2: Crystallographic data and refinement parameters of TB-Co-CP and TB-Cd-CP.
Identification code TB-Co-CP TB-Cd-CPEmpirical formula C39H26Cl2CoN6O4 C78H55CdN14O15.5
Formula weight 772.49 1548.76Temperature/K 120 100Crystal system orthorhombic monoclinicSpace group Pnna P21/c
a/Å 15.5714(13) 17.9643(8)b/Å 17.6017(14) 26.5902(13)c/Å 28.163(2) 19.4124(8)α/° 90 90β/° 90 115.5400(10)γ/° 90 90
Volume/Å3 7718.9(11) 8366.7(7)Z 8 4
ρcalcg/cm3 1.329 1.23μ/mm-1 5.147 0.329F(000) 3160 3172
Crystal size/mm3 0.13 × 0.05 × 0.02 0.274 × 0.165 × 0.087Radiation CuKα (λ = 1.54178) MoKα (λ = 0.71073)
2Θ range for data collection/° 5.92 to 136.926 2.784 to 50.88
Index ranges -18 ≤ h ≤ 18, -21 ≤ k ≤ 21, -33 ≤ l ≤ 33
-19 ≤ h ≤ 21, -32 ≤ k ≤ 31, -21 ≤ l ≤ 23
Reflections collected 74215 75827
Independent reflections 7087 [Rint = 0.1034, Rsigma = 0.0530]
15377 [Rint = 0.1207, Rsigma = 0.1168]
Data/restraints/parameters 7087/44/496 15377/48/958Reflections Observed [I>=2σ (I)] 3971 7083
Goodness-of-fit on F2 1.045 0.992
Final R indexes [I>=2σ (I)] R1 = 0.0862, wR2 = 0.2580
R1 = 0.0698, wR2 = 0.1757
Final R indexes [all data] R1 = 0.1352, wR2 = 0.3083
R1 = 0.1624, wR2 = 0.2214
Largest diff. peak/hole / e Å-3 1.00/-0.74 1.05/-1.09CCDC No. 1568817 1568818