supporting information for - amazon s3 · supporting information for: ... opc. all titra rves for...
TRANSCRIPT

S1
Supporting Information for:
Polyarginine Interacts more Strongly and Cooperatively than Polylysine
With Phospholipid Bilayers
Aaron D. Robison1, Simou Sun3, Matthew F. Poyton3, Gregory A. Johnson2, Jean‐Philippe Pellois1,2, Pavel
Jungwirth5,6*, Mario Vazdar7,6*, Paul S. Cremer3,4*
June 3, 2016
1Department of Chemistry, 2Department of Biochemistry and Biophysics, Texas A&M University,
College Station, TX, 77843
3Department of Chemistry, 4Department of Biochemistry and Molecular Cell Biology, The Pennsylvania
State University, University Park, Pennsylvania 16802, United States
5Institute of Organic Chemistry and Biochemistry, Academy of Sciences of the Czech Republic,
Flemingovo nám. 2, 16610 Prague 6, Czech Republic
6Department of Physics, Tampere University of Technology, P.O. Box 692, FI‐33101 Tampere, Finland
7Division of Organic Chemistry and Biochemistry, Rudjer Bošković Institute, P.O.B. 180, HR‐10002
Zagreb, Croatia
*E‐mail: [email protected], [email protected], and [email protected]

S2
Separation of rhodamine‐B isomers. Mixed isomers of rhodamine B POPE were separated into the pH‐
sensitive, ortho‐, and insensitive, para‐isomers via thin layer chromatography (TLC). To do this, the
mixed isomers were dissolved in chloroform and spotted onto a TLC plate (EMD, 5715‐7, silica gel 60
F254) and developed with a mixture of ammonium hydroxide solution and n‐propanol in a volume ratio
of 35:65.
Peptide synthesis. The amino acids, Fmoc‐Lys(Boc)‐OH and Fmoc‐Arg(Pbf)‐OH, were used to synthesize
H2N‐KKKKKKKKK‐NH2 (Lys9) and H2N‐RRRRRRRRR‐NH2 (Arg9) by traditional Fmoc solid phase synthesis
methods. Rink amide MBHA resin was used to obtain a C‐terminal amide. Amino acid coupling reactions
were performed in glass synthesis vessels with N2 bubbling for agitation. Deprotection of the resin by
removal of the Fmoc group was performed by addition of 20% piperidine in DMF. This reaction was
performed a first time for 5 min, followed by a DMF wash, then a second time for 15 min, also followed
by a DMF wash. Subsequent additions of amino acids were carried out in sequential coupling reactions.
Each coupling reaction consisted of the Fmoc‐amino acid, HBTU, and DIEA (4, 3.9, and 10‐fold molar
equivalent to resin amino groups, respectively) in DMF for 4 hrs. After each coupling reaction, the resin
was washed with DMF, followed by Fmoc deprotection (same as above) for the next coupling reaction.
After completion of the peptide sequences, the N‐terminal Fmoc group was deprotected and the
peptide was cleaved from the resin. The peptide cleavage reaction was performed with TFA containing
2.5% H2O and 1% triisopropylsilane for 2 hr in order to remove all side chain protecting groups and to
cleave the peptide from the resin. Crude peptide in the resulting TFA solution was then washed with
cold anhydrous ethyl ether to induce peptide precipitation. After three washes of ethyl ether, the ether
was poured off and the crude peptides were dissolved in acetonitrile and lyophilized. Lys9 and Arg9 were
purified by reversed phase C18 HPLC and their masses were confirmed by MALDI‐TOF. The Lys9 expected
mass was 1170.58 amu and its observed mass was 1170.96 amu, while Arg9 has an expected mass of
1422.70 amu and the observed mass was 1422.74 amu.
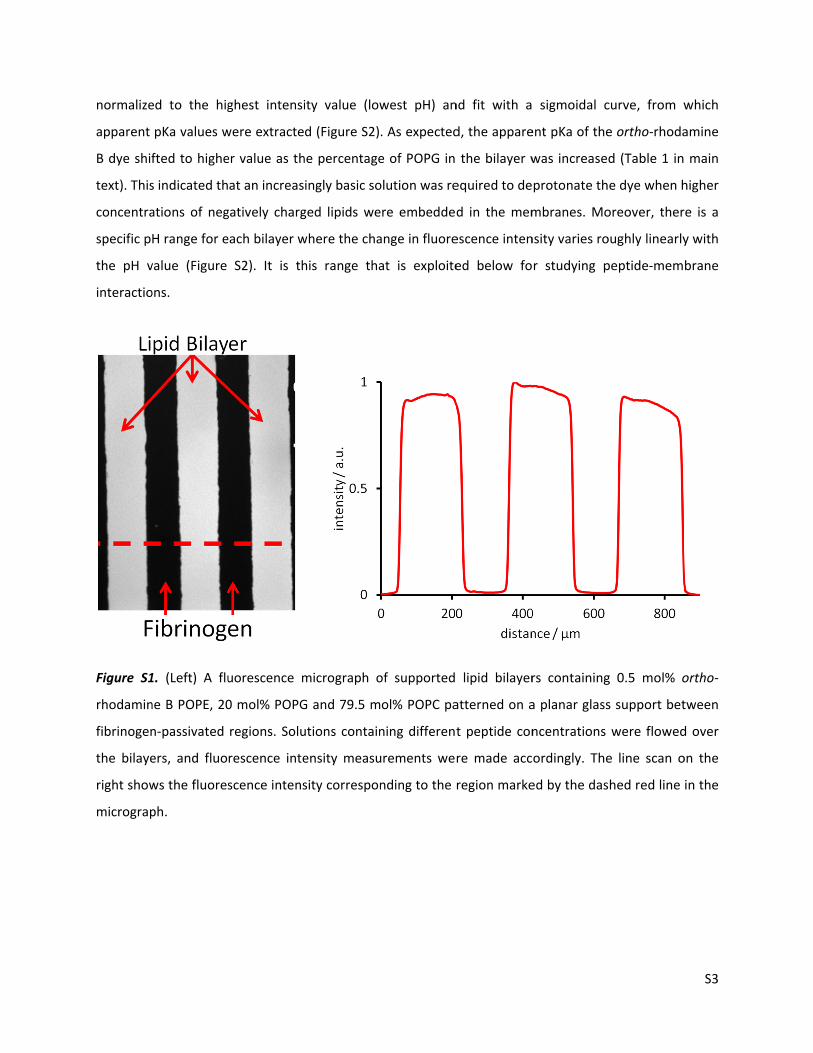
pH Titration Curves. Supported lipid bilayers containing 0.5 mol% ortho‐rhodamine B and varying
amounts of POPC and POPG were formed within flow cell devices. Excess vesicles were then flushed
away with 10 mM PBS with 150 mM NaCl at different pH values. The fluorescence signal from the
bilayers was monitored and measured after stabilization. A sample fluorescence micrograph and its
corresponding linescan are shown in Figure S1. These measurements were used to form titration curves
of the pH sensitive dye as a function of the POPG concentration in the bilayer. The data points were
normalize
apparent
B dye shif
text). This
concentra
specific p
the pH v
interactio
Figure S1
rhodamin
fibrinogen
the bilaye
right show
micrograp
ed to the hig
pKa values w
fted to highe
s indicated th
ations of neg
H range for e
value (Figure
ons.
1. (Left) A flu
ne B POPE, 20
n‐passivated
ers, and fluo
ws the fluores
ph.
ghest intensi
were extracte
er value as th
at an increas
gatively charg
each bilayer w
S2). It is th
uorescence m
0 mol% POPG
regions. Solu
rescence inte
scence intens
ity value (low
d (Figure S2)
he percentage
ingly basic so
ged lipids we
where the cha
his range tha
micrograph o
G and 79.5 m
utions contain
ensity measu
sity correspon
west pH) an
. As expected
e of POPG in
olution was re
ere embedded
ange in fluore
at is exploite
of supported
ol% POPC pa
ning different
urements we
nding to the
nd fit with a
d, the appare
the bilayer w
equired to de
d in the mem
escence inten
ed below fo
lipid bilayer
atterned on a
t peptide con
re made acc
region marke
sigmoidal c
ent pKa of the
was increase
protonate th
mbranes. Mo
nsity varies ro
r studying p
rs containing
a planar glass
ncentrations
ordingly. The
ed by the das
curve, from w
e ortho‐rhoda
d (Table 1 in
e dye when h
oreover, ther
oughly linearly
peptide‐mem
g 0.5 mol% o
s support bet
were flowed
e line scan o
hed red line
S3
which
amine
main
higher
e is a
y with
brane
ortho‐
tween
d over
on the
in the
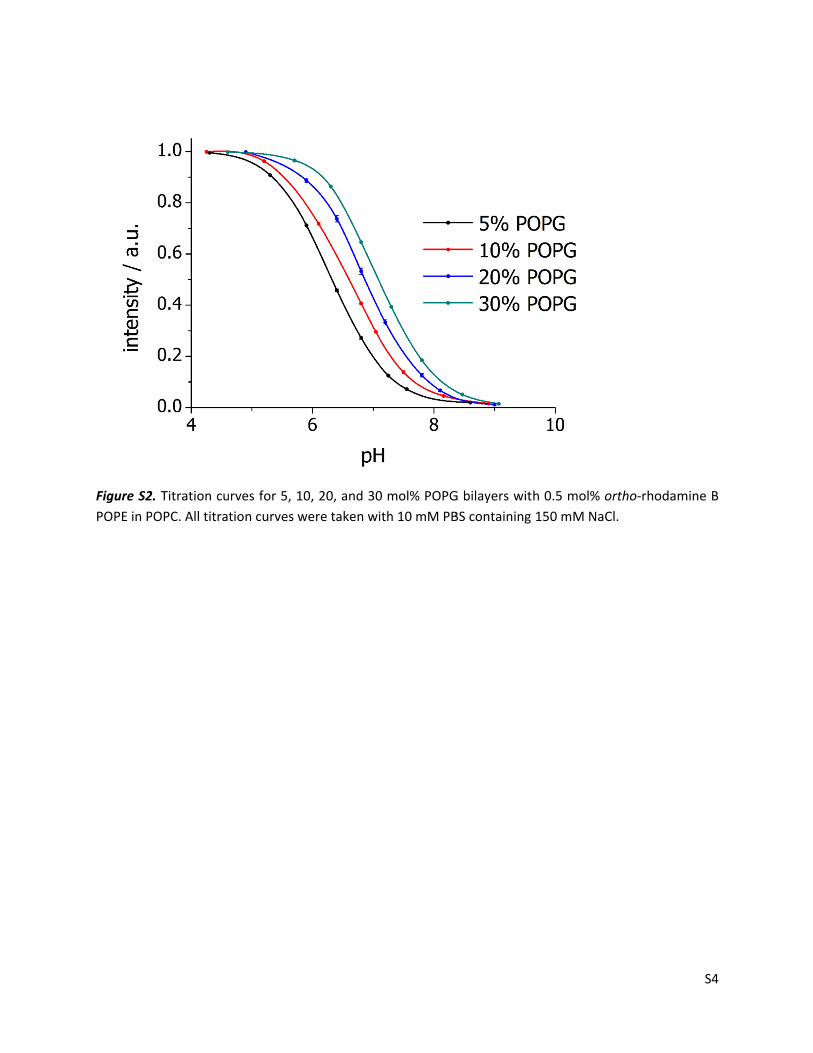
Figure S2
POPE in P
2. Titration cu
POPC. All titra
urves for 5, 10
tion curves w
0, 20, and 30
were taken wi
0 mol% POPG
ith 10 mM PB
G bilayers wit
BS containing
h 0.5 mol% o
150 mM NaC
ortho‐rhodam
Cl.
S4
mine B

Figure S3
rhodamin
introduce
Effect of o
the disso
concentra
Abstractin
dye in the
tightens b
is fit to th
3. Normalized
ne B POPE, 30
ed. The buffer
ortho‐rhodam
ociation con
ations from 0
ng the dissoci
e bilayer tight
binding in mu
e data points
d fluorescence
0 mol% POPG
r used was 10
mine B on pe
nstant of Ar
0.05 mol% to
iation consta
tens the bind
uch the same
s in S4b and t
e intensity m
and 69.5 mo
0 mM PBS wit
eptide bindin
rg9 from PO
o 1.0 mol% i
nts from the
ing of Arg9 (S
fashion as PO
he fit is extra
measurements
ol% POPC as in
th 150 mM Na
ng. The effect
OPC bilayers
n POPC. Figu
curves indica
4b). It would
OPG (i.e. on e
polated to 0
s for bilayers
ncreasing con
aCl at pH 6.8.
t of ortho‐rho
s was inves
ure S4a show
ates that incre
appear that
electrostatic g
mol% dye, w
s composed o
ncentrations o
.
odamine B dy
stigated with
ws the result
easing the co
the negative
grounds). A h
hich yields KD
of 0.5 mol% o
of Lys9 peptid
ye in the bilay
h increasing
ts of these a
oncentration o
charge on th
hyperbolic fun
D = 60 µM.
S5
ortho‐
de are
yer on
g dye
ssays.
of the
he dye
nction

Figure S4
rhodamin
NaCl at pH
is the fit o
Total int
microfluid
no residua
varying c
continuou
conducted
well as pe
to a linea
linear con
POPC lip
PDMS on
Figure S5
subtractio
Performin
fluorescen
4. a) Hill plo
ne B dye prese
H 6.4. b) Plot
of a hyperboli
ernal reflect
dic channels.
al fluorophore
concentration
usly until the
d under ident
eptides in the
ar change in
ntribution to t
pid bilayers. T
ne of the best
5a plots the
on of the lin
ng the same e
nce response j
ts for Arg9 p
ent in the bil
t of the extrac
ic curve to the
tion fluoresc
No TIRF sig
e in either the
s (from 10
overall TIRF
tical condition
near surface
fluorescence
the signal, ex
The hydropho
inert substra
data for TA
near contribu
experiments w
just changed
peptide bindi
ayer. The ass
cted KD value
e data.
cence micro
gnal was obse
e device or th
µM to 150
F signal rema
ns. The meas
bulk solution
intensity wi
xperiments w
obic nature o
te for correct
AMRA-labele
ution. The K
with TAMRA
linearly with
ing to POPC
says were per
es from (a) vs
scopy. 100%
erved with th
e lipid sampl
µM) were
ained unchan
sured TIRF s
n. Peptide mol
th increasing
were run using
f PDMS and
ting the bulk
ed Arg9 pep
KD value abst
A-labeled Lys
peptide conc
bilayers wit
rformed in 10
. mol% of ort
% POPC bila
hese bilayers,
les. Solutions
introduced i
nged. Both Ly
signal arose f
lecules in the
g peptide con
g a spin-coat
d similar diele
effect from u
ptides binding
tracted from
9 led to no bi
centration (Fig
th different a
0 mM PBS bu
tho‐rhodamin
ayers were fi
which indica
of TAMRA-
into each ch
ys9 and Arg9
from surface
e near surface
ncentration. T
ted PDMS lay
ectric constan
unbound dye
g to POPC
this data w
inding behavi
gure S5b).
amounts of o
uffer with 150
ne B. The red
first formed i
ated that ther
-labeled pepti
hannel and fl
experiments
bound peptid
bulk just gav
To subtract o
yer in place o
nt with glass
labeled pepti
bilayers afte
was 70 ± 19
ior, but instea
S6
ortho‐
0 mM
curve
in the
re was
ides at
flowed
s were
des as
ve rise
off the
of the
make
des.1,2
er the
9 µM.
ad the
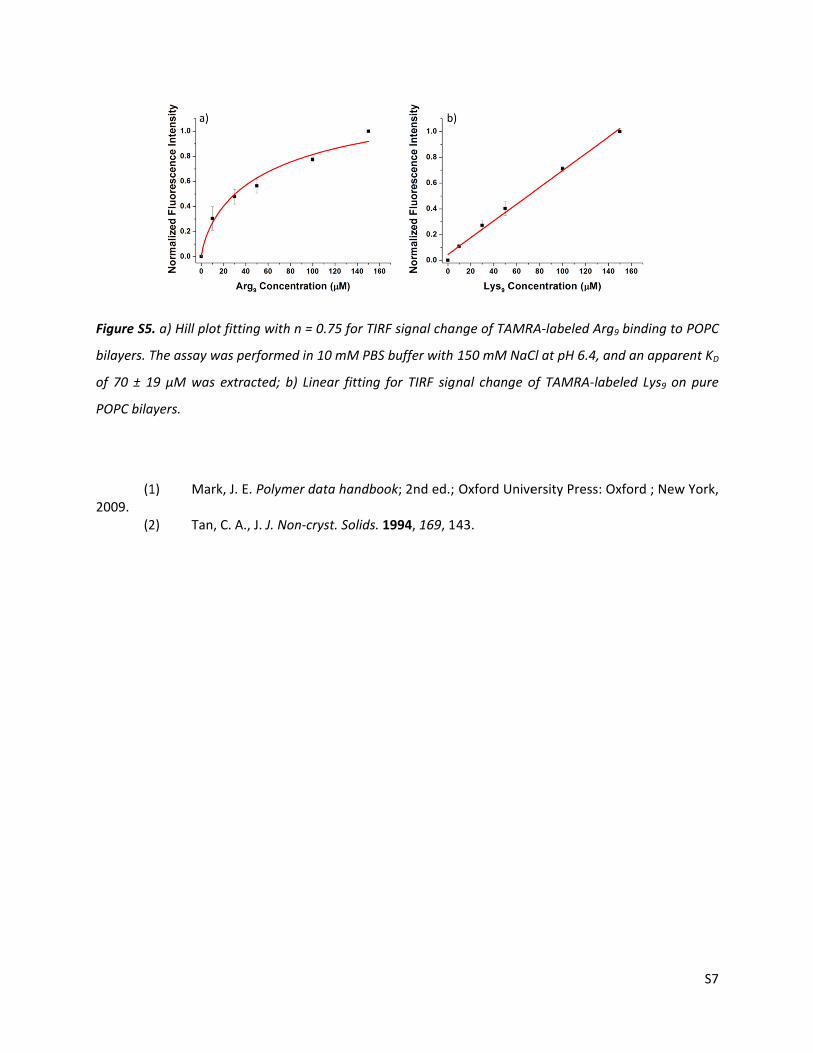
Figure S5
bilayers. T
of 70 ± 1
POPC bila
(12009. (2
. a) Hill plot f
The assay was
9 µM was ex
ayers.
1) Mark,
2) Tan, C
fitting with n
s performed i
xtracted; b) L
J. E. Polymer
. A., J. J. Non‐
= 0.75 for TIR
in 10 mM PBS
Linear fitting
r data handbo
‐cryst. Solids.
RF signal chan
S buffer with
for TIRF sign
ook; 2nd ed.;
1994, 169, 14
nge of TAMR
150 mM NaC
nal change o
Oxford Unive
43.
RA‐labeled Arg
Cl at pH 6.4, a
of TAMRA‐lab
ersity Press: O
g9 binding to
and an appare
beled Lys9 on
Oxford ; New
S7
POPC
ent KD
n pure
w York,