supply and demand uncertainty in multi-echelon supply …lvs2/presentations/informs06-sudu.pdf ·...
TRANSCRIPT

Supply and Demand Uncertainty inMulti-Echelon Supply Chains
Lawrence V. Snyder1 Z.-J. Max Shen2
1Department of Industrial & Systems EngineeringCenter for Value Chain Research
Lehigh UniversityBethlehem, PA
2Department of Industrial Engineering & Operations ResearchUniversity of California, Berkeley
Berkeley, CA
INFORMS, Pittsburgh, PANovember 6, 2006
Snyder and Shen (Lehigh and Berkeley) Supply and Demand Uncertainty INFORMS 2006 1 / 48

Outline
1 Introduction
2 Cost of Unreliability
3 Order Frequency
4 Inventory Placement
5 Supply Chain Structure
6 Cost of Reliability
7 Conclusions
Snyder and Shen (Lehigh and Berkeley) Supply and Demand Uncertainty INFORMS 2006 2 / 48

Introduction
Outline
1 IntroductionMotivationLiterature ReviewRoadmapMethodology and Assumptions
2 Cost of Unreliability
3 Order Frequency
4 Inventory Placement
5 Supply Chain Structure
6 Cost of Reliability
7 Conclusions1 Introduction
MotivationLiterature ReviewRoadmapMethodology and Assumptions
2 Cost of Unreliability3 Order Frequency4 Inventory Placement
Centralization vs. DecentralizationUpstream vs. Downstream
5 Supply Chain StructureHub-and-Spoke vs. Point-to-PointSupplier RedundancySupplier Flexibility
6 Cost of Reliability7 Conclusions
Snyder and Shen (Lehigh and Berkeley) Supply and Demand Uncertainty INFORMS 2006 3 / 48

Introduction Motivation
Supply vs. Demand Uncertainty
Demand uncertainty (DU)
Randomness in demand quantity, timing, product mix, etc.Purview of SCM/OM for decades
Supply uncertainty (SU)
DisruptionsCapacity/yield uncertaintyLead-time uncertaintyetc.Increased attention only recently
Snyder and Shen (Lehigh and Berkeley) Supply and Demand Uncertainty INFORMS 2006 4 / 48

Introduction Motivation
Are DU and SU the Same?
Under both DU and SU, the main issue is the same:
Not enough supply to meet demandMay be irrelevant whether the mismatch came from DU or SU
Mitigation strategies are similar:
Safety stockMultiple sourcingImproved forecastsDemand managementExcess capacityetc.
The good news:
We know a lot about supply chains under DU
The bad news:
The “conventional wisdom” from DU is often wrong under SU
Snyder and Shen (Lehigh and Berkeley) Supply and Demand Uncertainty INFORMS 2006 5 / 48

Introduction Literature Review
Literature Review
Classical inventory models + disruptions
Parlar and Berkin (1991), Berk and Arreola-Risa (1994), Parlar andPerry (1995,1996), Gupta (1996), Mohebbi (2003,2004), many others
Classical inventory models + yield uncertainty
Gerchak et al. (1988), Bassok and Akella (1991), Yano and Lee (1995),Wang and Gerchak (1996), many others
Strategic questions
Tomlin (2006): optimal mitigation strategyTomlin and Snyder (2006): advanced warningLewis, Erera, and Whilte (2005): border closuresChopra, Reinhardt, and Mohan (2005): “bundling” disruptions andyield uncertainty
Snyder and Shen (Lehigh and Berkeley) Supply and Demand Uncertainty INFORMS 2006 6 / 48

Introduction Literature Review
Multi-Echelon Models
Very few multi-echelon models with disruptions
Kim, Lu, and Kvam (2005): Yield uncertainty in 3-echelon supplychain, risk-averse objectiveHopp and Yin (2006): Optimal placement and size of inventory andcapacity buffers in assembly network
Must study disruptions in multi-echelon setting
Disruptions are never localCascading effect
Snyder and Shen (Lehigh and Berkeley) Supply and Demand Uncertainty INFORMS 2006 7 / 48

Introduction Literature Review
A Newsboy-Style Result
Theorem (Tomlin 2006)
In a single-stage base-stock system with deterministic demand andstochastic supply disruptions, the optimal base-stock level is given by
S∗ = d + dF−1
(p
p + h
),
where d is the demand per period and F is the cdf of supply.
F (x) = P(we are in a disruption lasting x periods or fewer)
Cycle/safety stock interpretation
Similar (but less sharp) result given by Gullu et al. (1997)
Snyder and Shen (Lehigh and Berkeley) Supply and Demand Uncertainty INFORMS 2006 8 / 48

Introduction Roadmap
SU vs. DU: Roadmap
1 The cost of unreliability
2 Order frequency3 Inventory placement
Centralization vs. decentralizationUpstream vs. downstream
4 Supply chain structure
Hub-and-spoke vs. point-to-pointSupplier redundancySupplier flexibility
5 The cost of reliability
Snyder and Shen (Lehigh and Berkeley) Supply and Demand Uncertainty INFORMS 2006 9 / 48

Introduction Methodology and Assumptions
Methodology
Some of our results are proved analytically
Others we demonstrate using simulation
BaseStockSim softwareRough optimization of base-stock levels
Snyder and Shen (Lehigh and Berkeley) Supply and Demand Uncertainty INFORMS 2006 10 / 48

Introduction Methodology and Assumptions
Supply Chain Assumptions
Multi-echelon SC
Each stage has processing function and output buffer:
2 1
May represent physical location, processing activity, or SKU
Backordered demand
Costs h, p
Processing (lead) time T
Under DU, demands are N(µ, σ2)
Under SU, disruption process follows 2-state Markov process
Disruption probability αRecovery probability β
Snyder and Shen (Lehigh and Berkeley) Supply and Demand Uncertainty INFORMS 2006 11 / 48
Cost of Unreliability
Outline
1 Introduction
2 Cost of Unreliability
3 Order Frequency
4 Inventory Placement
5 Supply Chain Structure
6 Cost of Reliability
7 Conclusions1 Introduction
MotivationLiterature ReviewRoadmapMethodology and Assumptions
2 Cost of Unreliability3 Order Frequency4 Inventory Placement
Centralization vs. DecentralizationUpstream vs. Downstream
5 Supply Chain StructureHub-and-Spoke vs. Point-to-PointSupplier RedundancySupplier Flexibility
6 Cost of Reliability7 Conclusions
Snyder and Shen (Lehigh and Berkeley) Supply and Demand Uncertainty INFORMS 2006 12 / 48

Cost of Unreliability
The Cost of Unreliability
Two stages: supplier and retailer
Supplier cannot hold inventory, is subjectto disruptions
Under either DU or SU, base-stock policyis optimal at retailer
Suppose firm fails to plan for either typeof uncertainty
i.e., it sets S = µ
2 1-
Key Question:
Is this a bigger mistake under DU or SU?
Snyder and Shen (Lehigh and Berkeley) Supply and Demand Uncertainty INFORMS 2006 13 / 48

Cost of Unreliability
Level of Uncertainty
We need a way to compare DU and SU fairly
Let level of uncertainty = % of demands backordered when S = µ
LOU = 1− fill rate
A DU process and an SU proces are equivalent if they have the sameLOU
Snyder and Shen (Lehigh and Berkeley) Supply and Demand Uncertainty INFORMS 2006 14 / 48

Cost of Unreliability
Level of Uncertainty, cont’d
Under DU, fill rate is
1− σL(z)
µ,
where L(z) is standard normal loss function and z = (S − µ)/σ.
Therefore
LOUDU =σL(0)
µ≈ 0.3989
σ
µ.
Under SU, fill rate = % of periods in which supplier is up
ThereforeLOUSU = P(supplier down) =
α
α + β.
Snyder and Shen (Lehigh and Berkeley) Supply and Demand Uncertainty INFORMS 2006 15 / 48

Cost of Unreliability
Simulation Experiment
Varied LOU from 0.0 to 0.2 (by 0.01)
For each LOU, find σ and α that achieve it
(Keeping µ and β fixed)
0
10
20
30
40
50
60
70
80
00.0
20.0
40.0
60.0
80.1 0.1
20.1
40.1
60.1
80.2
Level of Uncertainty
Mea
n C
ost
per
Per
iod
DU Cost
SU Cost
Snyder and Shen (Lehigh and Berkeley) Supply and Demand Uncertainty INFORMS 2006 16 / 48

Cost of Unreliability
Insights
More costly to fail to plan for SU than for DU
Holds under a wide range of parameters
Cost difference is greater when
Holding cost is smallerStockout cost is largerRecovery probability is smaller
Snyder and Shen (Lehigh and Berkeley) Supply and Demand Uncertainty INFORMS 2006 17 / 48
Order Frequency
Outline
1 Introduction
2 Cost of Unreliability
3 Order Frequency
4 Inventory Placement
5 Supply Chain Structure
6 Cost of Reliability
7 Conclusions1 Introduction
MotivationLiterature ReviewRoadmapMethodology and Assumptions
2 Cost of Unreliability3 Order Frequency4 Inventory Placement
Centralization vs. DecentralizationUpstream vs. Downstream
5 Supply Chain StructureHub-and-Spoke vs. Point-to-PointSupplier RedundancySupplier Flexibility
6 Cost of Reliability7 Conclusions
Snyder and Shen (Lehigh and Berkeley) Supply and Demand Uncertainty INFORMS 2006 18 / 48

Order Frequency
Order Frequency
Two-stage supply chain
µ = 20, p = 100 at retailer
T = 1 at supplier
Under DU, σ = 5
Two possible cost structures:1 h = 2.85 and K = 02 h = 0.1 and K = 250
2 1-
Key Question:
Does firm prefer #1 (one-for-one ordering) or #2 (batch ordering)?
Snyder and Shen (Lehigh and Berkeley) Supply and Demand Uncertainty INFORMS 2006 19 / 48

Order Frequency
Order Frequency: DU
Option 1: h = 2.85, K = 0
Base-stock policy is optimal, with
S∗ = µ + σΦ−1
(p
p + h
)≈ 30
E[cost] ≈ 32.8
Option 2: h = 0.1, K = 250
(s,S) policy is optimal with
s∗ ≈ 31, S∗ ≈ 349
E[cost] ≈ 32.8
So the firm is indifferent between the two options under DU
Snyder and Shen (Lehigh and Berkeley) Supply and Demand Uncertainty INFORMS 2006 20 / 48

Order Frequency
Order Frequency: SU
Option 1: h = 2.85, K = 0
Base-stock policy is optimal (Tomlin 2006), with
S∗ = µ + µF−1
(p
p + h
)≈ 60
E[cost] ≈ 497.7
Option 2: h = 0.1, K = 250
Optimal policy not known (deterministic demand, stochasticdisruptions, fixed cost)
Lemma
s∗ and S∗ are integer multiples of µ.
s∗ ≈ 40, S∗ ≈ 340, E[cost] ≈ 391.1
So the batch ordering policy is preferred
Snyder and Shen (Lehigh and Berkeley) Supply and Demand Uncertainty INFORMS 2006 21 / 48
Order Frequency
Insights
Why is batch policy preferred?
If an order is disrupted, the impact is the same under either policyBut the likelihood of a disruption affecting an order is smaller underbatch policy
Snyder and Shen (Lehigh and Berkeley) Supply and Demand Uncertainty INFORMS 2006 22 / 48
Order Frequency
Simulation Experiment
0
100
200
300
400
500
600
0 100 200 300 400 500 600
Base-Stock Cost
(s,S
) Cos
t
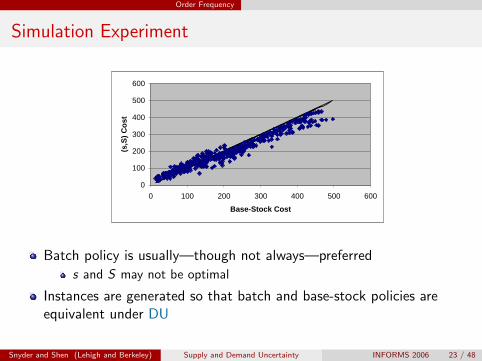
Batch policy is usually—though not always—preferred
s and S may not be optimal
Instances are generated so that batch and base-stock policies areequivalent under DU
Snyder and Shen (Lehigh and Berkeley) Supply and Demand Uncertainty INFORMS 2006 23 / 48

Inventory Placement
Outline
1 Introduction
2 Cost of Unreliability
3 Order Frequency
4 Inventory PlacementCentralization vs. DecentralizationUpstream vs. Downstream
5 Supply Chain Structure
6 Cost of Reliability
7 Conclusions1 Introduction
MotivationLiterature ReviewRoadmapMethodology and Assumptions
2 Cost of Unreliability3 Order Frequency4 Inventory Placement
Centralization vs. DecentralizationUpstream vs. Downstream
5 Supply Chain StructureHub-and-Spoke vs. Point-to-PointSupplier RedundancySupplier Flexibility
6 Cost of Reliability7 Conclusions
Snyder and Shen (Lehigh and Berkeley) Supply and Demand Uncertainty INFORMS 2006 24 / 48
Inventory Placement Centralization vs. Decentralization
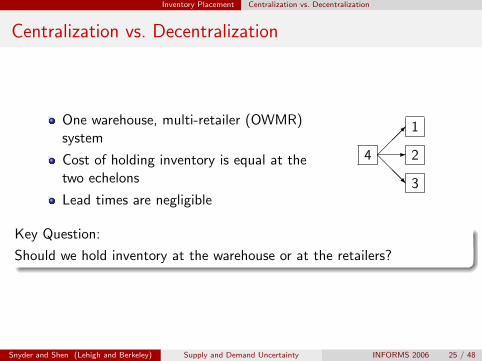
Centralization vs. Decentralization
One warehouse, multi-retailer (OWMR)system
Cost of holding inventory is equal at thetwo echelons
Lead times are negligible
4
1
2
3
-����
@@@R
Key Question:
Should we hold inventory at the warehouse or at the retailers?
Snyder and Shen (Lehigh and Berkeley) Supply and Demand Uncertainty INFORMS 2006 25 / 48
Inventory Placement Centralization vs. Decentralization
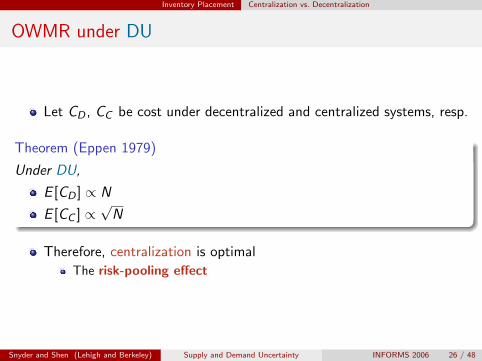
OWMR under DU
Let CD , CC be cost under decentralized and centralized systems, resp.
Theorem (Eppen 1979)
Under DU,
E [CD ] ∝ N
E [CC ] ∝√
N
Therefore, centralization is optimal
The risk-pooling effect
Snyder and Shen (Lehigh and Berkeley) Supply and Demand Uncertainty INFORMS 2006 26 / 48

Inventory Placement Centralization vs. Decentralization
OWMR under SU
Under SU:
Disruptions affect inventory sitesIn decentralized system, a disruption affects one retailerIn centralized system, a disruption affects the whole supply chain
Theorem
Under SU,
(a) E [CD ] = E [CC ]
(b) V [CD ] ∝ NV [CC ] ∝ N2
Therefore decentralization is preferable
We call this the risk-diversification effect
Snyder and Shen (Lehigh and Berkeley) Supply and Demand Uncertainty INFORMS 2006 27 / 48

Inventory Placement Centralization vs. Decentralization
Implication for Facility Location
Joint location–inventory model by Daskin et al. (2002) and Shen etal. (2003)
Considers DU via concave inventory costs in location modelOptimal # of facilities decreases because of risk-pooling effect (andinventory economies of scale)
Reliability model by Snyder and Daskin (2005)
Considers SU in the form of facility failuresOptimal # of facilities increases—related to risk-diversification effect
Model by Jeon et al. (working paper, 2006) balances these competingtendencies
Snyder and Shen (Lehigh and Berkeley) Supply and Demand Uncertainty INFORMS 2006 28 / 48

Inventory Placement Upstream vs. Downstream
Upstream vs. Downstream
Serial supply chain
Cost of holding inventory is non-increasingas we move downstream
Lead times are negligible
3 2 1- -
Key Question:
Should we hold inventory upstream or downstream?
Snyder and Shen (Lehigh and Berkeley) Supply and Demand Uncertainty INFORMS 2006 29 / 48

Inventory Placement Upstream vs. Downstream
Upstream vs. Downstream, cont’d
Under DU, conventional wisdom says hold inventory upstream
Holding costs increase as we move downstream
But under SU, downstream inventory may be preferable
Protects against stockouts anywhere in the systemDepends on relative holding costs
Snyder and Shen (Lehigh and Berkeley) Supply and Demand Uncertainty INFORMS 2006 30 / 48

Inventory Placement Upstream vs. Downstream
Savings Increases as Disruption Probability Increases
0%
50%
100%
150%
200%
250%
300%
0 0.05 0.1 0.15 0.2 0.25
Failure Prob at Stage 2
% S
avin
gs
fro
m H
old
ing
D
ow
nst
ream
Snyder and Shen (Lehigh and Berkeley) Supply and Demand Uncertainty INFORMS 2006 31 / 48
Supply Chain Structure
Outline
1 Introduction
2 Cost of Unreliability
3 Order Frequency
4 Inventory Placement
5 Supply Chain StructureHub-and-Spoke vs. Point-to-PointSupplier RedundancySupplier Flexibility
6 Cost of Reliability
7 Conclusions1 Introduction
MotivationLiterature ReviewRoadmapMethodology and Assumptions
2 Cost of Unreliability3 Order Frequency4 Inventory Placement
Centralization vs. DecentralizationUpstream vs. Downstream
5 Supply Chain StructureHub-and-Spoke vs. Point-to-PointSupplier RedundancySupplier Flexibility
6 Cost of Reliability7 Conclusions
Snyder and Shen (Lehigh and Berkeley) Supply and Demand Uncertainty INFORMS 2006 32 / 48

Supply Chain Structure Hub-and-Spoke vs. Point-to-Point
Hub-and-Spoke vs. Point-to-Point Systems
Hub-and-Spoke: Point-to-Point:
9
7
8
1
2
3
4
5
6
-����
@@@R
-����
@@@R
�
JJ
JJ
9
1
2
3
4
5
6
��
��
���
����
��*
������:
XXXXXXzHH
HHHHj
@@
@@
@@R
Key Question:
Which type of network is preferred?
Snyder and Shen (Lehigh and Berkeley) Supply and Demand Uncertainty INFORMS 2006 33 / 48

Supply Chain Structure Hub-and-Spoke vs. Point-to-Point
Hub-and-Spoke vs. Point-to-Point Systems, cont’d
Under DU, hub-and-spoke systems are optimal
Due to risk-pooling effect: fewer stocking locations=⇒ smaller inventory requirement
Under SU, point-to-point systems are optimal
Related to risk-diversification effect: more stocking locations=⇒ reduced severity of disruptions
Snyder and Shen (Lehigh and Berkeley) Supply and Demand Uncertainty INFORMS 2006 34 / 48

Supply Chain Structure Hub-and-Spoke vs. Point-to-Point
Simulation Results
0
500
1000
1500
2000
2500
3000
3500
4000
0 200 400 600 800 1000 1200
Mean Cost of P-P Network
Mea
n C
ost
of
H-S
Net
wo
rk
Snyder and Shen (Lehigh and Berkeley) Supply and Demand Uncertainty INFORMS 2006 35 / 48

Supply Chain Structure Supplier Redundancy
Supplier Redundancy
Single retailer with one or more suppliers
Suppliers are identical in terms of cost,capacity, reliability
2
3
4
1
@@@R
-
����
Key Question:
What is the value of having backup suppliers?
Snyder and Shen (Lehigh and Berkeley) Supply and Demand Uncertainty INFORMS 2006 36 / 48

Supply Chain Structure Supplier Redundancy
Supplier Redundancy
Single retailer with one or more suppliers
Suppliers are identical in terms of cost,capacity, reliability
2
3
4
1
@@@R-
����
Key Question:
What is the value of having backup suppliers?
Snyder and Shen (Lehigh and Berkeley) Supply and Demand Uncertainty INFORMS 2006 36 / 48

Supply Chain Structure Supplier Redundancy
Supplier Redundancy under DU
Under DU, second supplier provides value if capacities are tight
e.g., if capacity = µ + σBut value decreases quickly as capacity increasesThird, etc. suppliers provide little value
Snyder and Shen (Lehigh and Berkeley) Supply and Demand Uncertainty INFORMS 2006 37 / 48

Supply Chain Structure Supplier Redundancy
Value of Backup Suppliers: DU
-1.0%0.0%1.0%2.0%3.0%4.0%5.0%6.0%7.0%8.0%
25 30 35 40
Supplier Capacity
Avg
% S
avin
gs
Second Supplier Third Supplier
µ = 20, σ = 5
Snyder and Shen (Lehigh and Berkeley) Supply and Demand Uncertainty INFORMS 2006 38 / 48

Supply Chain Structure Supplier Redundancy
Supplier Redundancy under SU
Under SU, second supplier provides great benefit
Fills in when primary supplier is disruptedAlso helps ramp back up after disruptionEven third+ supplier provides some benefit
Snyder and Shen (Lehigh and Berkeley) Supply and Demand Uncertainty INFORMS 2006 39 / 48

Supply Chain Structure Supplier Redundancy
Value of Backup Suppliers: SU
0%
20%
40%
60%
80%
100%
120%
25 30 35 40
Supplier Capacity
Avg
% S
avin
gs
fro
m S
eco
nd
Su
pp
lier
(0.001, 0.1)
(0.01, 0.3)
(0.05, 0.5)
(0.1, 0.7)
(0.2, 0.9)
Overall
Snyder and Shen (Lehigh and Berkeley) Supply and Demand Uncertainty INFORMS 2006 40 / 48

Supply Chain Structure Supplier Flexibility
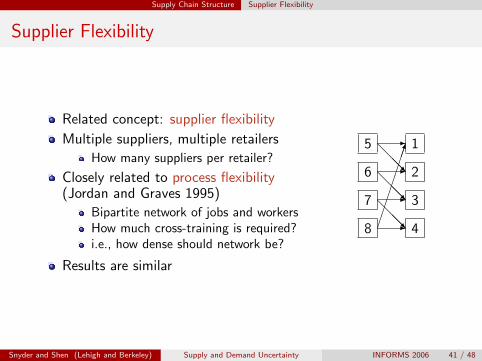
Supplier Flexibility
Related concept: supplier flexibility
Multiple suppliers, multiple retailers
How many suppliers per retailer?
Closely related to process flexibility(Jordan and Graves 1995)
Bipartite network of jobs and workersHow much cross-training is required?i.e., how dense should network be?
Results are similar
1
2
3
4
5
6
7
8
-
-
-
-
Snyder and Shen (Lehigh and Berkeley) Supply and Demand Uncertainty INFORMS 2006 41 / 48
Supply Chain Structure Supplier Flexibility
Supplier Flexibility
Related concept: supplier flexibility
Multiple suppliers, multiple retailers
How many suppliers per retailer?
Closely related to process flexibility(Jordan and Graves 1995)
Bipartite network of jobs and workersHow much cross-training is required?i.e., how dense should network be?
Results are similar
1
2
3
4
5
6
7
8
-@
@@R-@
@@R-@
@@R-��������
Snyder and Shen (Lehigh and Berkeley) Supply and Demand Uncertainty INFORMS 2006 41 / 48

Supply Chain Structure Supplier Flexibility
Supplier Flexibility
Related concept: supplier flexibility
Multiple suppliers, multiple retailers
How many suppliers per retailer?
Closely related to process flexibility(Jordan and Graves 1995)
Bipartite network of jobs and workersHow much cross-training is required?i.e., how dense should network be?
Results are similar
1
2
3
4
5
6
7
8
-@
@@RAAAAAU
-@
@@RAAAAAU
-@
@@R
������
-��������
������
Snyder and Shen (Lehigh and Berkeley) Supply and Demand Uncertainty INFORMS 2006 41 / 48

Supply Chain Structure Supplier Flexibility
Supplier Flexibility
Related concept: supplier flexibility
Multiple suppliers, multiple retailers
How many suppliers per retailer?
Closely related to process flexibility(Jordan and Graves 1995)
Bipartite network of jobs and workersHow much cross-training is required?i.e., how dense should network be?
Results are similar
1
2
3
4
5
6
7
8
-@
@@RAAAAAU
BBBBBBBN
-@
@@RAAAAAU
����
-@
@@R
������
����
-��������
������
����
Snyder and Shen (Lehigh and Berkeley) Supply and Demand Uncertainty INFORMS 2006 41 / 48

Cost of Reliability
Outline
1 Introduction
2 Cost of Unreliability
3 Order Frequency
4 Inventory Placement
5 Supply Chain Structure
6 Cost of Reliability
7 Conclusions1 Introduction
MotivationLiterature ReviewRoadmapMethodology and Assumptions
2 Cost of Unreliability3 Order Frequency4 Inventory Placement
Centralization vs. DecentralizationUpstream vs. Downstream
5 Supply Chain StructureHub-and-Spoke vs. Point-to-PointSupplier RedundancySupplier Flexibility
6 Cost of Reliability7 Conclusions
Snyder and Shen (Lehigh and Berkeley) Supply and Demand Uncertainty INFORMS 2006 42 / 48

Cost of Reliability
The Cost of Reliability
Firms are accustomed to planning for DU
Often reluctant to plan for SU if it requires large investment
Key Question
How much DU cost must be sacrificed to achieve a given level of reliability?
The short answer: Not much
Snyder and Shen (Lehigh and Berkeley) Supply and Demand Uncertainty INFORMS 2006 43 / 48
Cost of Reliability
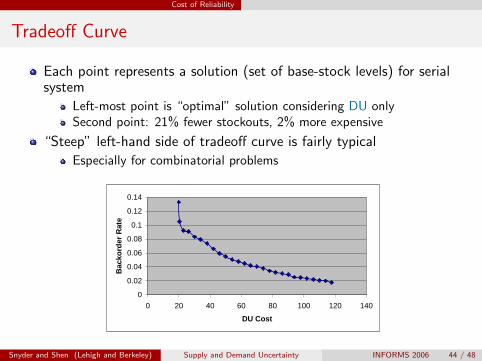
Tradeoff Curve
Each point represents a solution (set of base-stock levels) for serialsystem
Left-most point is “optimal” solution considering DU onlySecond point: 21% fewer stockouts, 2% more expensive
“Steep” left-hand side of tradeoff curve is fairly typical
Especially for combinatorial problems
0
0.02
0.04
0.06
0.08
0.1
0.12
0.14
0 20 40 60 80 100 120 140
DU Cost
Bac
kord
er R
ate
Snyder and Shen (Lehigh and Berkeley) Supply and Demand Uncertainty INFORMS 2006 44 / 48

Conclusions
Outline
1 Introduction
2 Cost of Unreliability
3 Order Frequency
4 Inventory Placement
5 Supply Chain Structure
6 Cost of Reliability
7 Conclusions1 Introduction
MotivationLiterature ReviewRoadmapMethodology and Assumptions
2 Cost of Unreliability3 Order Frequency4 Inventory Placement
Centralization vs. DecentralizationUpstream vs. Downstream
5 Supply Chain StructureHub-and-Spoke vs. Point-to-PointSupplier RedundancySupplier Flexibility
6 Cost of Reliability7 Conclusions
Snyder and Shen (Lehigh and Berkeley) Supply and Demand Uncertainty INFORMS 2006 45 / 48

Conclusions
Conclusions
Planning for SU is critical
Optimal strategy under SU is often exact opposite from that underDU
That’s not to say firms are doing everything wrongBut SU should be accounted for more than it isStrategy chosen should account for both
Many of these results are related to risk-diversification effect
Disruptions are less severe when eggs aren’t all in one basket
Tradeoff between cost and reliability is often steep
Large improvements in reliability with small increases in cost
Snyder and Shen (Lehigh and Berkeley) Supply and Demand Uncertainty INFORMS 2006 46 / 48

Conclusions
Notes and Acknowledgments
Supported by National Science Foundation grant #DMI-0522725
Thanks to Jae-Bum Kim (Lehigh) for assistance with simulation study
Working paper available atwww.lehigh.edu/∼lvs2/research.htmlBaseStockSim software available atwww.lehigh.edu/∼lvs2/software.html
Snyder and Shen (Lehigh and Berkeley) Supply and Demand Uncertainty INFORMS 2006 47 / 48

Conclusions
Questions?
[email protected]@ieor.berkeley.edu
Snyder and Shen (Lehigh and Berkeley) Supply and Demand Uncertainty INFORMS 2006 48 / 48