supplementary materials for · electrolyte. in the solid electrolyte case, an anion exchange...
TRANSCRIPT

science.sciencemag.org/content/366/6462/226/suppl/DC1
Supplementary Materials for
Direct electrosynthesis of pure aqueous H2O2 solutions up to 20%
by weight using a solid electrolyte Chuan Xia*, Yang Xia*, Peng Zhu, Lei Fan, Haotian Wang†
*These authors contributed equally to this work. †Corresponding author. Email: [email protected]
Published 11 October 2019, Science 366, 226 (2019)
DOI: 10.1126/science.aay1844
This PDF file includes:
Materials and Methods Figs. S1 to S15 Supplementary Text Table S1 References

2
Materials and Methods
Material synthesis
Preparation of functionalized carbon black. In a typical synthesis, 600 mg of commercial
carbon black (XC-72, FuelCellStore) were added into 600 mL of 12.0 M nitric acid. Then,
the above solution was refluxed at 85 °C for 1, 3 and 12 h to obtain oxidized carbon black
with surface oxygen content of 7.33%, 10.19% and 11.62%, respectively. After natural
cooling, the slurry was taken out, centrifuged and washed with water and ethanol until the
pH was neutral. Finally, the sample was dried at 70 °C in a vacuum oven. The as-received
commercial carbon black shows a 2.33% surface oxygen content. Furthermore, 500 mg of
commercial carbon black was annealed in a tube furnace at a temperature of 500 °C for 2
h under a mixed hydrogen (5%)/argon atmosphere to obtain the surface oxygen-free carbon
black.
Direct electrosynthesis of pure H2O2
All the electrochemical measurements were run at 25 °C. A BioLogic VMP3
workstation was employed to record the electrochemical response. The typical three-
electrode measurements were performed using a conventional flow cell (54). For aqueous
electrolyte test, around 0.46 mg cm-2 CB-10% catalyst was loaded on Sigracet 35 BC GDL
electrode (Fuel Cell Store) as the cathode. Around 0.46 mg cm-2 IrO2 catalyst (Fuel Cell
Store) was loaded on Sigracet 35 BC GDL electrode as the anode for water oxidation. The
two electrodes were therefore placed on opposite sides of two 0.5 cm thick PTFE sheets
with 0.5 cm wide by 2.0 cm long channels such that the catalyst layer interfaced with the
flowing liquid electrolyte. A Nafion 115 film (Fuel Cell Store) was sandwiched by the two
PTFE sheets to separate the chambers. The geometric surface area of catalyst is 1 cm2. On
the cathode side a titanium gas flow chamber supplied 20 sccm humified O2. The anode
was circulated with 1 M Na2SO4 and 1 M KOH under a flow-rate of 2 mL min-1 for O2
reduction in 1 M Na2SO4 and 1 M KOH, respectively. A saturated calomel electrode (SCE,
CH Instruments) was used as the reference electrode. For three-electrode measurement
using solid electrolyte, around 0.46 mg cm-2 CB-10% catalyst was loaded on Sigracet 35
BC GDL electrode (Fuel Cell Store) as the cathode. Around 0.46 mg cm-2 20% Pt-C
catalyst (Fuel Cell Store) was loaded on Sigracet 35 BC GDL electrode as the anode for
hydrogen oxidation. The cathode chamber in the flow cell was filled with solid polymer
proton conductor, in a close contact with SCE reference electrode. AEM was used to
separate the solid electrolyte and cathode electrode. CEM was employed to separate the
solid electrolyte and anode electrode.
All potentials measured against SCE was converted to the reversible hydrogen
electrode (RHE) scale in this work using ERHE = ESCE + 0.244 V + 0.0591×pH, where pH
values of electrolytes were determined by Orion 320 PerpHecT LogR Meter (Thermo
Scientific). 1 M Na2SO4 (pH = 7) and 1 M KOH (pH = 14) were used as aqueous electrolyte.
The flow-rate for the aqueous electrolyte is 27 mL h-1 controlled by a syringe pump. The
styrene-divinylbenzene sulfonated copolymer (36, 55) was employed as solid polymer
electrolyte. In the solid electrolyte case, an anion exchange membrane (Dioxide Materials
and Membranes International Inc.) was added between the solid electrolyte and the CB-
10% catalyst to avoid flooding. The DI flow-rate through the porous solid electrolyte,
which was used to bring out the generated H2O2, was also 27 mL h-1 controlled by a syringe

3
pump. Solution resistance (Rs) was determined by potentiostatic electrochemical
impedance spectroscopy (PEIS) at frequencies ranging from 0.1 Hz to 200 kHz. All the
measured potentials using three-electrode setup were manually 100% compensated.
For the two-electrode cell for direct electrosynthesis of H2O2, an anion exchange
membrane (Dioxide Materials and Membranes International Inc.) and a Nafion film (Fuel
Cell Store) were used for anion and cation exchange, respectively. Around 0.46 mg cm-2
CB-10% and Pt-C loaded on Sigracet 35 BC GDL electrode (4 cm2 electrode area) were
used as cathode and anode, respectively. The cathode side was supplied with 50 sccm of
humidified O2 gas (or air). The anode side was supplied with 50 sccm of humidified H2
gas, or circulated with 0.5 M H2SO4 aqueous solution at 2 mL min-1. Note that IrO2 was
used as anode catalyst instead of Pt-C when the anode was circulated with sulfuric acid
solution for water oxidation. The styrene-divinylbenzene sulfonated copolymer (36, 55),
inorganic CsxH3-xPW12O40 proton conductor (56) or Dowex 1×8 (Sigma) anion conductor
were used as solid ion conductors. The cell configurations were schematically illustrated
in Fig. 1B and fig. S1. The O2//SE//H2 cell was firstly stabilized for 30 minutes before
liquid product collection. To extend the stability of the O2//SE//H2 cell, we employed a
reinforced AEM (AMI-7001, Membranes International Inc.), which is more mechanically
robust compared to non-reinforced alternatives, for long-term operation test. All the
measured potentials using two-electrode setup were manually 70% compensated unless
stated otherwise.
The generated H2O2 concentration was evaluated using standard potassium
permanganate (0.1 N KMnO4 solution, Sigma-Aldrich) titration process, according to
following equation:
2MnO4− + 5H2O2 + 6H+ → 6Mn2+ + 5O2 + 8H2O
In this work, sulfuric acid (2.0 N H2SO4, VWR) was used as the H+ source. After 10 min
electrolysis under certain conditions, 10.0 mL liquid product was collected for KMnO4
titration. The highest volume resolution by pre-calibrated pipet is 5 𝜇L, which gives a less
than 2% error during titration process. The Faradaic efficiency (FE) for H2O2 production
is calculated using following equation:
FE =generated H2O2 (mol L−1) × 2 × 96485 (C mol−1) × flow rate (mL s−1)
𝑗𝑡𝑜𝑡𝑎𝑙(mA )∗ 100
The rotation ring disk electrode (RRDE) measurements were run at 25 °C in a typical
three-electrode cell in 0.1 M Na2SO4 electrolyte. A carbon rod (99.99 %, Beantown
Chemical) and a saturated calomel electrode (SCE, CH Instruments) were used as the
counter and reference electrode, respectively. A RRDE assembly (AFE6R1PTPK, Pine
Instruments) consisting of a glassy carbon rotation disk electrode (Φ = 5.0 mm) and a Pt
ring (Φ = 15.0 mm) was used, with a theoretical collection efficiency of 25%.
Experimentally, the apparent collection efficiency (N) was calibrated to be 24.1% in the
ferrocyanide/ferricyanide half reaction system at a rotation rate between 400 and 2025 rpm.
To prepare carbon black cast working electrode, typically, 3.3 mg of as-prepared CB-10%
catalyst was mixed with 1 mL of ethanol and 10 µL of Nafion 117 solution (5 %, Sigma-

4
Aldrich), and sonicated for 20 min to get a homogeneous catalyst ink. 6 µL of the ink was
pipetted onto glassy carbon disk (0.196 cm2 area, 0.1 mg cm-2 mass loading), and was got
vacuum dried prior to usage. As the catalyst can be dispersed very well in ethanol solutions,
uniform catalyst coating can be made on the disc electrode without obvious pin holes or
uncovered edge. All potentials measured against SCE was converted to the reversible
hydrogen electrode (RHE) scale in this work using E (vs. RHE) = E (vs. SCE) + 0.244 V
+ 0.0591×pH, where pH values of electrolytes were determined by Orion 320 PerpHecT
LogR Meter (Thermo Scientific). H2O2 selectivity was calculated using the following
equation: H2O2 (%) = 200 × 𝐼𝑟𝑖𝑛𝑔/𝑁
𝐼𝑑𝑖𝑠𝑘 + 𝐼𝑟𝑖𝑛𝑔/𝑁, where Iring is the ring current, IDisk is the disk
current and N is the collection efficiency.
Characterization
X-ray photoelectron spectroscopy was obtained with a PHI Quantera spectrometer,
using a monochromatic Al Kα radiation (1486.6 eV) and a low energy flood gun as
neutralizer. All XPS spectra were calibrated by shifting the detected carbon C 1s peak to
284.6 eV. BET surface area analysis was performed using Quantachrome Autosorb-iQ-
MP/Kr BET Surface Analyzer. SEM was performed on a FEI Quanta 400 field emission
scanning electron microscope. Inductively coupled plasma atomic emission spectroscopy
(ICP-OES) results were collected using Optima 8300 spectrometer. The rainwater was
collected at Rice campus during Jan. 22, 2019 to Jan. 31, 2019. The total organic carbon
(TOC) tests were done by a third-party company (A & B Lab) at Houston, Texas.

5
Fig. S1.
Digital photos of O2//SE//H2 cell. The front and back view of the (A, B) anode and (C, D)
cathode electrode. (E) Side view of the assembled cell. (F) The front view of the solid
electrolyte layer, where the sulfonated styrene-divinylbenzene copolymer microspheres
were densely filled into the solid electrolyte thin layer. Note that the thickness of the solid
electrolyte layer is 1.5 mm.

6
Fig. S2.
An overview of the system approach used in the experiments.

7
Fig. S3.
Characterization of carbon black catalyst. (A) SEM image and (B) BET surface area
analysis of carbon-black catalyst with different surface oxygen content. The results show
that there is no significant morphology evolution for carbon black catalyst after surface
functionalization. (C) Representative SEM image of spray-coated CB-10% electrode,
showing a ~ 70 µm thick catalyst layer. (D) Enlarged SEM of the CB-10% catalyst
electrode. It demonstrates that the catalyst layer on the GDL is highly porous, which is
beneficial for fast O2 diffusion and thus leads to improved catalytic current density.
Generally, in many cases after the oxidation or activation processes, carbon materials
present higher surface areas. This can be easily observed particularly in cases where the
starting carbon material is less defective such as graphite or solid carbon particles.
However in our case, our starting carbon black is porous. While the oxidation process will
introduce abundant defects, it could cause the collapse of the pore structure in the porous
carbon black which will decrease the BET surface area. The BET data showed that the pore
volume of the pristine carbon (CB-0%) is 71 cm3 g-1 whereas that of the CB-10% sample
is 52.2 cm3 g-1. Thus, it is reasonable that the BET surface area of CB-0% (214.9 m2 g-1) is
8
higher than that of functionalized CB-10% (156.6 m2 g-1) as shown in fig. S3. This
phenomenon has also been reported before ["Oxidation of different microporous carbons
by chemical and electrochemical methods." Frontiers in Materials 6 (2019): 130]. We
found that all the functionalized samples showed similar BET surface area (in the range of
150-170 m2 g-1). We believe that the surface area does not play a critical role for the H2O2
activity enhancement, since the CB-10% with slightly lower BET surface area (156.6 m2
g-1) delivered better ORR activity compared to CB-2.11% (167.3 m2 g-1). We believe that
the enhanced ORR activity originated from the increased active site density.
The ability of oxidized carbon for selective 2e--ORR has been reported before,
including previous studies in possible active sites as also mentioned on Page 6 in our
manuscript. Based on this previous knowledge, and considering the practical application
of our design, we chose to oxidize commercial carbon black as the 2e--ORR catalyst mainly
due to the following reasons. First, compared to other carbon materials such as graphene
or CNTs used in previous reports [ref. 15-17], carbon black is thousands of times cheaper,
and can be produced in a large scale. Second, carbon black is a form
of paracrystalline carbon with defects or edges exposed, making the surface
functionalization easier than graphene or CNT. For example, under the same oxidation
reaction conditions, after 3-h oxidation our carbon black presents a 10% oxygen coverage,
while CNT has only about 3% [ref. 16]. In addition, compared to other multi-step catalyst
synthesis methods [ref. 15, 17, 18], this one-step functionalization process under mild
conditions (85 °C, 3h) also makes our catalyst preparation economical. Third, carbon black
has a high surface area which can expose high density of active sites for large ORR current
densities. Lastly, its nanoparticulate morphology facilitates O2 diffusion from the GDL
(layer-by-layer stacking of graphene nanosheets, by contrast, can hinder gas transport).

9
Fig. S4.
XPS characterization of CB-10% catalyst. High-resolution (A) C 1s (B) O 1s XPS
spectra. The carbon 1s spectrum of the CB-10% catalyst can be deconvoluted into five
contributions that are sp2 carbon at 284.6 eV, sp3 carbon at 285.5 eV, C-O at 286.8 eV, -
COOH at 288.9 eV and the characteristic shakeup line of carbon in aromatic compounds
at 291.2 eV (π-π* transition) (57, 58). The O 1s peaks could be deconvoluted into three
peaks. According to the literature (59, 60), the components centered at 531.7 and 532.9 eV
were attributed to the C-OH/C-O-C and C=O surface functional groups, respectively. The
last component with B.E. around 535.5 eV was characteristic of adsorbed water. These
results indicate that the acid treatment induced surface oxygen functionalization of carbon
black.

10
Fig. S5.
Tuning the surface oxygen on carbon black for optimized 2e--ORR performance. (A)
XPS survey scans of carbon black catalysts with different surface oxygen contents. (B)
Faradaic efficiencies and (C) I-V curves of carbon black catalysts with different surface
oxygen contents for 2e--ORR using O2//SE//H2O cell configuration with solid proton
conductor (Fig. 3A). As shown in (B), carbon black catalyst without the surface oxygen
functional groups (0 % oxygen) shows a H2O2 FE of < 80%. With surface oxygen content
increased to 2.11%, we found that the H2O2 FE of carbon black catalyst quickly ramped up
to ~ 95%. By further increasing the surface oxygen content (from 2.11 to 11.62%), we
observed a gradual increase in ORR activity (current density) in fig. S5C due to the
increased density of active sites. Please be noted here that the 3h and 12h oxidation of
carbon black presents surface oxygen ratio of 10.19% and 11.62%, respectively. While we
have extended the oxidation time by four times, only slight increase in oxygen content was
observed, suggesting that the surface functional group oxygen is almost saturated using
this method. They also showed quite similar ORR activity in (C). Therefore, considering
the material preparation cost, we chose to use CB-3h catalyst (10.19% surface oxygen) in
our study for the demonstration of pure H2O2 solution generation.

11
Fig. S6.
The intrinsic 2e--ORR activity of CB-10%. (A) Linear sweep voltammetry (LSV) of
CB-10% catalysts recorded at 1600 rpm and a scan rate of 5 mV s-1, together with the
detected H2O2 currents on the ring electrode (upper panel) at a fixed potential of 1.2 V vs.
RHE. (B) The calculated H2O2 selectivity in 0.1 M Na2SO4 electrolyte using RRDE. (C)
The I-V curve of ORR on CB-10% catalyst using the standard three-electrode setup in a
traditional flow-cell system with 0.5 M H2SO4 (pH = 0), 1.0 M Na2SO4 (pH = 7) and 1.0
M KOH (pH = 14) as the liquid electrolyte. (D) The corresponding FEs of H2O2 under
different potentials. As our focus is to produce pure H2O2 solutions, the most relevant
evaluation of catalyst’s performance is in neutral pH electrolyte. Since many recent reports
of oxidized carbon materials have been evaluated in the alkaline or acidic electrolyte for
2e--ORR, we therefore included the 2e--ORR performance of our sample in alkaline and
acidic solution for fair comparison.

12
Fig. S7.
Characterization of solid electrolyte. (A) SEM image of solid polymer proton conductor.
It shows that the average size of the as-obtained sulfonated styrene-divinylbenzene
copolymer proton conductor is around 50 µm with uniform spherical morphology. (B)
Schematic illustration and SEM image of solid electrolyte layer. Those solid electrolyte
particles were densely packed into the thin middle layer to conduct protons during H2O2
generation. The micron pores between those polymer spheres form a tortuous pathway,
allowing water flow and facilitating the releasing of produced H2O2.

13
Fig. S8.
2e--ORR performance of CB-10% in a standard three-electrode cell with solid
electrolyte (Methods). (A) Digital photo of the three-electrode setup with solid electrolyte.
(B) The 2e--ORR performance of CB-10% catalyst. It shows that the excellent 2e--ORR
selectivity of CB-10% catalyst evaluated in traditional liquid electrolyte can be well
maintained in solid electrolyte. The slightly increased overpotential may due to the
increased charge transfer resistance in solid electrolyte cell compared to the liquid
electrolyte one (61-63). The SE represents the polymer proton solid conductor.

14
Fig. S9.
H2O2 productivity of our O2//SE//H2 system compared with previous literature. The
data are reproduced from ref. 8, 9, and 45-47 (direct synthesis), and 19-21 and 48-53
(electrosynthesis). Our method demonstrated 1-2 orders of magnitude improved
productivity compared to those direct synthesis cases. In addition, the H2O2 selectivity and
current densities in both solid electrolytes (pure products) and different pH solutions are
among the best compared to the state-of-the-art electrochemical synthesis strategies.

15
Fig. S10.
Online H2 detection during H2O2 production and the XPS analysis of post-stability
catalyst. (A) Gas chromatography analysis of cathode gas flow of CB-10%//SE//Pt-C cell
during H2O2 production using O2 and H2. While the potential window of ORR reaction is
more positive than HER, in our case, particularly under large current densities, large
overpotentials might be needed, which could overlap with HER potential window. For
example in fig. S8, we showed that -0.2 V vs. RHE is required for CB-10% catalyst to
deliver a ORR current density of ~110 mA cm-2 with solid electrolyte. We therefore used
a gas chromatography to detect if there are any byproduct of H2 particularly under high
current densities (e.g. 200 mA cm-2 cell current density). Our data shows that no H2 signal
can be detected (lower than the detection limit of the flame ionization detector). It
demonstrates that the measured electrocatalytic cathodic current exclusively stemmed from
oxygen reduction reaction, and there was no contribution from hydrogen evolution even
when operated at such a high current density. (B) XPS survey scans of CB-10% catalyst
after stability test under a relatively high current density. It shows that the surface oxygen
content will decrease to 9.5% after 1 h stability test of CB-10% catalyst, then remain
relatively stable to 9.2% after 30 h test. It suggests that some unstable surface oxygen was
quickly reduced during ORR, but most of the surface functional groups were robust under
ORR conditions, which guarantees the good stability for continuous generation of pure
H2O2 solutions.

16
Fig. S11.
Pure H2O2 generation using O2 and H2 with polymer HO2- conductor and inorganic
proton conductor. The current densities over cell voltages of CB-10%//SE//Pt-C cell with
(A) inorganic CsxH3-xPW12O40 proton solid conductor and (C) HO2- conducting solid-
electrolyte. The corresponding FEs and concentration of H2O2 products under different cell
voltages for (B) inorganic CsxH3-xPW12O40 proton solid conductor and (D) HO2- conducting
solid-electrolyte. Note that the DI flow-rate is 27 mL h-1. The relatively low H2O2 FEs for
cell using HO2- conducting solid-electrolyte is probably caused by the self-decomposition
of H2O2 as significant gas bubbles was observed, as the HO2- conducting solid-electrolyte
provides a high local alkaline environmental for ion-conduction. Based on the working
mechanism of our device, the solid electrolyte we chose needs to satisfy the following two
properties. First, the solid electrolyte should have high ion conductivity for efficient ion
transportations and thus low ohmic-loss and high cell-efficiency; second, the solid
electrolyte should be porous, thus water can flow through this layer to collect H2O2 product.
In principle, different types of porous solid electrolyte, with different materials or different
types of ion conductions (cation or anion), can be used in this system for pure H2O2
generation based on the same working mechanism. This may include ion conducting
polymers with different functional groups, inorganic compounds, or other types of solid
electrolyte materials such as ceramics, polymer/ceramic hybrids or solidified gels. Here,
polymeric conductors for HO2- conduction and inorganic CsxH3-xPW12O40 for cation
conduction were also demonstrated to be effective for pure H2O2 solution generation,
which suggests the wide tunability and versatility of our solid electrolyte design. Please
note here that the different cell performances may be due to the different solid electrolyte
properties.

17
Fig. S12.
H2O2 generation performance of O2//SE//H2 and scaled up cell. H2O2 FEs as a function
of DI water flow rate for (A) O2//SE//H2 under 200 mA cm-2 (4 cm-2 cell) and (B) scaled-
up O2//SE//H2O unit cell under 8 A (80 cm-2 cell), showing the H2O2 selectivity was
decreased with increased H2O2 concentration.

18
Fig. S13
Schematic illustration of the rainwater purification using on-site generated pure H2O2
solution. In our 4 cm2 device experiments, we fixed our DI flow rate (27 mL h-1) as well
as H2O2 generation rate (13.6 mmol h-1), therefore, the concentration of the H2O2 stream
from our device is ~ 0.5 M (17,000 ppm). The rainwater stream flow rate was tunable,
ranging from the highest of 18.32 L h-1 to the lowest of 0.05 L h-1. Therefore, once the DI
flow with generated H2O2 was mixed with rainwater flow, the H2O2 concentration was
diluted to a range from ~ 25 ppm to 6000 ppm. In general, with the rainwater flow rate
(rainwater treatment rate) decreased, the H2O2 concentration in the mixture will be
increased, which can decrease the remaining TOC. To meet the drinking water standards
with the remaining TOC concentration lower than 2 ppm, the maximal rainwater treatment
rate using our 4 cm2 device is 0.88 L h-1 as shown in Fig. 2D. This represents a rainwater
to DI flow rate ratio of 32.6. Once normalized to the electrode area, this rainwater treatment
rate by our design is 0.22 L cm-2electrode h
-1 or 2200 L m-2electrode h
-1.

19
Fig. S14.
Electrosynthesis of H2O2 using pure H2 and H2O separately introduced to the anode and
cathode, respectively. SE represents a solid electrolyte, which is sulfonated styrene-
divinylbenzene copolymer microspheres. AEM and CEM represent anion and cation
exchange membranes, respectively. Electrochemically generated cations (H+) and anions
(HO2-), driven by the electric field, cross in the porous SE layer and recombine to form
H2O2. DI water flowing through the porous SE layer then dissolves the H2O2 with no
impurities.

20
Fig. S15.
Stability of O2//SE//H2O cell. Long-term operation test of direct electrosynthesis of pure
H2O2 solution using O2//SE//H2O cell, showing high selectivity stability at 60 mA using
this proposed system. The FE of H2O2 maintains constant (~ 95%) over the 100-hour
continuous operation. The DI flow-rate is 27 mL h-1.

21
Supplementary Text:
Note 1: Comparison of previously reported polymer membrane design (ref. 19-21)
with our strategy for pure H2O2 generation.
Yamanaka et al. (ref. 19) and Wilkinson et al. (ref.
20 and 21) reported the production of neutral H2O2
solution using a nafion membrane design similar to a
H2/O2 fuel cell, as illustrated on the right. Although
these cell designs have demonstrated neutral H2O2
generation, they suffered from low reaction rates,
product concentrations, and Faradaic efficiencies. For
the batch reactor (ref. 19), only 8 wt.% H2O2 solution
can be produced after 6 h continuous electrolysis with
FE of 26.5%. Moreover, in this case the maximal
production rate for H2O2 is around 0.289 mmol cm-2 h-
1. Wilkinson et al. (ref. 20 and 21) used a flow-through
reactor to continuously produce the neutral H2O2.
However, only small H2O2 production rate (0.2 mmol
cm-2 h-1) can be achieved with a limited FE of ~ 30%.
The maximal concentration of H2O2 is only 1400 ppm.
As a comparison, in our strategy, we achieved high FE
(> 90%) and production rate (3.4 mmol cm-2 h-1), as well
as high product concentration (20 wt.%), outperforming
those previous reports.
Based on our understanding, there might be several reasons for the lower performance
in the previous nafion membrane design. First, the local H2O2 concentration might be high
so that it retards its generation and lowers its selectivity. In this design, H2O2 molecules
are formed and accumulated at the interface between ORR catalysts and membrane, which
are then diffused into H2O or brought out by O2 gas flow. However, this product release
rate is slower than that of our design where generated HO2- ions can quickly diffuse away
into the middle layer as they are driven by the electrical field. Second, since the products
are accumulated at the catalyst-membrane interface, the product collection efficiency might
be low. Third, the local pH of the cation exchange membrane could also impact the
catalysts’ performance.
Here we also briefly analyze the extra membrane and solid electrolyte cost compared
to the nafion membrane design. In our study, the cost of anion exchange membrane (AEM)
is low. For example, the one from Membranes International Inc. is $6480 for 1.2m ×
36.50m size AEM, translating to only ~ $148/m2. Considering the impressive long-term
stability, the net cost of the AEM is very low. Furthermore, we believe the cost for the solid
electrolyte is also negligible based on the following considerations: 1) the main cost of the
solid electrolyte is from the styrene-divinylbenzene copolymer which is only ~ $2/kg,
while the use in a 1 m2 device could be only ~ 1.9 kg; 2) we found the solid electrolyte is
very robust and no performance decay can be observed even after 3 times of long-term
stability test. Considering the dramatically improved production rate and cell efficiency
compared with previously reported designs, we believe that the extra cost for our design is
negligible when the device is used for practical H2O2 generation.
Fig. N1. Previously reported (A)
batch and (B) flow thorough
reactor for neutral H2O2
generation.

22
Note 2: N-doped carbon and adequately porous carbons for 2e--ORR.
N-doped carbon and porous carbon have been previously reported for 2e--ORR.
Below we will discuss in detail about some advantages of the oxidized carbon black we
used in this work compared to those reported catalysts.
First, the cost of catalyst synthesis is an important consideration in our study. While
the above-mentioned metal-free catalysts showed very impressive 2e--ORR performance,
their synthesis costs could be higher compared to that of the oxidized carbon black. To be
specific, in ref. 27, Iglesia et al. reported the beautiful synthesis of graphitized N-doped
single-wall carbon nanohorns (g-N-CNHs) for H2O2 production. However, at least three
steps are needed to prepare g-N-CNHs, which involve high temperature process (700 °C)
and precursors like carbon nanohorns, dopamine hydrochloride and so on (higher cost than
carbon black). In ref. 28, Fellinger et al. prepared mesoporous nitrogen-doped carbon
derived from the ionic liquid N-butyl-3-methylpyridinium dicyanamide for 2e--ORR,
which is a more expensive precursor than carbon black. In ref. 29, Liu et al. prepared the
highly porous carbon by annealing MOF-5 precursor at 1100 ºC under H2 or Ar atmosphere
with a holding time of 5 h. In addition, the preparation of the MOF-5 precursor needs long
aging time (36 h) and higher cost raw materials (e.g. 1,4-benzenedicarboxylic acid and N,
N-dimethylformamide). Our high-performance CB-10% catalyst can be easily produced
by refluxing commercial carbon black in nitric acid for 3 h under only 85 °C, which we
believe is more economically viable than the above-mentioned cases.
Second but more importantly, while these mentioned catalysts showed impressive 2e-
-ORR performances in acidic electrolyte, their 2e--ORR performances are not as good as
our catalyst in neutral pH. For example, g-N-CNHs catalyst (ref. 27) delivered an average
H2O2 FE of ~70% in pH = 7.4 electrolyte; the porous carbon catalyst (ref. 29) showed a
maximal H2O2 FE of ~80% in pH = 7 electrolyte.

23
Note 3: Exclusion of possible Pt contamination on ORR cathode in O2//SE//H2 cell.
It has been widely accepted in hydrogen evolution reaction tests that a Pt counter
electrode should not be used for water oxidation. This is because trace amount of Pt ions
could be dissolved in electrolyte due to the high OER working potentials, and then be
electroplated onto the HER catalyst and contribute to its excellent performance. However,
in this current work the situation is different. First, the Pt electrode in our cell is used for
hydrogen oxidation, which has a much lower working potential than that of water oxidation.
Under HOR reaction conditions Pt can be very stable as demonstrated in traditional H2 fuel
cells. We also confirmed by ICP-OER analysis that Pt ions were not detectable (lower than
the detection limit of 50 ppb) in generated H2O2 solution from the middle layer
(Supplementary Table S1). This result confirms that no Pt atoms migrate from the anode
into the middle solid electrolyte layer, not to mention the cathode side. In addition, the
anion exchange membrane separating the cathode and solid electrolyte layer functions as
another layer of protection, since cations cannot be transported across the AEM into the
cathode. Lastly, as further direct evidence, no Pt signal can be detected from the ORR
catalyst electrode by XPS even after the 30-h stability test at 125 mA cm-2 (fig. S10B)
24
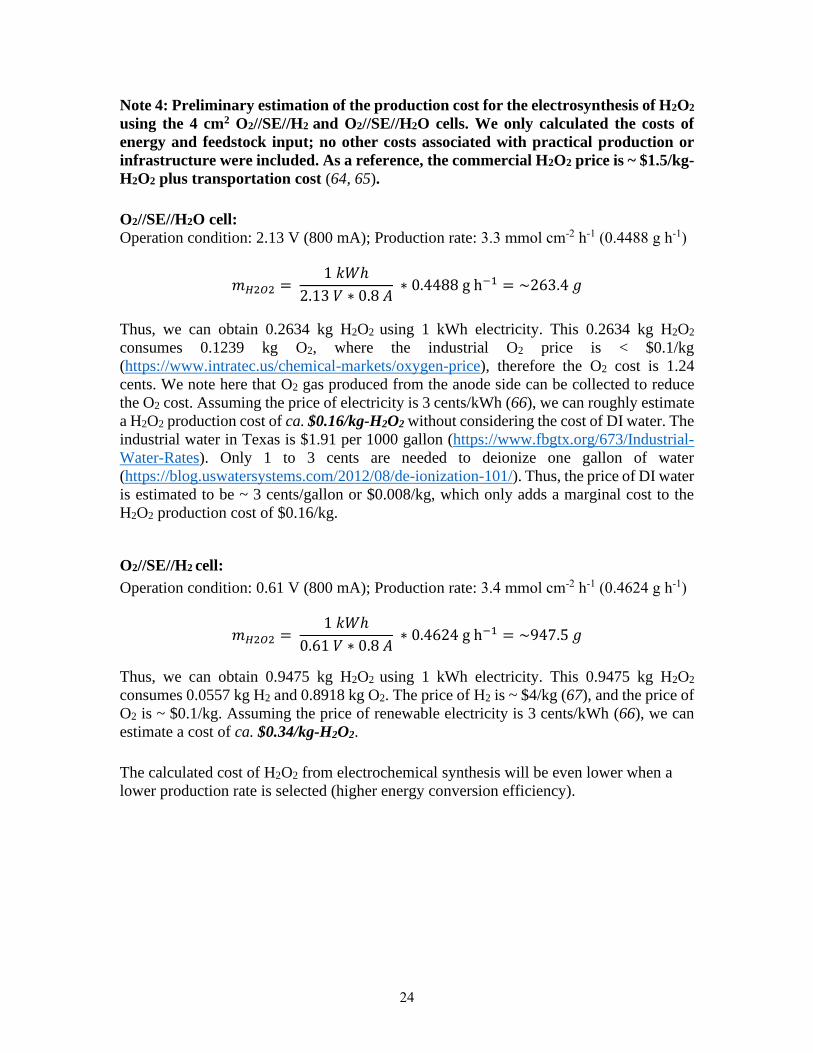
Note 4: Preliminary estimation of the production cost for the electrosynthesis of H2O2
using the 4 cm2 O2//SE//H2 and O2//SE//H2O cells. We only calculated the costs of
energy and feedstock input; no other costs associated with practical production or
infrastructure were included. As a reference, the commercial H2O2 price is ~ $1.5/kg-
H2O2 plus transportation cost (64, 65).
O2//SE//H2O cell:
Operation condition: 2.13 V (800 mA); Production rate: 3.3 mmol cm-2 h-1 (0.4488 g h-1)
𝑚𝐻2𝑂2 = 1 𝑘𝑊ℎ
2.13 𝑉 ∗ 0.8 𝐴 ∗ 0.4488 g h−1 = ~263.4 𝑔
Thus, we can obtain 0.2634 kg H2O2 using 1 kWh electricity. This 0.2634 kg H2O2
consumes 0.1239 kg O2, where the industrial O2 price is < $0.1/kg
(https://www.intratec.us/chemical-markets/oxygen-price), therefore the O2 cost is 1.24
cents. We note here that O2 gas produced from the anode side can be collected to reduce
the O2 cost. Assuming the price of electricity is 3 cents/kWh (66), we can roughly estimate
a H2O2 production cost of ca. $0.16/kg-H2O2 without considering the cost of DI water. The
industrial water in Texas is $1.91 per 1000 gallon (https://www.fbgtx.org/673/Industrial-
Water-Rates). Only 1 to 3 cents are needed to deionize one gallon of water
(https://blog.uswatersystems.com/2012/08/de-ionization-101/). Thus, the price of DI water
is estimated to be ~ 3 cents/gallon or $0.008/kg, which only adds a marginal cost to the
H2O2 production cost of $0.16/kg.
O2//SE//H2 cell:
Operation condition: 0.61 V (800 mA); Production rate: 3.4 mmol cm-2 h-1 (0.4624 g h-1)
𝑚𝐻2𝑂2 = 1 𝑘𝑊ℎ
0.61 𝑉 ∗ 0.8 𝐴 ∗ 0.4624 g h−1 = ~947.5 𝑔
Thus, we can obtain 0.9475 kg H2O2 using 1 kWh electricity. This 0.9475 kg H2O2
consumes 0.0557 kg H2 and 0.8918 kg O2. The price of H2 is ~ $4/kg (67), and the price of
O2 is ~ $0.1/kg. Assuming the price of renewable electricity is 3 cents/kWh (66), we can
estimate a cost of ca. $0.34/kg-H2O2.
The calculated cost of H2O2 from electrochemical synthesis will be even lower when a
lower production rate is selected (higher energy conversion efficiency).

25
Supplementary Table S1. The concentration of impurities for generated H2O2 using
O2//SE//H2O cell. Note that the reported concentrations are average results acquired from
5 independent tests.
Sodium Iron Sulfur Platinum
0.872 ppm 0.022 ppm 2.62 ppm Lower than
detection limit

26
References and Notes 1. S. Yang, A. Verdaguer-Casadevall, L. Arnarson, L. Silvioli, V. Čolić, R. Frydendal, J.
Rossmeisl, I. Chorkendorff, I. E. L. Stephens, Toward the decentralized electrochemical production of H2O2: A focus on the catalysis. ACS Catal. 8, 4064–4081 (2018). doi:10.1021/acscatal.8b00217
2. Y. Yi, L. Wang, G. Li, H. Guo, A review on research progress in the direct synthesis of hydrogen peroxide from hydrogen and oxygen: Noble-metal catalytic method, fuel-cell method and plasma method. Catal. Sci. Technol. 6, 1593–1610 (2016). doi:10.1039/C5CY01567G
3. R. J. Lewis, G. J. Hutchings, Recent advances in the direct synthesis of H2O2. ChemCatChem 11, 298–308 (2019). doi:10.1002/cctc.201801435
4. J. K. Edwards, G. J. Hutchings, Palladium and gold-palladium catalysts for the direct synthesis of hydrogen peroxide. Angew. Chem. Int. Ed. 47, 9192–9198 (2008). doi:10.1002/anie.200802818 Medline
5. J. H. Lunsford, The direct formation of H2O2 from H2 and O2 over palladium catalysts. J. Catal. 216, 455–460 (2003). doi:10.1016/S0021-9517(02)00070-2
6. D. P. Dissanayake, J. H. Lunsford, Evidence for the role of colloidal palladium in the catalytic formation of H2O2 from H2 and O2. J. Catal. 206, 173–176 (2002). doi:10.1006/jcat.2001.3501
7. J. K. Edwards, B. Solsona, E. N. N, A. F. Carley, A. A. Herzing, C. J. Kiely, G. J. Hutchings, Switching off hydrogen peroxide hydrogenation in the direct synthesis process. Science 323, 1037–1041 (2009). doi:10.1126/science.1168980 Medline
8. J. K. Edwards, E. Ntainjua, A. F. Carley, A. A. Herzing, C. J. Kiely, G. J. Hutchings, Direct synthesis of H2O2 from H2 and O2 over gold, palladium, and gold-palladium catalysts supported on acid-pretreated TiO2. Angew. Chem. Int. Ed. 48, 8512–8515 (2009). doi:10.1002/anie.200904115 Medline
9. S. J. Freakley, Q. He, J. H. Harrhy, L. Lu, D. A. Crole, D. J. Morgan, E. N. Ntainjua, J. K. Edwards, A. F. Carley, A. Y. Borisevich, C. J. Kiely, G. J. Hutchings, Palladium-tin catalysts for the direct synthesis of H2O2 with high selectivity. Science 351, 965–968 (2016). doi:10.1126/science.aad5705 Medline
10. Q. Liu, J. C. Bauer, R. E. Schaak, J. H. Lunsford, Direct synthesis of H2O2 from H2 and O2 over Pd–Pt/SiO2 bimetallic catalysts in a H2SO4/ethanol system. Appl. Catal. A Gen. 339, 130–136 (2008). doi:10.1016/j.apcata.2008.01.026
11. S. Abate, R. Arrigo, M. E. Schuster, S. Perathoner, G. Centi, A. Villa, D. Su, R. Schlögl, Pd nanoparticles supported on N-doped nanocarbon for the direct synthesis of H2O2 from H2 and O2. Catal. Today 157, 280–285 (2010). doi:10.1016/j.cattod.2010.01.027
12. Q. Liu, J. C. Bauer, R. E. Schaak, J. H. Lunsford, Supported palladium nanoparticles: An efficient catalyst for the direct formation of H2O2 from H2 and O2. Angew. Chem. Int. Ed. 47, 6221–6224 (2008). doi:10.1002/anie.200801517 Medline
13. C. E. Baukal Jr., Oxygen-Enhanced Combustion (CRC, 2013).

27
14. S. Siahrostami, A. Verdaguer-Casadevall, M. Karamad, D. Deiana, P. Malacrida, B. Wickman, M. Escudero-Escribano, E. A. Paoli, R. Frydendal, T. W. Hansen, I. Chorkendorff, I. E. L. Stephens, J. Rossmeisl, Enabling direct H2O2 production through rational electrocatalyst design. Nat. Mater. 12, 1137–1143 (2013). doi:10.1038/nmat3795 Medline
15. H. W. Kim, M. B. Ross, N. Kornienko, L. Zhang, J. Guo, P. Yang, B. D. McCloskey, Efficient hydrogen peroxide generation using reduced graphene oxide-based oxygen reduction electrocatalysts. Nat. Catal. 1, 282–290 (2018). doi:10.1038/s41929-018-0044-2
16. Z. Lu, G. Chen, S. Siahrostami, Z. Chen, K. Liu, J. Xie, L. Liao, T. Wu, D. Lin, Y. Liu, T. F. Jaramillo, J. K. Nørskov, Y. Cui, High-efficiency oxygen reduction to hydrogen peroxide catalysed by oxidized carbon materials. Nat. Catal. 1, 156–162 (2018). doi:10.1038/s41929-017-0017-x
17. S. Chen, Z. Chen, S. Siahrostami, D. Higgins, D. Nordlund, D. Sokaras, T. R. Kim, Y. Liu, X. Yan, E. Nilsson, R. Sinclair, J. K. Nørskov, T. F. Jaramillo, Z. Bao, Designing boron nitride islands in carbon materials for efficient electrochemical synthesis of hydrogen peroxide. J. Am. Chem. Soc. 140, 7851–7859 (2018). doi:10.1021/jacs.8b02798 Medline
18. S. Chen, Z. Chen, S. Siahrostami, T. R. Kim, D. Nordlund, D. Sokaras, S. Nowak, J. W. F. To, D. Higgins, R. Sinclair, J. K. Nørskov, T. F. Jaramillo, Z. Bao, Defective carbon-based materials for the electrochemical synthesis of hydrogen peroxide. ACS Sustain. Chem. Eng. 6, 311–317 (2017). doi:10.1021/acssuschemeng.7b02517
19. I. Yamanaka, T. Murayama, Neutral H2O2 synthesis by electrolysis of water and O2. Angew. Chem. Int. Ed. 47, 1900–1902 (2008). doi:10.1002/anie.200704431 Medline
20. W. Li, A. Bonakdarpour, E. Gyenge, D. P. Wilkinson, Drinking water purification by electrosynthesis of hydrogen peroxide in a power-producing PEM fuel cell. ChemSusChem 6, 2137–2143 (2013). doi:10.1002/cssc.201300225 Medline
21. W. T. Li, A. Bonakdarpour, E. Gyenge, D. P. Wilkinson, Design of bifunctional electrodes for co-generation of electrical power and hydrogen peroxide. J. Appl. Electrochem. 48, 985–993 (2018). doi:10.1007/s10800-018-1232-0
22. D. W. Flaherty, Direct synthesis of H2O2 from H2 and O2 on Pd catalysts: Current understanding, outstanding questions, and research needs. ACS Catal. 8, 1520–1527 (2018). doi:10.1021/acscatal.7b04107
23. X. Tian, P. Zhao, W. Sheng, Hydrogen evolution and oxidation: Mechanistic studies and material advances. Adv. Mater. 31, e1808066 (2019). doi:10.1002/adma.201808066 Medline
24. W. Sheng, H. A. Gasteiger, Y. Shao-Horn, Hydrogen oxidation and evolution reaction kinetics on platinum: Acid vs alkaline electrolytes. J. Electrochem. Soc. 157, B1529–B1536 (2010). doi:10.1149/1.3483106
25. M. S. Wilson, S. Gottesfeld, High performance catalyzed membranes of ultra‐low Pt loadings for polymer electrolyte fuel cells. J. Electrochem. Soc. 139, L28–L30 (1992). doi:10.1149/1.2069277

28
26. J. S. Jirkovský, I. Panas, E. Ahlberg, M. Halasa, S. Romani, D. J. Schiffrin, Single atom hot-spots at Au-Pd nanoalloys for electrocatalytic H2O2 production. J. Am. Chem. Soc. 133, 19432–19441 (2011). doi:10.1021/ja206477z Medline
27. L. Han, Y. Sun, S. Li, C. Cheng, C. E. Halbig, P. Feicht, J. L. Hübner, P. Strasser, S. Eigler, In-plane carbon lattice-defect regulating electrochemical oxygen reduction to hydrogen peroxide production over nitrogen-doped graphene. ACS Catal. 9, 1283–1288 (2019). doi:10.1021/acscatal.8b03734
28. D. Iglesias, A. Giuliani, M. Melchionna, S. Marchesan, A. Criado, L. Nasi, M. Bevilacqua, C. Tavagnacco, F. Vizza, M. Prato, P. Fornasiero, N-doped graphitized carbon nanohorns as a forefront electrocatalyst in highly selective O2 reduction to H2O2. Chem 4, 106–123 (2018). doi:10.1016/j.chempr.2017.10.013
29. T.-P. Fellinger, F. Hasché, P. Strasser, M. Antonietti, Mesoporous nitrogen-doped carbon for the electrocatalytic synthesis of hydrogen peroxide. J. Am. Chem. Soc. 134, 4072–4075 (2012). doi:10.1021/ja300038p Medline
30. Y. Liu, X. Quan, X. Fan, H. Wang, S. Chen, High-yield electrosynthesis of hydrogen peroxide from oxygen reduction by hierarchically porous carbon. Angew. Chem. Int. Ed. 54, 6837–6841 (2015). doi:10.1002/anie.201502396 Medline
31. S. C. Perry, D. Pangotra, L. Vieira, L.-I. Csepei, V. Sieber, L. Wang, C. Ponce de León, F. C. Walsh, Electrochemical synthesis of hydrogen peroxide from water and oxygen. Nat. Rev. Chem. 3, 442–458 (2019). doi:10.1038/s41570-019-0110-6
32. S. Günday, A. Bozkurt, W. H. Meyer, G. Wegner, Effects of different acid functional groups on proton conductivity of polymer‐1, 2, 4‐triazole blends. J. Polym. Sci. B 44, 3315–3322 (2006). doi:10.1002/polb.20956
33. W. A. England, M. Cross, A. Hamnett, P. Wiseman, J. B. Goodenough, Fast proton conduction in inorganic ion-exchange compounds. Solid State Ion. 1, 231–249 (1980). doi:10.1016/0167-2738(80)90007-7
34. L. Fan, S. Wei, S. Li, Q. Li, Y. Lu, Recent progress of the solid‐state electrolytes for high‐energy metal‐based batteries. Adv. Energy Mater. 8, 1702657 (2018). doi:10.1002/aenm.201702657
35. Q. Zhao, X. Liu, S. Stalin, K. Khan, L. A. Archer, Solid-state polymer electrolytes with in-built fast interfacial transport for secondary lithium batteries. Nat. Energy 4, 365–373 (2019). doi:10.1038/s41560-019-0349-7
36. S. H. Lee, J. C. Rasaiah, Proton transfer and the mobilities of the H+ and OH- ions from studies of a dissociating model for water. J. Chem. Phys. 135, 124505 (2011). doi:10.1063/1.3632990 Medline
37. F. M. Coutinho, S. M. Rezende, B. G. Soares, Characterization of sulfonated poly (styrene–divinylbenzene) and poly (divinylbenzene) and its application as catalysts in esterification reaction. J. Appl. Polym. Sci. 102, 3616–3627 (2006). doi:10.1002/app.24046
38. R. C. Weast, M. J. Astle, W. H. Beyer, CRC Handbook of Chemistry and Physics (CRC, 1988), vol. 69.

29
39. K. J. Jeong, C. M. Miesse, J.-H. Choi, J. Lee, J. Han, S. P. Yoon, S. W. Nam, T.-H. Lim, T. G. Lee, Fuel crossover in direct formic acid fuel cells. J. Power Sources 168, 119–125 (2007). doi:10.1016/j.jpowsour.2007.02.062
40. Z. M. Galbács, L. J. Csányi, Alkali-induced decomposition of hydrogen peroxide. J. Chem. Soc., Dalton Trans. 11, 2353–2357 (1983). doi:10.1039/DT9830002353
41. M. Ravikumar, A. Shukla, Effect of methanol crossover in a liquid‐feed polymer‐electrolyte direct methanol fuel cell. J. Electrochem. Soc. 143, 2601–2606 (1996). doi:10.1149/1.1837054
42. B. D. Black, G. W. Harrington, P. C. Singer, Reducing cancer risks by improving organic carbon removal. J. Am. Water Works Assoc. 88, 40–52 (1996). doi:10.1002/j.1551-8833.1996.tb06570.x
43. A. Wenzel, A. Gahr, R. Niessner, TOC-removal and degradation of pollutants in leachate using a thin-film photoreactor. Water Res. 33, 937–946 (1999). doi:10.1016/S0043-1354(98)00302-9
44. Texas Commission on Environmental Quality, Total Organic Carbon (TOC) Guidance Manual; https://tceq.texas.gov/assets/public/comm_exec/pubs/rg/rg-379.pdf.
45. P. Biasi, F. Menegazzo, F. Pinna, K. Eränen, T. O. Salmi, P. Canu, Continuous H2O2 direct synthesis over PdAu catalysts. Chem. Eng. J. 176–177, 172–177 (2011). doi:10.1016/j.cej.2011.05.073
46. J. Zhang, Q. Shao, Y. Zhang, S. Bai, Y. Feng, X. Huang, Promoting the direct H2O2 generation catalysis by using hollow Pd–Sn intermetallic nanoparticles. Small 14, 1703990 (2018). doi:10.1002/smll.201703990
47. F. Li, Q. Shao, M. Hu, Y. Chen, X. Huang, Hollow Pd–Sn nanocrystals for efficient direct H2O2 synthesis: The critical role of Sn on structure evolution and catalytic performance. ACS Catal. 8, 3418–3423 (2018). doi:10.1021/acscatal.8b00347
48. I. Yamanaka, T. Hashimoto, R. Ichihashi, K. Otsuka, Direct synthesis of H2O2 acid solutions on carbon cathode prepared from activated carbon and vapor-growing-carbon-fiber by a H2/O2 fuel cell. Electrochim. Acta 53, 4824–4832 (2008). doi:10.1016/j.electacta.2008.02.009
49. I. Yamanaka, T. Onizawa, S. Takenaka, K. Otsuka, Direct and continuous production of hydrogen peroxide with 93% selectivity using a fuel-cell system. Angew. Chem. Int. Ed. 42, 3653–3655 (2003). doi:10.1002/anie.200351343 Medline
50. I. Yamanaka, T. Onizawa, H. Suzuki, N. Hanaizumi, K. Otsuka, Electrocatalysis of heat-treated Mn–porphyrin/carbon cathode for synthesis of H2O2 acid solutions by H2/O2 fuel cell method. Chem. Lett. 35, 1330–1331 (2006). doi:10.1246/cl.2006.1330
51. H. J. Luo, C. L. Li, C. Q. Wu, X. Q. Dong, In situ electrosynthesis of hydrogen peroxide with an improved gas diffusion cathode by rolling carbon black and PTFE. RSC Advances 5, 65227–65235 (2015). doi:10.1039/C5RA09636G
52. A. Da Pozzo, L. Di Palma, C. Merli, E. Petrucci, An experimental comparison of a graphite electrode and a gas diffusion electrode for the cathodic production of hydrogen peroxide. J. Appl. Electrochem. 35, 413–419 (2005). doi:10.1007/s10800-005-0800-2

30
53. Z. Chen, S. Chen, S. Siahrostami, P. Chakthranont, C. Hahn, D. Nordlund, S. Dimosthenis, J. K. Nørskov, Z. Bao, T. F. Jaramillo, Development of a reactor with carbon catalysts for modular-scale, low-cost electrochemical generation of H2O2. React. Chem. Eng. 2, 239–245 (2017). doi:10.1039/C6RE00195E
54. K. Jiang, S. Siahrostami, A. J. Akey, Y. Li, Z. Lu, J. Lattimer, Y. Hu, C. Stokes, M. Gangishetty, G. Chen, Y. Zhou, W. Hill, W.-B. Cai, D. Bell, K. Chan, J. K. Nørskov, Y. Cui, H. Wang, Transition-metal single atoms in a graphene shell as active centers for highly efficient artificial photosynthesis. Chem 3, 950–960 (2017). doi:10.1016/j.chempr.2017.09.014
55. J. Millar, D. Smith, W. Marr, T. Kressman, Solvent-modified polymer networks. Part I. The preparation and characterisation of expanded-network and macroporous styrene–divinylbenzene copolymers and their sulphonates. J. Chem. Soc. 0, 218–225 (1963). doi:10.1039/JR9630000218
56. T. Okuhara, H. Watanabe, T. Nishimura, K. Inumaru, M. Misono, Microstructure of cesium hydrogen salts of 12-tungstophosphoric acid relevant to novel acid catalysis. Chem. Mater. 12, 2230–2238 (2000). doi:10.1021/cm9907561
57. K. A. Wepasnick, B. A. Smith, J. L. Bitter, D. Howard Fairbrother, Chemical and structural characterization of carbon nanotube surfaces. Anal. Bioanal. Chem. 396, 1003–1014 (2010). doi:10.1007/s00216-009-3332-5 Medline
58. W. Zhou, L. Rajic, L. Chen, K. Kou, Y. Ding, X. Meng, Y. Wang, B. Mulaw, J. Gao, Y. Qin, A. N. Alshawabkeh, Activated carbon as effective cathode material in iron-free Electro-Fenton process: Integrated H2O2 electrogeneration, activation, and pollutants adsorption. Electrochim. Acta 296, 317–326 (2019). doi:10.1016/j.electacta.2018.11.052 Medline
59. A. J. Plomp, D. S. Su, K. Jong, J. H. Bitter, On the nature of oxygen-containing surface groups on carbon nanofibers and their role for platinum deposition: An XPS and titration study. J. Phys. Chem. C 113, 9865–9869 (2009). doi:10.1021/jp900637q
60. P. Wang, S. Zhan, Y. Xia, S. Ma, Q. Zhou, Y. Li, The fundamental role and mechanism of reduced graphene oxide in rGO/Pt-TiO2 nanocomposite for high-performance photocatalytic water splitting. Appl. Catal. B 207, 335–346 (2017). doi:10.1016/j.apcatb.2017.02.031
61. J. B. Vennekoetter, R. Sengpiel, M. Wessling, Beyond the catalyst: How electrode and reactor design determine the product spectrum during electrochemical CO2 reduction. Chem. Eng. J. 364, 89–101 (2019). doi:10.1016/j.cej.2019.01.045
62. F. Sagane, T. Abe, Y. Iriyama, Z. Ogumi, Li+ and Na+ transfer through interfaces between inorganic solid electrolytes and polymer or liquid electrolytes. J. Power Sources 146, 749–752 (2005). doi:10.1016/j.jpowsour.2005.03.075
63. Y. Iriyama, T. Kako, C. Yada, T. Abe, Z. Ogumi, Charge transfer reaction at the lithium phosphorus oxynitride glass electrolyte/lithium cobalt oxide thin film interface. Solid State Ion. 176, 2371–2376 (2005). doi:10.1016/j.ssi.2005.02.025
64. USP Technologies, How much does H2O2 cost?; http://www.h2o2.com/faqs/FaqDetail.aspx?fId=25.

31
65. K. Fuku, Y. Miyase, Y. Miseki, T. Gunji, K. Sayama, Enhanced oxidative hydrogen peroxide production on conducting glass anodes modified with metal oxides. ChemistrySelect 1, 5721–5726 (2016). doi:10.1002/slct.201601469
66. S. Chu, Y. Cui, N. Liu, The path towards sustainable energy. Nat. Mater. 16, 16–22 (2016). doi:10.1038/nmat4834 Medline
67. Argonne National Laboratory, Hydrogen Demand, Production, and Cost by Region to 2050; https://publications.anl.gov/anlpubs/2005/09/54462.pdf.