supplementary information - nature · supplementary table 5: list of plasmid parts and their...
TRANSCRIPT

Page 1. Mathematical Modelling 2 1.1 Models of Input Promoters 2
Supplementary Figure 1: Binding states of the PBAD, PTet, and PLas promoters
Supplementary Figure 2: The transfer function of the PLas promoter
Supplementary Table 1: Parameters for the PBAD, PTet, and PLas promoters
1.2 Model of Tandem Promoters 5 Supplementary Figure 3: Interference in tandem promoters
1.3 NOT Gate Model 6 Supplementary Figure 4: Binding states of the PCI promoter
Supplementary Figure 5: The transfer function of the PCI promoter
Supplementary Table 2: NOT gate parameters
2. Flow Cytometry Data 8 Supplementary Figure 6: Flow cytometry data for all possible two-input logic gate
Supplementary Figure 7: Dynamic range for various Boolean logic gates constructed
3. Comparison of Liquid and Plate-based Cytometry Distributions 9 Supplementary Figure 8: Comparison of the distributions for the NOT A gate
Supplementary Figure 9: Population averaging effect
4. Robustness in Plate Assay Conditions 10 Supplementary Figure 10: Distance, time interval, and density dependence
Supplementary Table 3: PDE model parameters
Supplementary Figure 11: XOR gate time delay dependence
5. Liquid Culture Assay 13 Supplementary Figure 12: The XOR circuit as measured in liquid culture
6. Strains, Plasmid Maps, and Plasmid Constructions 15 Supplementary Table 4: Bacterial strain list
Supplementary Table 5: List of plasmid parts and their sources
7. Supplemental References 19
SUPPLEMENTARY INFORMATIONdoi:10.1038/nature09565
WWW NATURE.COM/NATURE | 1

1. Mathematical Modelling 1.1. Models of Input Promoters
The binding of ligands to transcription factors and transcription factors to DNA is modelled for three
inducible promoters (Ara-inducible PBAD, aTc-inducible PTet, and 3OC12-HSL inducible PLas). The
binding of a ligand to its transcription factor at equilibrium is
, (1)
where C is the concentration of bound transcription factor, C0 is the total concentration of
transcription factors, L is the concentrations of ligands, Kd is the dissociation constant, and n is the
cooperativity. By mass conservation, the concentration of free transcription factor CF is
F 0C C C . (2)
The binding of transcription factors to their promoters are modelled according to the Shea-Ackers
formulism1-3
. The binding states for each promoter are shown in Supplementary Figure 1. The probability
for each promoter being in open complex P is described by the following equations:
1 2
1 2 31BAD
F
K K CP
K K C K C
, (3)
1
2 2
1 2 21 2Tet
F F
KP
K K C K C
and (4)
1 2
1 21Las
K K CP
K K C
. (5)
To parameterize Equations 3-5, the transfer functions of each promoter are determined by varying the
concentration of inducer and measuring the expression of YFP (plasmids pOR10, pOR20, and pOR30).
Parameters are fit to the normalized fluorescence data for each promoter (Supplementary Table 1). The
plot of the model transfer function using these parameters for the PBAD and PTet promoters are shown in
Fig. 1c and in Supplementary Figure 2 for the PLas promoter.
nn
d
n
LK
LCC
0
SUPPLEMENTARY INFORMATIONRESEARCHdoi:10.1038/nature09565
WWW NATURE.COM/NATURE | 2

Supplementary Figure 1: The binding states of the PBAD, PTet, and PLas promoters used to generate Equations 3-5 are shown. The numbers correspond to the location of operator sites and promoter
boundaries with respect to the +1 transcription start site. The terms of the partition function for each state
are shown on the right. The concentration of RNAP is assumed to be constant and some potential states
(not shown) are assumed to be infrequently occupied to reduce the number of parameters.
SUPPLEMENTARY INFORMATIONRESEARCHdoi:10.1038/nature09565
WWW NATURE.COM/NATURE | 3

Supplementary Figure 2: The transfer function of the PLas promoter. The fit to
the model is shown as the solid line.
Fluorescence values and their error bars are
calculated as averages and one standard
deviation from three experiments.
Supplementary Table 1: Parameters for the PBAD, PTet, and PLas promoters Parameters PBAD PTet PLas Kd
0.09 mM 1.7 ng/mL 0.2 μM
a
n 2.8 1.0 1.4
K1
0.009 350 a 0.002
K2C0 37.5 160 100
K3C0 3.4
gfpmax b
7650 au 3000 au 690 au a Parameter was set according to the literature value
4,6.
b The fluorescence produced at maximum induction.
SUPPLEMENTARY INFORMATIONRESEARCHdoi:10.1038/nature09565
WWW NATURE.COM/NATURE | 4

1.2. Model of Tandem Promoters
When two promoters control the transcription of a gene, the promoters can be additive or they could
interfere with each other (either positively or negatively). In the additive case, the production of protein X
is modelled as,
XPbaPbadt
dXDDDUUU , (6)
where Pi is the probability of promoter i being in the open complex, ai is the maximum transcription rate,
bi is protein production rate, and is the degradation rate. The subscripts U and D indicate the upstream
and downstream promoter, respectively (Supplementary Figure 3). Considering the individually measured
transfer functions, Equation 6 reduces to the following at steady-state,
DDUUDDD
UUU PXPXP
baP
baX maxmax
, (7)
where XUmax
and XDmax
are the maximum concentrations of protein produced from each promoter
independently at steady-state. Note that Equation 7 reflects a model of an OR gate, where the two one-
dimensional transfer functions of the input promoters are used to generate the two-dimensional transfer
function of the gate. This equation is used to generate the “predicted” transfer functions in Fig. 2a.
There are a number of ways that the two promoters could interfere with each other. If adding a
downstream promoter impacts an upstream promoter – either by changing the transcription, mRNA
degradation, or protein expression rates – then this effect can be included as a linear factor U
(Supplementary Figure 3a). Similarly, if the upstream promoter impacts the parameters of the
downstream promoter, then this can be included as a linear factor D. Together, this yields the modified
transfer functions,
DDDUUU PXPXX maxmax . (8)
To model the non-additive effect of combining two promoters, the two-dimensional transfer function of
tandem promoters is fit to Equation 8 and U and D are treated as fit parameters. The values of the
parameters that give the best fit quantify the degree to which there is interference between promoters. In
most cases, the value of these parameters is ~1 for tandem promoters, indicating that they are behaving
additively (Supplementary Figure 3c). Very high or low values of indicate interference. For example,
PBAD exhibits significant interference when it is placed in the downstream position.
The simple factors in Equation 8 are sufficient to explain the interference that occurs between the PBAD
and PTet promoters. More complex interference could occur between promoters and this would require
additional terms. For example, if the binding of a transcription factor to one promoter impacts the free
energy of transcription factors binding to the second promoter, then this would not be captured in
Equation 8. Similarly, if the activity of one promoter was impacted non-linearly by the activity of the
second promoter, this would require more complex treatment.
SUPPLEMENTARY INFORMATIONRESEARCHdoi:10.1038/nature09565
WWW NATURE.COM/NATURE | 5

Supplementary Figure 3: An example of interference between tandem promoters is shown. a, The
parameter αD is the interference that an
upstream promoter exerts on
downstream promoters. The parameter
αU is the interference that a
downstream promoter exerts on
upstream promoters. b, The
experimentally-obtained transfer
function of the PTet-PBAD tandem
promoters is shown (plasmid
pOR2010). If there was no
interference, these tandem promoters
should behave as an OR gate (U = D
= 1). The transfer functions are shown
with U = D = 1 set to one (middle) as
well as with U and D values from a
best fit (right). c, The interference
factors are compared for all of the
promoters used in this study. The
tandem promoter pairs used to obtain
the U and D values are shown.
1.3. NOT Gate Model
The repression of the PCI promoter by CI is modelled using the Shea-Ackers formulism1-3
with the
promoter states shown in Supplementary Figure 4. The probability of the promoter forming an open
complex is
1
2
1 2 3 2 3 01R
KP
K K R K R K K K R
, (9)
where R is the concentration of repressors and the binding constants are as described in Supplementary
Figure 4. The objective of the model is to be able to predict how a NOR gate will behave when two input
promoters are connected. As such, Equation 9 is parameterized as a NOT gate using the PTet promoter as
an input. The output of PTet, as measured using YFP, is used as a surrogate for the repressor concentration
in Equation 9. In this way, it can be predicted whether a particular promoter can be connected to the gate
by measuring its transfer function using the same genetic background and reporter. This approach has
been used previously to characterize an AND gate5. The experimental data for the transfer function of the
NOT gate is shown in Supplementary Figure 5. Equation 9 is combined with Equations 3-5 to generate
the “predicted” transfer functions of the NOR gate in Fig. 2b. For a particular gate, the transfer functions
of the two input promoters are additively combined (Equation 7) and this is used as R in Equation 9.
SUPPLEMENTARY INFORMATIONRESEARCHdoi:10.1038/nature09565
WWW NATURE.COM/NATURE | 6

Supplementary Figure 4: Schematic diagram of the binding states used to model the PCI promoter. The numbers correspond to the
location of operator sites and promoter
boundaries with respect to the +1 transcription
start site. The partition function terms for each
state are shown on the right. The concentration
of RNAP is assumed to be constant.
Supplementary Figure 5: The transfer function of the PCI promoter. Each point represents a single concentration of
aTc. The output of the PTet promoter (R) is measured using
plasmid pOR1020 and the output of the NOT gate is
measured in a separate experiment using plasmid pCI-YFP
and pNOR1020. The concentrations of of aTc are (0, 0.025,
0.25, 2.5, 25, 250 ng/mL). The fit to Equation 9 is shown as
the solid line. Fluorescence values and their error bars are
calculated as averages and one standard deviation from three
experiments.
Supplementary Table 2: NOT Gate Parameters
Parameters K1
350
a
K2 0.015 au
-1
K3
0.5 au-1
K0 0.18
gfpmax b
181 au a Parameter was estimated from the literature value
6.
b The fluorescence produced at maximum induction.
SUPPLEMENTARY INFORMATIONRESEARCHdoi:10.1038/nature09565
WWW NATURE.COM/NATURE | 7

2. Flow Cytometry Data
Supplementary Figure 6: Flow cytometry data for all possible two-input Boolean logic gates. The distributions
correspond to the average
fluorescence reported in Fig.
4b.
SUPPLEMENTARY INFORMATIONRESEARCHdoi:10.1038/nature09565
WWW NATURE.COM/NATURE | 8

Supplementary Figure 7: The fold induction is shown for each circuit. Fold induction is defined as
the ratio of the lowest ON state to the highest OFF state. The number of layers and the last gate is shown
for each circuit.
3. Comparison of Liquid and Plate-based Cytometry Distributions
Some of the cytometry distributions in Supplementary Figure 6 show broad and/or bimodal distributions.
We tested whether this variability is due to population heterogeneity within a colony grown on an agar
plate. In Supplementary Figure 8, the population distributions of the NOT A gate are compared for liquid
culture and plate assays. The distribution produced from a liquid culture shows a single peak, as is
expected based on previous work7,8
. It is interesting that the variability that occurs within a colony does
not propagate to downstream layers for the more complex logic gates. The response of the population is
averaged by the production of a quorum signal, which increases the robustness of the computation
(Supplementary Figure 9).
Supplementary Figure 8: Distributions generated by a NOT A gate are compared for liquid and plate cultures. a, b, Cells containing plasmid
pNOR1030 and pCI-YFP were
grown on an agar plate (a) or
liquid media (b). Red and green
lines represent populations
grown for 12 hours in media
with no inducer or 10 mM
arabinose, respectively.
SUPPLEMENTARY INFORMATIONRESEARCHdoi:10.1038/nature09565
WWW NATURE.COM/NATURE | 9

Supplementary Figure 9: The effect of population averaging is shown. The cytometry
distributions of the final AND
gate and its component circuits
are shown. Although the
intermediate colonies have broad
distributions, the AND gate
shows a unimodal distribution.
The data for each circuit was
generated independently, where
YFP is the output of the last
circuit (Supplementary Figure
6).
4. Robustness in Plate Assay Conditions
The robustness of the plate assay is determined with respect to the distance between sender/receiver
colonies and the time and density at which they are spotted. First, to measure the distance dependence, a
sender colony (1 µL of overnight culture of cells harbouring pNOR-1020 and pCI-LasI plasmids) was
spotted in the middle of an agar plate. After 12 hours, the receiver colony (1 µL of washed overnight
culture of cells harbouring plasmid pOR30 and pSB3K3-empty) was spotted 7 mm away (centre-to-
centre) from the sender colony. The receiver colony acts as a Buffer gate with 3OC12-HSL as the input
and the sender colony constitutively expresses 3OC12-HSL. After 12 hours of growth, the whole receiver
cell colony is scrapped from the plate using an inoculating loop, diluted into PBS + 2 mg/mL Kan
solution, and analysed using flow cytometry. As the distance between colonies increases, the fluorescence
output of the receiver colony declines (Supplementary Figure 10a). At 28 mm apart, the output is reduced
to basal level.
Second, the robustness was determined to the initial spotting density of the sender colony (Supplementary
Figure 10b). The density was varied over two orders of magnitude. Here, 1 density is defined as spotting
1 µL of washed overnight culture of the sender colony onto an agar plate. Changing the density over this
range did not affect the fluorescence output of the receiver cell significantly.
Finally, the time interval between spotting the sender and receiver colonies was varied (Supplementary
Figure 10c). The spotting interval of all plate assays described previously in the main text had all been set
at 12 hours. In this sender-receiver assay, reducing the time interval down to 0 hour only slightly reduced
the output of the receiver cell.
A Finite Element Method model describing sender colony growth, AHL production, AHL diffusion, and
YFP production in the receiver colony was developed. The growth of a colony is modelled as
SUPPLEMENTARY INFORMATIONRESEARCHdoi:10.1038/nature09565
WWW NATURE.COM/NATURE | 10

max
(1 )S SN S
dN Nk N
dt N , (10)
max
(1 )R RN R
dN Nk N
dt N , (11)
where NS (NR) is the number of cells in the sender (receiver) colony, Nmax is the maximum number of cells
in a colony, and kN is the growth rate of the cells. The diffusion and degradation of AHL is modelled as a
reaction-diffusion equation
1A AA A A
dC CD r C
dt r r r
, (12)
where CA is the concentration of AHL, DA is the diffusion constant for AHL on a plate, and A is the AHL
degradation rate. It is assumed that there is no diffusion in the z axis. The distance r = 0 is defined as the
centre of the sender colony and r = rR is the centre of the receiver colony. The production of YFP by the
receiver colony is
( )Y R Las A Y
dYN P C Y
dt , (13)
where Y is the production rate of YFP, PLas(CA) is the activity of the promoter as a function of AHL
(Equation 5), Y is the degradation rate of YFP, and Y is the total number of YFP in the colony (in au).
The fluorescence per cell is given by Y/NR. The boundary conditions are
0 2
A S
rc c
NJ
r d
and 0
5
rJ , (14)
which represent the production of AHL at the sender colony and the edge of the plate (5 cm),
respectively. The sender cell is treated as a point source with a rate constant A. This is converted to a flux
by dividing by the surface area of a colony, where rc is the radius and dc is the depth. All of the model
parameters are described in Supplementary Table 3.
One hundred discrete elements corresponding to the radially symmetric AHL concentrations (r = 0-5 cm)
were used. Derivatives with respect to the radius are computed as differences between these discrete
elements. These set of equations are numerically solved from time t=0 to t=24 hours using ode15s
function in MATLAB with the following initial conditions: NS(0,0) = 106 cells, NR(rR,0) = 0 cells and A =
Y = 0. At t=12 hours (or at various interval for Supplementary Figure 10c), NR(rR,12) is set to 106 cells,
representing the spotting of the receiver colony. Output of the receiver colony is calculated as Y/NR at 12
hours after the receiver colony’s spotting. This model closely predicts the behaviour observed in the
sender-receiver assay under the tested conditions (Supplementary Figure 10).
SUPPLEMENTARY INFORMATIONRESEARCHdoi:10.1038/nature09565
WWW NATURE.COM/NATURE | 11

Supplementary Figure 10: Distance, time interval, and density dependence of the plate assay. The
solid lines were generated using the PDE model (Equations 10-13). Fluorescence values and their error
bars are calculated as averages and one standard deviation from three experiments.
The effect of different timing delays was also determined for a multi-layered circuit (the XOR gate)
(Supplementary Figure 11). Longer delays ensure that sufficient signalling molecules have been produced
such that proper signal propagation can occur for each layer. Reducing the interval from 12 to 6 hours
produces an equivalent XOR behaviour. However, when all four XOR colonies were spotted at the same
time (0 hours), the quality of the logic function is reduced significantly.
Supplementary Figure 11: The dependence of the XOR gate on the time delay between spotting colonies. The time interval of colony spotting between layers was:
0 hrs (blue), 6 hrs (red), and 12 hours (green). The
fluorescence of the last colony (Cell 4) was measured 12
hours after the spotting of the last layer by flow
cytometry. Fluorescence values and their error bars are
calculated as averages and one standard deviation from
three experiments.
Supplementary Table 3: Parameters for the PDE Model Parameters Description Value Unit Ref Nmax
Maximum number of cells in a colony 3.3 109 cells
9
kN Cell growth rate 1.38 hr
-1 10
DA
3OC12-HSL diffusion constant 6 10-3 cm
2 hr
-1
11 a
αA 3OC12-HSL production rate 1.6 10-8 nmoles hr
-1 cell
-1
12 b
αY YFP production rate 100
au hr-1
cell-1
γA 3OC12-HSL degradation rate 0.012 hr-1
13
γY YFP degradation rate 0.0289 hr-1
14
rc Radius of colony 0.2 cm
dc Depth of colony 0.1 cm a This value is higher than previously described.
b Value estimated based the RhlI kcat = 960 AHL molecules per hour and using an estimated value of 10
4
proteins per cell. This produces a rate of 2666 AHL molecules per second per cell, which is consistent
with published values15
.
SUPPLEMENTARY INFORMATIONRESEARCHdoi:10.1038/nature09565
WWW NATURE.COM/NATURE | 12

5. Liquid Culture Assay Experiments were performed to determine how the multi-strain circuits perform when mixed together in
liquid culture. The four strains that make up the XOR circuit (Fig. 3) were chosen as the test case. For all
of the liquid culture experiments, the strains had to be maintained in the OFF state before they were
mixed together at t=0. If the strains were not maintained in the OFF state, they transiently produce AHL
(or YFP) before the complete circuit can reach steady-state. These transient errors result in permanent
failures in the complete circuit. In the case of the XOR circuit, the proper logic is not recovered (not
shown). This is related to faults that can occur in asynchronous computing. In all of the following
experiments, the strains were maintained in the OFF state prior to their participation in the circuit.
Supplementary Figure 12: The XOR circuit as measured in liquid culture. XOR logic computation was
performed in liquid culture
with (A-C) and without (D-F)
an external clock. a, d, Representative cytometry
histograms of the output
strain (Cell 4) at the end of
the assay. The four input
states are when media is
supplemented with no inducer
(red), 10 mM Ara (blue), 50
ng/mL aTc (orange), or both
inducers (green). In the co-
culture when all cells are
grown simultaneously (a), the
white cells have to be
subtracted from the
distribution to visualize the
data for the YFP-producing
strain in the last layer. This
subtraction threshold is shown
by the dashed line. b, e, The
average florescence for each
combination of inducers is
shown. Fluorescence values
and their error bars are
calculated as averages and
one standard deviation from
three experiments. c, f, A
complete timecourse is shown
for a representative combination of inducers for an OFF (top) and ON (bottom) output. The fluorescence
output of Cell 1 (blue), Cell 2 (red), Cell 3 (green), and Cell 4 (purple) are shown for no inducer and 10
mM arabinose. The grey bars in (f) represent artificial “clock” events in which the supernatant of a culture
was collected and then used to grow cells of the next logic layer.
SUPPLEMENTARY INFORMATIONRESEARCHdoi:10.1038/nature09565
WWW NATURE.COM/NATURE | 13
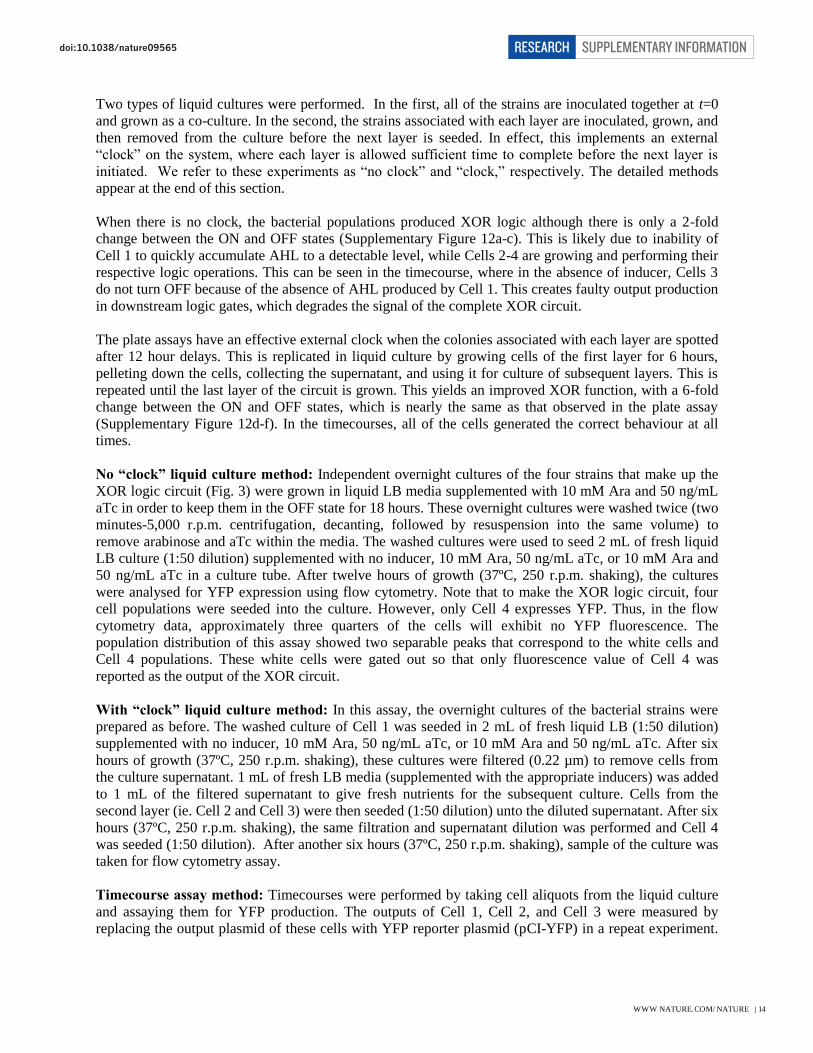
Two types of liquid cultures were performed. In the first, all of the strains are inoculated together at t=0
and grown as a co-culture. In the second, the strains associated with each layer are inoculated, grown, and
then removed from the culture before the next layer is seeded. In effect, this implements an external
“clock” on the system, where each layer is allowed sufficient time to complete before the next layer is
initiated. We refer to these experiments as “no clock” and “clock,” respectively. The detailed methods
appear at the end of this section.
When there is no clock, the bacterial populations produced XOR logic although there is only a 2-fold
change between the ON and OFF states (Supplementary Figure 12a-c). This is likely due to inability of
Cell 1 to quickly accumulate AHL to a detectable level, while Cells 2-4 are growing and performing their
respective logic operations. This can be seen in the timecourse, where in the absence of inducer, Cells 3
do not turn OFF because of the absence of AHL produced by Cell 1. This creates faulty output production
in downstream logic gates, which degrades the signal of the complete XOR circuit.
The plate assays have an effective external clock when the colonies associated with each layer are spotted
after 12 hour delays. This is replicated in liquid culture by growing cells of the first layer for 6 hours,
pelleting down the cells, collecting the supernatant, and using it for culture of subsequent layers. This is
repeated until the last layer of the circuit is grown. This yields an improved XOR function, with a 6-fold
change between the ON and OFF states, which is nearly the same as that observed in the plate assay
(Supplementary Figure 12d-f). In the timecourses, all of the cells generated the correct behaviour at all
times.
No “clock” liquid culture method: Independent overnight cultures of the four strains that make up the
XOR logic circuit (Fig. 3) were grown in liquid LB media supplemented with 10 mM Ara and 50 ng/mL
aTc in order to keep them in the OFF state for 18 hours. These overnight cultures were washed twice (two
minutes-5,000 r.p.m. centrifugation, decanting, followed by resuspension into the same volume) to
remove arabinose and aTc within the media. The washed cultures were used to seed 2 mL of fresh liquid
LB culture (1:50 dilution) supplemented with no inducer, 10 mM Ara, 50 ng/mL aTc, or 10 mM Ara and
50 ng/mL aTc in a culture tube. After twelve hours of growth (37ºC, 250 r.p.m. shaking), the cultures
were analysed for YFP expression using flow cytometry. Note that to make the XOR logic circuit, four
cell populations were seeded into the culture. However, only Cell 4 expresses YFP. Thus, in the flow
cytometry data, approximately three quarters of the cells will exhibit no YFP fluorescence. The
population distribution of this assay showed two separable peaks that correspond to the white cells and
Cell 4 populations. These white cells were gated out so that only fluorescence value of Cell 4 was
reported as the output of the XOR circuit.
With “clock” liquid culture method: In this assay, the overnight cultures of the bacterial strains were
prepared as before. The washed culture of Cell 1 was seeded in 2 mL of fresh liquid LB (1:50 dilution)
supplemented with no inducer, 10 mM Ara, 50 ng/mL aTc, or 10 mM Ara and 50 ng/mL aTc. After six
hours of growth (37ºC, 250 r.p.m. shaking), these cultures were filtered (0.22 µm) to remove cells from
the culture supernatant. 1 mL of fresh LB media (supplemented with the appropriate inducers) was added
to 1 mL of the filtered supernatant to give fresh nutrients for the subsequent culture. Cells from the
second layer (ie. Cell 2 and Cell 3) were then seeded (1:50 dilution) unto the diluted supernatant. After six
hours (37ºC, 250 r.p.m. shaking), the same filtration and supernatant dilution was performed and Cell 4
was seeded (1:50 dilution). After another six hours (37ºC, 250 r.p.m. shaking), sample of the culture was
taken for flow cytometry assay.
Timecourse assay method: Timecourses were performed by taking cell aliquots from the liquid culture
and assaying them for YFP production. The outputs of Cell 1, Cell 2, and Cell 3 were measured by
replacing the output plasmid of these cells with YFP reporter plasmid (pCI-YFP) in a repeat experiment.
SUPPLEMENTARY INFORMATIONRESEARCHdoi:10.1038/nature09565
WWW NATURE.COM/NATURE | 14

The “no clock” culture contains mixed populations of the four cell populations. Cytometry distributions
of this mixed cultures for all timepoints showed either a single peak undistinguishable to that of the white
cells population or two separable peaks that correspond to the white cell and fluorescent cell populations.
In the first case, we set the fluorescence value for those populations to be at “white” cells background
level. For the second case, the white cells were gated out.
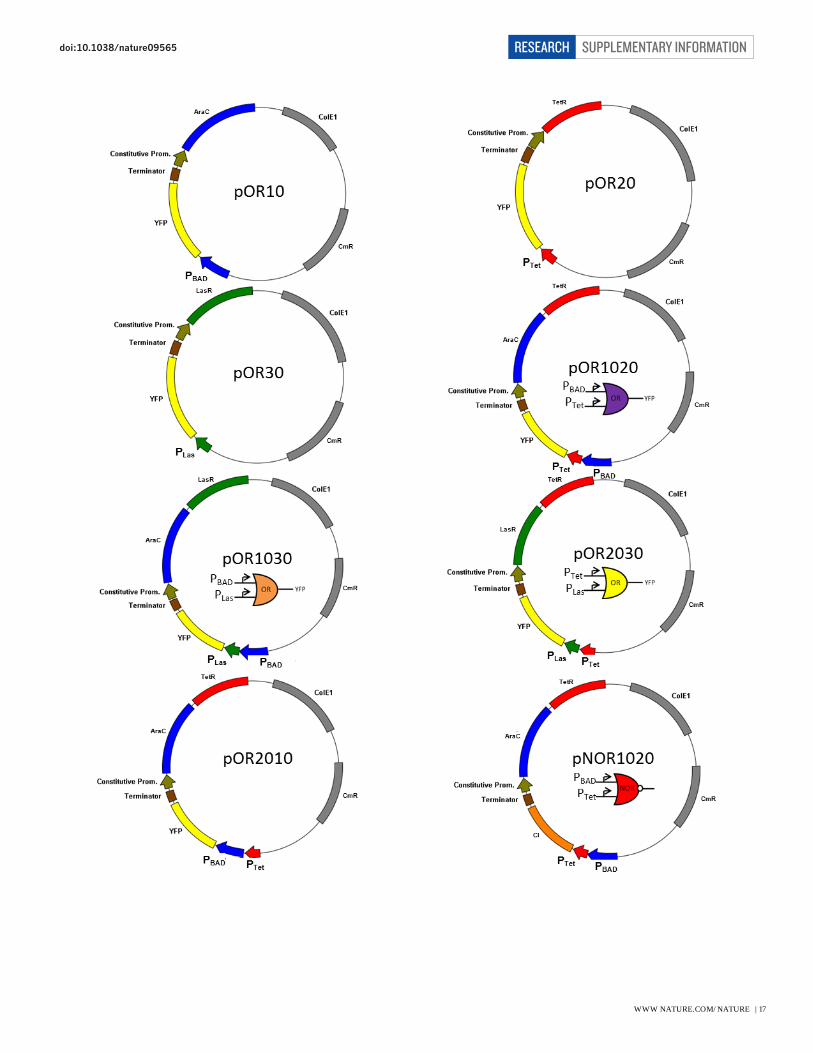
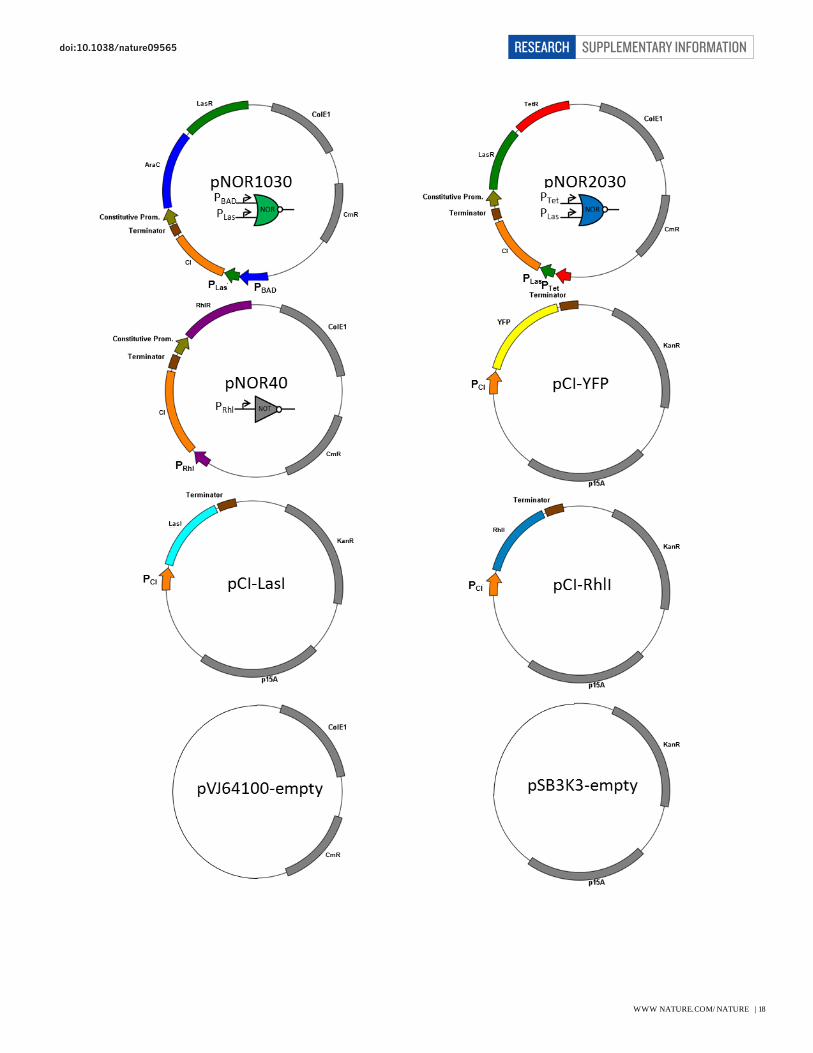
6. Strains, Plasmid Maps, and Plasmid Constructions
Plasmid pOR10, pOR20, pOR30, pOR1020, pOR1030, pOR2030, pOR2010, pNOR1020, pNOR1030,
pNOR2030, and pNOR40 use BBa_J64100 (www.partsregistry.org) as their backbone. Plasmid pCI-YFP,
pCI-LasI, and pCI-RhlI use pSB3K316
as their backbone. ReceiverA-YFP plasmid is a derivative of
plasmid pFNK-202-qsc119 obtained from previous study17
with the original GFP reporter replaced with
YFP. All of the promoters and genes associated with quorum sensing components were obtained from
Pseudomonas aeruginosa genomic DNA (ATCC #47085D-5)18
.
For Fig. 1c, cells harbouring plasmid pOR10 or pOR20 were used to characterize the transfer function of
single promoter PBAD and PTet respectively. Cells with plasmid pOR1020 were used for the PBAD-PTet OR
gate characterization. Cells with plasmid pNOR1020 and pCI-YFP were used for the PBAD-PTet NOR gate
characterization. For Fig. 2, cells with plasmid pOR1020, pOR1030, or pOR2030 were used to
characterize the transfer function of PBAD-PTet, PBAD-PLas, or PTet-PLas OR Gate respectively. Cells with
plasmid pCI-YFP and one of the following plasmid: pNOR1020, pNOR1030, or pNOR2030, were used
for the PBAD-PTet, PBAD-PLas, or PTet-PLas NOR gate characterization respectively. For Fig. 3 and Fig. 4, refer
to Supplementary Table 5 for plasmid composition of each colour coded bacterial strain.
Supplementary Table 4: List of parts used in this study
Part Name Description and Source PBAD araBAD promoter (-284 to +20 nt from transcription start site)
19
PTet PLtetO-1 promoter (-54 to +0 nt from transcription start site)20
with two
base pairs changes: G43T and C47A
PLas RsaL promoter (-76 to -18 nt from RsaL start codon)18
PRhl RhlA promoter (-63 to +10 nt from transcription start site)18
PCI PR promoter from lambda bacteriophage (-49 to +0 nt from transcription
start site)21
YFP Enhanced Yellow Fluorescent Protein22
CI Lambda CI repressor (BBa_C0051)21
Constitutive Promoter Synthetic 70 constitutive promoter (BBa_J23117, DNA sequence:
ttgacagctagctcagtcctagggattgtgctagc)
Terminator Double terminator (T1 from E. coli rrnB and TE from coliphage T7, DNA
sequence: ccaggcatcaaataaaacgaaaggctcagtcgaaagactgggcctttcgttttatctgttgttt
gtcggtgaacgctctctactagagtcacactggctcaccttcgggtgggcctttctgcgttta)
LasI LasI coding sequence18
RhlI RhlI coding sequence18
AraC AraC coding sequence19
TetR TetR coding sequence20
LasR LasR coding sequence18
RhlR RhlR coding sequence18
SUPPLEMENTARY INFORMATIONRESEARCHdoi:10.1038/nature09565
WWW NATURE.COM/NATURE | 15

Supplementary Table 5: List of strains used in this studya
Colour Codeb Logic Gate Input Promoters Output Gene Plasmids Grey NOT PRhl YFP pNOR40, pCI-YFP
Brown Buffer PRhl YFP ReceiverA-YFPd, pVJ64100-empty
Purple OR PBAD-PTet YFP pOR1020
Orange OR PBAD-PLas YFP pOR1030
Yellow OR PTet-PLas YFP pOR2030
Redc NOR PBAD-PTet YFP pNOR1020, pCI-YFP
Redc NOR PBAD-PTet LasI pNOR1020, pCI-LasI
Greenc NOR PBAD-PLas YFP pNOR1030, pCI-YFP
Greenc NOR PBAD-PLas RhlI pNOR1030, pCI-RhlI
Bluec NOR PTet-PLas YFP pNOR2030, pCI-YFP
Bluec NOR PTet-PLas RhlI pNOR2030, pCI-RhlI
a All strains are based on E. coli DH10B.
b Colour coding corresponds to the colours shown in Fig. 3 and Fig. 4 in the main text.
c Two versions of these gates are produced. When the gate is the last in a circuit, then its output is YFP. If it
connects to another layer, the output is an enzyme that produces a quorum signal. d ReceiverA-YFP plasmid is a derivative of plasmid pFNK-202-qsc119 obtained from previous study
17 with the
original GFP reporter exchanged with YFP.
SUPPLEMENTARY INFORMATIONRESEARCHdoi:10.1038/nature09565
WWW NATURE.COM/NATURE | 16
SUPPLEMENTARY INFORMATIONRESEARCHdoi:10.1038/nature09565
WWW NATURE.COM/NATURE | 17
SUPPLEMENTARY INFORMATIONRESEARCHdoi:10.1038/nature09565
WWW NATURE.COM/NATURE | 18
7. Supplemental References
1. Ackers, G. K., Johnson, A. D. & Shea, M. A. Quantitative model for gene regulation by lambda phage repressor.
Proc Natl Acad Sci U S A 79, 1129-1133, (1982).
2. Bintu, L. et al. Transcriptional regulation by the numbers: applications. Curr Opin Genet Dev 15, 125-135,
(2005).
3. Bintu, L. et al. Transcriptional regulation by the numbers: models. Curr Opin Genet Dev 15, 116-124, (2005).
4. Passador, L. et al. Functional analysis of the Pseudomonas aeruginosa autoinducer PAI. J Bacteriol 178, 5995-
6000, (1996).
5. Anderson, J. C., Voigt, C. A. & Arkin, A. P. Environmental signal integration by a modular AND gate. Mol Syst
Biol 3, 133, (2007).
6. Grigorova, I. L., Phleger, N. J., Mutalik, V. K. & Gross, C. A. Insights into transcriptional regulation and sigma
competition from an equilibrium model of RNA polymerase binding to DNA. Proc Natl Acad Sci U S A
103, 5332-5337, (2006).
7. Tabor, J. J. et al. A synthetic genetic edge detection program. Cell 137, 1272-1281, (2009).
8. Yokobayashi, Y., Weiss, R. & Arnold, F. H. Directed evolution of a genetic circuit. Proc Natl Acad Sci U S A 99,
16587-16591, (2002).
9. Mashimo, K., Nagata, Y., Kawata, M., Iwasaki, H. & Yamamoto, K. Role of the RuvAB protein in avoiding
spontaneous formation of deletion mutations in the Escherichia coli K-12 endogenous tonB gene. Biochem
Biophys Res Commun 323, 197-203, (2004).
10. Bernstein, J. A., Khodursky, A. B., Lin, P. H., Lin-Chao, S. & Cohen, S. N. Global analysis of mRNA decay and
abundance in Escherichia coli at single-gene resolution using two-color fluorescent DNA microarrays. Proc
Natl Acad Sci U S A 99, 9697-9702, (2002).
11. Basu, S., Gerchman, Y., Collins, C. H., Arnold, F. H. & Weiss, R. A synthetic multicellular system for
programmed pattern formation. Nature 434, 1130-1134, (2005).
12. Parsek, M. R., Val, D. L., Hanzelka, B. L., Cronan, J. E., Jr. & Greenberg, E. P. Acyl homoserine-lactone
quorum-sensing signal generation. Proc Natl Acad Sci U S A 96, 4360-4365, (1999).
13. Flagan, S., Ching, W. K. & Leadbetter, J. R. Arthrobacter strain VAI-A utilizes acyl-homoserine lactone
inactivation products and stimulates quorum signal biodegradation by Variovorax paradoxus. Appl Environ
Microbiol 69, 909-916, (2003).
14. Andersen, J. B. et al. New unstable variants of green fluorescent protein for studies of transient gene expression
in bacteria. Appl Environ Microbiol 64, 2240-2246, (1998).
15. Alberghini, S. et al. Consequences of relative cellular positioning on quorum sensing and bacterial cell-to-cell
communication. FEMS Microbiol Lett 292, 149-161, (2009).
16. Shetty, R. P., Endy, D. & Knight, T. F., Jr. Engineering BioBrick vectors from BioBrick parts. J Biol Eng 2, 5,
(2008).
17. Brenner, K., Karig, D. K., Weiss, R. & Arnold, F. H. Engineered bidirectional communication mediates a
consensus in a microbial biofilm consortium. Proc Natl Acad Sci U S A 104, 17300-17304, (2007).
18. Pesci, E. C., Pearson, J. P., Seed, P. C. & Iglewski, B. H. Regulation of las and rhl quorum sensing in
Pseudomonas aeruginosa. J Bacteriol 179, 3127-3132, (1997).
19. Lee, N. L., Gielow, W. O. & Wallace, R. G. Mechanism of araC autoregulation and the domains of two
overlapping promoters, Pc and PBAD, in the L-arabinose regulatory region of Escherichia coli. Proc Natl
Acad Sci U S A 78, 752-756, (1981).
20. Lutz, R. & Bujard, H. Independent and tight regulation of transcriptional units in Escherichia coli via the
LacR/O, the TetR/O and AraC/I1-I2 regulatory elements. Nucleic Acids Res 25, 1203-1210, (1997).
21. Stayrook, S., Jaru-Ampornpan, P., Ni, J., Hochschild, A. & Lewis, M. Crystal structure of the lambda repressor
and a model for pairwise cooperative operator binding. Nature 452, 1022-1025, (2008).
22. Cormack, B. P., Valdivia, R. H. & Falkow, S. FACS-optimized mutants of the green fluorescent protein (GFP).
Gene 173, 33-38, (1996).
SUPPLEMENTARY INFORMATIONRESEARCHdoi:10.1038/nature09565
WWW NATURE.COM/NATURE | 19