supplementary information in triarylamine-based porous ... · exploiting stable radical states for...
TRANSCRIPT
S1
Supplementary Information
Exploiting Stable Radical States for Unprecedented Multifunctional Properties
in Triarylamine-based Porous Organic Polymers
Carol Hua,a Aditya Rawal,b Thomas B. Faust,a Peter D. Southon,a Ravichandar Babarao,c
James M. Hook,b and Deanna M. D’Alessandro*,a
Contents
General Experimental S3
Synthesis of Tris(p-ethynylphenyl)amine S3
Synthesis of 4-ethynyltriphenylamine S4
Synthesis of 4,4’-(ethyne-1,2-diyl)bis(N,N-diphenylaniline) (M1) S5
Synthesis of 4,4’-(1,4-phenylenebis(ethyne-2,1-diyl))bis(N,N-diphenylaniline) (M2) S5
Synthesis of POPs S6
Physical Properties and Instrumentation S7
Figure S1. Thermal Gravimetric Analysis (TGA) of POPs S9
Figure S2. Infrared spectra of the monomer and POPs over the range 4000-600 cm-1 S9
Figure S3. 13C CP non-quaternary suppression (NQS) Spectra of the POPs at 8 kHz S11
Figure S4. 13C CPMAS of 1,4-dibromobenzene S11
Figure S5. Solution state cyclic voltammograms of model compound 1 (M1) in
[(n-C4H9)4N]PF6/CH3CN
S12
Figure S6. Solution state cyclic voltammograms of model compound 2 (M2) in
[(n-C4H9)4N]PF6/CH3CN
S12
Figure S7. Solid state cyclic voltammograms of POP-1 in [(n-C4H9)4N]PF6/CH3CN S12
Figure S8. Solid state cyclic voltammograms of POP-2 in [(n-C4H9)4N]PF6/CH3CN S13
Figure S9. Solid state cyclic voltammograms of POP-3 in [(n-C4H9)4N]PF6/CH3CN S13
Table S1. Spectral data of the deconvoluted absorption spectra for model
compounds M1 and M2 in 0.1 M [(n-C4H9)4N]PF6/DCM
S14
Figure S10. Solution state spectroelectrochemical data for model compounds M1 and
M2.
S15
Figure S11. Solid state spectroelectrochemical progressions for reduction of POP-1
over the range 5000 – 25000 cm-1
S16
Figure S12. Solid state spectroelectrochemical progressions for the oxidation and S17
Electronic Supplementary Material (ESI) for Journal of Materials Chemistry A.This journal is © The Royal Society of Chemistry 2014

S2
reduction of POP-2 over the range 5000 – 25000 cm-1
Figure S13. Solid state spectroelectrochemistry on POP-3 over the range 5000 –
25000 cm-1
S18
Figure S14. UV/Vis/NIR spectra over the range 5000-45000 cm-1 for POP-1 and
POP-1a
S19
Figure S15. UV/Vis/NIR spectra over the range 5000-45000 cm-1 for POP-2 and
POP-2a
S20
Figure S16. UV/Vis/NIR spectra over the range 5000-45000 cm-1 for POP-3 and
POP-3a
S21
Figure S17. Stacked plot of 1H NMR spectra (500 MHz) of an in situ reaction
monitoring of model compound 1 (M1) with an excess of NOBF4 over 2 hours.
S22
Figure S18. 13C{1H} NMR of model compound 1 (M1) after reaction with an excess
of NOBF4 over 2 hours
S22
Figure S19. Solid State 1H NMR saturation measurements of POP-2a S23
Table S2. Solid State 1H NMR T1 and T2 measurements of POP-2a S23
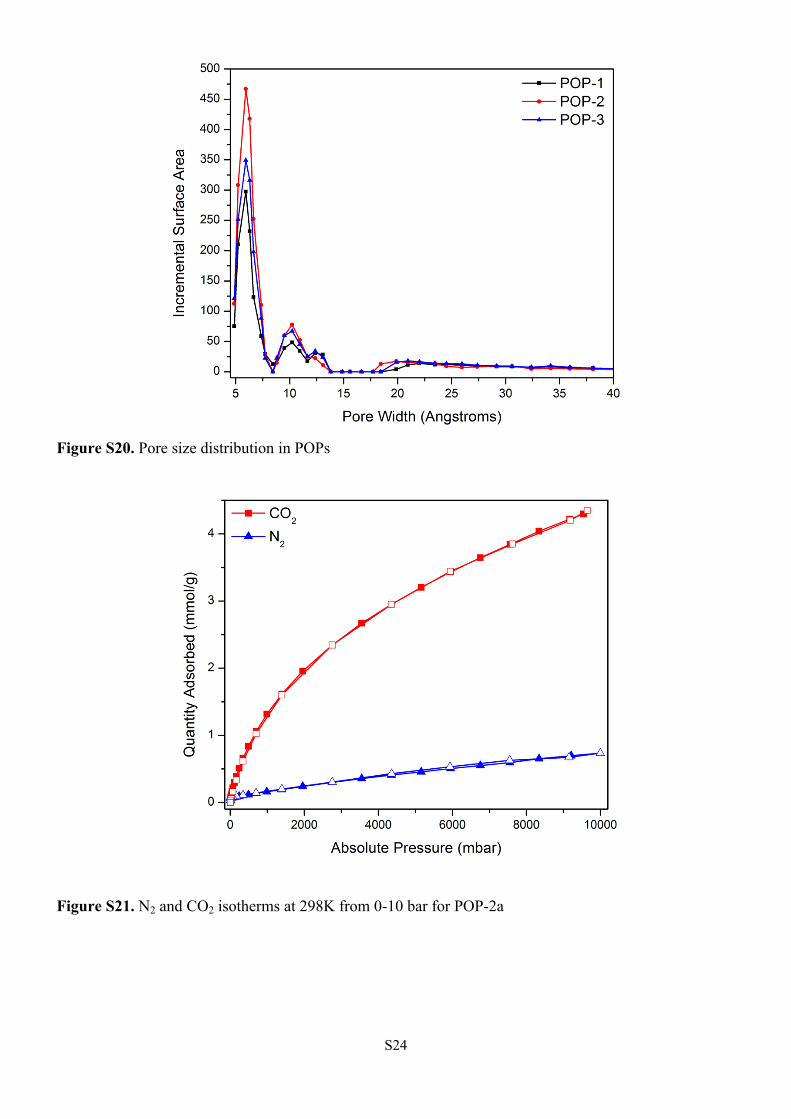
Figure S20. Pore size distribution in POPs S24
Figure S21. N2 and CO2 isotherms at 298K from 0-10 bar for POP-2a S24
Figure S22. CO2 isotherms at 298, 308 and 318 K for POP-2 S25
Figure S23. CO2 isotherms at 298, 308 and 318 K for POP-2a S25
Table S3. CO2 Adsorption Isosteres for POP-2 S26
Table S4. CO2 Adsorption Isosteres for POP-2a S26
Table S5. Derived EPR experimental data for the POPs at 298 K S27
Figure S24. X-band solid state EPR spectra at 298 K S28
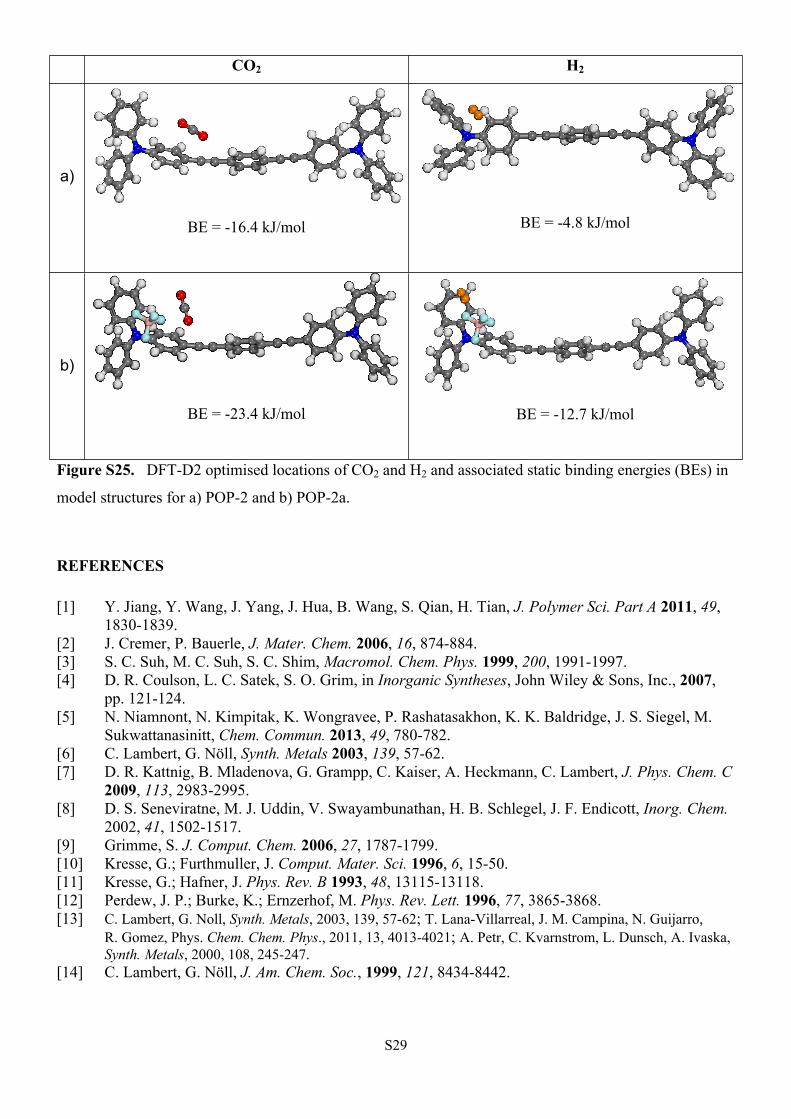
Figure S25. DFT-D2 optimized locations of CO2 and H2 and associated static
binding energies (BEs) in model structures for POP-2 and POP-2a
S29

S3
EXPERIMENTAL
General Experimental
All chemicals and solvents were used as obtained and used without further purification. Tris(p-
iodophenyl)amine[1], tris(p-bromophenyl)amine[2], p-bromotriphenylamine[3], 4-ethynyltriphenylamine[3],
and Pd(PPh3)4[4]
were synthesised according to literature procedures. Tris(p-ethynylphenyl)amine was
synthesised according to a literature procedure with modification.[5] Acetonitrile and triethylamine were
dried over CaH2 and dimethylformamide dried over activated CaSO4.
Solution state 1H and 13C{1H} NMR spectra were recorded on either a Bruker AVANCE300 or
AVANCE500 spectrometer operating at 300, 500 MHz for 1H and 75, 125 MHz for 13C respectively. 1H
and 13C NMR chemical shifts were referenced internally to residual solvent resonances. Spectra were
recorded at 298 K and chemical shifts (δ), with uncertainties of ± 0.01 Hz for 1H and ± 0.05 Hz for 13C
are quoted in ppm. Coupling constants (J) are quoted in Hz and have uncertainties of ± 0.05 Hz for 1H-1H. Deuterated solvents were obtained from Cambridge Stable Isotopes and used as received.
Synthesis
Synthesis of Tris(p-ethynylphenyl)amine
Tris(p-iodophenyl)amine (6.00 g, 9.65 mmol), Pd(PPh3)2Cl2 (406 mg, 6 mol%, 0.579 mmol) and
triphenylphosphine (75.9 mg, 3 mol%, 0.289 mmol) were added to dry and degassed triethylamine (100
mL). Ethynyltrimethylsilane (6.18 mL, 43.4 mmol) was added dropwise and the reaction mixture stirred
for five minutes prior to the addition of copper iodide (55.0 mg, 0.289 mmol). The reaction mixture was
stirred under nitrogen at room temperature for 24 hours, where a colour change from yellow to
green/brown was observed. The solvent removed under vacuum and the residue dissolved in diethyl ether
and filtered through celite. The solvent was removed under vacuum from the filtrate to yield a light brown
solid. The crude product was used in the next step without further purification.
If desired, the crude intermediate can purified by column chromatography (hexane gradient to 1:9 diethyl
ether:hexane) to yield a light yellow solid.
1H NMR (CDCl3, 300 MHz): 7.34 (d, 3JH2-H3 = 8.5 Hz, 6H, H2), 6.96 (d, 3JH2-H3 = 8.5 Hz, 6H, H3), 0.24
(s, 9H, CH3 of TMS) ppm.

S4
The crude tris(4-((trimethylsilyl)ethynyl)phenyl)amine (5.15 g) was suspended in methanol (90 mL) and
potassium carbonate (4.27 g, 30.9 mmol) added. The reaction mixture was stirred at room temperature
under nitrogen for 26 hours upon which the light brown suspension was observed to darken. The solvent
was removed under vacuum to yield a brown sludge that was dissolved in ether and filtered. The filtrate
was washed with water, dried over Na2SO4 and the solvent removed under vacuum. The crude product
was purified by column chromatography (gradient hexane to 1:19 EtOAc:hexane to 1:9 EtOAc:hexane) to
yield the product as a bright yellow solid (2.10 g, 67%).
1H NMR (CDCl3, 500 MHz): 7.36 (d, 3JH2-H3 = 8.5 Hz, 6H, H2), 6.99 (d, 3JH2-H3 = 8.5 Hz, 6H, H3), 3.04
(s, 3H, CH of alkyne) ppm.
13C{1H} NMR (CDCl3, 125 MHz): 147.2 (Cq, C1), 133.5(CH, C2), 124.1 (CH, C3), 117.0 (Cq, C4), 83.5
(Cq, C5), 77.2 (Cq, C6) ppm.
Synthesis of 4-ethynyltriphenylamine
4-Bromotriphenylamine (6.00 g, 18.5 mmol), ethynyltrimethylsilane (3.07 mL, 22.2 mmol) and Pd(PPh3)4
(642 mg, 0.555 mmol, 3.0 mol%) were dissolved in triethylamine (200 mL) and stirred at room
temperature under nitrogen for 5 minutes prior to the addition of copper iodide (196 mg, 0.555 mmol, 3.0
mol%). The reaction was heated at 45 °C under nitrogen for 24 hours before the solvent was removed
under vacuum. The residue was dissolved in ether and filtered through celite. The solvent was removed
from the filtrate to yield the crude p-trimethylsilyltriphenylamine intermediate as a brown oil. The crude
intermediate was used in the next step without further purification.
The crude was suspended in methanol (200 mL) and potassium carbonate (12.8 g, 92.5 mmol) added. The
reaction was stirred under nitrogen at room temperature for 22 hours where a slight darkening of the
reaction mixture was observed. The solvent was removed and the residue dissolved in ether and filtered.
The filtrate was then washed with water and dried over Na2SO4. The mixture was filtered and the solvent
removed under vacuum to yield the crude product as a dark yellow-brown sludge. This was purified by
column chromatography on silica gel (hexane 1:100 ether:hexane 1:50 ether:hexane) to yield the
product as a pale yellow crystalline solid (1.01 g, 20%).
1H NMR (CDCl3, 300 MHz): 7.37-7.27 (m, 6H), 7.13-7.08 (m, 6H), 6.99 (d, 3JH-H = 8.4 Hz, 2H), 3.04 (s,
1H) ppm.

S5
The characterisation data is in good agreement with previously reported data in the literature.[3]
Synthesis of 4,4’-(ethyne-1,2-diyl)bis(N,N-diphenylaniline) (M1)
4-Ethynyltriphenylamine (250 mg, 0.928 mmol), 1,4-dibromobenzene (87.6 mg, 0.371 mmol) and
Pd(PPh3)4 (4.30 mg, 3.71 x 10⁻⁶ mol, 1.0 mol%) were dissolved in dry and distilled triethylamine (2.5
mL) and DMF (2.5 mL). The reaction mixture was stirred for 5 minutes at room temperature under
nitrogen prior to the addition of copper iodide (1.40 mg, 7.43 x 10⁻⁶ mol, 2.0 mol%) upon which a rapid
darkening from yellow to dark red was observed. The reaction mixture was heated under nitrogen at 90
°C for three days. The reaction was then cooled and water added. The product was extracted with
dichloromethane. The combined organic layers were washed thoroughly with water (4 x 20 mL) and dried
over Na2SO4. The solvent was removed under vacuum to yield a dark brown viscous oil. The crude
product was purified by column chromatography (hexane 1:100 ether:hexane 1:50 ether:hexane
ether acetone) on silica to yield the product as a yellow solid (107 mg, 22%).
1H NMR (CDCl3, 500 MHz): 7.34 (d, 3JH3-H4 = 8.5 Hz, 4H, H3), 7.26 (t, 3JH8-H7/H9 = 7.5 Hz, 8H, H8),
7.10 (d, 3JH7-H8 = 7.5 Hz, 8H, H7), 7.04 (t, 3JH8-H9 = 7.5 Hz, 4H, H9), 6.99 (d, 3JH3-H4 = 8.5 Hz, 4H, H4)
ppm.
13C{1H} NMR (CDCl3, 125 MHz): 147.8 (Cq, C2), 147.4 (Cq, C6), 132.5 (CH, C3/C4), 129.5 (CH, C8),
125.0 (CH, C7), 123.6 (Cq, C9), 122.4 (CH, C3/C4), 116.8 (Cq, C5), 89.0 (Cq, C1) ppm.
ESI-MS (ESI+, MeOH): 513.4 (Calculated [M+1]+ = 513.23, 13%) amu.
The characterisation data is in good agreement with previously reported data in the literature.[6]
Synthesis of 4,4’-(1,4-phenylenebis(ethyne-2,1-diyl))bis(N,N-diphenylaniline) (M2)
A mixture of DMF (2.5 mL) and triethylamine (5 mL) was degassed with nitrogen for 15 minutes prior to
the addition of 4-ethynyltriarylamine (250 mg, 0.928 mmol), 4-bromotriarylamine (602 mg, 1.86 mmol)
and Pd(PPh3)4 (10.7 mg, 9.28 x 10⁻⁶ mol, 1 mol%). The reaction mixture was stirred under nitrogen for 10

S6
minutes prior to the addition of copper iodide (3.50 mg, 1.86 x 10⁻⁵ mol, 2 mol%), upon which a rapid
darkening from yellow to dark red/brown was observed. The reaction was heated at 90 °C under nitrogen
for three days. The reaction was then quenched with water and the product extracted with
dichloromethane. The combined organic layers were washed thoroughly with water and dried over
Na2SO4 to yield a brown oil. This was purified by column chromatography on silica gel (hexane 1:39
ether:hexane) to yield the product as a bright yellow solid (23 mg, 4%).
1H NMR (CDCl3, 500 MHz): 7.46 (s, 2H, H1), 7.37 (d, 3JH2-H3 = 8.5 Hz, 2H, H2/H3), 7.29 (d, 3JH4-H5 =
7.5 Hz, 4H, H4/H5), 7.11 (d, 3JH4-H5 = 7.5 Hz, 4H, H4/H5), 7.06 (t, 3JH5-H6 = 7.5 Hz, 2H, H6), 7.00 (d, 3JH2-H3 = 8.5 Hz, 2H, H2/H3) ppm.
The characterisation data is in good agreement with previously reported data in the literature.[7]
Synthesis of POPs
Tris(p-ethynylphenyl)amine (0.200 g, 0.625 mmol), the linker (0.500 mmol) and Pd(PPh3)4 (7.5 mg, 6.49
x 10-6 mol) were dissolved in a mixture of dry and degassed triethylamine (3.0 mL) and
dimethylformamide (3.0 mL). The reaction mixture was stirred under nitrogen at room temperature for 5
minutes prior to the addition of copper iodide (2.5 mg, 1.31 x 10⁻⁶ mol). The reaction mixture was heated
to 75 °C upon which a yellow solid rapidly formed. The mixture was heated for a further 15 minutes
before being cooled and filtered. The bright yellow solid was washed successively with DMF,
chloroform, methanol, water, methanol and acetone to ensure complete removal of unreacted starting
material, catalyst and triethylamine solvent molecules, before being washed in a soxhlet extraction with
methanol overnight to ensure complete removal of DMF. The yellow solid was then dried to yield the
product.
POP-1: Yield = 250 mg, UV-Vis-NIR (solid state): 23340, 31609, 41975 cm-1, Elemental Analysis:
Found C, 72.61; H, 4.43 and N, 5.67.
POP-2: Yield = 275 mg, UV-Vis-NIR (solid state): 24123, 30837, 34419, 42687 cm-1, Elemental
Analysis: Found C, 83.10; H, 6.62 and N, 3.42.
POP-3: Yield = 218 mg, UV-Vis-NIR (solid state): 23602, 30766, 34549, 41975 cm-1, Elemental
Analysis: Found C, 80.88; H, 4.61 and N, 3.38.
Oxidation of POPs. The POP (20 mg) was suspended in dry and distilled acetonitrile (2 mL) and the
mixture thoroughly degassed. A solution of nitrosium tetrafluoroborate (10 mg, 0.0860 mmol) in
acetonitrile (2 mL) was added slowly dropwise with vigorous bubbling of nitrogen to yield an immediate
S7
colour change from yellow to dark brown. The mixture was left to stir at room temperature with vigorous
bubbling of nitrogen for 30 minutes, the solid filtered off and dried.
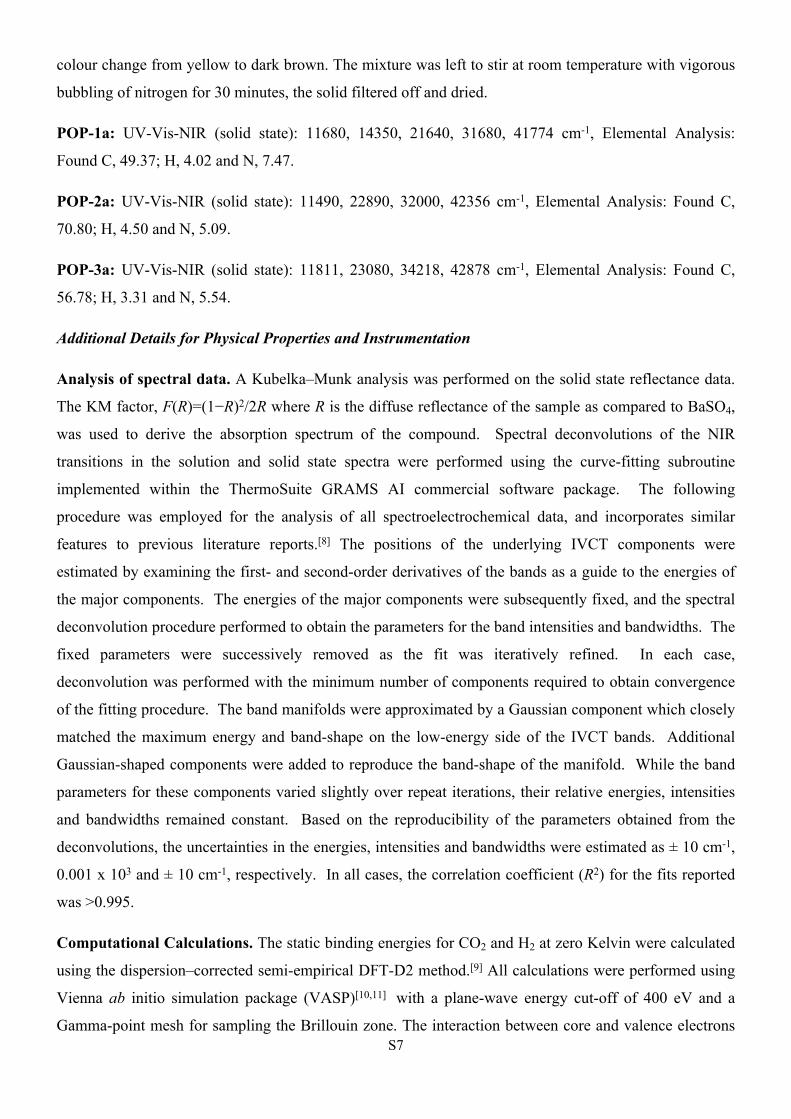
POP-1a: UV-Vis-NIR (solid state): 11680, 14350, 21640, 31680, 41774 cm-1, Elemental Analysis:
Found C, 49.37; H, 4.02 and N, 7.47.
POP-2a: UV-Vis-NIR (solid state): 11490, 22890, 32000, 42356 cm-1, Elemental Analysis: Found C,
70.80; H, 4.50 and N, 5.09.
POP-3a: UV-Vis-NIR (solid state): 11811, 23080, 34218, 42878 cm-1, Elemental Analysis: Found C,
56.78; H, 3.31 and N, 5.54.
Additional Details for Physical Properties and Instrumentation
Analysis of spectral data. A Kubelka–Munk analysis was performed on the solid state reflectance data.
The KM factor, F(R)=(1−R)2/2R where R is the diffuse reflectance of the sample as compared to BaSO4,
was used to derive the absorption spectrum of the compound. Spectral deconvolutions of the NIR
transitions in the solution and solid state spectra were performed using the curve-fitting subroutine
implemented within the ThermoSuite GRAMS AI commercial software package. The following
procedure was employed for the analysis of all spectroelectrochemical data, and incorporates similar
features to previous literature reports.[8] The positions of the underlying IVCT components were
estimated by examining the first- and second-order derivatives of the bands as a guide to the energies of
the major components. The energies of the major components were subsequently fixed, and the spectral
deconvolution procedure performed to obtain the parameters for the band intensities and bandwidths. The
fixed parameters were successively removed as the fit was iteratively refined. In each case,
deconvolution was performed with the minimum number of components required to obtain convergence
of the fitting procedure. The band manifolds were approximated by a Gaussian component which closely
matched the maximum energy and band-shape on the low-energy side of the IVCT bands. Additional
Gaussian-shaped components were added to reproduce the band-shape of the manifold. While the band
parameters for these components varied slightly over repeat iterations, their relative energies, intensities
and bandwidths remained constant. Based on the reproducibility of the parameters obtained from the
deconvolutions, the uncertainties in the energies, intensities and bandwidths were estimated as ± 10 cm-1,
0.001 x 10³ and ± 10 cm-1, respectively. In all cases, the correlation coefficient (R2) for the fits reported
was >0.995.
Computational Calculations. The static binding energies for CO2 and H2 at zero Kelvin were calculated
using the dispersion–corrected semi-empirical DFT-D2 method.[9] All calculations were performed using
Vienna ab initio simulation package (VASP)[10,11] with a plane-wave energy cut-off of 400 eV and a
Gamma-point mesh for sampling the Brillouin zone. The interaction between core and valence electrons

S8
were described by the projector-augmented-wave (PAW) method and the generalized gradient
approximation (GGA) of Perdew-Burke-Ernzerhof (PBE)[12] was used to parameterize the exchange-
correlation functional. The linker representing POP-2 and POP-2a structures was modeled using a cell
size of 40 x 40 x 25 Å in order to avoid interactions between repeated images. The initial location of the
CO2 and H2 in the periodic cell was obtained from a classical simulated annealing technique. In the
simulated annealing method, the temperature was lowered in succession allowing the gas molecule to
reach a desirable configuration based on different moves such as rotation, translation and re-positioning
with preset probabilities of occurrence. This process of heating and cooling the system was repeated in
several heating cycles to find the local minima. Forty heating cycles were performed where the maximum
temperature and the final temperature were 105 K and 100 K, respectively. Static binding energies (ΔE) at
0 K were calculated using the following expression;
∆𝐸 = 𝐸𝑙𝑖𝑛𝑘𝑒𝑟 + 𝑔𝑎𝑠 ‒ 𝐸𝑙𝑖𝑛𝑘𝑒𝑟 ‒ 𝐸𝑔𝑎𝑠
where Ex refers, respectively, to the total energies of the linker + gas complex, the linker, and an isolated gas
molecule.

S9
Figure S1. Thermal Gravimetric Analysis (TGA) of POPs
Figure S2. Infrared spectra of the monomer and POPs over the range 4000-600 cm-1

S10
Figure S3. 13C CP non-quaternary suppression (NQS) Spectra of the POPs at 8 kHz MAS and 75 MHz
where * indicates the peak due to the alkynyl carbon
Figure S4. 13C CPMAS of 1,4-dibromobenzene at a spinning rate of 4.5 kHz at 260 K

S11
Figure S5. Solution state cyclic voltammograms of model compound 1 (M1) in [(n-C4H9)4N]PF6/CH3CN
at scan rates of a) 10 – 1000 mV/s and b) 10- 100 mV/s. While two reversible peaks were also observed at
slower scan rates (10, 20 and 50 m/V), only one redox process at 0.62 V was observed at fast scan rates
(200, 500 and 1000 mV/s). The appearance of only one peak in the latter case suggests that the rate of
electron transfer between triarylamine centres is too slow to be observed on this timescale. The broadness
of the redox waves is attributed to the electropolymerisation of the dimeric units, as previously reported in
the literature.[13]
S12
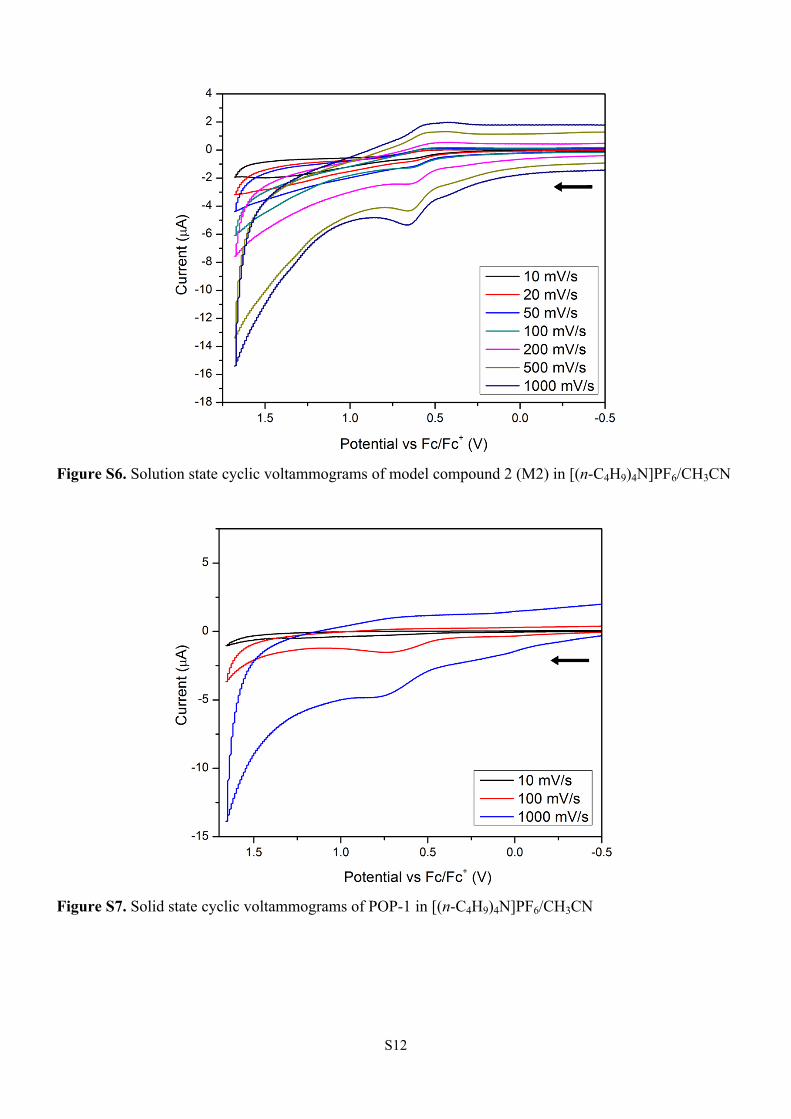
Figure S6. Solution state cyclic voltammograms of model compound 2 (M2) in [(n-C4H9)4N]PF6/CH3CN
Figure S7. Solid state cyclic voltammograms of POP-1 in [(n-C4H9)4N]PF6/CH3CN

S13
Figure S8. Solid state cyclic voltammograms of POP-2 in [(n-C4H9)4N]PF6/CH3CN
Figure S9. Solid state cyclic voltammograms of POP-3 in [(n-C4H9)4N]PF6/CH3CN

S14
Table S1. Spectral data of the deconvoluted absorption spectra for model compounds 1 and 2 (M1 and
M2) in 0.1 M [(n-C4H9)4N]PF6/DCM. The parameters for the IVCT bands are shown in bold type.a
Model
compound
max
/cm-1
max
/M-1cm-1
1/2
/cm-1
1/2º
/cm-1
rab
/Åb
6248 1297 2242 3799 0.41 12.48
7952 360 1841
10989 1980 3929
11962 748 1704
14260 9110 2375
16480 3525 2721
18720 2235 1665
20028 1460 1459
1
21314 2050 1823
7800 1010 4293 4244 0.01 19.30
10891 2260 2295
13849 12790 3576
2
17413 10760 6454
a1/2º = [2310(max )]1/2 at 298 K
= 1- 1/2/1/2º
|12| = 0.0206{(max/max)1/2/max}1/2
Hab = |12|max/erab = 0.0206(maxmax1/2)1/2/rab
brab from reference [14]
S15
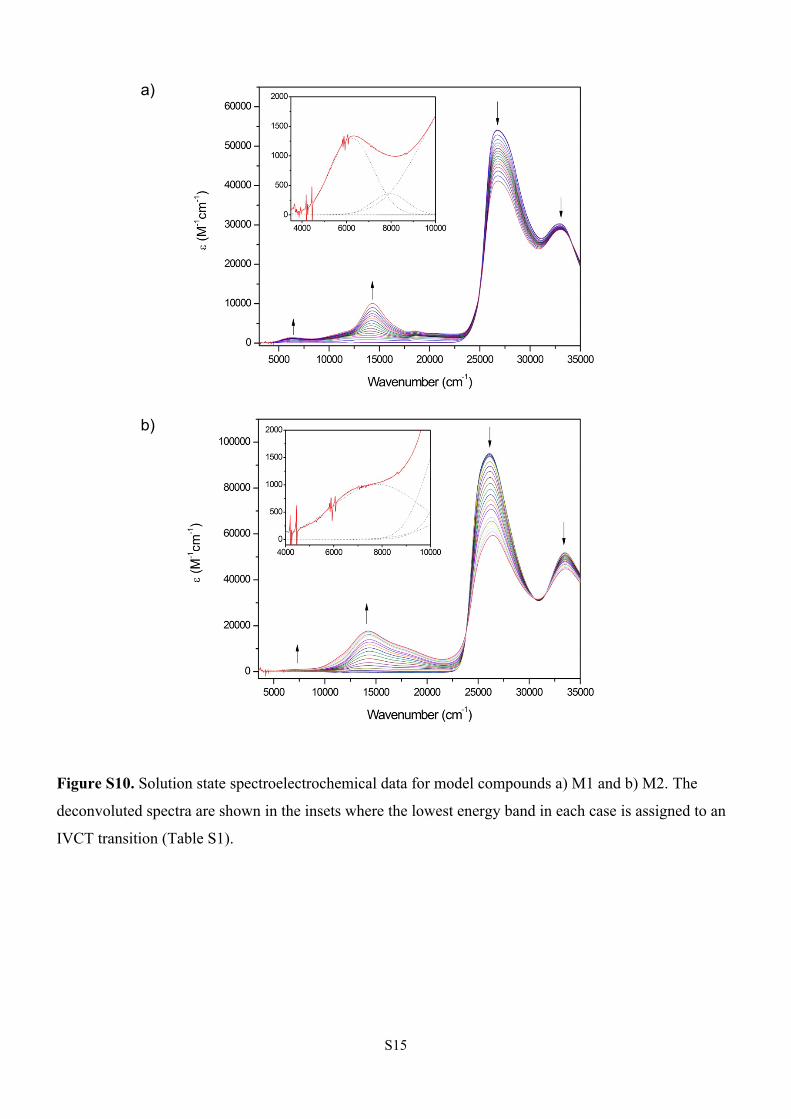
a)
b)
Figure S10. Solution state spectroelectrochemical data for model compounds a) M1 and b) M2. The
deconvoluted spectra are shown in the insets where the lowest energy band in each case is assigned to an
IVCT transition (Table S1).

S16
Figure S11. Solid state spectroelectrochemical progressions for reduction of POP-1 over the range 5000
– 25000 cm-1

S17
a)
b)
OxidationOxid ReductionRed
Figure S12. Solid state spectroelectrochemical progressions for a) oxidation and b) reduction of POP-2
over the range 5000 – 25000 cm-1 (normalised to 1 at 21370 cm-1). Photos of the solid during the
experiment are shown below to indicate the colour changes upon oxidation and reduction.

S18
a)
b)
ation uction
Figure S13. Solid state spectroelectrochemistry on POP-3 over the range 5000 – 25000 cm-1 where a)
oxidation from 0 to 3.25 V b) reduction from 3.25 to 0 V (normalised to 1 at 23150 cm-1) and photos of
the solid during the experiment.

S19
Figure S14. UV/Vis/NIR spectra over the range 5000-45000 cm-1 for a) POP-1 and POP-1a*, b) partially
oxidised species of POP-1 with increasing amount of oxidant, where A has the least and C the most
oxidant. (*Note that the spike at 12500 cm-1 is a spectral artefact at the detector changeover.)

S20
Figure S15. UV/Vis/NIR spectra over the range 5000-45000 cm-1 for a) POP-2 and POP-2a, b) partially
oxidised species of POP-2 with increasing amount of oxidant, where A has the least and C the most
oxidant.

S21
Figure S16. UV/Vis/NIR spectra over the range 5000-45000 cm-1 for a) POP-3 and POP-3a*, b) partially
oxidised species of POP-3 with increasing amount of oxidant, where A has the least and C the most
oxidant. (*Note that the spike at 12500 cm-1 is a spectral artefact at the Vis/NIR detector changeover.)

S22
Figure S17. Stacked plot of 1H NMR spectra (500 MHz) of an in situ reaction monitoring of model
compound 1 (M1) with an excess of NOBF4 over 2 hours. The reaction was carried out in
dichloromethane in an NMR tube containing a sealed capillary filled with acetone-d6 at 298 K in the bore
of the magnet with the tube kept frozen until just prior to the start of the experiment. Note that the study
was conducted in dichloromethane due to the low solubility of the model compound in acetonitrile.
Figure S18. 13C{1H} NMR of model compound 1 (M1) after reaction with an excess of NOBF4 over 2
hours

S23
Figure S19. Solid State 1H NMR saturation measurements of POP-2a at a spinning rate of 14 kHz/s. The
decay curve was fitted with a single component exponential fit to extract T1 as 2.7 s.
Table S2. Solid State 1H NMR T1 and T2 measurements of POP-2a at a spinning rate of 14 kHz/s
Time (s) Peak integral
0.00003 0.0379
0.0001 0.0265
0.0003 0.0235
0.001 0.0230
0.003 0.0239
0.01 0.0273
0.03 0.0369
0.1 0.0673
0.3 0.1435
1 0.3504
3 0.6555
10 0.9770
30 1.0033
100 1.0000
S24
Figure S20. Pore size distribution in POPs
Figure S21. N2 and CO2 isotherms at 298K from 0-10 bar for POP-2a

S25
Figure S22. CO2 isotherms at 298, 308 and 318 K for POP-2
Figure S23. CO2 isotherms at 298, 308 and 318 K for POP-2a

S26
Table S3. CO2 Adsorption Isosteres for POP-2
ln(P)
1/T 0.003354 0.003245 0.003143
n (overall)
0.04004 10.5853 10.67823 11.012
0.05606 11.32739 11.45486 11.79411
0.07208 12.06986 12.215 12.55197
0.08009 12.48364 12.62641 12.96433
0.09611 12.75203 12.88579 13.22711
0.10412 12.88399 13.02573 13.36127
0.12013 13.07615 13.20887 13.52957
0.12814 13.16626 13.30372 13.6166
0.14416 13.31295 13.43543 13.74278
Table S4. CO2 Adsorption Isosteres for POP-2a
ln(P)
1/T 0.003354 0.003245 0.003143
n (overall)
0.04224 10.72679 10.97838 11.39467
0.05632 11.34068 11.58474 12.00754
0.0704 12.06162 12.27965 12.70971
0.08448 12.47136 12.66902 13.09511
0.09856 12.76585 12.93991 13.37299
0.11264 12.88388 13.05984 13.48121
0.12672 13.0719 13.22972 13.64022
0.1408 13.17239 13.33023 13.72583

S27
Table S5. Derived EPR experimental data for the POPs at 298 K (parameters as per experimental
section).
Sample g (2Aǁ)
POP-1 2.007
POP-1a 2.005 (33.4 gauss)
POP-2 2.007
POP-2a 2.006 (37.3 gauss)
POP-3 2.007
POP-3a 2.006 (36.7 gauss)

S28
Figure S24. X-band solid state EPR spectra at 298 K of a) black, POP-1; red, POP-1a, b) black, POP-2;
red, POP-2a, c) black, POP-3; red, POP-3a.
S29
CO2 H2
a)
BE = -16.4 kJ/mol BE = -4.8 kJ/mol
b)
BE = -23.4 kJ/mol BE = -12.7 kJ/mol
Figure S25. DFT-D2 optimised locations of CO2 and H2 and associated static binding energies (BEs) in
model structures for a) POP-2 and b) POP-2a.
REFERENCES
[1] Y. Jiang, Y. Wang, J. Yang, J. Hua, B. Wang, S. Qian, H. Tian, J. Polymer Sci. Part A 2011, 49, 1830-1839.
[2] J. Cremer, P. Bauerle, J. Mater. Chem. 2006, 16, 874-884.[3] S. C. Suh, M. C. Suh, S. C. Shim, Macromol. Chem. Phys. 1999, 200, 1991-1997.[4] D. R. Coulson, L. C. Satek, S. O. Grim, in Inorganic Syntheses, John Wiley & Sons, Inc., 2007,
pp. 121-124.[5] N. Niamnont, N. Kimpitak, K. Wongravee, P. Rashatasakhon, K. K. Baldridge, J. S. Siegel, M.
Sukwattanasinitt, Chem. Commun. 2013, 49, 780-782.[6] C. Lambert, G. Nöll, Synth. Metals 2003, 139, 57-62.[7] D. R. Kattnig, B. Mladenova, G. Grampp, C. Kaiser, A. Heckmann, C. Lambert, J. Phys. Chem. C
2009, 113, 2983-2995.[8] D. S. Seneviratne, M. J. Uddin, V. Swayambunathan, H. B. Schlegel, J. F. Endicott, Inorg. Chem.
2002, 41, 1502-1517.[9] Grimme, S. J. Comput. Chem. 2006, 27, 1787-1799.[10] Kresse, G.; Furthmuller, J. Comput. Mater. Sci. 1996, 6, 15-50.[11] Kresse, G.; Hafner, J. Phys. Rev. B 1993, 48, 13115-13118.[12] Perdew, J. P.; Burke, K.; Ernzerhof, M. Phys. Rev. Lett. 1996, 77, 3865-3868.[13] C. Lambert, G. Noll, Synth. Metals, 2003, 139, 57-62; T. Lana-Villarreal, J. M. Campina, N. Guijarro,
R. Gomez, Phys. Chem. Chem. Phys., 2011, 13, 4013-4021; A. Petr, C. Kvarnstrom, L. Dunsch, A. Ivaska, Synth. Metals, 2000, 108, 245-247.
[14] C. Lambert, G. Nöll, J. Am. Chem. Soc., 1999, 121, 8434-8442.