supplemental economic analysis - home :: greater … table of contents table of contents 2 1.0...
TRANSCRIPT

SUPPLEMENTAL REGULATORY IMPACT REVIEW ANALYSIS TO THE 2007 SUMMER FLOUNDER, SCUP, AND BLACK SEA BASS SPECIFICATIONS
October 2006
National Marine Fisheries Service Northeast Fisheries Science Center
166 Water Street Woods Hole, MA 02543

2
TABLE OF CONTENTS TABLE OF CONTENTS ............................................................................................................................................2 1.0 PURPOSE AND OVERVIEW OF SUPPLEMENTAL ECONOMIC ANALYSIS.........................................3 2.0 DESCRIPTION OF ALTERNATIVES...............................................................................................................3 3.0 EVALUATION OF E.O. 12866 SIGNIFICANCE..............................................................................................4
3.1 INTRODUCTION AND DETERMINATION OF 2006 BASELINES.............................................................................4 3.2 ANALYSIS OF ALTERNATIVES ............................................................................................................................6
3.2.1 Summer Flounder Alternative 5, Scup Alternative 1, Black Sea Bass Alternative 1...............................6 3.2.2 Summer Flounder Alternative 5, Scup Alternative 2, Black Sea Bass Alternative 2...............................7 3.2.3 Summer Flounder Alternative 5, Scup Alternative 3, Black Sea Bass Alternative 3...............................8 3.2.4 Summer Flounder Alternative 6, Scup Alternative 1, Black Sea Bass Alternative 1...............................9 3.2.5 Summer Flounder Alternative 6, Scup Alternative 2, Black Sea Bass Alternative 2...............................9 3.2.6 Summer Flounder Alternative 6, Scup Alternative 3, Black Sea Bass Alternative 3.............................10
3.3 SUMMARY OF COMMERCIAL FISHING IMPACTS .............................................................................................10 3.4 RECREATIONAL FISHING IMPACTS .................................................................................................................12
4.0 INITIAL REGULATORY FLEXIBILITY ANALYSIS..................................................................................13 4.1 INTRODUCTION AND METHODS .......................................................................................................................13 4.2 IMPACT RESULTS .............................................................................................................................................14
4.2.1 Summer Flounder Alternative 5, Scup Alternative 1, Black Sea Bass Alternative 1.............................14 4.2.2 Summer Flounder Alternative 5, Scup Alternative 2, Black Sea Bass Alternative 2.............................16 4.2.3 Summer Flounder Alternative 5, Scup Alternative 3, Black Sea Bass Alternative 3.............................17 4.2.4 Summer Flounder Alternative 6, Scup Alternative 1, Black Sea Bass Alternative 1.............................17 4.2.5 Summer Flounder Alternative 6, Scup Alternative 2, Black Sea Bass Alternative 2.............................19 4.2.6 Summer Flounder Alternative 6, Scup Alternative 3, Black Sea Bass Alternative 3.............................21
4.3 SUMMARY OF COMMERCIAL FISHING IMPACTS .............................................................................................21 4.4 RECREATIONAL FISHING IMPACTS .................................................................................................................22
REFERENCES ..........................................................................................................................................................24
3
1.0 PURPOSE AND OVERVIEW OF SUPPLEMENTAL ECONOMIC ANALYSIS The Northeast Fisheries Science Center has prepared this supplemental analysis to evaluate the economic effects of updated total allowable landings limits (TALs) for summer flounder in 2007. An internal peer review of the summer flounder assessment and reference points conducted by NOAA Fisheries Office of Science and Technology during September 2006 required revisions to the VPA, biological reference point, and the projection calculations that determine the recommended summer flounder TAL for 2007. The findings of the peer review panel and the revised assessment results (Terceiro 2006) were not available when the Mid-Atlantic Council considered regulatory measures for summer flounder in 2007. Therefore, this analysis provides an economic evaluation of the updated summer flounder landings recommendations for 2007 and supplements the economic assessment contained in the 2007 Summer Flounder, Scup, and Black Sea Bass Specifications document (herein referred to as the 2007 specifications document). The economic impacts of two different levels of summer flounder TALs for 2007 were considered in this assessment. The estimated summer flounder TAL associated with a 50% probability of achieving the target F in 2007 (14.156 million lbs) and the TAL estimated to have a 75% probability of achieving the target F in 2007 (12.983 million lbs). For purposes of this assessment, the TAL of 14.156 million pounds is considered to be summer flounder alternative 5 and the TAL of 12.983 million pounds is labeled summer flounder alternative 6. The projected economic impacts of these alternatives are analyzed in isolation and also in combination with the scup and black sea bass alternatives contained in the 2007 specifications document. Overall impacts (i.e., combined impacts of summer flounder, scup, and black sea bass) were examined because many of the vessels active in these fisheries participate in more than one or even all three of the fisheries. Similar to the economic assessment conducted in the 2007 specifications document, this supplemental analysis is principally for the commercial fishery. Recreational fishing management measures for the 2007 season will not be adopted until the December 2006 Mid-Atlantic Council meeting. A comprehensive recreational fishing specifications document is prepared after that meeting to address the economic impacts of the proposed measures. For the most part, only general qualitative statements regarding the potential economic effects of the proposed quota levels are made in this analysis. 2.0 DESCRIPTION OF ALTERNATIVES The realized summer flounder TALs associated with alternative’s 5 and 6 will likely be lower than indicated above. Conditionally approved research set-aside (RSA) projects for summer flounder, scup, and black sea bass for 2007 will likely reduce the amounts available to commercial and recreational fishermen (see 2007 specifications document). The conditionally approved 2007 RSA projects have requested summer flounder, scup and black sea bass research set-asides in the following amounts: 567,062 lbs, 530,886 lbs and 131,858 lbs, respectively. However, RSA amounts cannot exceed 3% of the TALs for each of the species. The 3% maximum RSA amounts associated with summer flounder alternative’s 5 and 6 are lower than
4
the conditionally approved level. Therefore, it is assumed that the RSA amounts will be limited to 3% of the TAL (0.4247 million lbs for alternative 5 and 0.3895 million lbs for alternative 6). After the RSA is deducted from the TAL, 60 percent is allocated to the commercial fishery and 40 percent to the recreational fishery (as was done each year since 1993). However, summer flounder commercial fishing overages during 2006 must also be deducted from the commercial share of the 2007 TAL (the recreational share of the TAL is calculated before the commercial overages are deducted). According to the 2007 specifications document (as of July 31, 2006) the only state that had exceeded their summer flounder commercial TAL was Delaware (by 0.05 million lbs). Although additional overages may occur in 2006, only the Delaware overage is deducted from the 2007 commercial TAL in this analysis. These calculations result in a preliminary adjusted commercial quota of 8.2088 million pounds and a preliminary recreational harvest limit of 5.4925 million pounds under alternative 5 (Table 1). The preliminary adjusted commercial quota under alternative 6 equates to 7.5261 million pounds and the associated recreational share to 5.0374 million pounds. The adjustments that were determined in the 2007 specifications document for scup and black sea bass are included in Table 1 as well since the economic effects of the revised landings limits for summer flounder will be analyzed in conjunction with the proposed scup and black sea bass alternatives. 3.0 EVALUATION OF E.O. 12866 SIGNIFICANCE 3.1 Introduction and Determination of 2006 Baselines The economic impacts of the proposed conservation measures are dependent upon which suite of summer flounder, scup, and black sea bass alternatives are adopted for the 2007 fishing year. All of the alternatives specify different levels of TALs and therefore will result in varying levels of economic impacts. In this analysis, three combinations of scup and black sea bass alternatives are analyzed in conjunction with summer flounder alternative 5 and summer flounder alternative 6 (Table 2). The significance of the proposed alternatives on the commercial fishing fleet in the Northeast Region is evaluated according to predicted changes in gross revenue from 2006 to 2007. The impacts on ancillary industries that support the summer flounder, scup and black sea bass commercial harvesting activities and the potential effects on businesses up the marketing chain, such as wholesale seafood dealers and seafood processors, are projected assuming a multiplier effect of 1.5 to 2.0. Potential losses in recreational fishing opportunities and the multiplier effects of this reduced activity are also discussed. Determination of 2006 Summer Flounder Baseline Commercial landings of summer flounder in calendar year 2006 are likely to approach the 2006 adjusted commercial quota of 13.94 million pounds. As of September 16, 2006 summer flounder landings were estimated at 9.95 million pounds (71% of the adjusted quota) according to NOAA Fisheries weekly quota monitoring reports. Examination of the 2005 summer flounder quota monitoring reports revealed that approximately 24 percent of the landings occurred during the

5
last four months of the year. If this trend continues during 2006, total 2006 landings would approximate 13.3 million pounds (95% of the adjusted quota). However, to account for potential differences during September through December of this year, it was assumed that 2006 landings will equal the 2006 adjusted summer flounder commercial quota of 13.94 million pounds. The proposed adjusted commercial TALs under alternative’s 5 and 6 represent a 41.11 percent and a 46.01 percent decrease, respectively, in landings in 2007 relative to 2006 levels. Reductions in landings of this magnitude will result in an overall decrease in summer flounder ex-vessel revenue in 2007. However, given the reduced TAL in 2007 the ex-vessel price of summer flounder should rise, relative to 2006, thereby mitigating at least some of the losses associated with lower levels of landings. To forecast how changes in summer flounder supply might affect ex-vessel prices the price-quantity equation specified in Amendment 7 to the Fishery Management Plan was used in this analysis. The price-quantity equation was specified in log-linear form so the price flexibility coefficient (-0.2941) provides a direct estimate of the percentage change in ex-vessel prices given a 1 percent change in landings. The results show that a 10 percent decline in landings of summer flounder would increase average annual ex-vessel prices (nominal) by 2.941 percent. In addition to using the price-quantity equation to predict how average ex-vessel prices will change in 2007 because of the reduced TALs, it was also used to generate the average price paid to harvesters in 2006. NMFS dealer weighout data for 2006 is not yet complete so rather than use partial year landings and revenue data to calculate an average ex-vessel price for 2006, the price model was used to predict how the average ex-vessel price changed from 2005 to 2006. Dealer weighout data from Maine to North Carolina indicates that the total commercial landings of summer flounder in 2005 (17.14 million lbs) were valued at $29.138 million. This equates to an average 2005 ex-vessel price of $1.70 per pound. According to the price-quantity equation the estimated 18.67 percent reduction in landings from 2005 (17.14 million lbs) to 2006 (13.94 million lbs) will raise the average nominal price of fluke from $1.70 to $1.79 per pound. Therefore, total fluke ex-vessel revenues are projected to be $24.9526 million in 2006. For purposes of this analysis, this is the baseline level of summer flounder ex-vessel revenues against which the 2007 proposed alternatives will be evaluated. Determination of 2006 Scup Baseline According to NOAA Fisheries weekly quota monitoring reports commercial landings of scup in 2006 were down about 12 percent below 2005 levels (as of September 16, 2006). However, since scup landings during the remaining 4 months in 2006 may differ from that observed in 2005, it was assumed that commercial landings in 2006 will be the same as in 2005. Dealer weighout data indicates that commercial landings of scup in 2005 (9.56 million lbs) were valued at $7.17 million in the Northeast Region. To account for the price effect of inflation from 2005 to 2006, the average ex-vessel price in 2005 ($0.75 per lb) was adjusted to its 2006 equivalent value ($0.77 per lb) using a commercial fishing industry deflator obtained from the Minnesota IMPLAN Group, Inc. (2003). This results in estimated ex-vessel revenues of $7.3612 million in 2006 and is considered the baseline level of scup gross revenues for this analysis.

6
Determination of 2006 Black Sea Bass Baseline Commercial landings of black sea bass in 2006 are currently about 13 percent lower than estimated during 2005 according to quota monitoring reports collected by NOAA Fisheries (as of September 16, 2006). However, to provide a landings buffer that accounts for potential differences during the remaining 3 ½ months of the year, it was assumed that commercial landings of black sea bass in 2006 will be the same as in 2005. Commercial landings of black sea bass in the Northeast Region in 2005 (2.86 million lbs) were valued at $7.2644 million. Accounting for the price effect of inflation from 2005 to 2006 in the same manner as above, raises the average ex-vessel price to $2.60 per pound in 2006 (from $2.54 per lb in 2005). Thus, assuming landings remain constant in 2006, ex-vessel revenues derived from black sea bass should approximate $7.436 million in 2006. 3.2 Analysis of Alternatives 3.2.1 Summer Flounder Alternative 5, Scup Alternative 1, Black Sea Bass Alternative 1 The proposed 2007 TAL under summer flounder alternative 5 is 14.156 million pounds. After adjusting for the research set-aside and the estimated commercial fishing overage in 2006, the preliminary adjusted commercial quota for 2007 is 8.2088 million pounds and the recreational share is 5.4925 million pounds. For the commercial fishery, this represents a 41.11 percent decrease in total summer flounder landings relative to 2006 levels. As landings decline, however, the average nominal ex-vessel price per pound is predicted to rise by 12.09 percent (according the price-quantity equation) to $1.9055 per pound in 2007. This price is in 2007 dollars, however, so it must be converted to 2006 dollars so that comparisons can be made to the baseline values. Using a commercial fishing industry deflator value (1.0243) obtained from the Minnesota IMPLAN Group (2003) to measure the relative change in seafood prices from 2006 to 2007, results in an average ex-vessel price of $1.86 per pound. Thus, projected gross revenues earned from summer flounder landings under this alternative in 2007 are estimated to be $15.2684 million (in 2006 dollars). Compared to the 2006 baseline, this translates into a real reduction in summer flounder revenue of $9.6842 million. The adjusted commercial scup quota under alternative 1 for 2007 is identical to the quota in place for 2006 (11.93 million lbs). Thus, the opportunity for landing scup will not change. However, since annual landings of scup have not exceeded 10 million pounds since 1993, it’s not likely that the entire commercial scup TAL under alternative 1 will be landed in 2007. In fact, according to available NOAA Fisheries weekly quota monitoring reports landings are about 12 percent lower than observed in 2005 (as of September 16, 2006). Therefore, instead of using the adjusted commercial TAL proposed under alternative 1 to determine likely 2007 landings levels, it was assumed that scup landings in 2007 would approximate the level observed in 2005 (9.56 million lbs). To account for the price effect of inflation from 2005 to 2006, the average ex-vessel scup price in 2005 ($0.75 per lb) was adjusted to its 2006 equivalent value ($0.77 per lb) using a commercial fishing industry deflator obtained from the Minnesota IMPLAN Group, Inc. (2003). Projected ex-vessel scup revenues under alternative 1 in 2007 are then estimated to be $7.3612 million (in 2006 dollars), the same amount projected to be earned in 2006. Therefore, this alternative will likely cause no real change in commercial scup gross revenues in 2007.
7
The 2007 adjusted black sea bass commercial quota under alternative 1 (3.12 million lbs) is approximately 19 percent lower than the adjusted 2006 quota (3.38 million lbs). However, recent landings of black sea bass have not been constrained by the annual quotas. In 2005 landings were estimated at 2.86 million pounds and as of September 16, 2006 black sea bass landings were about 13 percent lower than estimated during this time period in 2005. If this trend continues next year, the entire adjusted alternative 1 quota is not likely to be landed in 2007. Therefore, instead of using the adjusted commercial TAL proposed under alternative 1 to determine likely 2007 landings levels, it was assumed that black sea bass landings in 2007 would approximate the level observed in 2005 (2.86 million lbs). Total ex-vessel black sea bass revenues associated with alternative 1 in 2007 were then estimated by adjusting the estimated average ex-vessel price per pound in 2005 ($2.54) to its 2006 equivalent value ($2.60), as indicated above, and multiplying by the projected landings in 2007 (2.86 million lbs). This calculation results in estimated gross revenues of $7.436 million (in 2006 dollars), the same amount projected to be earned in 2006. Therefore, no real change in commercial black sea bass revenue is anticipated to occur under alternative 1. In total, if this combination of alternatives is chosen to manage summer flounder, scup and black sea bass in 2007, commercial harvesting gross revenue in the Northeast Region will decline by an estimated $9.6842 million or 24.36% relative to projected revenues earned in 2006 (Table 3). The entire reduction is estimated to be attributable to a decline in summer flounder earnings. No changes in scup or black sea bass revenues are anticipated to occur relative to 2006. 3.2.2 Summer Flounder Alternative 5, Scup Alternative 2, Black Sea Bass Alternative 2 As indicated in the previous section, projected gross revenue earned from commercial summer flounder landings under alternative 5 in 2007 are estimated to be $15.2684 million (in 2006 dollars). Compared to the 2006 baseline, this translates into a real reduction in summer flounder revenue of $9.6842 million. The adjusted commercial scup quota under alternative 2 for 2007 is estimated at 8.90 million pounds. This is approximately 25 percent lower than the adjusted quota in place during 2006 (11.93 million lbs). However, as described above, landings have not been constrained by the annual TALs. Landings in 2005 were estimated at 9.56 million pounds and average approximately 9.6 million pounds from 2003-2005. Preliminary landings data from NOAA Fisheries weekly quota management reports indicates that as of September 16, 2006 scup landings are about 12 percent below the level observed during this time period in 2005, so it’s not likely that 2006 landings will exceed the level observed in 2005. To account for potential uncertainties it is assumed that landings in 2006 will be the same as in 2005. This translates into a decrease in 2007 landings of approximately 7 percent if this alternative is adopted in 2007. Although ex-vessel prices could rise slightly in response to the estimated reduction in landings, it was assumed that the price-quantity relationship will remain constant in 2007. Thus, applying the 2006 average estimated ex-vessel price per pound ($0.77) to the projected 2007 landings (8.90 million lbs) results in total gross revenues of $6.853 million. This translates into a real reduction in scup revenue of $0.5082 million, relative to the 2006 baseline.
8
The 2007 adjusted black sea bass commercial quota under alternative 2 is estimated at 2.39 million pounds. This is approximately 38% below the adjusted quota in 2006 (3.83 million lbs). However, annual landings of black sea bass have generally not been constrained by the quotas. In 2005 landings were estimated at 2.86 million pounds, approximately 20 percent higher than the proposed 2007 adjusted quota. Unfortunately, no price-quantity equation for black sea bass is available to predict how a reduction in landings would affect ex-vessel prices. A 20 percent reduction in landings would likely have a positive impact on ex-vessel prices, thereby lessening the revenue impact of the reduced quota under alternative 2. However, since this adjustment is unknown, it was assumed that the price-quantity relationship will remain constant in 2007. Assuming the entire black sea bass alternative 2 quota will be landed in 2007 (2.39 million lbs), ex-vessel gross revenues are projected to be $6.214 million (in 2006 dollars). Relative to the 2006 baseline, this represents a real decline in gross revenues of $1.222 million. In total, if this combination of alternatives is chosen to manage summer flounder, scup and black sea bass in 2007, ex-vessel gross revenues in the Northeast Region will decline by an estimated $11.4142 million or 28.72 percent relative to projected revenues earned in 2006 (Table 3). 3.2.3 Summer Flounder Alternative 5, Scup Alternative 3, Black Sea Bass Alternative 3 As indicated in section 3.2.1, projected gross revenues earned from commercial summer flounder landings under alternative 5 in 2007 are estimated to be $15.2684 million (in 2006 dollars). Compared to the 2006 baseline, this translates into a real reduction in summer flounder revenue of $9.6842 million. The 2007 adjusted commercial quota for scup is estimated at 12.13 million pounds. This is approximately 2 percent higher than the adjusted commercial quota in place during 2006 (11.93 million lbs). Although this quota increase would allow for higher potential fleet-wide earnings, landings have not approached this level for more than a decade. Thus, for this analysis, it was assumed that no change in landings would occur under scup alternative 3. Since landings in 2005 (9.56 million lbs) are used to approximate 2006 and 2007 levels, ex-vessel revenues in 2007 are projected to be $7.3612 million (in 2006 dollars). This is the same amount projected to be earned in 2006. Therefore, no real change in commercial scup revenue is anticipated to occur under alternative 3. The 2007 adjusted commercial quota for black sea bass is estimated at 3.86 million pounds, approximately 1 percent higher than the adjusted commercial quota in place during 2006 (3.83 million lbs). Black sea bass landings in 2007 are not likely to approach this increased level, however, given that in 2005 only 2.86 million pounds were landed and 2006 landings data indicate that black sea bass landings in 2006 as of September 16, 2006 are about 13 percent below 2005 levels during this time period. Therefore, it was assumed that black sea bass landings in 2007 would be unaffected by the 1 percent increase in quota relative to 2006. Total ex-vessel gross revenues under this alternative in 2007 ($7.436 million in 2006 dollars) were estimated by applying the average estimated ex-vessel price per pound ($2.60) to the total estimated landings (2.86 million lbs). This is the same amount projected to be earned from black sea bass in 2006. Therefore, no real change in commercial black sea bass revenue is anticipated to occur under alternative 3.
9
In total, if this combination of alternatives is chosen to manage summer flounder, scup and black sea bass in 2007, commercial harvesting gross revenues in the Northeast Region will decline by an estimated $9.6842 million or 24.36% relative to projected revenues earned in 2006 (Table 3). This is the same estimated reduction determined in section 3.2.1 under summer flounder alternative 5, scup alternative 1 and black sea bass alternative 1 because no changes in scup or black sea bass revenues are anticipated to occur relative to 2006 in both alternative’s 1 and 3 for scup and black sea bass. 3.2.4 Summer Flounder Alternative 6, Scup Alternative 1, Black Sea Bass Alternative 1 The proposed 2007 TAL under summer flounder alternative 6 is 12.983 million pounds. After adjusting for the research set-aside and the estimated commercial fishing overage in 2006, the preliminary adjusted commercial quota for 2007 is 7.5261 million pounds and the recreational share is 5.0374 million pounds. For the commercial fishery, this represents a 46.01 percent decrease in total summer flounder landings relative to 2006 levels. As landings decline, however, the average nominal ex-vessel price per pound is predicted to rise by 13.53 percent (according the price-quantity equation) to $1.93 per pound in 2007. This price is in 2007 dollars, however, so it must be converted to 2006 dollars so that comparisons can be made to the baseline values. Using a commercial fishing industry deflator value (1.0243) obtained from the Minnesota IMPLAN Group (2003) to measure the relative change in seafood prices from 2006 to 2007, results in an average ex-vessel price of $1.88 per pound. Thus, projected gross revenues earned from commercial summer flounder landings under this alternative in 2007 are estimated to be $14.1491 million (in 2006 dollars). Compared to the 2006 baseline, this translates into a real reduction in summer flounder revenue of $10.8035 million (-43.3%). As indicated in section 3.2.1, projected gross revenues earned from commercial scup landings under alternative 1 in 2007 are estimated to be $7.3612 million (in 2006 dollars). This is the same amount projected to be earned in 2006, so no real change in total commercial scup revenue is anticipated to occur under scup alternative 1. Total projected black sea bass revenues in 2007 under alternative 1 are described in section 3.2.1. The black sea bass adjusted quota under alternative 1 is not expected to alter ex-vessel revenues in 2007. In total, if this combination of alternatives is chosen to manage summer flounder, scup and black sea bass in 2007, commercial harvesting gross revenues in the Northeast Region will decline by an estimated $10.8033 million or 27.18% relative to projected revenues earned in 2006 (Table 3). The entire revenue reduction is attributable to a decline in summer flounder earnings. No changes in scup or black sea bass revenues are anticipated to occur relative to 2006. 3.2.5 Summer Flounder Alternative 6, Scup Alternative 2, Black Sea Bass Alternative 2 As indicated in the previous section, projected gross revenues earned from commercial summer flounder landings under alternative 6 in 2007 are estimated to be $14.1491 million (in 2006 dollars). Compared to the 2006 baseline, this translates into a real reduction in summer flounder

10
revenue of $10.8035 million. In section 3.2.2, projected gross revenues earned from commercial scup landings under alternative 2 in 2007 are shown to be $6.853 million (in 2006 dollars). Compared to the 2006 baseline ($7.3612 million), this translates into a real reduction in scup revenue of $0.5082 million. Total projected black sea bass revenues in 2007 under alternative 2 are also described in section 3.2.2. Revenues are projected to be $6.214 million (in 2006 dollars) which translates into a revenue reduction of $1.222 million from 2006 levels ($7.436 million). Across all three species, total ex-vessel revenue under summer flounder alternative 6, scup alternative 2 and black sea bass alternative 2 is estimated to be $27.2161 million (in 2006 dollars). This is a decline of approximately $12.5 million relative to projected 2006 ex-vessel revenues (Table 3). 3.2.6 Summer Flounder Alternative 6, Scup Alternative 3, Black Sea Bass Alternative 3 As indicated in section 3.2.4, projected gross revenues earned from commercial summer flounder landings under alternative 6 in 2007 are estimated to be $14.1491 million (in 2006 dollars). Compared to the 2006 baseline, this translates into a real reduction in summer flounder revenue of $10.8035 million. In section 3.2.3, projected gross revenues earned from commercial scup landings under alternative 3 in 2007 are shown to be $7.3612 million (in 2006 dollars). This is the same amount projected to be earned in 2006. Therefore, no real change in commercial scup revenue is anticipated to occur under alternative 3. Total projected black sea bass revenues in 2007 under alternative 3 are also described in section 3.2.2. Revenues are projected to be $7.436 million (in 2006 dollars), the same amount projected to be earned from black sea bass in 2006. Therefore, no real change in commercial black sea bass revenue is anticipated to occur under alternative 3. If summer flounder alternative 6, scup alternative 3 and black sea bass alternative 3 are chosen to manage these species in 2007, commercial harvesting gross revenues in the Northeast Region will decline by an estimated $10.8033 million or 27.18% relative to projected revenues earned in 2006 (Table 3). This is the same estimated reduction determined in section 3.2.4 under summer flounder alternative 6, scup alternative 1 and black sea bass alternative 1 because no changes in scup or black sea bass revenues are anticipated to occur relative to 2006 in both alternative’s 1 and 3 for scup and black sea bass. 3.3 Summary of Commercial Fishing Impacts Of the combinations of alternatives analyzed in this assessment, implementation of summer flounder alternative 5, scup alternative 1 or 3 and black sea bass alternative 1 or 3 would result in the lowest potential reduction in ex-vessel revenues in 2007. Nonetheless, these combinations of
11
alternatives are estimated to reduce overall ex-vessel revenues in 2007 by about 24 percent from 2006 levels. If scup alternative 2 and black sea bass alternative 2 are chosen in combination with summer flounder alternative 5 total ex-vessel revenue is predicted to decline approximately 29 percent in 2007. Summer flounder alternative 6 proposes a lower commercial TAL than alternative 5 so greater losses are expected under alternative 6. The average ex-vessel price per pound under alternative 6 is estimated to increase further than under alternative 5, but the additional increase is not enough to offset the comparatively greater decline in alternative 5 landings. If summer flounder alternative 6 is adopted in 2007 in combination with scup alternative 1 or 3 and black sea bass alternative 1 or 3, gross revenues are projected to decline by about 27 percent from 2006 levels. In turn, if summer flounder alternative 6 is combined with scup alternative 2 and black sea bass alternative 2 ex-vessel losses reaching up to $12.5 million or 32 percent relative to 2006 levels are estimated. The economic effects of fishery management policies that alter commercial harvesting levels in the Northeast extend well beyond dockside sales of commercial harvesting activities. As commercial harvest levels change ancillary industries that supply the commercial fishing industry with inputs in turn adjust their production levels and expenditure patterns, initiating further rounds of backward linked repercussions in the economy. Value-added businesses that distribute and process seafood and retail-level establishments that sell seafood may also be required to adjust their production levels when the availability of local seafood changes, thereby affecting input requirements from their other suppliers, and triggering a whole series of additional multiplier effects as the economy adapts to the policy action. A variety of analytical approaches are available for determining these multiplier effects, such as input-output modeling. Although a model of this kind was not developed for this assessment, total economy-wide revenue losses were approximated by assuming a multiplier of 1.5 to 2.0 for the Northeast Region. Given the large geographical area of the Northeast Region, it is likely that the sales multiplier falls within those values. Therefore, the potential range of total economy-wide gross revenue losses from reductions in commercial harvesting activities can be estimated by multiplying the revenue losses shown in Table 3 by 1.5 and 2.0. This procedure results in total revenue losses between $18.8 million and $25.1 million for the most constraining combination of alternatives analyzed in this assessment (summer flounder alternative 6, scup alternative 2 and black sea bass alternative 2). Lower overall reductions in revenues result from the other combinations of alternatives in this analysis. The indicated multiplier effects should be viewed as short-term losses, however. It is difficult to assess how some of the indirectly affected businesses will respond to the reduction in seafood supply. For example, seafood wholesalers and processors may be able to offset initial supply reductions through imports thereby minimizing the ripple effect on businesses that support these industries. The indicated commercial harvesting revenue losses could also be viewed as short-term losses in the sense that vessels may be able offset initial ex-vessel revenue losses due to the proposed
12
quota reductions by switching to other fisheries. The revenue losses indicated in this analysis assume no switching behavior will occur in 2007. Overall, it’s not likely that the proposed quota reduction scenarios for the commercial fishing sector will have an annual effect on the economy of $100 million or adversely affect in a material way the economy, a sector of the economy, productivity, competition, jobs, the environment, public health or safety, or State, local, or tribal governments or communities. The total economy-wide reduction in gross revenue under the most restrictive set of alternatives results in a loss of $25.1 million. However, if the cumulative impact of the potential reduction in revenue derived from a decline in the demand for recreational fishing trips is considered (see below), the economy-wide impact losses could be substantially larger. Nonetheless, although there is considerable uncertainty regarding the potential magnitude of the recreational impacts at this time, it’s not likely that the combined commercial and recreational effects from these alternatives will exceed $100 million. 3.4 Recreational Fishing Impacts The preliminary adjusted recreational harvest limit under summer flounder alternative 5 (5.4925 million lbs) is approximately 45 percent lower than estimated landings in 2005 (10.02 million lbs). The preliminary adjusted recreational harvest limit under summer flounder alternative 6 (5.0374 million lbs) is approximately 50 percent lower than estimated landings in 2005. Recreational landings of summer flounder have fluctuated over the years, so it is possible that landings in 2006 could be lower than in 2005. However, over the past 5 years (2001-2005) summer flounder landings averaged 10.44 million pounds. Assuming recreational landings of summer flounder in 2006 approach this level, substantial reductions in landings will be required under either alternative in 2007. As indicated in section 1.0, a comprehensive economic assessment of the proposed recreational alternatives will be prepared after the Mid-Atlantic Fishery Management Council and the Atlantic States Marine Fisheries Commission’s Summer Flounder, Scup and Black Sea Bass Board submit recommendations for the 2007 measures in December. Nonetheless, given the magnitude of the proposed summer flounder quota reductions evaluated in this analysis, it is clear that some level of losses in angler satisfaction, expenditures, and demand for recreational fishing trips will occur under these alternatives in 2007. In 2005, approximately 5.9 million recreational fishing trips targeted summer flounder (Marine Recreational Fisheries Statistics Survey data). These trips consisted of for-hire trips (385 thousand), private/rental trips (4.5 million) and shore fishing trips (1.0 million). If the average expenditure per trip by mode of fishing, contained in Steinback and Gentner (2001), is adjusted to its 2005 equivalent and applied to the targeted trip estimates, recreational fishing expenditures associated with summer flounder in 2005 approach $324 million. These expenditures support a wide variety of ancillary industries in the Northeast Region which would also be impacted by a reduction in angler expenditures. Although it is difficult to predict how sensitive the “affected” anglers will be to more restrictive management measures in 2007, it is clear that the impacts of these alternatives could be substantial.
13
Recreational landings of scup and black sea bass during the past few years have generally not exceeded the proposed 2007 TALs so it is unlikely that any of the alternatives for these species will result in substantive decreases in angler satisfaction, expenditures, or demand for recreational fishing trips. 4.0 INITIAL REGULATORY FLEXIBILITY ANALYSIS 4.1 Introduction and Methods An initial regulatory flexibility analysis (IRFA) was undertaken to further examine the potential impacts of the proposed rules on small businesses that land summer flounder, scup and black sea bass. A complete description of the legal mandates required in the Regulatory Flexibility Act and the definitions used in the determination of “small businesses” are provided in section 3.0 of the 2007 specifications document. Adjusted Northeast Region dealer weighout data from calendar year 2005 were used to assess the effects of the proposed alternatives on commercial fishing businesses. All vessels that landed at least one or more pounds of summer flounder, scup and black sea bass, irrespective of federal permit status, were included in the assessment. To capture potential differences in impacts across “types” of businesses, vessels were grouped into seven classes based on combinations of summer flounder, scup, and black sea bass landings (Table 4). Impacts were measured by examining annual vessel-level changes in gross revenues from 2006 to 2007. Gross revenues in 2006 were calculated by adjusting the 2005 dealer weighout data (the last full year of availability) to reflect estimated landings and prices in 2006. As indicated in section 3.0, landings of scup and black sea bass in 2006 were assumed to remain constant in 2006, but since prices of manufactured seafood rose by an estimated 2.37 percent from 2005 to 2006 the revenue that each vessel received for these species in 2006 was raised by 2.37 percent in the analysis. Summer flounder commercial landings, on the other hand, are estimated to decline from 17.14 million pounds in 2005 to 13.94 million pounds in 2006 in this analysis. Associated with this decline in landings is a predicted increase in the average nominal ex-vessel price per pound from $1.70 in 2005 to $1.79 in 2006 (see section 3.0). However, even with the predicted price increase, 2006 fluke revenues are projected to decline from $29.138 million in 2005 ($29.8286 million in 2006 dollars) to $24.9526 million in 2006, a 16.35 percent reduction in gross revenue (in 2006 dollars). To account for this reduction, the revenue that each vessel received for summer flounder (in 2006 dollars) was reduced by 16.35 percent. Revenues earned from all other species were assumed to remain constant, but the ex-vessel value of these landings were increased by 2.37 percent to account for the estimated rise in seafood prices from 2005 to 2006. This adjusted data set provided the basis for comparison to predicted gross revenues under the proposed alternatives in 2007. The next step in the analysis was to calculate expected vessel-level gross revenues in 2007 under the proposed alternatives. The same combinations of alternatives identified in section 3.0 (see Table 2) were considered in this IRFA. Expected vessel revenues in 2007 were calculated by applying the estimated total proportional change in species-level earnings from 2006 to 2007
14
under each combination of alternatives to the adjusted data set. For example, in section 3.2, it was estimated that under summer flounder alternative 5, scup alternative 1 and black sea bass alternative 1, total 2007 summer flounder revenues (in 2006 dollars) would decline by 38.81 percent relative to 2006 levels. No change in revenue was predicted for scup and black sea bass. Therefore, when analyzing this set of alternatives summer flounder revenues earned by each vessel in the adjusted data set were reduced by 38.81 percent. The sum of the ensuing revenue values across all of the species landed by a particular vessel then provides an indication of their total expected 2007 gross revenues (in 2006 dollars). In this example no adjustments were needed to adjust scup or black sea bass revenues since landings for these species are expected to remain constant. In addition, revenues earned from all other species are assumed to remain constant under each alternative. The estimated proportional change in total revenue for summer flounder, scup and black sea bass under each alternative is described in section 3.2 and summarized in Table 3. The final step was to compare the estimated 2007 revenues (in 2006 dollars) from all species to the 2006 base revenues for every vessel in each of the 7 landings classes to assess potential changes. The results are further summarized according to impacts by state, county and home port. 4.2 Impact Results 4.2.1 Summer Flounder Alternative 5, Scup Alternative 1, Black Sea Bass Alternative 1 If summer flounder alternative 5, scup alternative 1 and black seas bass alternative 1 are adopted in 2007, 276 vessels (out of a total of 917 vessels that landed these species in 2006) are projected to incur total revenue losses of 5 percent or more (Table 5). Of these 276 vessels, 64 are projected to incur revenue reductions of 5-9 percent, 95 are projected to incur losses of 10-19 percent, 54 are projected to lose 20-29 percent and 63 vessels are projected to lose up to 30-39 percent of their total gross revenue. Approximately 70 percent of the vessels (641) are projected to incur revenue reductions of less than 5 percent, with 161 of these vessels estimated to incur no revenue reductions because only scup and/or black sea bass was landed. Scup and black sea bass landings in 2007 are predicted to remain the same as in 2006 under these alternatives. All vessels with summer flounder landings are projected to incur revenue reductions in 2007 under summer flounder alternative 5. In section 3.2.1 it was shown that the total estimated reduction in gross revenue under summer flounder alternative 5, scup alternative 1 and black sea bass alternative 1 is projected to be $9.6842 million (see Table 3). The entire reduction is estimated to be attributable to a decline in summer flounder earnings. No changes in scup or black sea bass revenues are anticipated to occur relative to 2006. Therefore, if it is assumed that this reduction is distributed equally among the 756 vessels estimated to incur summer flounder revenue reductions in 2007 (161 of the 917 vessels that landed summer flounder in 2006 are estimated to incur no revenue reductions in 2007) the average decrease in summer flounder revenue is approximately $12,810 (in 2006 dollars) per vessel.
15
The expected revenue reduction percentiles were also examined relative to a vessel’s home port state as reported on the vessel’s permit application (Table 6). The number of vessels with revenue reductions of 5 percent or more ranged from no vessels in Delaware and New Hampshire to 59 vessels in Rhode Island. For vessels with a home port state of Rhode Island, this represents approximately 40 percent of the total (103 vessels with a valid federal scup, black sea bass, or summer flounder permit and 44 vessels without a valid federal permit to land these species). Of the 63 vessels projected to incur revenue reductions of up to 30-39 percent, the largest majority indicated a home port state of New Jersey (11), Rhode Island (13) and New York (20). Further examination of the vessels impacted by 5 percent or more revealed that more than half (155) hold federal permits for all three species (Table 7). Approximately 15 percent of the vessels with estimated revenue reductions of 5 percent or more do not hold a valid federal permit for any one of the three species. The majority of these vessels, however, do hold permits for other fisheries (Table 8). In particular, more than half of the vessels hold federal permits for multispecies, scallop, lobster, squid/butterfish (incidental), Atlantic mackerel, bluefish, dogfish, tilefish (incidental), herring (non-VMS), skate and monkfish (open access). As a result, these vessels have at least some access to alternative fisheries. Although most of these fisheries are already heavily regulated so replacement activities may be limited. Identification of impacts by home port state likely provides an indication of where the state-level costs of the proposed revenue reductions will be borne. In some cases, however, a vessel’s home port state may not necessarily indicate the state where it conducts the majority of its activity or the state where the crew and captain spend their earnings. Therefore, it is useful to examine impacts by a vessel’s indicated principal port state as well. The number of vessels projected to be impacted by 5 percent or more when categorized according to principal port state is very similar to the home port state results (Table 9). The number of vessels by principal port state is the same in Connecticut (11), Delaware (0), New Hampshire (0) and Maine (3), slightly lower in Massachusetts (40), North Carolina (43), New Jersey (37) and New York (56), and higher in Maryland (4), Rhode Island (66), and especially Virginia (10). The percent of vessels with projected revenue losses of 5 percent or more where home port state was the same as principal port state is also shown in Table 9. The largest vessels (by length) with projected revenue reductions of 5 percent or more are located in Maryland, North Carolina, New Jersey, and Virginia (Table 9). Average gross registered tons and vessel horsepower are also shown in Table 9. Large vessels may have more options than small vessels due to increased range, more horsepower and larger deck space for alternative gear configurations. Large vessels also have high operating costs, however, and require high volumes of landings. The number of vessels with projected revenue reductions of 5 percent or more by home port, home port county and home port state are shown in Table 10. Demographic statistics, employment and wages for these counties are presented in section 6.1 of the RIR/IRFA contained in the 2007 specifications document. Home ports with the highest number of vessels showing revenue reductions of 5 percent or more are in Bristol Massachusetts (New Bedford),
16
Monmouth New Jersey (Belford), New York City New York (New York), Suffolk New York (Montauk) and Washington Rhode Island (Point Judith). 4.2.2 Summer Flounder Alternative 5, Scup Alternative 2, Black Sea Bass Alternative 2 If summer flounder alternative 5, scup alternative 2 and black seas bass alternative 2 are adopted in 2007, 369 vessels (out of a total of 917 vessels that landed these species in 2006) are projected to incur total revenue losses of 5 percent or more (Table 11). Of these 369 vessels, 86 are projected to incur revenue reductions of 5-9 percent, 149 are projected to incur losses of 10-19 percent, 70 are projected to lose 20-29 percent and 64 vessels are projected to lose up to 30-39 percent of their total gross revenue. Approximately 60 percent of the vessels (548) are projected to incur revenue reductions of less than 5 percent. All vessels landings summer flounder, scup or black sea bass will be impacted to some degree in 2007 since reductions in landings will be required under all three alternatives. In section 3.2.2 it was shown that under this combination of alternatives total summer flounder revenue is projected to decline by $9.6842 million, scup revenue by $0.5082 million and black sea bass revenue by $1.22 million. If the projected decrease in summer flounder total ex-vessel revenue is distributed equally among the 756 vessels estimated to incur summer flounder revenue reductions in 2007 the average decrease per vessel is approximately $12,810. If the projected decrease in scup total ex-vessel revenue is distributed equally among the 448 vessels estimated to incur scup revenue reductions in 2007 the average decrease per vessel is approximately $1,145. Finally, if the projected decrease in black sea bass total ex-vessel revenue is distributed equally among the 574 vessels estimated to incur black sea bass revenue reductions in 2007 the average decrease per vessel is approximately $2,125. Average revenue reductions are additive for vessels that land more than one of the regulated species. Thus, for vessels that land all three species the average gross revenue reduction is estimated at $16,080 (in 2006 dollars) per vessel. The expected revenue reduction percentiles were also examined relative to a vessel’s home port state as reported on the vessel’s permit application (Table 12). The number of vessels with revenue reductions of 5 percent or more ranged from no vessels in New Hampshire to 76 vessels in New York. For vessels with a home port state of New York, this represents approximately 55 percent of the total (112 vessels with a valid federal scup, black sea bass, or summer flounder permit and 25 vessels without a valid federal permit to land these species). Of the 64 vessels projected to incur revenue reductions of up to 30-39 percent, the largest majority indicated a home port state of New York (21), Rhode Island (14) and New Jersey (12). Further examination of the vessels impacted by 5 percent or more revealed that almost half (175) hold federal permits for all three species (Table 13). Approximately 17 percent of the vessels (62) with estimated revenue reductions of 5 percent or more do not hold a valid federal permit for any one of the three species. The majority of these vessels, however, do hold permits for other fisheries (Table 14). In particular, more than half of the vessels hold federal permits for multispecies, scallop, lobster, squid/butterfish (incidental), Atlantic mackerel, bluefish, dogfish,

17
tilefish (incidental), herring (non-VMS), skate and monkfish (open access). As a result, these vessels have at least some access to alternative fisheries. Although most of these fisheries are already heavily regulated so replacement activities may be limited. Identification of impacts by home port state likely provides an indication of where the state-level costs of the proposed revenue reductions will be borne. In some cases, however, a vessel’s home port state may not necessarily indicate the state where it conducts the majority of its activity or the state where the crew and captain spend their earnings. Therefore, it is useful to examine impacts by a vessel’s indicated principal port state as well. The number of vessels projected to be impacted by 5 percent or more when categorized according to principal port state is very similar to the home port state results (Table 15). The number of vessels by principal port state is the same in Delaware (4), New Hampshire (0) and Maine (3), slightly lower in Connecticut (11), Massachusetts (60), North Carolina (45), New Jersey (50) and New York (75), and higher in Maryland (10), Rhode Island (77), and especially Virginia (37). The percent of vessels with projected revenue losses of 5 percent or more where home port state was the same as principal port state is also shown in Table 15. The largest vessels (by length) with projected revenue reductions of 5 percent or more are located in Connecticut, Maryland, North Carolina, New Jersey, and Virginia (Table 15). Average gross registered tons and vessel horsepower are also shown in Table 15. Large vessels may have more options than small vessels due to increased range, more horsepower and larger deck space for alternative gear configurations. Large vessels also have high operating costs, however, and require high volumes of landings. The number of vessels with projected revenue reductions of 5 percent or more by home port, home port county and home port state are shown in Table 16. Demographic statistics, employment and wages for these counties are presented in section 6.1 of the RIR/IRFA contained in the 2007 specifications document. Home ports with the highest number of vessels showing revenue reductions of 5 percent or more are in Bristol Massachusetts (New Bedford), Suffolk Massachusetts (Boston), Monmouth New Jersey (Belford), Ocean New Jersey (Pt. Pleasant), New York City New York (New York), Suffolk New York (Montauk), Dare North Carolina (Wanchese) and Washington Rhode Island (Point Judith). 4.2.3 Summer Flounder Alternative 5, Scup Alternative 3, Black Sea Bass Alternative 3 The combined distributional effects associated with summer flounder alternative 5, scup alternative 3 and black sea bass alternative 3 are identical to those determined in section 4.2.1 under summer flounder alternative 5, scup alternative 1 and black sea bass alternative 1 (Table’s 5-10). No change in scup or black sea bass revenues are projected to occur relative to 2006 in both alternative’s 1 and 3 for scup and black sea bass so the estimated revenue reductions under both sets of alternatives are solely attributable to the reduction in the TAL under summer flounder alternative 5. The basis for assuming scup and black sea bass revenues will not be restricted under alternative’s 1 and 3 is discussed in section 3.2.1. 4.2.4 Summer Flounder Alternative 6, Scup Alternative 1, Black Sea Bass Alternative 1

18
If summer flounder alternative 6, scup alternative 1 and black seas bass alternative 1 are adopted in 2007, 285 vessels (out of a total of 917 vessels that landed these species in 2006) are projected to incur total revenue losses of 5 percent or more (Table 17). Of these 285 vessels, 63 are projected to incur revenue reductions of 5-9 percent, 88 are projected to incur losses of 10-19 percent, 57 are projected to lose 20-29 percent, 46 are projected to lose 30-39 percent and 31 vessels are projected to lose up to 40-49 percent of their total gross revenue. Approximately 69 percent of the vessels (632) are projected to incur revenue reductions of less than 5 percent, with 161 of these vessels estimated to incur no revenue reductions because only scup and/or black sea bass was landed. Scup and black sea bass landings in 2007 are predicted to remain the same as in 2006 under these alternatives. All vessels with summer flounder landings are projected to incur revenue reductions in 2007 under summer flounder alternative 6. In section 3.2.4 it was shown that the total estimated reduction in gross revenue under summer flounder alternative 6, scup alternative 1 and black sea bass alternative 1 is projected to be $10.8033 million (see Table 3). The entire reduction is estimated to be attributable to a decline in summer flounder earnings. No changes in scup or black sea bass revenues are anticipated to occur relative to 2006. Therefore, if it is assumed that this reduction is distributed equally among the 756 vessels estimated to incur summer flounder revenue reductions in 2007 (161 of the 917 vessels that landed summer flounder in 2006 are estimated to incur no revenue reductions in 2007) the average decrease in summer flounder revenue is approximately $14,290 (in 2006 dollars) per vessel. The expected revenue reduction percentiles were also examined relative to a vessel’s home port state as reported on the vessel’s permit application (Table 18). The number of vessels with revenue reductions of 5 percent or more ranged from no vessels in Delaware and New Hampshire to 61 vessels in Rhode Island. For vessels with a home port state of Rhode Island, this represents approximately 42 percent of the total (103 vessels with a valid federal scup, black sea bass, or summer flounder permit and 44 vessels without a valid federal permit to land these species). Vessels projected to incur the largest percentage revenue reductions (40-49 %) indicated home port states of Massachusetts (4), North Carolina (1), New Jersey (8), New York (9) and Rhode Island (8). Further examination of the vessels impacted by 5 percent or more revealed that more than half (163) hold federal permits for all three species (Table 19). Approximately 15 percent of the vessels with estimated revenue reductions of 5 percent or more do not hold a valid federal permit for any one of the three species. The majority of these vessels, however, do hold permits for other fisheries (Table 20). In particular, more than half of the vessels hold federal permits for multispecies, surfclam, scallop, lobster, squid/butterfish (incidental), Atlantic mackerel, bluefish, dogfish, tilefish (incidental), herring (non-VMS), skate and monkfish (open access). As a result, these vessels have at least some access to alternative fisheries. Although most of these fisheries are already heavily regulated so summer flounder replacement activities may be limited. Identification of impacts by home port state likely provides an indication of where the state-level costs of the proposed revenue reductions will be borne. In some cases, however, a vessel’s home port state may not necessarily indicate the state where it conducts the majority of its activity or the state where the crew and captain spend their earnings. Therefore, it is useful to examine

19
impacts by a vessel’s indicated principal port state as well. The number of vessels projected to be impacted by 5 percent or more when categorized according to principal port state is very similar to the home port state results (Table 21). The number of vessels by principal port state is the same in Connecticut (11), Delaware (0), New Hampshire (0) and Maine (3), slightly lower in Massachusetts (40), North Carolina (44), New Jersey (38) and New York (58), and higher in Maryland (4), Rhode Island (68), and especially Virginia (12). The percent of vessels with projected revenue losses of 5 percent or more where home port state was the same as principal port state is also shown in Table 21. The largest vessels (by length) with projected revenue reductions of 5 percent or more are located in Maryland, North Carolina, New Jersey, and Virginia (Table 21). Average gross registered tons and vessel horsepower are also shown in Table 21. Large vessels may have more options than small vessels due to increased range, more horsepower and larger deck space for alternative gear configurations. Large vessels also have high operating costs, however, and require high volumes of landings. The number of vessels with projected revenue reductions of 5 percent or more by home port, home port county and home port state are shown in Table 22. Demographic statistics, employment and wages for these counties are presented in section 6.1 of the RIR/IRFA contained in the 2007 specifications document. Home ports with the highest number of vessels showing revenue reductions of 5 percent or more are in Bristol Massachusetts (New Bedford), Monmouth New Jersey (Belford), New York City New York (New York), Suffolk New York (Montauk) and Washington Rhode Island (Point Judith). 4.2.5 Summer Flounder Alternative 6, Scup Alternative 2, Black Sea Bass Alternative 2 If summer flounder alternative 6, scup alternative 2 and black seas bass alternative 2 are adopted in 2007, 375 vessels (out of a total of 917 vessels that landed these species in 2006) are projected to incur total revenue losses of 5 percent or more (Table 23). Of these 375 vessels, 83 are projected to incur revenue reductions of 5-9 percent, 145 are projected to incur losses of 10-19 percent, 64 are projected to lose 20-29 percent, 52 are projected to losses of 30-39 percent and 31 vessels are projected to lose up to 40-49 percent of their total gross revenue. Approximately 59 percent of the vessels (542) are projected to incur revenue reductions of less than 5 percent. All vessels landings summer flounder, scup or black sea bass will be impacted to some degree in 2007 since reductions in landings will be required under all three alternatives. In section 3.2.5 it was shown that under this combination of alternatives total summer flounder revenue is projected to decline by $10.8035 million, scup revenue by $0.5082 million and black sea bass revenue by $1.22 million (see Table 3). If the projected decrease in summer flounder total ex-vessel revenue is distributed equally among the 756 vessels estimated to incur summer flounder revenue reductions in 2007 the average decrease per vessel is approximately $14,290. If the projected decrease in scup total ex-vessel revenue is distributed equally among the 448 vessels estimated to incur scup revenue reductions in 2007 the average decrease per vessel is approximately $1,145. Finally, if the projected decrease in black sea bass total ex-vessel revenue is distributed equally among the 574 vessels estimated to incur black sea bass revenue reductions in 2007 the average decrease per vessel is approximately $2,125. Average revenue reductions

20
are additive for vessels that land more than one of the regulated species. Thus, for vessels that land all three species the average gross revenue reduction is estimated at $17,560 (in 2006 dollars) per vessel. The expected revenue reduction percentiles were also examined relative to a vessel’s home port state as reported on the vessel’s permit application (Table 24). The number of vessels with revenue reductions of 5 percent or more ranged from no vessels in New Hampshire to 77 vessels in New York. For vessels with a home port state of New York, this represents approximately 56 percent of the total (112 vessels with a valid federal scup, black sea bass, or summer flounder permit and 25 vessels without a valid federal permit to land these species). Vessels projected to incur the largest percentage revenue reductions (40-49 %) indicated home port states of Massachusetts (4), North Carolina (1), New Jersey (8), New York (9) and Rhode Island (8). Further examination of the vessels impacted by 5 percent or more revealed that almost half (179) hold federal permits for all three species (Table 25). Approximately 17 percent of the vessels (64) with estimated revenue reductions of 5 percent or more do not hold a valid federal permit for any one of the three species. The majority of these vessels, however, do hold permits for other fisheries (Table 26). In particular, more than half of the vessels hold federal permits for multispecies, scallop, lobster, squid/butterfish (incidental), Atlantic mackerel, bluefish, dogfish, tilefish (incidental), herring (non-VMS), skate and monkfish (open access). As a result, these vessels have at least some access to alternative fisheries. Although most of these fisheries are already heavily regulated so replacement activities may be limited. Identification of impacts by home port state likely provides an indication of where the state-level costs of the proposed revenue reductions will be borne. In some cases, however, a vessel’s home port state may not necessarily indicate the state where it conducts the majority of its activity or the state where the crew and captain spend their earnings. Therefore, it is useful to examine impacts by a vessel’s indicated principal port state as well. The number of vessels projected to be impacted by 5 percent or more when categorized according to principal port state is very similar to the home port state results (Table 27). The number of vessels by principal port state is the same in Delaware (4), New Hampshire (0) and Maine (3), slightly lower in Connecticut (11), Massachusetts (60), North Carolina (45), New Jersey (50) and New York (76), and higher in Maryland (10), Rhode Island (79), and Virginia (29). The percent of vessels with projected revenue losses of 5 percent or more where home port state was the same as principal port state is also shown in Table 27. The largest vessels (by length) with projected revenue reductions of 5 percent or more are located in Connecticut, Maryland, North Carolina, and Virginia (Table 27). Average gross registered tons and vessel horsepower are also shown in Table 27. Large vessels may have more options than small vessels due to increased range, more horsepower and larger deck space for alternative gear configurations. Large vessels also have high operating costs, however, and require high volumes of landings. The number of vessels with projected revenue reductions of 5 percent or more by home port, home port county and home port state are shown in Table 28. Demographic statistics, employment and wages for these counties are presented in section 6.1 of the RIR/IRFA
21
contained in the 2007 specifications document. Home ports with the highest number of vessels showing revenue reductions of 5 percent or more are in Bristol Massachusetts (New Bedford), Suffolk Massachusetts (Boston), Monmouth New Jersey (Belford), Ocean New Jersey (Pt. Pleasant), New York City New York (New York), Suffolk New York (Montauk), Dare North Carolina (Wanchese) and Washington Rhode Island (Point Judith). 4.2.6 Summer Flounder Alternative 6, Scup Alternative 3, Black Sea Bass Alternative 3 The combined distributional effects associated with summer flounder alternative 6, scup alternative 3 and black sea bass alternative 3 are identical to those determined in section 4.2.4 under summer flounder alternative 6, scup alternative 1 and black sea bass alternative 1 (Table’s 17-22). No change in scup or black sea bass revenues are projected to occur relative to 2006 in both alternative’s 1 and 3 for scup and black sea bass so the estimated revenue reductions under both sets of alternatives are solely attributable to the reduction in the TAL under summer flounder alternative 6. The basis for assuming scup and black sea bass revenues will not be restricted under alternative’s 1 and 3 is discussed in section 3.2.4. 4.3 Summary of Commercial Fishing Impact Of the two summer flounder alternatives analyzed in this assessment, implementation of summer flounder alternative 5 would result in the lowest projected average reduction in ex-vessel revenue per vessel in 2007 ($12,810 per vessel). The average revenue reduction per vessel associated with summer flounder alternative 6 is estimated to be approximately 12 percent higher ($14,290). No change in scup or black sea bass landings are projected to occur in 2007, relative to 2006, under both alternative’s 1 and 3 so vessel revenues for these species are not projected to change in 2007. The average revenue reduction per vessel under scup alternative 2 is estimated to be $1,145 and the average reduction under black sea bass alternative 2 is projected to be $2,125 per vessel. If summer flounder alternative 5 is combined with alternative’s 1 or 3 for scup and black sea bass, approximately 37 percent of the 756 vessels landing summer flounder are projected to incur an average total revenue reduction (from all harvesting activities) of 5 percent or more in 2007 when compared to 2006 levels (Table 5). The reduction is projected to approach 30-39 percent for approximately 8 percent of these vessels. No reduction in revenue is projected to occur for vessels that only land scup and/or black sea bass. If summer flounder alternative 5 is combined with scup alternative 2 and black sea bass alternative 2, approximately 40 percent of the 917 vessels landing summer flounder, scup, or black sea bass are projected in incur an average total revenue reduction of 5 percent or more in 2007 (Table 11). Approximately 7 percent of these vessels are estimated to incur a total reduction in revenue of up to 30-39 percent. Relative changes in total revenue per vessel are slightly higher under the combinations of alternatives that include summer flounder alternative 6. If summer flounder alternative 6 is combined with alternative’s 1 or 3 for scup and black sea bass, it is estimated that approximately 38 percent of the 756 vessels landings summer flounder are projected to incur an average total revenue reduction of 5 percent or more in 2007 (Table 17). For approximately 10 percent of these vessels, the total revenue reduction is projected to approach 30-49 percent in 2007. When

22
summer flounder alternative 6 is combined with scup alternative 2 and black sea bass alternative 2, approximately 41 percent of the 917 vessels landings summer flounder, scup, or black sea bass are projected to incur an average total revenue reduction of 5 percent or more in 2007 (Table 23). Nearly 11 percent of these vessels are estimated to incur a total reduction in revenue of up to 30-49 percent. According to home port state and principal port state, the states of Massachusetts, North Carolina, New Jersey, New York and Rhode Island have the largest proportion of vessels estimated to be impacted by the proposed alternatives. Home ports with the highest number of vessels showing revenue reductions of 5 percent or more under the alternatives are in Bristol Massachusetts (New Bedford), Suffolk Massachusetts (Boston), Monmouth New Jersey (Belford), Ocean New Jersey (Pt. Pleasant), New York City New York (New York), Suffolk New York (Montauk), Dare North Carolina (Wanchese) and Washington Rhode Island (Point Judith). However, vessels in many other ports in all of the coastal states in the Northeast Region are also projected to be impacted by the proposed alternatives. Overall, because at least 37 percent of the vessels that land summer flounder, scup, and/or black sea bass are projected to lose 5 percent or more their total commercial fishing revenue in 2007 (when compared to 2006) and up to 11 percent of the vessels are estimated to incur a total reduction upwards of 30-49 percent, implementation of any one of the combinations of alternatives shown in this analysis will have a significant adverse impact on commercial harvesters that fish for these species. Vessel-level reductions in revenue would be even greater if the cumulative effect from the decrease in earnings from 2005 to 2006 (caused by a 22% reduction in the commercial summer flounder TAL) was considered along with the projected reductions from 2006 to 2007. 4.4 Recreational Fishing Impacts The preliminary adjusted recreational harvest limit under summer flounder alternative 5 (5.4925 million lbs) is approximately 45 percent lower than estimated landings in 2005 (10.02 million lbs). The preliminary adjusted recreational harvest limit under summer flounder alternative 6 (5.0374 million lbs) is approximately 50 percent lower than estimated landings in 2005. Recreational landings of summer flounder have fluctuated over the years, so it is possible that landings in 2006 could be lower than in 2005. However, over the past 5 years (2001-2005) summer flounder landings averaged 10.44 million pounds. Assuming recreational landings of summer flounder in 2006 approach this level, substantial reductions in landings will be required under either alternative in 2007. Information regarding summer flounder trends in recreational catch and effort is discussed in the 2007 specifications document. As indicated in section 1.0, a comprehensive economic assessment of the proposed recreational alternatives will be prepared after the Mid-Atlantic Fishery Management Council and the Atlantic States Marine Fisheries Commission’s Summer Flounder, Scup and Black Sea Bass Board submit recommendations for the 2007 measures in December. Nonetheless, given the magnitude of the proposed summer flounder quota reductions evaluated in this analysis, it is clear that for-hire businesses that target summer flounder may be adversely affected. For-hire businesses, particularly vessels that operate as “party boats” that rely on customers fishing for

23
summer flounder for food, may be faced with reductions in income if anglers reduce their effort in response to more restrictive management measures. In 2005, approximately 385 thousand anglers fishing aboard for-hire boats were estimated to be targeting summer flounder (Marine Recreational Fisheries Statistics Survey data). Applying the estimated average access fee paid by party/charter anglers in the Northeast region in 2005 ($40.27)1 results in estimated summer flounder revenue of approximately $15.5 million. Although it is difficult to determine how sensitive the “affected” anglers will be to more restrictive summer flounder size and/or possession limits in 2007, and therefore the magnitude of any associated for-hire revenue reduction, the potential exists for substantial reductions in for-hire business revenue under these alternatives. Further assessments contained in the recreational specifications package, which will be developed after the December Council meeting, should help clarify the extent of the impacts on for-hire businesses.
1 Average party/charter access fee obtained from Steinback and Gentner (2001) and adjusted to its 2005 equivalent using the Bureau of Labor Statistic’s Consumer Price Index.

24
REFERENCES Minnesota IMPLAN Group, Inc., 2003 IMPLAN System (data and software), 1725 Tower Drive West, Suite 140, Stillwater, MN 55082 www.implan.com. Steinback S.R. and B. Gentner 2001. Marine angler expenditures in the Northeast region, 1998. U.S. Department of Commerce, NOAA Technical Memorandum NMFS-F/SPO-47. Terceiro M. 2006 (September). Draft summer flounder assessment and biological reference point update for 2006.

25
Table 1. Initial and adjusted quota levels (in million lbs) for the proposed 2007 summer flounder, scup and black sea bass alternatives.
Initial
TAL Research Set-Aside
Commercial Quota
Overage
Preliminary Adjusted
Commercial Quota*
Preliminary Recreational
Harvest Limit
Alternative 1 (Preferred) 19.90 0.567 0.05 11.60 7.73
Alternative 2 (Most Restrictive) 5.22 0.157 0.05 3.04 2.03
Alternative 3 (Least Restrictive / Status Quo)
23.59 0.567 0.05 13.81 9.21
Alternative 4 (No Action)
Alternative 5 14.156 0.4247 0.05 8.2088 5.4925
Summer Flounder
Alternative 6 12.983 0.3895 0.05 7.5261 5.0374
Alternative 1 (Preferred) 16.00 0.480 0 11.93 3.59
Alternative 2 (Most Restrictive) 12.00 0.360 0 8.90 2.74
Alternative 3 Least Restrictive / Status Quo)
16.27 0.488 0 12.13 3.65 Scup
Alternative 4 (No Action)
Alternative 1 (Preferred) 6.50 0.132 0 3.12 3.25
Alternative 2 (Most Restrictive) 5.00 0.132 0 2.39 2.48
Alternative 3 (Least Restrictive / Status Quo)
8.00 0.132 0 3.86 4.01
Black Sea Bass
Alternative 4 (No Action)
*Note that preliminary quotas are provisional and may change to account for overages according to the quota counting procedures outlined in the 2007 Specifications document.
26
Table 2. Combinations of alternatives examined in this assessment Combinations of Alternatives
1) Summer Flounder Alternative 5, Scup Alternative 1, Black Sea Bass Alternative 1
2) Summer Flounder Alternative 5, Scup Alternative 2, Black Sea Bass Alternative 2
3) Summer Flounder Alternative 5, Scup Alternative 3, Black Sea Bass Alternative 3
4) Summer Flounder Alternative 6, Scup Alternative 1, Black Sea Bass Alternative 1
5) Summer Flounder Alternative 6, Scup Alternative 2, Black Sea Bass Alternative 2
6) Summer Flounder Alternative 6, Scup Alternative 3, Black Sea Bass Alternative 3

27
Table 3. Gross revenue comparisons of the proposed 2007 alternatives relative to the 2006 baseline. “FLK” is summer flounder, “BSB” is black sea bass, and “SCP” is scup.
Combinations of Alternatives
Estimated 2007 Revenues (in 2006
dollars)
Change from Projected 2006
Baseline Revenues
Percent Change from Projected 2006 Baseline Revenues
($ millions) FLK 5 $15.2684 $-9.6842 -38.81% SCP 1 $7.3612 $0 0% BSB 1 $7.436 $0 0% Total $30.0656 $-9.6842 -24.36% FLK 5 $15.2684 $-9.6842 -38.81% SCP 2 $6.853 $-.5082 -6.90% BSB 2 $6.214 $-1.22 -16.43% Total $28.3354 $-11.4142 -28.72% FLK 5 $15.2684 $-9.6842 -38.81% SCP 3 $7.3612 $0 0% BSB 3 $7.436 $0 0% Total $30.0656 $-9.6842 -24.36% FLK 6 $14.1491 $-10.8035 -43.3% SCP 1 $7.3612 $0 0% BSB 1 $7.436 $0 0% Total $28.9463 $-10.8033 -27.18% FLK 6 $14.1491 $-10.8035 -43.3% SCP 2 $6.853 $-.5082 -6.90% BSB 2 $6.214 $-1.222 -16.43% Total $27.2161 $-12.5335 -31.53% FLK 6 $14.1491 $-10.8035 -43.3% SCP 3 $7.3612 $0 0% BSB 3 $7.436 $0 0% Total $28.9463 $-10.8033 -27.18%
28
Table 4. Numbers of vessels landings scup, black sea bass and/or summer flounder in 2005.
Landings Class
Landings Combinations
Commercial Vessels (#)
1 Scup Only 13
2 Black Sea Bass Only 85
3 Summer Flounder Only 304
4 Scup/Black Sea Bass 63
5 Scup/Summer Flounder 26
6 Black Sea Bass/Summer Flounder 80
7 Scup/Black Sea Bass/Summer Flounder 346
Total 917
Source: Northeast Region dealer weighout data.
29
Table 5. Analysis of revenue impacts for participating vessels associated with the 2007 combined summer flounder, scup, and black sea bass quota under summer flounder alternative 5, black sea bass alternative 1 (preferred) and scup alternative 1 (preferred). “FLK” is summer flounder, “BSB” is black sea bass, and “SCP” is scup.
Fluke Alternative 5, BSB Alternative 1 (Preferred) and Scup Alternative 1 (Preferred)
Number of Impacted Vessels by Reduction Percentile (%)
Class Landings Combination
Total Active Vessels
Number of Vessels
Impacted by > 5%
Reduction
No Change in Revenue (number)
<5 5-9 10-19 20-29 30-39 40-49 ≥50
1 SCP Only 13 0 13 13 0 0 0 0 0 0
2 BSB Only 85 0 85 85 0 0 0 0 0 0
3 FLK Only 304 46 0 258 12 9 3 22 0 0
4 SCP/BSB 63 0 63 63 0 0 0 0 0 0
5 SCP/FLK 26 11 0 15 1 1 2 7 0 0
6 BSB/FLK 80 30 0 50 3 18 4 5 0 0
7 SCP/BSB/FLK 346 189 0 157 48 67 45 29 0 0
Totals 917 276 161 641 64 95 54 63 0 0

30
Table 6. Revenue impacts of the combined summer flounder alternative 5, scup alternative 1 (preferred) and black sea bass alternative 1 (preferred) quotas, by home port state.
Total Active Vessels Number of Impacted Vessels by Reduction Percentile (percent)
State Vessels with Valid Federal Scup, BSB, or Fluke Permit
Vessels without Valid Federal Scup, BSB, or Fluke Permit
Number of Vessels
Impacted >5 percent
No Change in Revenue(number) <5 5-9 10-19 20-29 30-39 40-49 ≥50
CT 15 9 11 4 13 1 5 2 3 0 0 DE 7 0 0 3 7 0 0 0 0 0 0 NH 1 1 0 0 2 0 0 0 0 0 0 MA 160 75 44 61 191 15 11 11 7 0 0 MD 10 4 3 0 11 0 0 3 0 0 0 ME 3 9 3 0 9 0 2 0 1 0 0 NC 87 21 47 10 61 15 25 2 5 0 0 NJ 110 43 39 11 114 3 12 13 11 0 0 NY 112 25 58 32 79 10 20 8 20 0 0 RI 103 44 59 22 88 16 16 14 13 0 0 VA 50 3 6 14 47 2 4 0 0 0 0
OTHERa 3 6 0 1 9 0 0 0 0 0 0 NOT
KNOWNb 0 16 6 3 10 2 0 1 3 0 0
Total 661 256 276 161 641 64 95 54 63 0 0 aHome port state provided on permit application was not in the Northeast Region. bNo home port state indicated on permit application.

31
Table 7. Combinations of 2005 summer flounder (FLK), scup (SCP) and black sea bass (BSB) permits held by commercial vessels projected to have revenue reductions in the 5% or more range under summer flounder alternative 5, scup alternative 1 (preferred) and black sea bass alternative 1 (preferred).
All 3 FLK only
BSB only
SCP only
SCP/ BSB
SCP/ FLK
BSB/ FLK None*
Commercial 155 19 4 2 9 26 10 42 * “None” indicates no summer flounder, scup, or black sea bass permit held, and not necessarily no commercial permits held.

32
Table 8. Other 2005 permits held by the vessels projected to have revenue reductions in the 5 percent or more range under summer flounder alternative 5, scup alternative 1 (preferred) and black sea bass alternative 1 (preferred).
Northeast Region Permit Status
Number ofVessels
Percent of Permitted
Vessels
Multispecies 257 93 Surfclam 138 50 Scallop 234 85 Lobster, trap gear 151 52 Lobster, non-trap gear 148 54 Squid/Butterfish (Limited Access) 134 49 Squid/Butterfish (Incidental) 150 54 Atlantic Mackerel 188 68 Quahog 129 47 Bluefish 246 89 Dogfish 223 81 Tilefish Incidental 179 65 Herring VMS 3 1 Herring non-VMS 190 69 Atl. Deep-Sea Red Crab (Incidental) 118 43 Skate 212 77 Monkfish (Limited Access) 58 21
Commercial
Monkfish (Open Access) 166 60 Multispecies 4 2 Squid/Mackerel/Butterfish 7 3 Bluefish 13 5 Black Sea Bass 9 3 Summer Flounder 10 4
Recreational
Scup 8 3

33
Table 9. Descriptive information for the commercial vessels showing revenue reductions in the 5 percent or more range (in 2007) under summer flounder alternative 5, scup alternative 1 (preferred) and black sea bass alternative 1 (preferred).
CT DE NH MA MD ME NC NJ NY RI VA Other
# of Vessels by Principal Port State 11 0 0 40 4 3 43 37 56 66 10 6
% of Vessels where Home Port State = Principal Port State 91 NA NA 89 100 100 83 82 91 100 50 NA
Avg. Length in Feet by Principal Port State 49 NA NA 45 58 38 72 51 46 48 75 NA
Avg. GRT by Principal Port State 47 NA NA 40 40 20 105 48 39 44 110 NA
Avg. Vessel Horsepower 302 NA NA 272 405 317 482 343 365 342 418 NA

34
Table 10. Distribution of commercial vessels showing revenue reductions in the 5 percent or more range under summer flounder alternative 5, scup alternative 1 (preferred) and black sea bass alternative 1 (preferred) – counties and/or home ports with fewer than 3 vessels are not reported.
State County Home port Number of Vessels
Stonington 6 Connecticut New London Other 5
Maine Other Other 3
Maryland Worcester Ocean City 3
Barnstable Other 6
Fairhaven 3 Bristol
New Bedford 13
Dukes Other 4
Plymouth 3 Plymouth
Other 6
Massachusetts
Suffolk Boston 8
Cape May 5 Cape May
Other 5
Monmouth Belford 15
Pt. Pleasant 6
New Jersey
Ocean Other 5
Freeport 3 Nassau
Other 3
New York City New York 16
Hampton Bays 3
Montauk 21
Shinnecock 7
New York
Suffolk
Other 5
35
Table 10 (Continued). Distribution of commercial vessels showing revenue reductions in the 5 percent or more range under summer flounder alternative 5, scup alternative 1 (preferred) and black sea bass alternative 1 (preferred) – counties and/or home ports with fewer than 3 vessels are not reported.
State County Home port Number of Vessels
Beaufort Belhaven 5
Carteret Beaufort 9
Dare Wanchese 8
Englehard 3 Hyde
Other 4
Bayboro 3
Oriental 8
North Carolina
Pamlico
Other 3
Newport 6
Sakonnet Point 4 Newport
Other 3
Narragansett 6
Point Judith 31
Wakefield 3
Rhode Island
Washington
Other 5
Virginia City of Norfolk Norfolk 4

36
Table 11. Analysis of revenue impacts for active vessels associated with the 2007 combined summer flounder, scup, and black sea bass quota under summer flounder alternative 5, black sea bass alternative 2 (preferred) and scup alternative 2 (preferred). “FLK” is summer flounder, “BSB” is black sea bass, and “SCP” is scup.
Fluke Alternative 5, BSB Alternative 2 (Preferred) and Scup Alternative 2 (Preferred)
Number of Impacted Vessels by Reduction Percentile (%)
Class Landings Combination
Total Active Vessels
Number of Vessels
Impacted by > 5%
Reduction
No Change in Revenue (number)
<5 5-9 10-19 20-29 30-39 40-49 ≥50
1 SCP Only 13 5 0 8 5 0 0 0 0 0
2 BSB Only 85 33 0 52 5 28 0 0 0 0
3 FLK Only 304 46 0 258 12 9 3 22 0 0
4 SCP/BSB 63 25 0 38 12 13 0 0 0 0
5 SCP/FLK 26 13 0 13 3 1 2 7 0 0
6 BSB/FLK 80 42 0 38 5 26 6 5 0 0
7 SCP/BSB/FLK 346 205 0 141 44 72 59 30 0 0
Totals 917 369 0 548 86 149 70 64 0 0

37
Table 12. Revenue impacts of the combined summer flounder alternative 5, scup alternative 2 (preferred) and black sea bass alternative 2 (preferred) quotas, by home port state.
Total Active Vessels Number of Impacted Vessels by Reduction Percentile (percent)
State Vessels with Valid Federal Scup, BSB, or Fluke Permit
Vessels without Valid Federal Scup, BSB, or Fluke Permit
Number of Vessels
Impacted >5 percent
No Change in Revenue(number) <5 5-9 10-19 20-29 30-39 40-49 ≥50
CT 15 9 13 0 11 2 6 2 3 0 0 DE 7 0 4 0 3 1 3 0 0 0 0 NH 1 1 0 0 2 0 0 0 0 0 0 MA 160 75 65 0 170 24 20 13 8 0 0 MD 10 4 9 0 5 2 4 3 0 0 0 ME 3 9 3 0 9 0 2 0 1 0 0 NC 87 21 52 0 56 14 30 3 5 0 0 NJ 110 43 51 0 102 4 19 16 12 0 0 NY 112 25 76 0 61 20 23 12 21 0 0 RI 103 44 68 0 79 14 22 18 14 0 0 VA 50 3 20 0 33 2 18 0 0 0 0
OTHERa 3 6 1 0 8 0 1 0 0 0 0 NOT
KNOWNb 0 16 7 0 9 3 1 3 0 0 0
Total 661 256 369 0 548 86 149 70 64 0 0 aHome port state provided on permit application was not in the Northeast Region. bNo home port state indicated on permit application.

38
Table 13. Combinations of 2005 summer flounder (FLK), scup (SCP) and black sea bass (BSB) permits held by commercial vessels projected to have revenue reductions in the 5% or more range under summer flounder alternative 5, scup alternative 2 (preferred) and black sea bass alternative 2 (preferred).
All 3 FLK only
BSB only
SCP only
SCP/ BSB
SCP/ FLK
BSB/ FLK None*
Commercial 175 19 31 2 27 27 12 62 * “None” indicates no summer flounder, scup, or black sea bass permit held, and not necessarily no commercial permits held.
39
Table 14. Other 2005 permits held by the vessels projected to have revenue reductions in the 5 percent or more range under summer flounder alternative 5, scup alternative 2 (preferred) and black sea bass alternative 2 (preferred).
Northeast Region Permit Status
Number ofVessels
Percent of Permitted
Vessels
Multispecies 345 94 Surfclam 160 43 Scallop 287 78 Lobster, trap gear 215 58 Lobster, non-trap gear 157 43 Squid/Butterfish (Limited Access) 144 39 Squid/Butterfish (Incidental) 196 53 Atlantic Mackerel 251 68 Quahog 150 41 Bluefish 328 89 Dogfish 291 79 Tilefish Incidental 235 64 Herring VMS 4 1 Herring non-VMS 240 65 Atl. Deep-Sea Red Crab (Incidental) 156 42 Skate 266 72 Monkfish (Limited Access) 62 17
Commercial
Monkfish (Open Access) 226 61 Multispecies 15 4 Squid/Mackerel/Butterfish 18 5 Bluefish 29 8 Black Sea Bass 22 6 Summer Flounder 23 6
Recreational
Scup 19 5

40
Table 15. Descriptive information for the commercial vessels showing revenue reductions in the 5 percent or more range (in 2007) under summer flounder alternative 5, scup alternative 2 (preferred) and black sea bass alternative 2 (preferred).
CT DE NH MA MD ME NC NJ NY RI VA Other
# of Vessels by Principal Port State 11 4 0 60 10 3 45 50 75 77 37 7
% of Vessels where Home Port State = Principal Port State 10 4 NA 58 9 3 41 44 71 68 17 NA
Avg. Length in Feet by Principal Port State 49 41 NA 40 51 38 71 49 43 48 52 NA
Avg. GRT by Principal Port State 47 20 NA 30 31 20 104 43 33 43 56 NA
Avg. Vessel Horsepower 302 426 NA 269 391 317 476 345 345 349 460 NA

41
Table 16. Distribution of commercial vessels showing revenue reductions in the 5 percent or more range under summer flounder alternative 5, scup alternative 2 (preferred) and black sea bass alternative 2 (preferred) – counties and/or home ports with fewer than 3 vessels are not reported.
State County Home port Number of Vessels
Stonington 6 Connecticut New London Other 7
Maine Other Other 3
Maryland Worcester Ocean City 8
Falmouth 3
Chatham 3 Barnstable
Other 9
Fairhaven 4
New Bedford 13 Bristol
Other 3
Nantucket 3 Dukes
Other 3
Plymouth 4 Plymouth
Other 9
Massachusetts
Suffolk Boston 12
Atlantic Other 3
Cape May 8
Sea Isle City 3 Cape May
Other 3
Belford 15 Monmouth
Other 3
Pt. Pleasant 10
New Jersey
Ocean Other 5

42
Table 16 (Continued). Distribution of commercial vessels showing revenue reductions in the 5 percent or more range under summer flounder alternative 5, scup alternative 2 (preferred) and black sea bass alternative 2 (preferred) – counties and/or home ports with fewer than 3 vessels are not reported.
State County Home port Number of Vessels
Freeport 3 Nassau
Other 5
New York City New York 20
Hampton Bays 3
Montauk 29
Shinnecock 7
New York
Suffolk
Other 8
Beaufort Belhaven 5
Carteret Beaufort 9
Dare Wanchese 11
Englehard 3 Hyde
Other 4
Bayboro 3
Oriental 9
North Carolina
Pamlico
Other 3
Newport 7
Sakonnet Point 5 Newport
Other 3
Narragansett 7
Point Judith 36
Wakefield 4
Rhode Island
Washington
Other 5
City of Norfolk Norfolk 7 Virginia
Accomack Other 3
43
Table 17. Analysis of revenue impacts for participating vessels associated with the 2007 combined summer flounder, scup, and black sea bass quota under summer flounder alternative 6, black sea bass alternative 1 (preferred) and scup alternative 1 (preferred). “FLK” is summer flounder, “BSB” is black sea bass, and “SCP” is scup.
Fluke Alternative 6, BSB Alternative 1 (Preferred) and Scup Alternative 1 (Preferred)
Number of Impacted Vessels by Reduction Percentile (%)
Class Landings Combination
Total Active Vessels
Number of Vessels
Impacted by > 5%
Reduction
No Change in Revenue (number)
<5 5-9 10-19 20-29 30-39 40-49 ≥50
1 SCP Only 13 0 13 13 0 0 0 0 0 0
2 BSB Only 85 0 85 85 0 0 0 0 0 0
3 FLK Only 304 47 0 257 12 9 4 7 15 0
4 SCP/BSB 63 0 63 63 0 0 0 0 0 0
5 SCP/FLK 26 11 0 15 1 1 2 5 2 0
6 BSB/FLK 80 31 0 49 4 16 5 4 2 0
7 SCP/BSB/FLK 346 196 0 150 46 62 46 30 12 0
Totals 917 285 161 632 63 88 57 46 31 0

44
Table 18. Revenue impacts of the combined summer flounder alternative 6, scup alternative 1 (preferred) and black sea bass alternative 1 (preferred) quotas, by home port state.
Total Active Vessels Number of Impacted Vessels by Reduction Percentile (percent)
State Vessels with Valid Federal Scup, BSB, or Fluke Permit
Vessels without Valid Federal Scup, BSB, or Fluke Permit
Number of Vessels
Impacted >5 percent
No Change in Revenue(number) <5 5-9 10-19 20-29 30-39 40-49 ≥50
CT 15 9 11 4 13 1 5 2 3 0 0 DE 7 0 0 3 7 0 0 0 0 0 0 NH 1 1 0 0 2 0 0 0 0 0 0 MA 160 75 44 61 191 12 11 13 4 4 0 MD 10 4 3 0 11 0 0 2 1 0 0 ME 3 9 3 0 9 0 2 0 1 0 0 NC 87 21 49 10 59 17 20 7 4 1 0 NJ 110 43 40 11 113 3 10 11 8 8 0 NY 112 25 60 32 77 10 19 10 12 9 0 RI 103 44 61 22 86 14 17 11 11 8 0 VA 50 3 7 14 46 3 4 0 0 0 0
OTHERa 3 6 0 1 9 0 0 0 0 0 0 NOT
KNOWNb 0 16 7 3 9 3 0 1 2 1 0
Total 661 256 285 161 632 63 88 57 46 31 0 aHome port state provided on permit application was not in the Northeast Region. bNo home port state indicated on permit application.
45
Table 19. Combinations of 2005 summer flounder (FLK), scup (SCP) and black sea bass (BSB) permits held by commercial vessels projected to have revenue reductions in the 5% or more range under summer flounder alternative 6, scup alternative 1 (preferred) and black sea bass alternative 1 (preferred).
All 3 FLK only
BSB only
SCP Only
SCP/ BSB
SCP/ FLK
BSB/ FLK None*
Commercial 163 19 4 2 9 26 10 44 * “None” indicates no summer flounder, scup, or black sea bass permit held, and not necessarily no commercial permits held.
46
Table 20. Other 2005 permits held by the vessels projected to have revenue reductions in the 5 percent or more range under summer flounder alternative 6, scup alternative 1 (preferred) and black sea bass alternative 1 (preferred).
Northeast Region Permit Status
Number ofVessels
Percent of Permitted
Vessels
Multispecies 257 90 Surfclam 144 51 Scallop 242 85 Lobster, trap gear 152 53 Lobster, non-trap gear 154 54 Squid/Butterfish (Limited Access) 134 47 Squid/Butterfish (Incidental) 150 53 Atlantic Mackerel 188 66 Quahog 135 47 Bluefish 254 89 Dogfish 231 81 Tilefish Incidental 179 63 Herring VMS 4 1 Herring non-VMS 197 69 Atl. Deep-Sea Red Crab (Incidental) 124 44 Skate 212 74 Monkfish (Limited Access) 63 22
Commercial
Monkfish (Open Access) 170 60 Multispecies 4 1 Squid/Mackerel/Butterfish 7 3 Bluefish 13 5 Black Sea Bass 9 3 Summer Flounder 10 4
Recreational
Scup 8 3
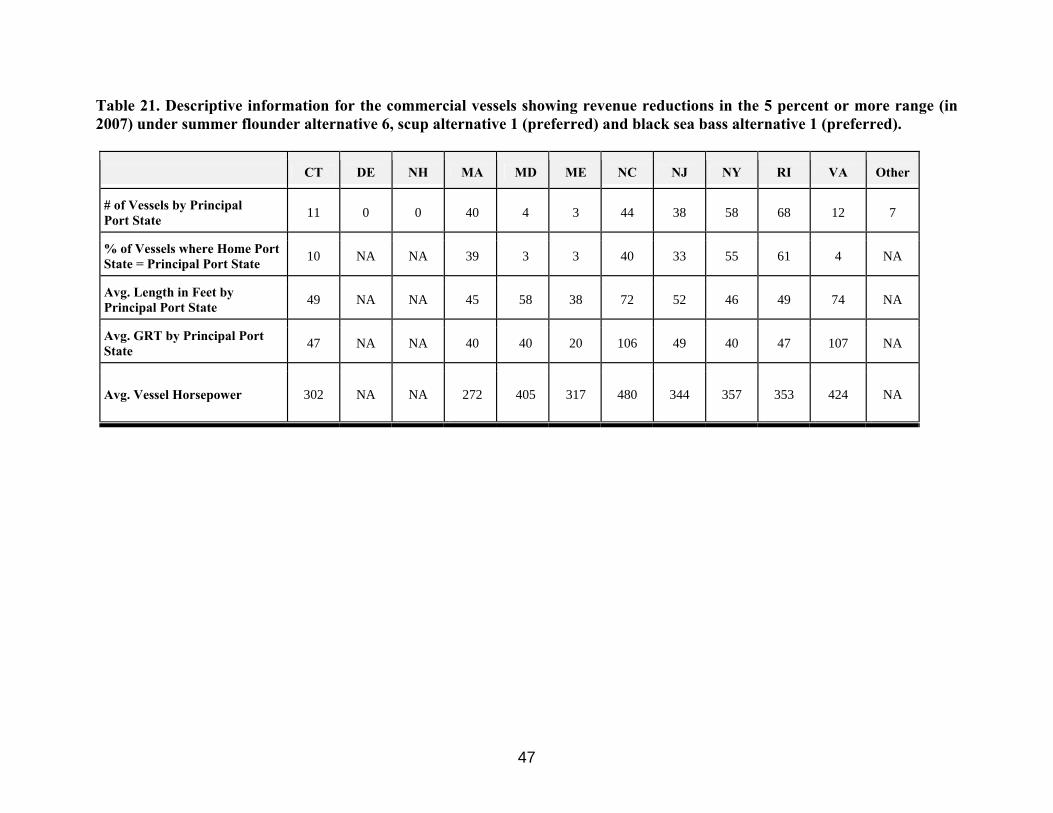
47
Table 21. Descriptive information for the commercial vessels showing revenue reductions in the 5 percent or more range (in 2007) under summer flounder alternative 6, scup alternative 1 (preferred) and black sea bass alternative 1 (preferred).
CT DE NH MA MD ME NC NJ NY RI VA Other
# of Vessels by Principal Port State 11 0 0 40 4 3 44 38 58 68 12 7
% of Vessels where Home Port State = Principal Port State 10 NA NA 39 3 3 40 33 55 61 4 NA
Avg. Length in Feet by Principal Port State 49 NA NA 45 58 38 72 52 46 49 74 NA
Avg. GRT by Principal Port State 47 NA NA 40 40 20 106 49 40 47 107 NA
Avg. Vessel Horsepower 302 NA NA 272 405 317 480 344 357 353 424 NA
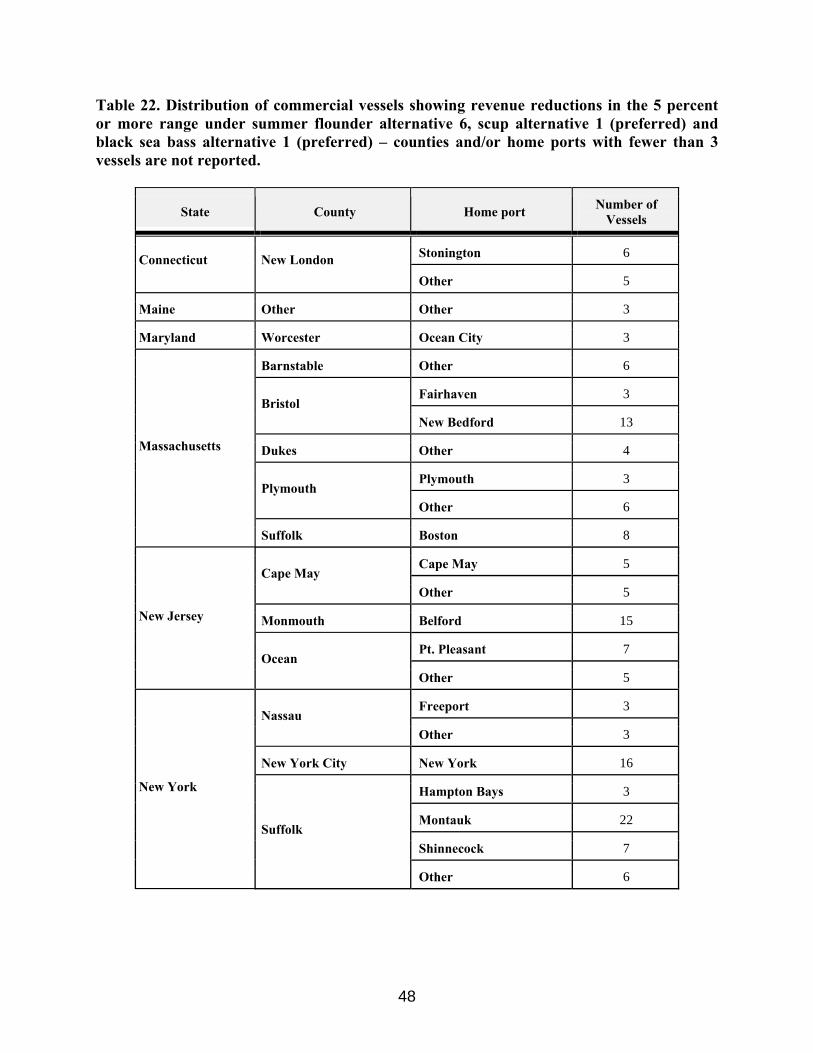
48
Table 22. Distribution of commercial vessels showing revenue reductions in the 5 percent or more range under summer flounder alternative 6, scup alternative 1 (preferred) and black sea bass alternative 1 (preferred) – counties and/or home ports with fewer than 3 vessels are not reported.
State County Home port Number of Vessels
Stonington 6 Connecticut New London Other 5
Maine Other Other 3
Maryland Worcester Ocean City 3
Barnstable Other 6
Fairhaven 3 Bristol
New Bedford 13
Dukes Other 4
Plymouth 3 Plymouth
Other 6
Massachusetts
Suffolk Boston 8
Cape May 5 Cape May
Other 5
Monmouth Belford 15
Pt. Pleasant 7
New Jersey
Ocean Other 5
Freeport 3 Nassau
Other 3
New York City New York 16
Hampton Bays 3
Montauk 22
Shinnecock 7
New York
Suffolk
Other 6
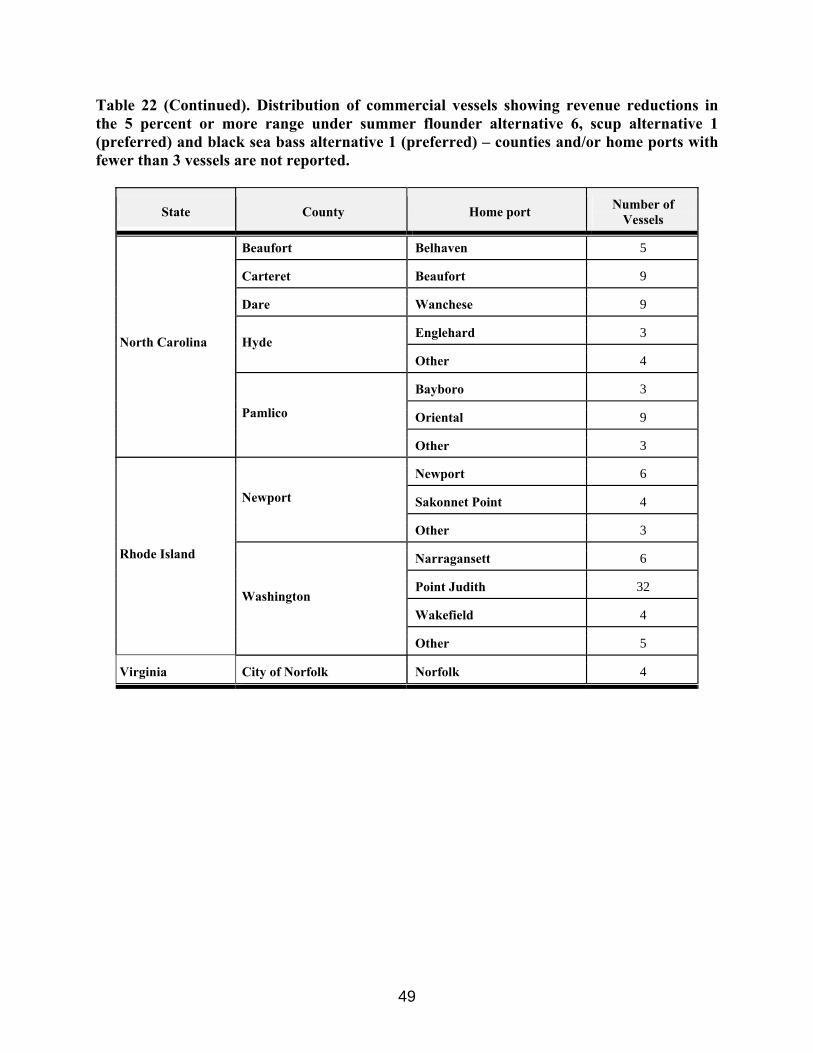
49
Table 22 (Continued). Distribution of commercial vessels showing revenue reductions in the 5 percent or more range under summer flounder alternative 6, scup alternative 1 (preferred) and black sea bass alternative 1 (preferred) – counties and/or home ports with fewer than 3 vessels are not reported.
State County Home port Number of Vessels
Beaufort Belhaven 5
Carteret Beaufort 9
Dare Wanchese 9
Englehard 3 Hyde
Other 4
Bayboro 3
Oriental 9
North Carolina
Pamlico
Other 3
Newport 6
Sakonnet Point 4 Newport
Other 3
Narragansett 6
Point Judith 32
Wakefield 4
Rhode Island
Washington
Other 5
Virginia City of Norfolk Norfolk 4

50
Table 23. Analysis of revenue impacts for active vessels associated with the 2007 combined summer flounder, scup, and black sea bass quota under summer flounder alternative 6, black sea bass alternative 2 (preferred) and scup alternative 2 (preferred). “FLK” is summer flounder, “BSB” is black sea bass, and “SCP” is scup.
Fluke Alternative 6, BSB Alternative 2 (Preferred) and Scup Alternative 2 (Preferred)
Number of Impacted Vessels by Reduction Percentile (%)
Class Landings Combination
Total Active Vessels
Number of Vessels
Impacted by > 5%
Reduction
No Change in Revenue (number)
<5 5-9 10-19 20-29 30-39 40-49 ≥50
1 SCP Only 13 5 0 8 5 0 0 0 0 0
2 BSB Only 85 33 0 52 5 28 0 0 0 0
3 FLK Only 304 47 0 257 12 9 4 7 15 0
4 SCP/BSB 63 25 0 38 12 13 0 0 0 0
5 SCP/FLK 26 13 0 13 3 1 1 6 2 0
6 BSB/FLK 80 42 0 38 4 26 6 4 2 0
7 SCP/BSB/FLK 346 210 0 136 42 68 53 35 12 0
Totals 917 375 0 542 83 145 64 52 31 0

51
Table 24. Revenue impacts of the combined summer flounder alternative 6, scup alternative 2 (preferred) and black sea bass alternative 2 (preferred) quotas, by home port state.
Total Active Vessels Number of Impacted Vessels by Reduction Percentile (percent)
State Vessels with Valid Federal Scup, BSB, or Fluke Permit
Vessels without Valid Federal Scup, BSB, or Fluke Permit
Number of Vessels
Impacted >5 percent
No Change in Revenue(number) <5 5-9 10-19 20-29 30-39 40-49 ≥50
CT 15 9 13 0 11 2 5 3 3 0 0 DE 7 0 4 0 3 1 3 0 0 0 0 NH 1 1 0 0 2 0 0 0 0 0 0 MA 160 75 66 0 169 23 20 14 5 4 0 MD 10 4 9 0 5 2 4 2 1 0 0 ME 3 9 3 0 9 0 2 0 1 0 0 NC 87 21 53 0 55 13 25 10 4 1 0 NJ 110 43 51 0 102 3 20 11 9 8 0 NY 112 25 77 0 60 19 25 10 14 9 0 RI 103 44 69 0 78 13 23 13 13 7 0 VA 50 3 21 0 32 3 17 1 0 0 0
OTHERa 3 6 1 0 2 0 1 0 0 0 0 NOT
KNOWNb 0 16 8 0 14 4 0 0 2 2 0
Total 661 256 375 0 542 83 145 64 52 31 0 aHome port state provided on permit application was not in the Northeast Region. bNo home port state indicated on permit application.

52
Table 25. Combinations of 2005 summer flounder (FLK), scup (SCP) and black sea bass (BSB) permits held by commercial vessels projected to have revenue reductions in the 5% or more range under summer flounder alternative 6, scup alternative 2 (preferred) and black sea bass alternative 2 (preferred).
All 3 FLK only
BSB only
SCP Only
SCP/ BSB
SCP/ FLK
BSB/ FLK None*
Commercial 179 19 31 2 27 27 12 64 * “None” indicates no summer flounder, scup, or black sea bass permit held, and not necessarily no commercial permits held.

53
Table 26. Other 2005 permits held by the vessels projected to have revenue reductions in the 5 percent or more range under summer flounder alternative 6, scup alternative 2 (preferred) and black sea bass alternative 2 (preferred).
Northeast Region Permit Status
Number ofVessels
Percent of Permitted
Vessels
Multispecies 350 93 Surfclam 162 43 Scallop 291 78 Lobster, trap gear 218 58 Lobster, non-trap gear 161 43 Squid/Butterfish (Limited Access) 147 39 Squid/Butterfish (Incidental) 197 53 Atlantic Mackerel 254 68 Quahog 152 41 Bluefish 332 89 Dogfish 295 79 Tilefish Incidental 239 64 Herring VMS 4 <1 Herring non-VMS 244 65 Atl. Deep-Sea Red Crab (Incidental) 158 42 Skate 270 72 Monkfish (Limited Access) 64 17
Commercial
Monkfish (Open Access) 228 61 Multispecies 15 4 Squid/Mackerel/Butterfish 18 5 Bluefish 29 8 Black Sea Bass 22 6 Summer Flounder 23 6
Recreational
Scup 19 5

54
Table 27. Descriptive information for the commercial vessels showing revenue reductions in the 5 percent or more range (in 2007) under summer flounder alternative 6, scup alternative 2 (preferred) and black sea bass alternative 2 (preferred).
CT DE NH MA MD ME NC NJ NY RI VA Other
# of Vessels by Principal Port State 11 4 0 60 10 3 45 50 76 79 29 8
% of Vessels where Home Port State = Principal Port State 10 4 NA 58 9 3 41 44 72 69 18 NA
Avg. Length in Feet by Principal Port State 49 41 NA 40 51 38 71 49 43 48 53 NA
Avg. GRT by Principal Port State 47 20 NA 30 31 20 104 43 33 44 58 NA
Avg. Vessel Horsepower 302 426 NA 269 391 317 476 345 345 350 460 NA

55
Table 28. Distribution of commercial vessels showing revenue reductions in the 5 percent or more range under summer flounder alternative 6, scup alternative 2 (preferred) and black sea bass alternative 2 (preferred) – counties and/or home ports with fewer than 3 vessels are not reported.
State County Home port Number of Vessels
Stonington 6 Connecticut New London Other 7
Maine Other Other 3
Maryland Worcester Ocean City 8
Falmouth 3
Chatham 3 Barnstable
Other 9
Fairhaven 4
New Bedford 13 Bristol
Other 3
Nantucket 3 Dukes
Other 3
Plymouth 4 Plymouth
Other 8
Massachusetts
Suffolk Boston 13
Atlantic Other 3
Cape May 8
Sea Isle City 3 Cape May
Other 3
Belford 15 Monmouth
Other 3
Pt. Pleasant 10
New Jersey
Ocean Other 5
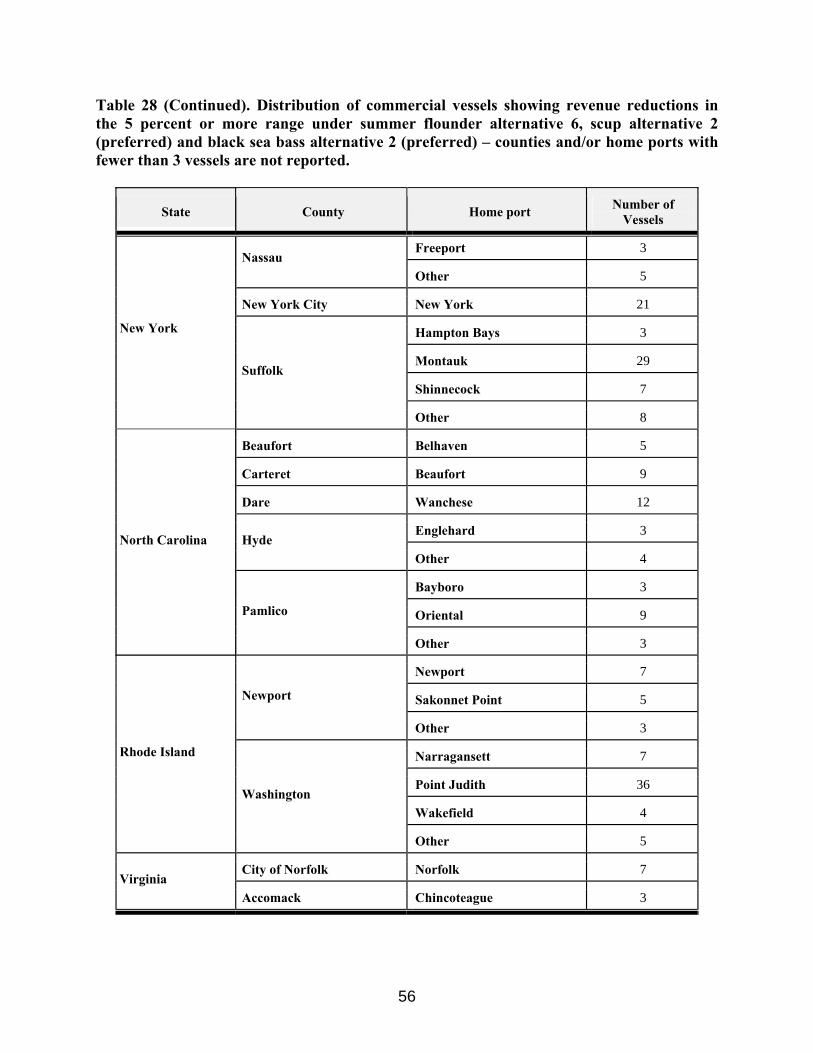
56
Table 28 (Continued). Distribution of commercial vessels showing revenue reductions in the 5 percent or more range under summer flounder alternative 6, scup alternative 2 (preferred) and black sea bass alternative 2 (preferred) – counties and/or home ports with fewer than 3 vessels are not reported.
State County Home port Number of Vessels
Freeport 3 Nassau
Other 5
New York City New York 21
Hampton Bays 3
Montauk 29
Shinnecock 7
New York
Suffolk
Other 8
Beaufort Belhaven 5
Carteret Beaufort 9
Dare Wanchese 12
Englehard 3 Hyde
Other 4
Bayboro 3
Oriental 9
North Carolina
Pamlico
Other 3
Newport 7
Sakonnet Point 5 Newport
Other 3
Narragansett 7
Point Judith 36
Wakefield 4
Rhode Island
Washington
Other 5
City of Norfolk Norfolk 7 Virginia
Accomack Chincoteague 3