superstorm sandy” a surveyor’s and underwriter’s … "sandy” – a surveyor’s and...
TRANSCRIPT

Superstorm "Sandy” – A surveyor’s and underwriter’s perspective
Robert Volante Managing Director, CSL Group
Sean M. Dalton Senior Vice President, Zurich Insurance

Superstorm "Sandy” – A surveyor’s and underwriter’s perspective
Robert Volante Managing Director, CSL Group

Presentation overview
On the 22nd October 2012, the National Hurricane Centre in Miami first notified and named "Sandy" as a tropical depression in the Southern Caribbean.
In the days that followed, Sandy was variously classified or referenced as a Hurricane, a “Frankenstorm”, a “Superstorm” and a Post-Tropical Storm. Whilst insurance and governmental authorities sought to clarify the exact status of the weather system as it made landfall on the early morning of the 29th October, the popular media captioned Sandy as the "biggest" storm in modern history.
Superstorm Sandy is reported as being the largest Atlantic hurricane on record, and has devastated areas along its path in the Caribbean, Mid-Atlantic and Northeastern United States, causing widespread devastation, killing more than 250 people in seven countries and leaving approximately 10 million homes and commercial properties without power for periods up to, and in some cases beyond, a week.
The presentation will look at the life cycle and physical impacts of "Sandy“, how communication and reporting affected the interpretation of events before, during and after the storm, and capture the surveyor’s perspective as reported by the surveyors involved.

Another weather catastrophe presentation??
• Yes, but…
• New York is the most populous city in the United States and the centre of the New York Metropolitan Area, one of the most populous urban agglomerations in the world. A global power “Alpha++” city, New York exerts a significant impact upon commerce, finance, media, art, fashion, research, technology, education and entertainment.
Alpha++ cities are New York City and London, which are vastly more integrated with the global economy than any other cities (Globalization & World Cities Research Network)

“Perfect Storm” or “Frankenstorm” (contributory factors)
• Warmer, higher seas
• Blocked weather pattern
• The combining of weather systems or “hybridisation”
• High tides
• An unusual combination of meteorological conditions (or “the effect of global warming?”)

The track of “Superstorm” Sandy
Sandy developed from a tropical wave in the western Caribbean Sea on 22nd October, quickly strengthened, and was upgraded to Tropical Storm six hours later. On 24th October, Sandy became a hurricane, made landfall near Kingston, Jamaica and, a few hours later, re-emerged into the Caribbean Sea and strengthened into a Category 2 hurricane. On 25th October, Sandy hit Cuba, then weakened to a Category 1 hurricane. Early on 26th October, Sandy moved through the Bahamas. On 27th October, Sandy briefly weakened to a tropical storm and then re-strengthened to a Category 1 hurricane. Early on 29th October, Sandy curved north-northwest and then moved ashore near Atlantic City, New Jersey as a post tropical cyclone with hurricane-force winds.

The Sandy impact was not restricted to the USA
In Jamaica, winds left 70% of residents without electricity, blew roofs off buildings, killed one and caused over USD 50 million in damage. In Haiti, Sandy's outer bands brought flooding that killed at least 54, caused food shortages and left about 200,000 homeless. In Cuba, there was extensive coastal flooding and wind damage inland, destroying some 15,000 homes, killing 11, and causing USD 2 billion in damage. In The Bahamas, two died amid an estimated USD 300 million in damage. In Canada, two were killed in Ontario and an estimated USD 100 million in damage was caused throughout Ontario and Quebec. In the United States, Sandy affected 24 states, including the entire eastern seaboard from Florida to Maine, with particularly severe damage in New Jersey and New York. Its storm surge hit New York City on 29th October, flooding streets, tunnels and subway lines and cutting power in and around the city. Sandy killed at least 125 people in the United States. That includes 60 in New York - 48 of them in New York City - 34 in New Jersey and 16 in Pennsylvania.

Flooded areas in New York and New Jersey

The Port of New York and New Jersey • The Port of New York and New Jersey is the third-largest seaport in North America and the largest maritime cargo
centre on the East Coast. • 2011 cargo volumes at the Port of New York and New Jersey reached a record annual high with 5.5 million 20-foot
equivalent units (TEUs) handled in the period. • Primary Cargo Type
• Mixed (Containers, Auto, and Bulk)
• Top Import Commodities at the Port of NY & NJ in TEUs • Furniture • Women's & Infant Apparel • Beer & Ale
• Top Export Commodities at the Port of NY & NJ in TEUs • Paper, Carbon, Crepe • Automobiles • Mixed Metal Scrap • Top Bulk Commodities at Port Newark/Elizabeth • Scrap Metal/Steel • Petroleum • Salt • Cement • Edible Liquid Oils

Containerised and break bulk cargo
In the immediate aftermath of Sandy, cargo destined for New York and New Jersey was diverted to alternative discharge ports in an attempt to reduce delays and backlogs in the supply chain during the critical commercial period just ahead of Thanksgiving and Christmas. From the 2nd November, the ports of Virginia and, to a lesser degree, Baltimore and Charleston, began receiving cargo diverted from the Port of New York and New Jersey. Over 6,000 containers were diverted to the Port of Virginia and efforts to forward or redistribute these consignments were hampered due to the scale of the logistical challenge and the need to restructure normal truck and barge schedules to manage the unusual volume flow from the port. As of the 5th November, all cargo terminals operated by The Port Authority of New York and New Jersey were re-opened to truck traffic. The principle objective was to move cargo out of the port area to make space for incoming vessels, including container ships. The storm surge created by Sandy caused nearly 4 foot of water throughout the port area. The Port Authority stated that 24-hour clean-up operations repaired damaged road and rail networks, restored electrical systems and recovered hundreds of displaced containers and other items of cargo.

Car storage compounds – a familiar story?
The Port of New York and New Jersey is the leading North American port for automobile imports and exports. In 2011, the port handled over 650,000 vehicles of which 365,000 were imports and 285,000 were exports. Vehicle terminals are located at the Auto Marine Terminal in Jersey City and at the Port Newark / Elizabeth Marine Terminal complex.
AUTO LOGISTICS

Warehousing
• Racking collapses (wind and wave effects)
• Flooding
• Electricity and other essential services
• Damage to handling equipment
• Major clean up operations / sorting
• Restricted distribution capabilities

Mixed messages - Communications and the Media (1) • Information overload
• Facts, theory, fiction
• Media attention / media hype
• Communication challenges - mixed messages
• Multiple private weather reporting and forecasting entities

Mixed messages - Communications and the Media (2)
“Although we are expecting a large surge of water, it is not expected to be a tropical storm or hurricane-type surge”.
“With this storm, we’ll likely see a slow pile up of water rather than a sudden surge which is what you would expect from a hurricane. So it will be less dangerous”.

When facing a major weather event loss such as “Sandy” surveyors are faced with multiple challenges and priorities. In your opinion, which of the following challenges ranks highest?
1. Clear instructions from the client/principal
2. Co-operation from the claimant
3. A mobile phone signal at all times
4. An efficient administration backup/office
5. Knowledge of the geographical area affected

A surveyor’s perspective (1)
• Surveyors had to compete for resources like everybody else, impacting servicing and response (some rapidly deployed surveyors had to change hotels and/or cars three times).
• Wide variety of cargoes and commodities affected from bulks, metals, perishables, retails and vehicles.
• Access to the piers denied - all products / containers had to be removed before inspection. • Wet products / containers appeared throughout the nation. • Diversion charges sometimes exceeded claims for physical losses. • Control of Damaged Goods and FDA played a large part in outcomes / disposals. • Many salvors were disinterested due to nature of the contamination. • Many insurers settled claims based upon our preliminary e-mails (and reserves) for compliance and
expediency. • Surveyors dealt with a wide range of competencies within importers / consignees. Some very
knowledgeable, others not so. • Mitigation particularly difficult / laborious for foreign based insureds. • Additional administrative resources (not just additional surveyors)
were critical to managing the survey caseload.

A surveyor’s perspective (2) Operations issues
• It would have not been possible to cover 4, 5, 6 assignments per day without: - immediate access to Email (review assignment details, issuing immediate preliminary advice, etc.), - integrated GPS with driving directions to coordinate and access survey sites, - integrated camera and video to forward immediate condition / survey findings to client and or Insured, - and last, but not least, a mobile phone Psychological Issues
• The devastation was almost too much to comprehend. Like in almost every disaster people respond differently and so it was with the Insureds … some were almost numb, some fatalistic, some ready to clean up and rebuild.
• While surveying an object (like containers or warehouses) was relatively easy, the interaction with the people on site can take a toll. For future events, less experienced surveyors should be trained how to deal with the human aspect of such an incident.
Work
• For six months there was a continued conflict between the Sandy related high work volume, the effort and time necessary to complete those assignments alongside the required attention to handle new and non-Sandy related assignments.
• For future events, it would be good if surveyors and Insurance companies could discuss from the Sandy experience what kind of “short form” reporting style and extent of communication style should be utilised to maximise efficiency.
Cash • Ability to operate the company through a prolonged period during which no reports / billing /
invoicing could be issued.

A surveyor’s perspective (3)
• Conditions initially were so bad that individual surveyors had to first deal with protecting their own families.
• Communications were down so the second issue was communicating with the office.
• Once a crisis office was set up we began work. This was almost 5 to 6 days after the initial storm.
• Next problem was that of procuring gasoline for our cars which ran out and was needed to power home generators as well as cars.
• We were on the go constantly, one survey after another. The problem was that most warehouses were not equipped to handle clean-up and surveys at the same time.
• Most clients were unaware of the scale of destruction. They were expecting normal response time with regards to assignments. Their usual response was… Yes we understand, but when can we have our report ?
• With regards to technical matters, getting inventory companies to account for warehouse losses was tough.
• Getting salvors to give you any kind of idea as to what they may offer was tough.
• Getting assureds to mitigate damages was next to impossible.
• Steamship companies initially did not know how to respond. They subsequently stopped sending out surveyors to protect their interests and declared all subsequent losses as “force majeure” situations.
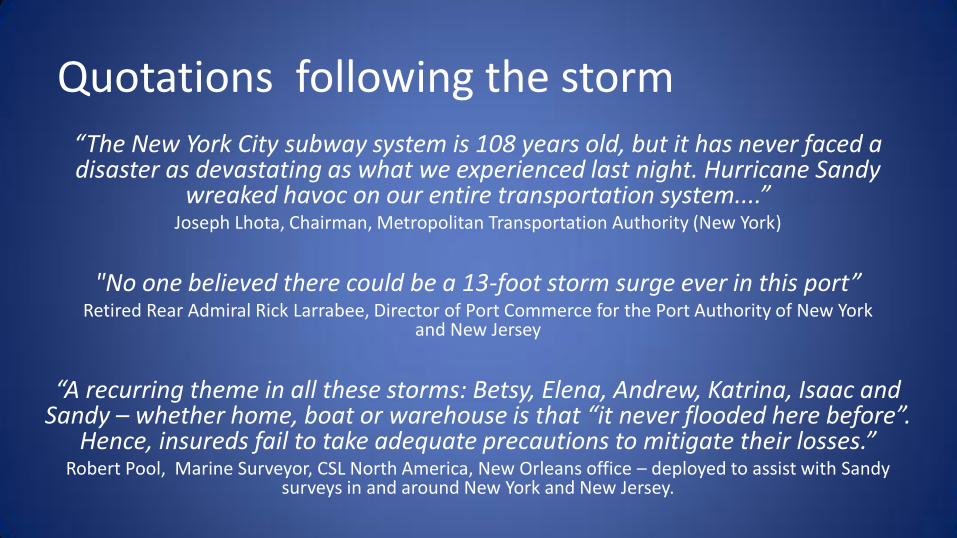
Quotations following the storm
“The New York City subway system is 108 years old, but it has never faced a disaster as devastating as what we experienced last night. Hurricane Sandy
wreaked havoc on our entire transportation system....” Joseph Lhota, Chairman, Metropolitan Transportation Authority (New York)
"No one believed there could be a 13-foot storm surge ever in this port”
Retired Rear Admiral Rick Larrabee, Director of Port Commerce for the Port Authority of New York and New Jersey
“A recurring theme in all these storms: Betsy, Elena, Andrew, Katrina, Isaac and
Sandy – whether home, boat or warehouse is that “it never flooded here before”. Hence, insureds fail to take adequate precautions to mitigate their losses.”
Robert Pool, Marine Surveyor, CSL North America, New Orleans office – deployed to assist with Sandy surveys in and around New York and New Jersey.

Observations for the future
• Assureds could have / should have been better prepared
• “We” could / should make more consistent efforts to help assureds to be prepared
• Preparations should include guidance for both pre loss and post loss scenarios
• The establishment and pre-agreement of specific survey and reporting protocols for such major events will improve efficiency (whilst maintaining agreed quality) for the benefit of all parties
• Surveyors should be provided with additional education and training on how to best manage the psychological interface with representatives of the assured in such challenging circumstances

Superstorm "Sandy” – A Underwriter’s perspective
Sean M. Dalton Head of Marine,
Zurich Global Corporate in North America
Built 1893 Destroyed Oct 29, 2012
Staten Island’s Iconic Old Orchard Lighthouse

Financial impact of Sandy
• Estimated economic loss: $ 65 billion
• Estimated insured loss: $ 25 to $ 30 billion
• Largest Marine loss in history: $ 2.5 to 3.5 billion

Sandy marine losses
• $ 2.5 to $ 3.5 billion
• “Wiped out entire U.S. Marine premium for 2012”
• Marine 1% of total premium but 10% of Sandy losses
(Source: Insurance Journal - March 22, 2013)

Sandy marine losses
• Cargo loss estimated at $ 1 billion (Source: Cargo Business Newswire, November 5, 2012)
• Cargo automobile $ 650 million (Source: Insurance Insider, December 12, 2012)
• 65,000. Boats / Yachts Damaged (50% insured), estimated insured loss $ 650 million (Source: Boat US)
• Fine Arts $ 500 million (Source: Property Casualty 360, December 21, 2012)
• Specie / Valuable Papers: Depository Trust and Clearing House (DTCC) Bearer Bonds face value $ 70 billion, recovery / restoration costs much less
(Source: NY Post, November 18, 2012)

Scale of Sandy’s impact
Port Equipment / Cargo Damage Impact
• 15,000 TEU of loaded containers sustained damage
• 16,000 + autos lost
• 3,000 truck chassis total loss
• Over 100 miles of rail cars and chassis damaged
• Massive loss / damage to empty containers (extreme in private, independently owned facilities not under the jurisdiction of the Port / USCG)

Scale of Sandy’s impact
Port Equipment / Cargo Damage Impact
• Widespread salt water damage to cranes, lists, straddle carriers, pumps, etc. (temporary repairs affected but long term replacements likely needed due to post corrosive damage from salt water)
• Entire fleets of trucks damaged / total loss
• Cargo control systems, electronic inventory systems a total loss

Scale of Sandy’s impact
Commercial vessel losses
• Eight vessels grounded or damaged significantly
• Vessels not capable of getting underway or moving
• John B. Caddell most noteworthy
• Over 600 commercial vessels in Port of NY/NJ

Cargo losses
• Containerized Cargo
• Automobiles
• Bulk Cargo
• Project Cargo / Large Break Bulk
• Warehouse / Storage / Distribution Centers
• Retail Stock Through-Put

Other marine losses
• Marinas (Piers / Wharves / Docks, Contractor’s Equipment, Property)
• Boat Dealers (Inventory, Contractor’s Equipment, Property)
• Port Installations / Equipment
• Hull & Machinery / Protection & Indemnity
• Marine Liabilities (Contractual Liability)

Main causes: cargo loss
Water Damage from Storm Surge / Flooding

Cargo container exposure in port NY/NJ
Total TEU per month of imports and exports
Month Loaded Empties
August 2012 386,087 127,001
September 2012 367,926 122,963
October 2012 314,633 99,447
(Source: Port of NY/NJ)

Value of containerized cargo in port of NY/NJ in October 2012 • Three-month average 356,215
TEUs per month throughput
• Assume: 10% at risk any one time (35,621 TEUs) as 3 days in port and average value per TEU of $ 50,000
• Estimated total amounts exposed: $ 1.8 billion

Loss of automobiles in port of NY/NJ
• 16,000 new vehicles lost
• Estimated value $ 30,000 to $ 40,000 per vehicle
• $ 480 to $ 640 million total

Sandy cargo loss: coverage under cargo policies
• Policy Valuations (Selling Price)
• Control of Damage Goods (Fear of Loss)
• Consolidation / Deconsolidation
• Consequential Loss or Damage
• Definition of CAT Perils
• Static Risk: Lack of and/or inadequacy of CAT deductible and CAT sub limits
• Stock Through-Put

Sandy marine loss and cargo loss
• “Outsized” Relative to Property Market
• Much Larger Than Expected / Anticipated
• 1% of P&C Premiums, but over 10% of Loss
• Port Accumulation in Spotlight

Sandy response: broker and customer feedback
• Carriers responded extraordinarily well under circumstances…. Very fair claims settlements…. Sheer volume of claims challenged both carriers and brokers
• Daunting tasks in adjusting equipment and inventory claims…. Lessons learned include maintaining proper inventory, keep current RC and ACV values, limit unscheduled equipment and locations, utilize bar code tracking for inventory….
• Excellent responsiveness, timely with payments on account
• Industry responded extremely well despite personal challenges faced by professionals as a result of the storm

Impact of Sandy on the marine insurance market
A “Perfect Storm”

Pre-Sandy… Marine Underwriters were challenged by:
• Sustained “soft” market since 2003
• Increasing loss costs and losses in attritional / working layer losses
• More large losses (RENA, COSTA CONCORDIA, FLAMINIA, Transocean / BP, ACL / Mel Oliver, etc.)
• CATs (Japan EQ / Tsunami, Thai Floods)
• Rising expense ratios (37% +)
• New entrants / over capacity
• Increase in static risk covered in Cargo Market
• Unprofitability
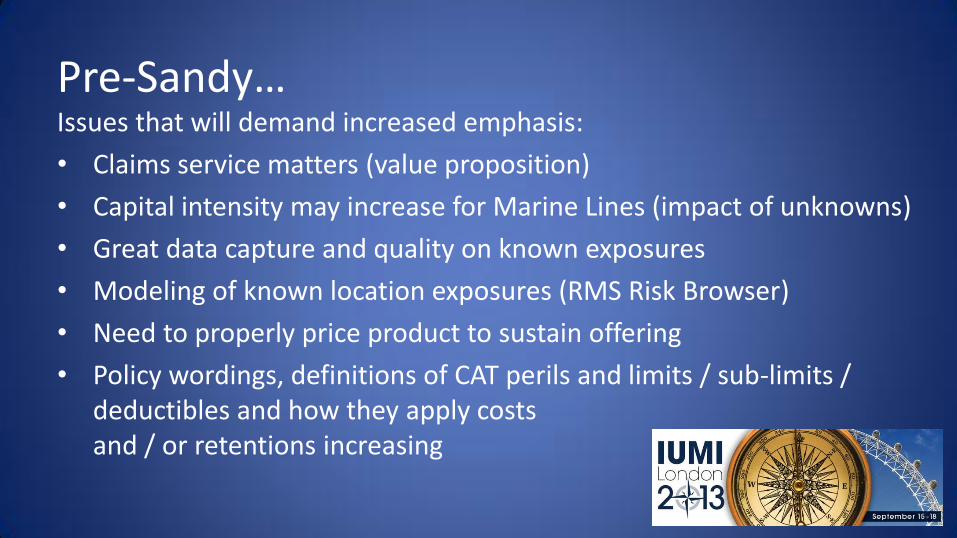
Pre-Sandy… Issues that will demand increased emphasis:
• Claims service matters (value proposition)
• Capital intensity may increase for Marine Lines (impact of unknowns)
• Great data capture and quality on known exposures
• Modeling of known location exposures (RMS Risk Browser)
• Need to properly price product to sustain offering
• Policy wordings, definitions of CAT perils and limits / sub-limits / deductibles and how they apply costs and / or retentions increasing

Challenge of finding reliable flood exposure data
There are no statistical inland flood models available for the United States (coastal surge modeling exists), largely due to the fact that most flood risks in the US are federally insured via the NFIP.
• Historically, there has been low demand by model clients to develop these models.
• Developing an inland flood model would be a huge project, taking modeling companies years to develop.
© Copyright 2013 Munich Reinsurance America, Inc.

Challenge of finding reliable flood exposure data
• As a result, good data capture of privately-insured flood risks in the industry significantly lags data capture for other perils
• Current modeling of flood risks for surge, when known, is also limited by ability of models to handle flood sub-limits and accurately determine amount of flood damage that “leaks” into the wind policy claim
© Copyright 2013 Munich Reinsurance America, Inc.

Port accumulation concern
Is this something new?

Port accumulation research
• 2007: IUMI Copenhagen Presentation on Vessel and Port Aggregation, Mitchell Wasserman of Oceanwide
• 2007: Cargo Accumulation Modeling, The Guy Carpenter Approach
• 2009: Cargo Accumulation Introduction and Issues, Anthony Cowie of Swiss Re
• 2009: Modeling Cargo Accumulation, Thomas Clift of Guy Carpenter (Updated 2012)
• 2010: Safe Havens: Measuring Natural Catastrophe Exposure to Cargo Traded Through Ports (Updated 2011)
• 2012: Guy Carpenter Cargo Accumulation Modeling
• 2013: Munich Re Topics Online February 2013 Marine Avoiding Accumulation Risks
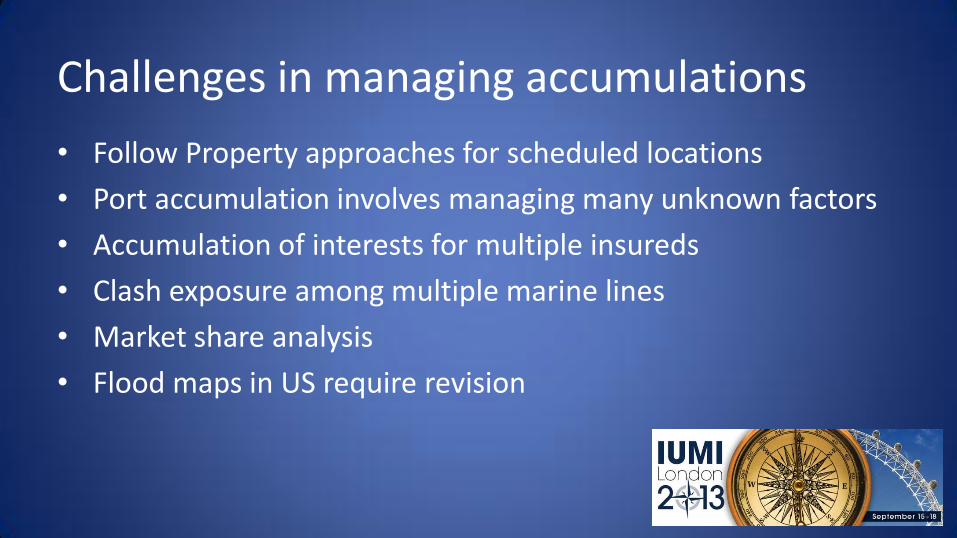
Challenges in managing accumulations
• Follow Property approaches for scheduled locations
• Port accumulation involves managing many unknown factors
• Accumulation of interests for multiple insureds
• Clash exposure among multiple marine lines
• Market share analysis
• Flood maps in US require revision

How best to proceed?
• Model known locations / schedules / exposure
• CAT exclusions / sublimits / deductibles for unknown / unnamed location coverage
• Analysis of Cargo Certificate (Special Policy of Insurance) System Data
• Embrace inroads in Port Accumulation Modeling as part of research
• Reinsurance
• Line setting / limits
• Sublimits for CAT Perils

Current efforts in port accumulation modeling
• Swiss Re “Safe Havens Revisited - An Update of Swiss Re's Cargo Accumulation Model” http://media.swissre.com/documents/fact_Save_havens_ revisited_Factsheet.pdf
• Munich Re “Marine - Avoiding Accumulation Risks” http://www.munichre.com/en/reinsurance/topics-online/2013/02/marine/default.aspx
• Guy Carpenter Helen Bradley BSc, FIA, GC Analytics [email protected]

Sean M. Dalton: acknowledgements
• Commander Linda Sturgis, US Coast Guard • Ian Lennard – President, National Cargo Bureau • Jill Beggs – Head of Specialty Lines, Munich Reinsurance America, Inc. • Robert Huffert – Senior Vice President, Munich Reinsurance America, Inc. • E. Anthony Cowie, CPCU, ARe – Senior Vice President, Swiss Re America
Corporation • Mitchell Wasserman – CEO, Oceanwide • Joseph P. Drucker – Managing Director, Guy Carpenter • Joseph G. Valenza – Executive Vice President, Frenkel & Company • Guy P. Claveloux – Managing Director, Marsh

Superstorm "Sandy” – A surveyor’s and underwriter’s perspective
Robert Volante Managing Director, CSL Group
Sean M. Dalton Senior Vice President, Zurich Insurance
