sunil kumar, research scholar, iit indore dr.ruchi sharma ... · sunil kumar, research scholar, iit...
TRANSCRIPT

Sunil Kumar, Research scholar, IIT Indore Dr.Ruchi Sharma, Assistant Professor,IIT Delhi
5 August 2013 1Presented at STATA user's meet
2013,Mumbai
Deals with panel data problem of :
Selection bias
Heterogeneity
Endogeneity
5 August 2013 2Presented at STATA user's meet
2013,Mumbai
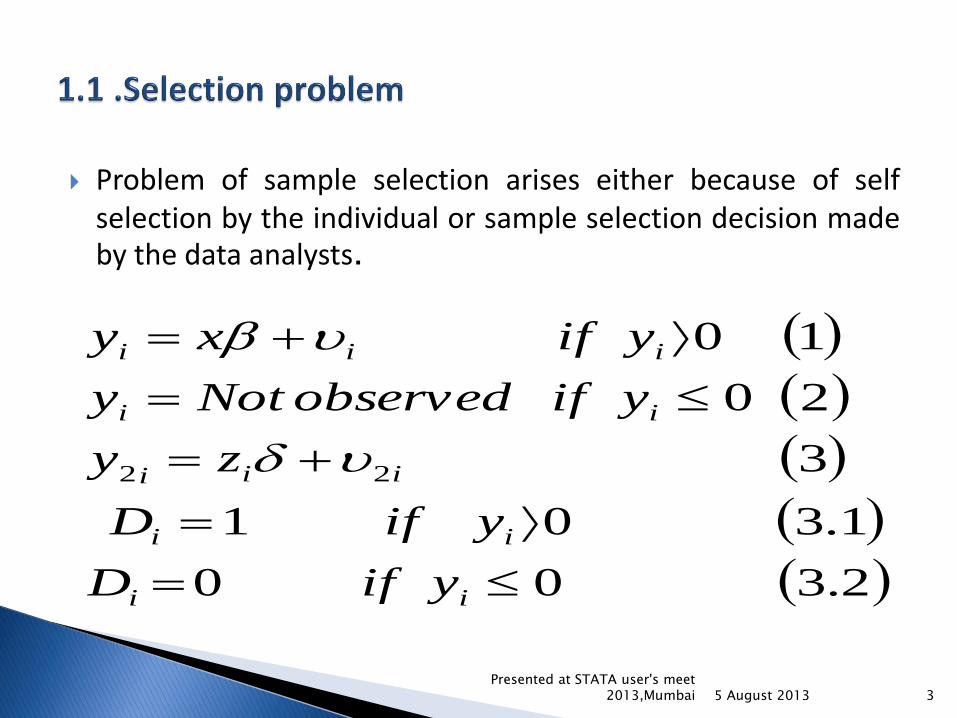
Problem of sample selection arises either because of selfselection by the individual or sample selection decision madeby the data analysts.
2.300
1.301
3
20
10
22
ii
ii
iii
ii
iii
yifD
yifD
zy
yifobservedNoty
yifxy
5 August 2013 3Presented at STATA user's meet
2013,Mumbai
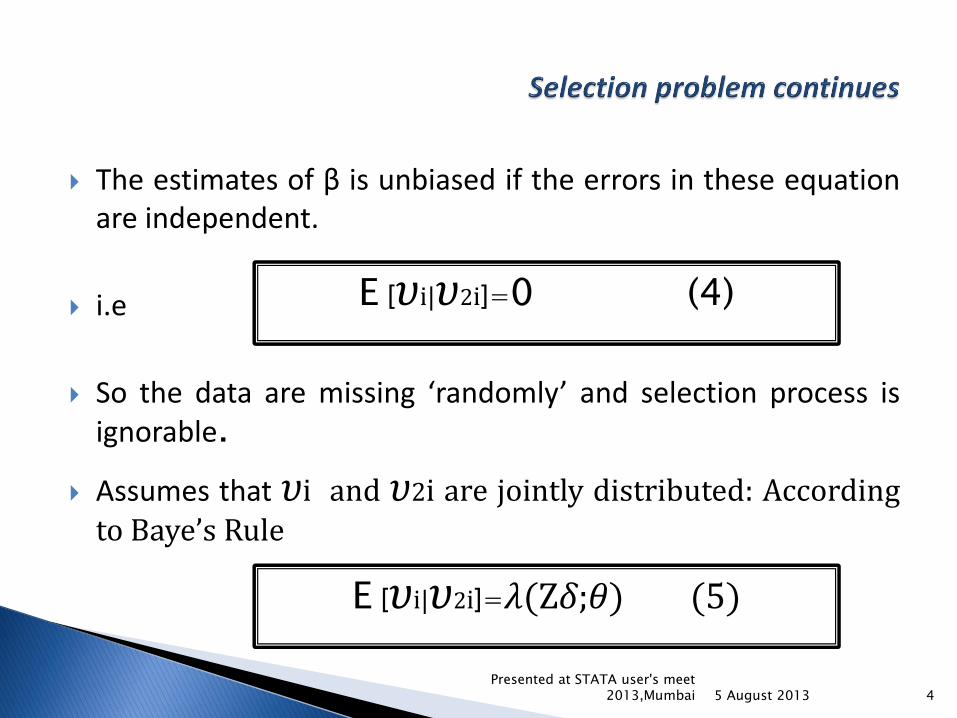
The estimates of β is unbiased if the errors in these equationare independent.
i.e
So the data are missing ‘randomly’ and selection process isignorable.
Assumes that 𝜐i and 𝜐2i are jointly distributed: Accordingto Baye’s Rule
E [𝜐i|𝜐2i]=0 (4)
E [𝜐i|𝜐2i]=𝜆(Z𝛿;𝜃) (5)
5 August 2013 4Presented at STATA user's meet
2013,Mumbai
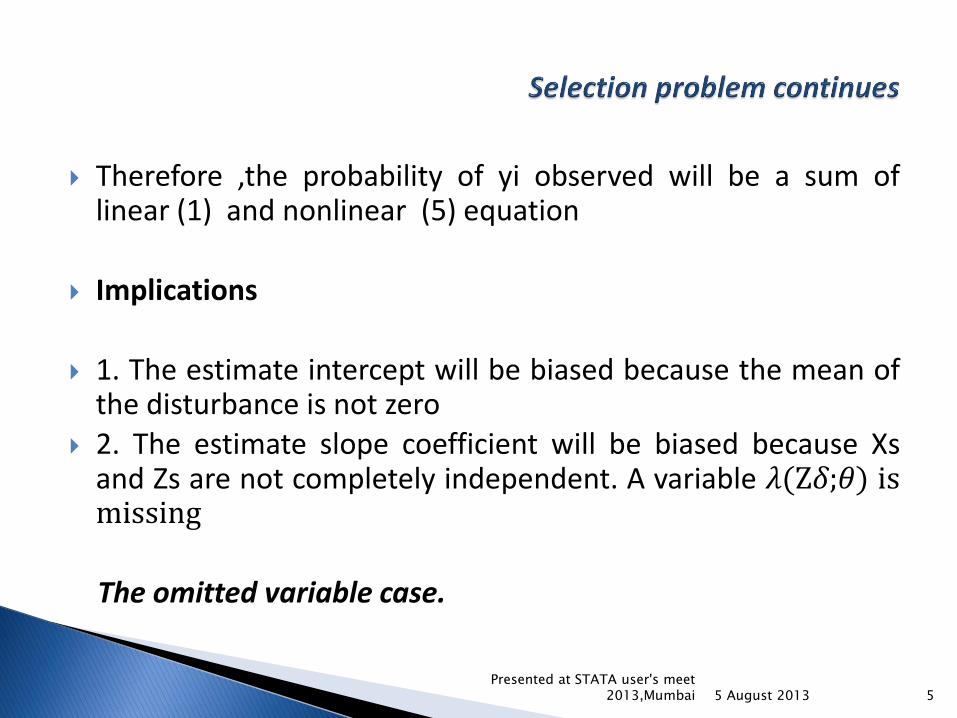
Therefore ,the probability of yi observed will be a sum oflinear (1) and nonlinear (5) equation
Implications
1. The estimate intercept will be biased because the mean ofthe disturbance is not zero
2. The estimate slope coefficient will be biased because Xsand Zs are not completely independent. A variable 𝜆(Z𝛿;𝜃) ismissing
The omitted variable case.
5 August 2013 5Presented at STATA user's meet
2013,Mumbai

See the Works of:-
Gronau (1974) :- Price of time of house wife
Lewis (1974) :- Measures the biases to which meanmarket wage of a person in group overstate their commonwage offer distribution
Heckman (1974) :- Estimates the female labour supply andwages
All of them discussed the participation decision
5 August 2013 6Presented at STATA user's meet
2013,Mumbai
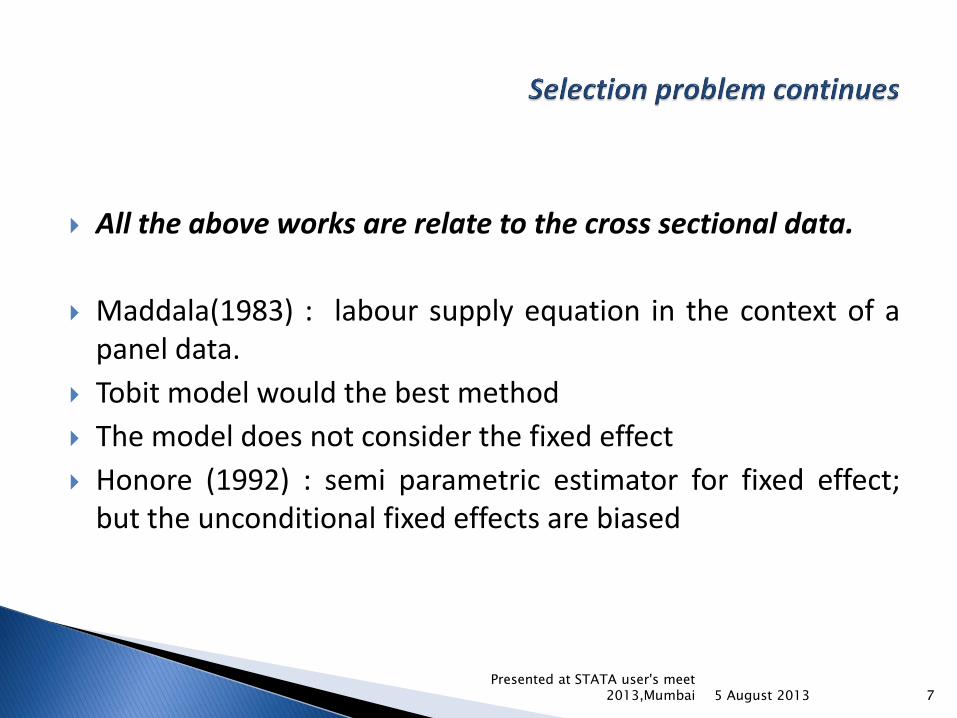
All the above works are relate to the cross sectional data.
Maddala(1983) : labour supply equation in the context of apanel data.
Tobit model would the best method
The model does not consider the fixed effect
Honore (1992) : semi parametric estimator for fixed effect;but the unconditional fixed effects are biased
5 August 2013 7Presented at STATA user's meet
2013,Mumbai
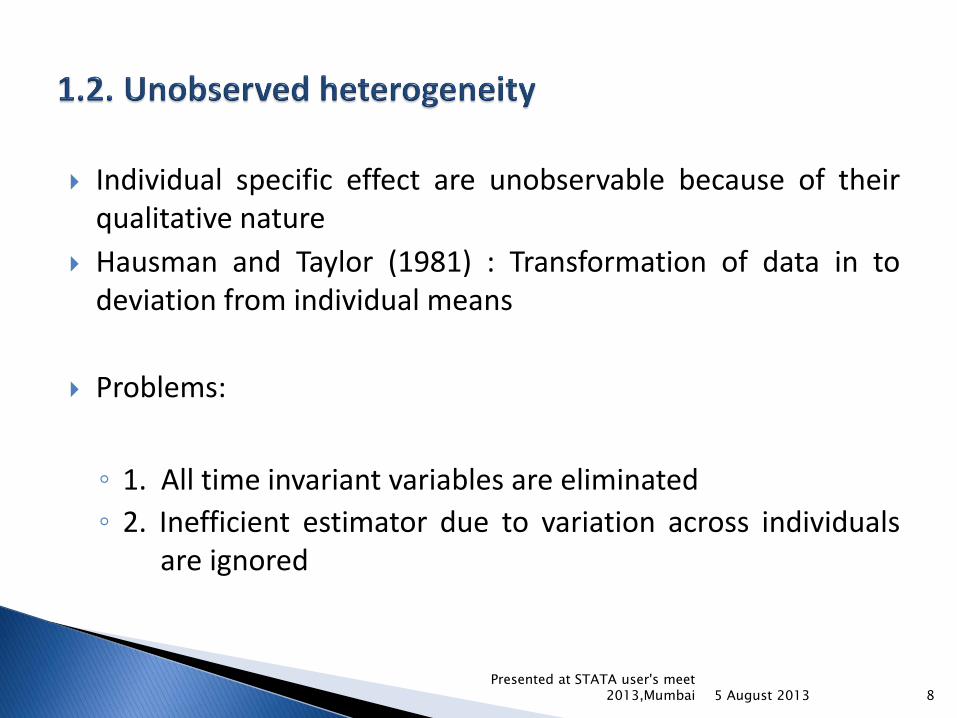
Individual specific effect are unobservable because of theirqualitative nature
Hausman and Taylor (1981) : Transformation of data in todeviation from individual means
Problems:
◦ 1. All time invariant variables are eliminated
◦ 2. Inefficient estimator due to variation across individualsare ignored
5 August 2013 8Presented at STATA user's meet
2013,Mumbai
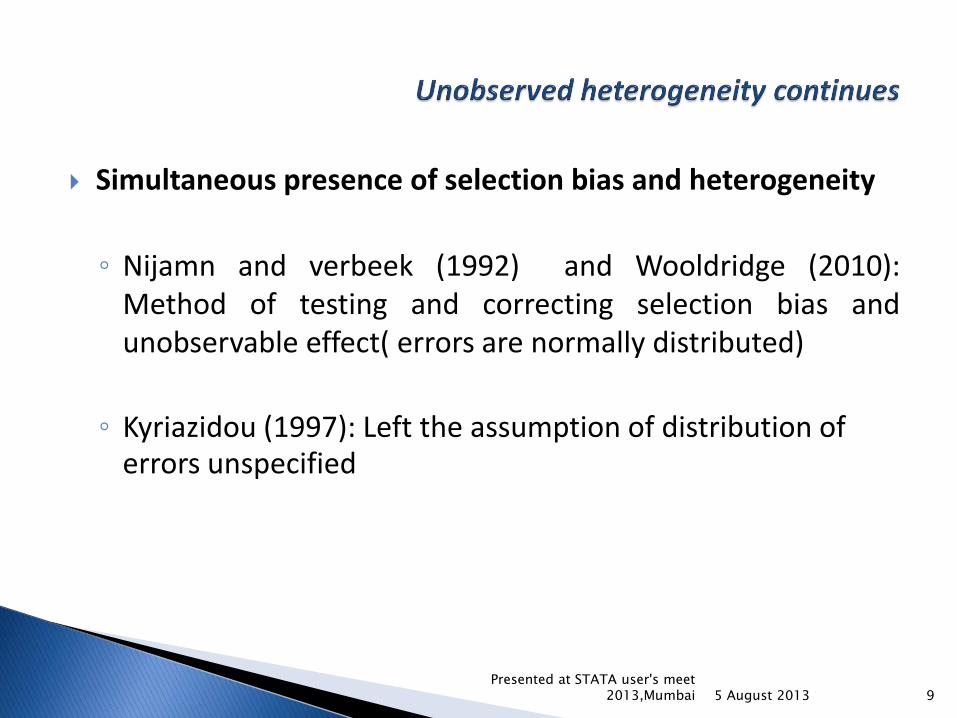
Simultaneous presence of selection bias and heterogeneity
◦ Nijamn and verbeek (1992) and Wooldridge (2010):Method of testing and correcting selection bias andunobservable effect( errors are normally distributed)
◦ Kyriazidou (1997): Left the assumption of distribution of errors unspecified
5 August 2013 9Presented at STATA user's meet
2013,Mumbai
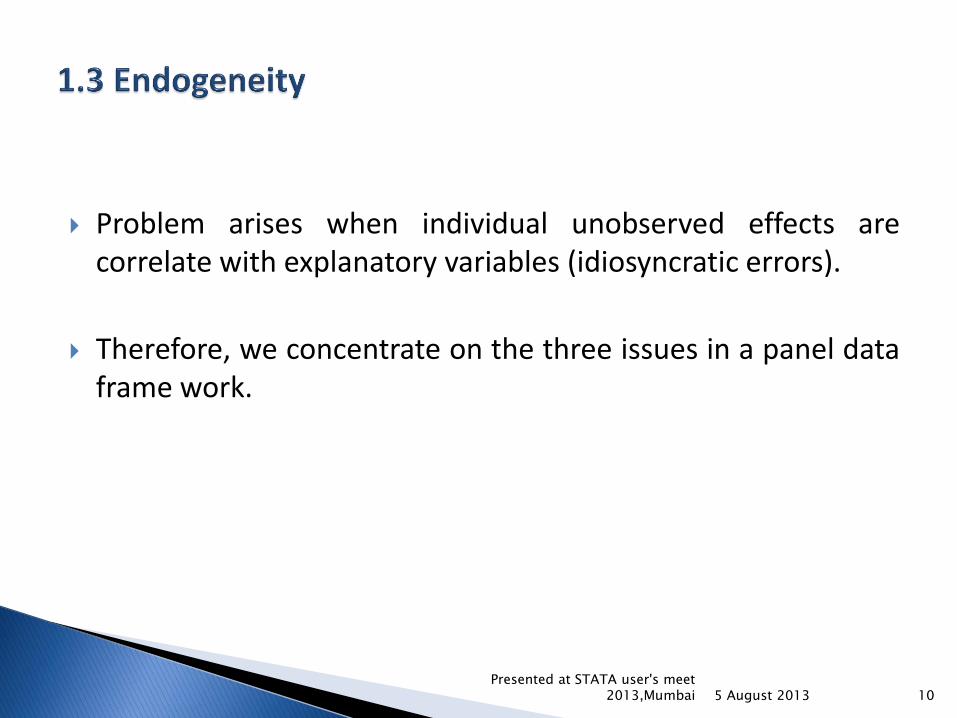
Problem arises when individual unobserved effects arecorrelate with explanatory variables (idiosyncratic errors).
Therefore, we concentrate on the three issues in a panel dataframe work.
5 August 2013 10Presented at STATA user's meet
2013,Mumbai
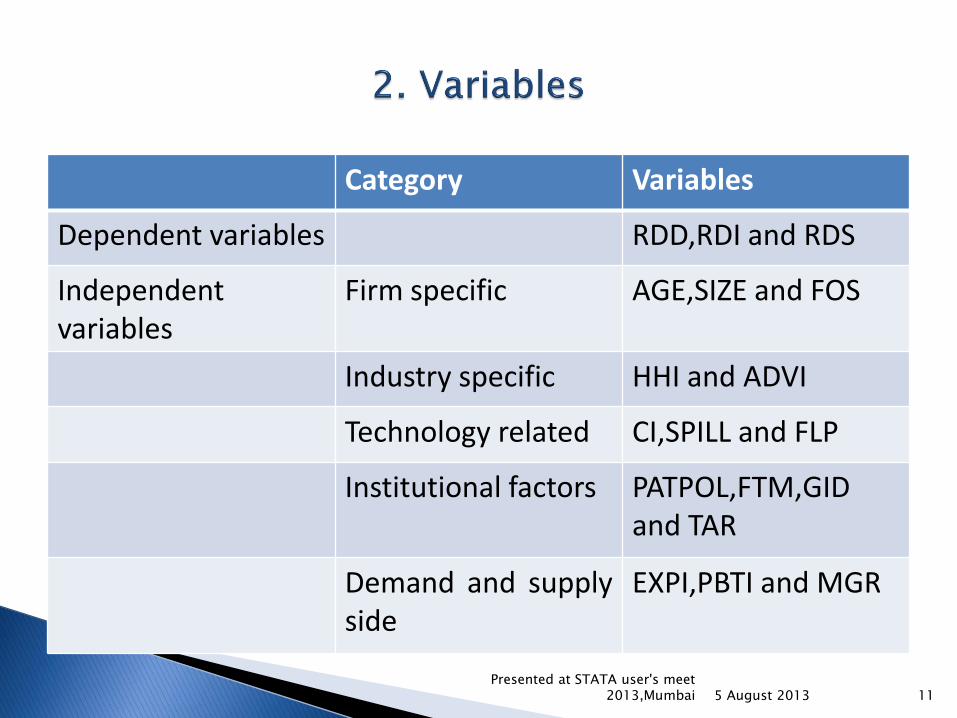
Category Variables
Dependent variables RDD,RDI and RDS
Independentvariables
Firm specific AGE,SIZE and FOS
Industry specific HHI and ADVI
Technology related CI,SPILL and FLP
Institutional factors PATPOL,FTM,GIDand TAR
Demand and supplyside
EXPI,PBTI and MGR
5 August 2013 11Presented at STATA user's meet
2013,Mumbai
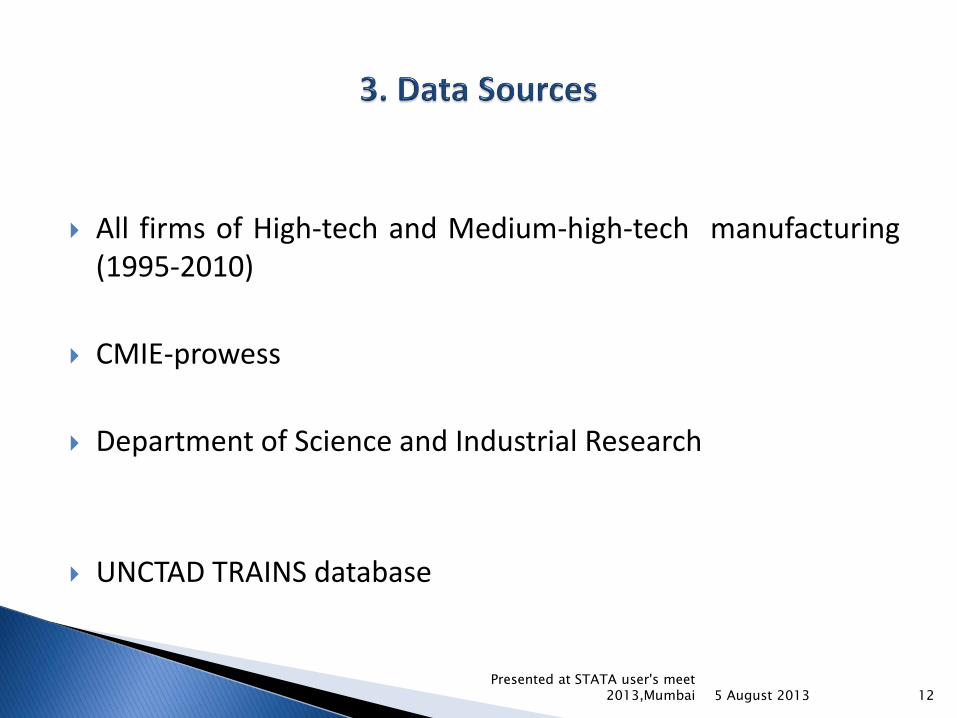
All firms of High-tech and Medium-high-tech manufacturing(1995-2010)
CMIE-prowess
Department of Science and Industrial Research
UNCTAD TRAINS database
5 August 2013 12Presented at STATA user's meet
2013,Mumbai
Heckman’s Two-step procedure
There would be a selection equation and a primary equation
Estimation with simultaneous presence of (Heterogeneity, Endogeneity and Selection bias )
5 August 2013 13Presented at STATA user's meet
2013,Mumbai
)1.7(0
,11
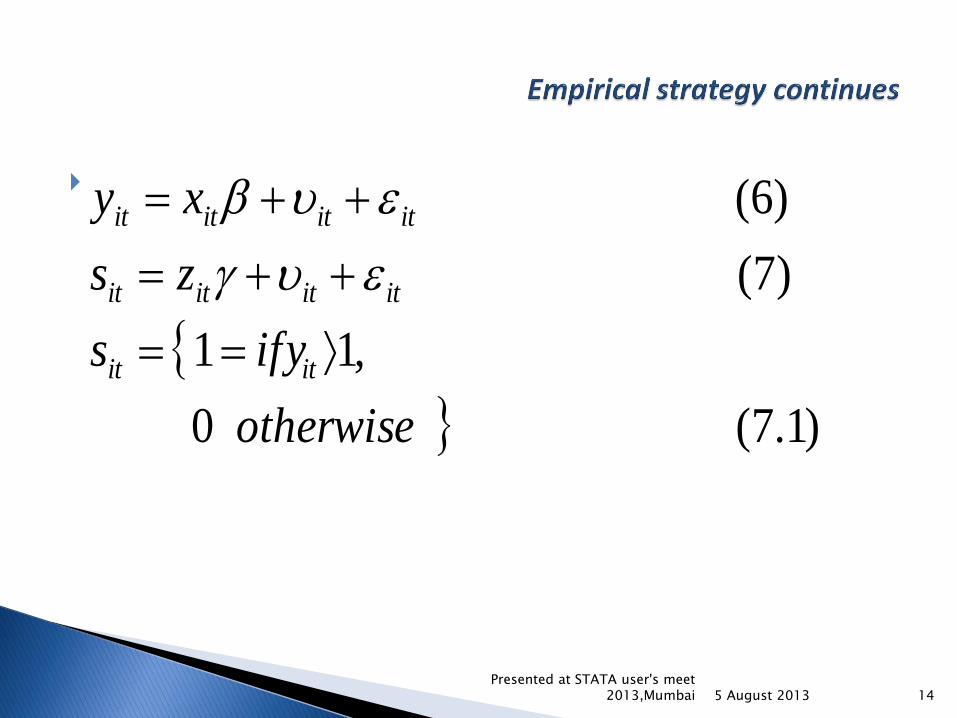
)7(
)6(
otherwise
ifys
zs
xy
itit
itititit
itititit
5 August 2013 14Presented at STATA user's meet
2013,Mumbai
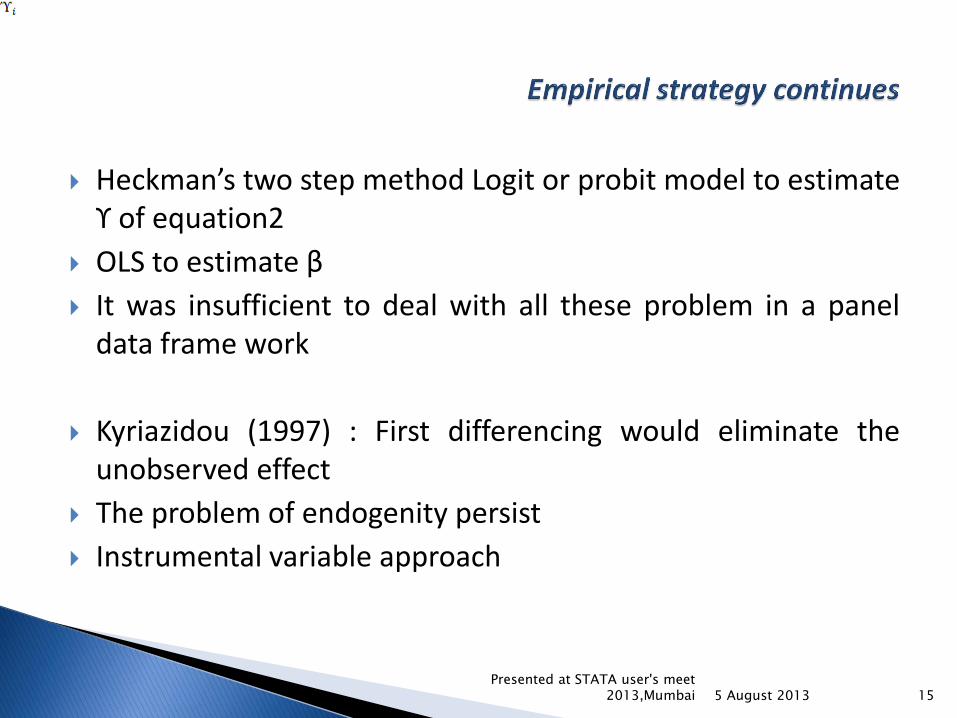
Heckman’s two step method Logit or probit model to estimateϒ of equation2
OLS to estimate β
It was insufficient to deal with all these problem in a paneldata frame work
Kyriazidou (1997) : First differencing would eliminate theunobserved effect
The problem of endogenity persist
Instrumental variable approach
5 August 2013 15Presented at STATA user's meet
2013,Mumbai
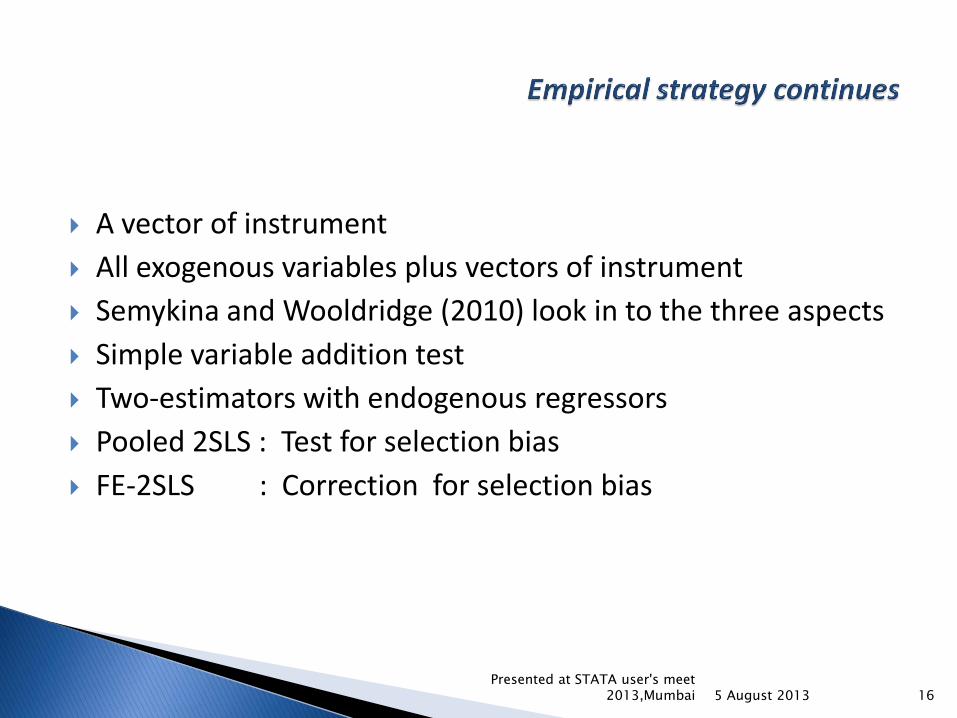
A vector of instrument
All exogenous variables plus vectors of instrument
Semykina and Wooldridge (2010) look in to the three aspects
Simple variable addition test
Two-estimators with endogenous regressors
Pooled 2SLS : Test for selection bias
FE-2SLS : Correction for selection bias
5 August 2013 16Presented at STATA user's meet
2013,Mumbai
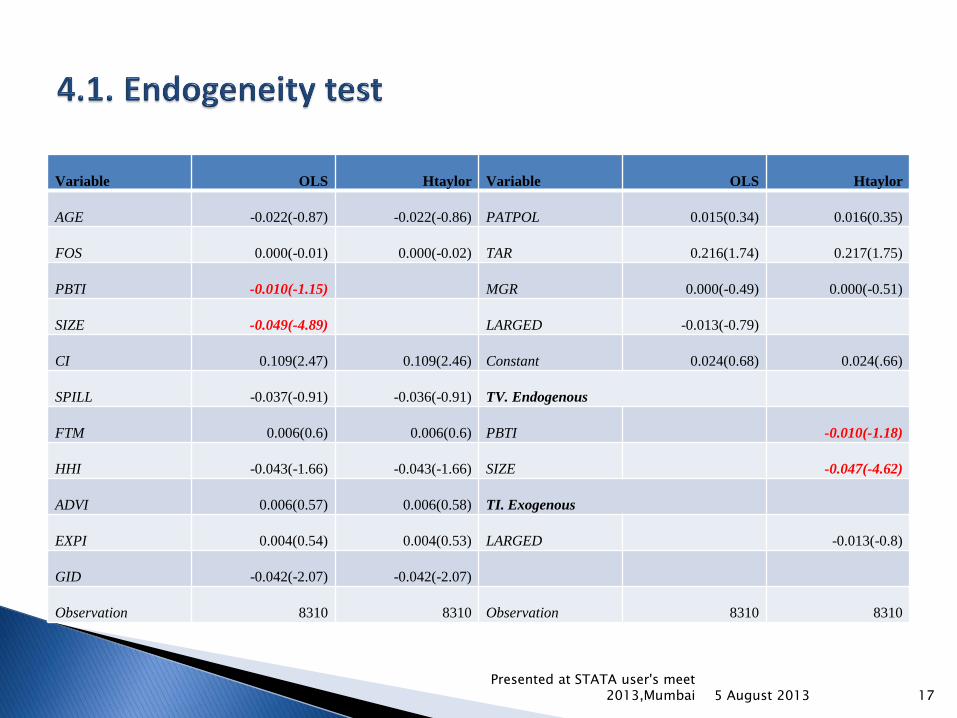
Variable OLS Htaylor Variable OLS Htaylor
AGE -0.022(-0.87) -0.022(-0.86) PATPOL 0.015(0.34) 0.016(0.35)
FOS 0.000(-0.01) 0.000(-0.02) TAR 0.216(1.74) 0.217(1.75)
PBTI -0.010(-1.15) MGR 0.000(-0.49) 0.000(-0.51)
SIZE -0.049(-4.89) LARGED -0.013(-0.79)
CI 0.109(2.47) 0.109(2.46) Constant 0.024(0.68) 0.024(.66)
SPILL -0.037(-0.91) -0.036(-0.91) TV. Endogenous
FTM 0.006(0.6) 0.006(0.6) PBTI -0.010(-1.18)
HHI -0.043(-1.66) -0.043(-1.66) SIZE -0.047(-4.62)
ADVI 0.006(0.57) 0.006(0.58) TI. Exogenous
EXPI 0.004(0.54) 0.004(0.53) LARGED -0.013(-0.8)
GID -0.042(-2.07) -0.042(-2.07)
Observation 8310 8310 Observation 8310 8310
5 August 2013 17Presented at STATA user's meet
2013,Mumbai
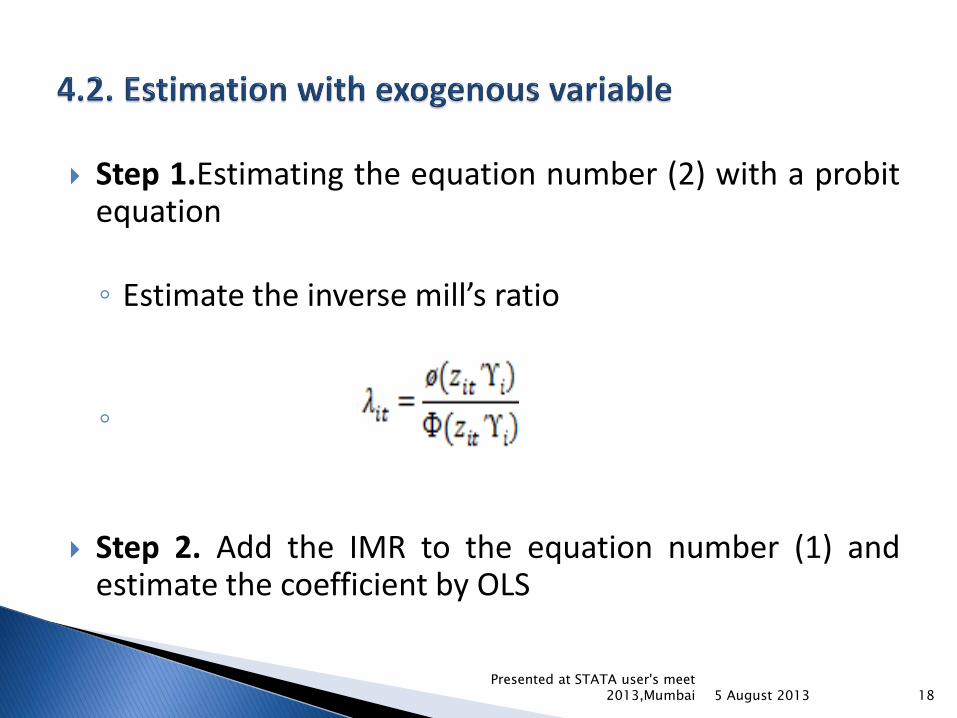
Step 1.Estimating the equation number (2) with a probitequation
◦ Estimate the inverse mill’s ratio
◦
Step 2. Add the IMR to the equation number (1) andestimate the coefficient by OLS
5 August 2013 18Presented at STATA user's meet
2013,Mumbai
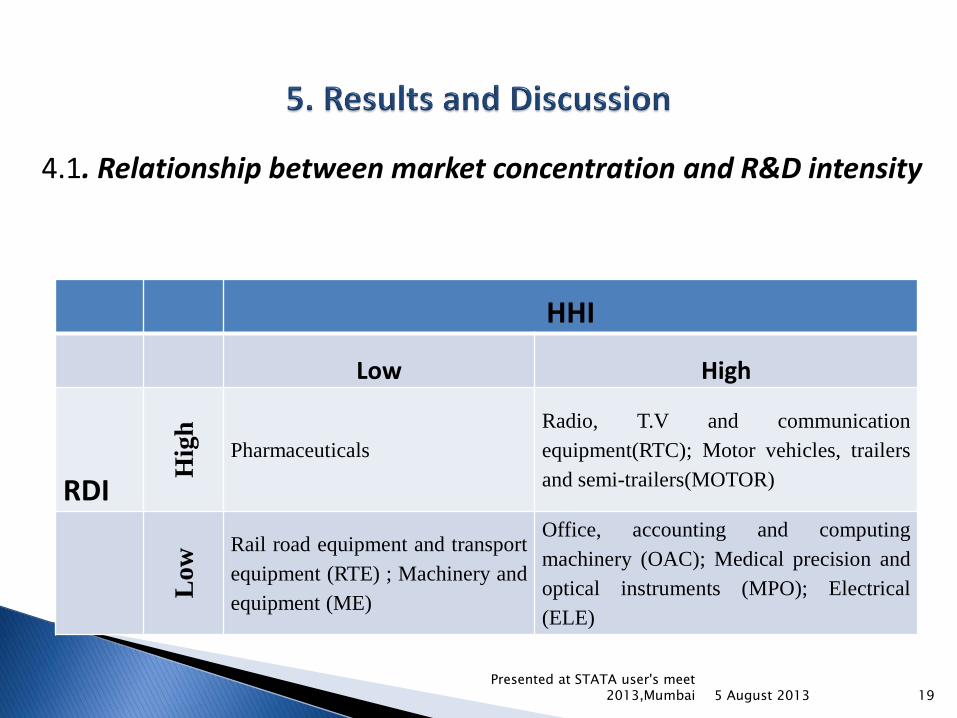
HHI
Low High
RDI
Hig
h
Pharmaceuticals
Radio, T.V and communication
equipment(RTC); Motor vehicles, trailers
and semi-trailers(MOTOR)
Low
Rail road equipment and transport
equipment (RTE) ; Machinery and
equipment (ME)
Office, accounting and computing
machinery (OAC); Medical precision and
optical instruments (MPO); Electrical
(ELE)
4.1. Relationship between market concentration and R&D intensity
5 August 2013 19Presented at STATA user's meet
2013,Mumbai
We have two part:
The probit model that explains the probability of R&Ddecision and
The OLS regression that explains the determinants of R&Dinvestment.
Introduce time and industry dummies
As an alternative R&D stock as a dependent variable
Negatively significant lambda value.
5 August 2013 20Presented at STATA user's meet
2013,Mumbai
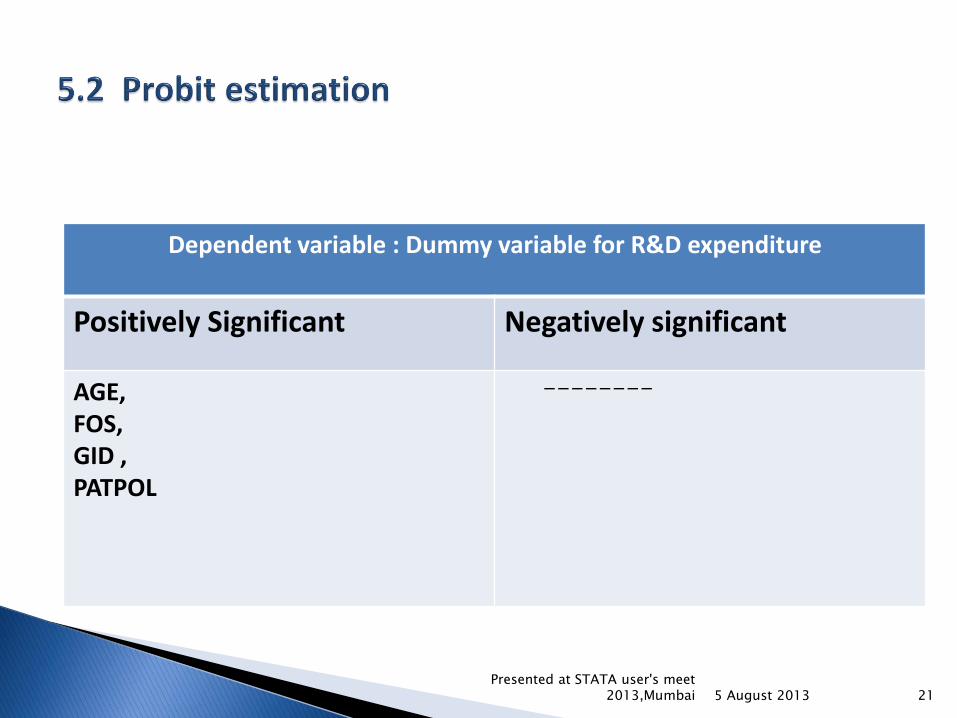
Dependent variable : Dummy variable for R&D expenditure
Positively Significant Negatively significant
AGE, FOS, GID ,PATPOL
--------
5 August 2013 21Presented at STATA user's meet
2013,Mumbai
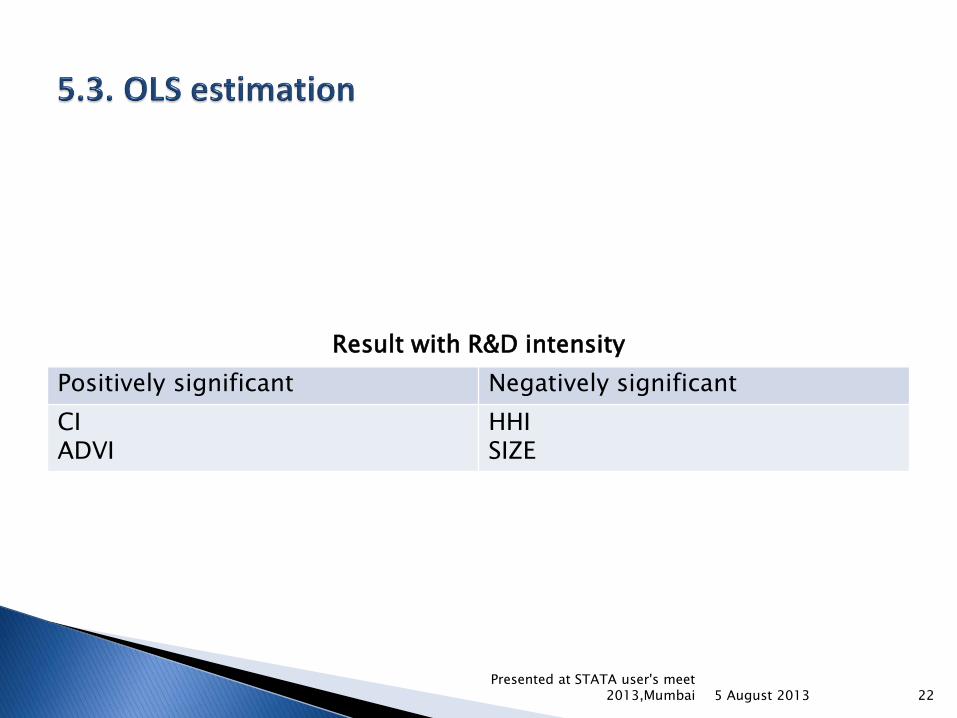
Result with R&D intensity
Positively significant Negatively significant
CIADVI
HHISIZE
5 August 2013 22Presented at STATA user's meet
2013,Mumbai
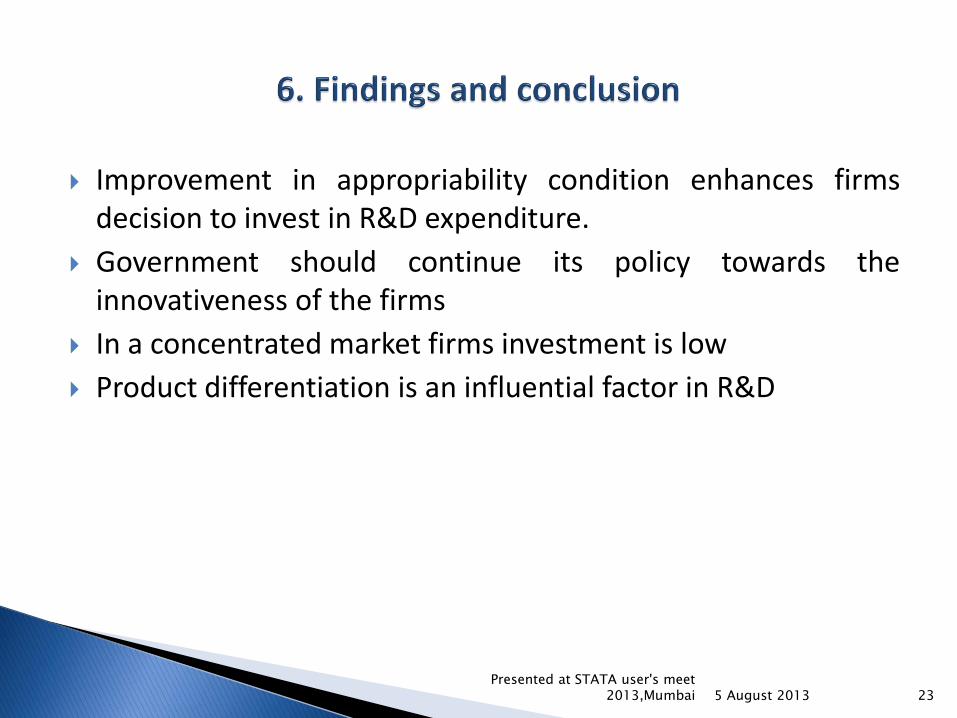
Improvement in appropriability condition enhances firmsdecision to invest in R&D expenditure.
Government should continue its policy towards theinnovativeness of the firms
In a concentrated market firms investment is low
Product differentiation is an influential factor in R&D
5 August 2013 23Presented at STATA user's meet
2013,Mumbai
Thank you
5 August 2013Presented at STATA user's meet
2013,Mumbai 24
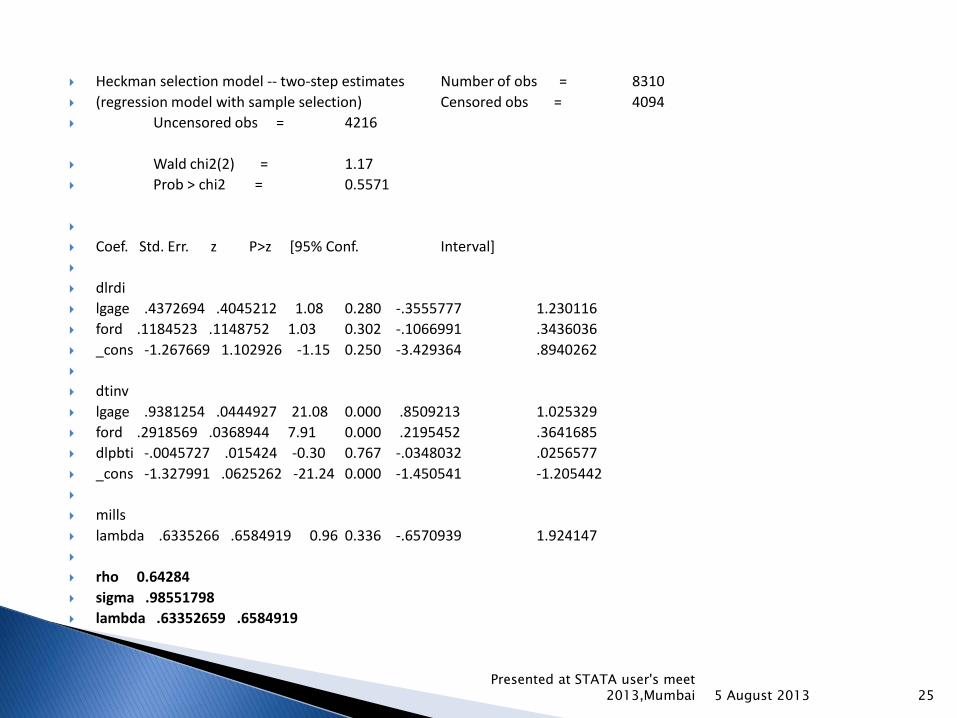
Heckman selection model -- two-step estimates Number of obs = 8310
(regression model with sample selection) Censored obs = 4094
Uncensored obs = 4216
Wald chi2(2) = 1.17
Prob > chi2 = 0.5571
Coef. Std. Err. z P>z [95% Conf. Interval]
dlrdi
lgage .4372694 .4045212 1.08 0.280 -.3555777 1.230116
ford .1184523 .1148752 1.03 0.302 -.1066991 .3436036
_cons -1.267669 1.102926 -1.15 0.250 -3.429364 .8940262
dtinv
lgage .9381254 .0444927 21.08 0.000 .8509213 1.025329
ford .2918569 .0368944 7.91 0.000 .2195452 .3641685
dlpbti -.0045727 .015424 -0.30 0.767 -.0348032 .0256577
_cons -1.327991 .0625262 -21.24 0.000 -1.450541 -1.205442
mills
lambda .6335266 .6584919 0.96 0.336 -.6570939 1.924147
rho 0.64284
sigma .98551798
lambda .63352659 .6584919
5 August 2013Presented at STATA user's meet
2013,Mumbai 25