sunday%20times%20september%202012%20%20poll
DESCRIPTION
http://banda.ie/assets/files/Sunday%20Times%20September%202012%20%20Poll.pdfTRANSCRIPT

Sunday Times
/Behaviour &
Attitudes September 2012
Opinion Poll 4th – 9th September, 2012
Prepared for
Prepared by Ian McShane
J.3985

Technical Appendix

3
Technical Appendix
The results of this opinion poll are based upon a representative sample of 923
eligible Irish voters aged 18 years +.
As such, the results can be deemed to be accurate to within plus or minus 3.3
percentage points at the 95% confidence level.
Fieldwork was conducted over the period Tuesday 4th – Sunday 9th September, 2012,
with interviewing carried out at the Behaviour & Attitudes Computer Aided
Telephone Interviewing (CATI) Unit at Milltown House in Dublin.
Interviewing was conducted across all 43 constituencies in the country with
households selected for interview by way of Random Digit Dialling (RDD).
The sample is split across RDD landline numbers and RDD mobile telephone numbers,
so as to ensure that individuals living in landline only households, mobile only
households, and households with both a landline and mobile telephone are
represented in their correct proportions.

4
Technical Appendix
The subsequent survey results are weighted to reflect the known demographic profile
of Irish adults, utilising the most recently published census population estimates
from the Central Statistics Office (CSO).
Party support levels are subsequently realigned in accordance with a technical
adjustment factor, designed to smooth the effects of extreme highs and lows in
support levels for individual parties as measured at a single point in time, and taking
variable election day turnout levels into account.
All aspects of the survey, including the Party Support adjustment factor, are
implemented in accordance with the technical and ethical guidelines set down by the
Association of Irish Market Research Organisations (AIMRO) and the European Society
of Opinion & Market Research (ESOMAR).

Charted Summary

6
Sunday Times/Behaviour & Attitudes Government
and Party Leader Satisfaction Levels
12th
February
2011 (f/w: 31st
Jan – 12th
Feb, 2011)
24th
August,
2011 (f/w 16th –
24th August,
2011)
2nd
October,
2011 (f/w 20th
Sept – 2nd
Oct, 2011)
18th
October,
2011 (f/w 16th –
18th Oct,
2011)
12th Dec.
2011 (f/w 7th-12th
Dec, 2011)
20th
February
2012 (f/w 15th –
20th Feb.
2012)
17th
April,
2012 (f/w 11th –
17th Apr.
2012)
23rd May
2012 (f/w 18th –
23rd May,
2012)
9th Sept.
2012 (f/w
4th -9th
Sept 2012)
The
Government
5% 42% 34% 36% 26% 26% 29% 31% 24%
Micheál
Martin
43% 40% 31% 36% 40% 33% 34% 41% 34%
Enda Kenny 40% 62% 51% 58% 44% 41% 47% 42% 38%
Eamon
Gilmore
55% 52% 43% 46% 35% 34% 37% 32% 34%
Gerry Adams 40% 48% 50% 50% 48% 46% 43% 42% 39%
Eamon Ryan - 34% 30% 30% 30% 25% 29% 29% 27%
Q.2
Q.3
Would you say you are satisfied or dissatisfied with the manner in which the Government is running the
country?
Would you say you are satisfied or dissatisfied with the way (…..) is doing his job as (…….)?
7
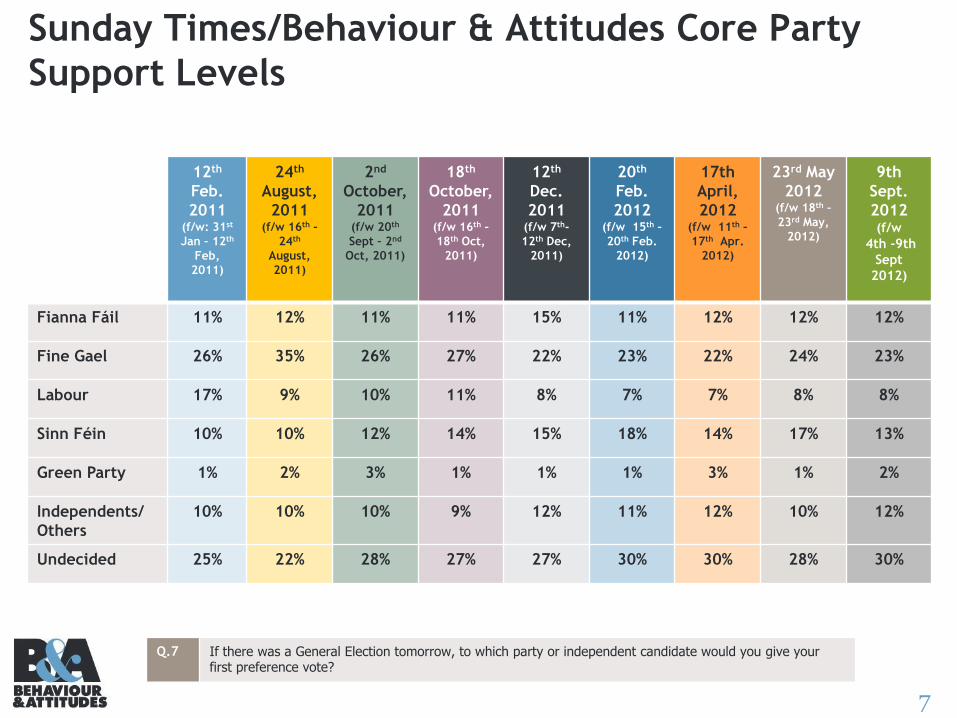
Sunday Times/Behaviour & Attitudes Core Party
Support Levels
12th
Feb.
2011 (f/w: 31st
Jan – 12th
Feb,
2011)
24th
August,
2011 (f/w 16th –
24th
August,
2011)
2nd
October,
2011 (f/w 20th
Sept – 2nd
Oct, 2011)
18th
October,
2011 (f/w 16th –
18th Oct,
2011)
12th
Dec.
2011 (f/w 7th-
12th Dec,
2011)
20th
Feb.
2012 (f/w 15th –
20th Feb.
2012)
17th
April,
2012 (f/w 11th –
17th Apr.
2012)
23rd May
2012 (f/w 18th –
23rd May,
2012)
9th
Sept.
2012 (f/w
4th -9th
Sept
2012)
Fianna Fáil 11% 12% 11% 11% 15% 11% 12% 12% 12%
Fine Gael 26% 35% 26% 27% 22% 23% 22% 24% 23%
Labour 17% 9% 10% 11% 8% 7% 7% 8% 8%
Sinn Féin 10% 10% 12% 14% 15% 18% 14% 17% 13%
Green Party 1% 2% 3% 1% 1% 1% 3% 1% 2%
Independents/
Others
10% 10% 10% 9% 12% 11% 12% 10% 12%
Undecided 25% 22% 28% 27% 27% 30% 30% 28% 30%
Q.7 If there was a General Election tomorrow, to which party or independent candidate would you give your first preference vote?

8
Sunday Times/Behaviour & Attitudes Party Support
Levels (Excluding Undecideds - Unadjusted)
12th
February
, 2011 (f/w: 31st
Jan – 12th
Feb, 2011)
General
Election
Result
25th
February
24th
August,
2011 (f/w 16th –
24th August,
2011)
2nd
October,
2011 (f/w 20th
Sept – 2nd
Oct, 2011)
18th
October,
2011 (f/w 16th –
18th Oct,
2011)
12th Dec.
2011 (f/w 7th-12th
Dec, 2011)
20th
February,
2012 (f/w 15th –
20th Feb.
2012)
17th
April,
2012 (f/w 11th –
17th Apr.
2012)
23rd May
2012 (f/w 18th –
23rd May,
2012)
9th Sept.
2012 (f/w
4th -9th
Sept 2012)
Fianna Fáil 15% 17% 15% 15% 15% 20% 16% 17% 17% 18%
Fine Gael 34% 36% 44% 36% 37% 30% 32% 32% 33% 33%
Labour 23% 19% 12% 14% 15% 11% 10% 10% 11% 11%
Sinn Féin 14% 10% 13% 17% 19% 21% 25% 20% 23% 19%
Green Party 2% 2% 2% 4% 1% 3% 2% 5% 1% 2%
Independent
/Others
14% 16% 12% 13% 13% 15% 15% 17% 14% 17%
Q.7 If there was a General Election tomorrow, to which party or independent candidate would you give your first preference vote?

9
Party Support Adjustment Factor: Technical
Note
Predicting election results on the basis of poll data is not an exact science. All the
evidence shows that support for individual parties can swing dramatically in the
period between elections- very often outside the bounds of historic election results.
Generally speaking one expects support for Government parties to decline in mid
term with a corresponding rise in support for the Opposition. This is, of course,
particularly true when times are tough.
The present situation is compounded by the fact that we have a coalition
Government with quite different patterns of response among the constituent parties.
Fine Gael voters are - by and large - behind Mr. Kenny and the performance of his
Government. The same cannot be said for Labour and Mr. Gilmore. In these
circumstances one might expect a greater swing in mood against Labour: with the
opposition parties sharing a common base with them most likely to benefit.

10
Party Support Adjustment Factor: Technical
Note
What to do in these circumstances? Most polling companies in Britain and Ireland
publish their raw survey results as an index of fluctuations in the emotional mood of
voters. They also build in an adjustment based on a number of factors. Where we
have reports of how people voted in the last general election as well as how they
intend to vote in the next one we can use these data to model the likely level of
swing from the last election results.
We then add back in the forecasts of voters who have not voted last time or do not
answer that particular question.
Finally we take into account each individuals stated likelihood of voting in a
forthcoming General Election.
This is the basis of the adjusted voting forecast in Behaviour & Attitudes polls.

11
Party Support Levels (Excluding Undecided - Adjusted)
Adjusted figures based on:
All who state they would definitely vote
Weighting of those respondents who give a definite answer as to who they would vote for in a
general election and who they voted for in the last election, in line with the result of the last
election.
Making no adjustment to stated voting intention of those who do not indicate how they voted in
last election.
2nd
October,
2011 (f/w 20th
Sept – 2nd
Oct, 2011)
18th
October,
2011 (f/w 16th –
18th Oct,
2011)
12th Dec.
2011 (f/w 7th-12th
Dec, 2011)
20th
February
, 2012 (f/w 15th –
20th Feb.
2012)
17th
April,
2012 (f/w 11th –
17th Apr.
2012)
23rd May
2012 (f/w 18th –
23rd May,
2012)
9th Sept.
2012 (f/w
4th -9th
Sept 2012)
Fianna Fáil 16% 14% 18% 16% 15% 16% 16%
Fine Gael 34% 35% 29% 33% 33% 33% 31%
Labour 16% 16% 12% 13% 14% 14% 14%
Sinn Féin 14% 17% 19% 20% 16% 17% 18%
Green Party 3% 1% 3% 2% 5% 2% 2%
Independents/
Others
17% 16% 18% 16% 18% 18% 19%
Q.7 If there was a General Election tomorrow, to which party or independent candidate would you give your first preference vote?

12
Support for Abortion Where Mother’s Life at Risk
Q.8 Would you or would you not support a change in the law to permit abortion in cases where the life of the
mother is at risk?
Base: All
Eligible Voters
Total
Gender Age Class Region Area
Male Female 18-34 35-54 55+ ABC1 C2DE F Dublin Leins
ter
Munster Conn/
Ulster
Urban Rural
Base: 923 449 474 298 344 281 430 458 35 253 239 251 179 624 299
% % % % % % % % % % % % % % %
Would support
change 80 82 77 83 81 74 82 78 81 82 83 79 74 79 81
Would not
support change 14 12 17 13 12 18 12 15 17 12 14 15 17 14 14
Don’t know 6 6 6 4 6 8 5 7 2 6 3 6 9 7 5

13
Support for Abortion Where Mother’s Life at Risk
Base: All Eligible
Voters
Total
Party Support
Fianna
Fail
Fine Gael Labour Green
Party
Sinn Fein Indep
endent/
Others
Would
not/ DK
Base: 923 121 214 84 14 114 113 263
% % % % % % % %
Would support
change 80 79 84 91 91 75 85 74
Would not support
change 14 20 11 6 9 17 11 17
Don’t know 6 1 5 3 - 8 4 10
Q.8 Would you or would you not support a change in the law to permit abortion in cases where the life of the
mother is at risk?

Commentary

15
Sunday Times/Behaviour & Attitudes
Opinion Poll Series Background
Interviewing for today’s poll took place over the period Tuesday 4th – Sunday 9th
September, 2012.
As such, fieldwork was conducted just over a week in advance of the resumption of the
Dail after the summer break, and just ahead of the Fine Gael and Labour Party think-ins
in Mayo and Kildare.
While the public has not been exposed to the day-to-day machinations of the political
system over the last couple of months, there has been an arguably greater volume of
media coverage of political issues this summer compared to the average holiday period.
Specifically, the last number of weeks has seen a number of public pronouncements from
senior coalition ministers concerning the sanctity or otherwise of the Croke Park
Agreement.
Indeed, seemingly contradictory comments from Fine Gael ministers on the one hand and
Labour spokespersons on the other in relation to the Croke Park agreement reportedly
caused enough alarm regarding the stability of the coalition to prompt a phone call from
the Troika to enquire if all was well!

16
Sunday Times/Behaviour & Attitudes
Opinion Poll Series
Background
At a broader level, Government spokespersons have been musing in public as to the
precise measures which may need to be taken in December’s Budget, from further cuts
in the health service to the likely value of the looming household charge.
Given all of the above, a drop in opinion poll support for the Government and both Fine
Gael and the Labour Party might reasonably have been expected in today’s survey
findings.
Certainly, it is reasonable to assume that this Government’s honeymoon period is now
well and truly over, and that its popularity with the electorate will be subjected to the
most severe pressure over the next few months as it faces the most difficult series of
decisions encountered by any Irish Government in living memory.

17
Sunday Times/Behaviour & Attitudes
Opinion Poll Series
Party Support and Leader Satisfaction Levels
Satisfaction with the Government has dropped by a considerable seven points since the
last comparable poll conducted at the end of May of this year.
This represents the lowest Government satisfaction rating registered for this
administration since the Sunday Times/Behaviour & Attitudes Opinion Poll series was
instigated in August of 2011.
The drop in satisfaction is most pronounced amongst older respondents (55 years+) who
tend to be the most sensitive to potential cuts in healthcare services and pension
entitlements. Support for the Government has also dropped ten percentage points
amongst the C2DE (skilled and unskilled manual workers, and those reliant on State
benefits) socio economic grouping. Furthermore, Government satisfaction has declined
nine points amongst Labour voters and seven points within the Fine Gael support base.
Of the two coalition party leaders, however, Enda Kenny as Taoiseach seems to have
attracted the greater degree of voter ire, with his satisfaction rating dropping four
points from 42% in May to 38% today.

18
Sunday Times/Behaviour & Attitudes
Opinion Poll Series
Party Support and Leader Satisfaction Levels
Kenny’s satisfaction level has dropped most significantly amongst the broad 35 years+
age cohort, the ABC1 white collar worker socio economic grouping, and has also declined
dramatically amongst both Fine Gael (-9%) and Labour (-10%) party supporters.
Conversely, Eamon Gilmore’s rating as Tánaiste has increased (albeit statistically
insignificantly) by two points over the last three months or so, and he is now viewed
almost as favourably as Enda Kenny as Taoiseach and Gerry Adams as leader of Sinn Féin
at a national level.
All of Gilmore’s increased satisfaction has emanated from Fine Gael and Labour voters,
and 35-54 year olds. Last May’s poll saw Micheál Martin’s personal rating increase seven
percentage points from the previous poll to stand at its highest level (41%) since just
after he was elected leader of Fianna Fáil in January 2011.
At the time, we attributed this increase to his heightened profile as part of Fianna Fáil’s
campaign for a yes vote in the Fiscal Treaty Referendum.

19
Sunday Times/Behaviour & Attitudes
Opinion Poll Series
Party Support and Leader Satisfaction Levels
It will be particularly disappointing for Fianna Fáil, therefore, to witness Martin’s rating
drop back seven points to just 34%, leaving him in joint third position with Eamon
Gilmore in the personal popularity stakes.
Of perhaps greatest concern to Micheál Martin is the fact that his rating has dropped
dramatically by sixteen points amongst Fianna Fáil party supporters. The Fianna Fáil
leader’s popularity is also significantly lower amongst females than males, and has also
dropped 15% amongst 18-34 year olds, suggesting that he is in danger of losing touch
with younger voters as many of them seek an alternative to the establishment parties in
this post-Celtic Tiger era.
While Gerry Adam’s rating as leader of Sinn Féin is the highest of all five party leaders
measured (at 39%), it has been declining consistently since its highs of 50% this time last
year.
The Republican leader’s most recent drop of three percentage points since the last poll
is most pronounced amongst males, those aged 35-54 years, white collar ABC1 workers,
and Labour Party supporters.

20
Sunday Times/Behaviour & Attitudes
Opinion Poll Series
Party Support and Leader Satisfaction Levels
Perhaps aligned to Micheál Martin’s drop in satisfaction amongst his own party base, we
do see Adam’s satisfaction rating increase by a significant eleven percentage points
amongst those indicating they are currently disposed to vote for the Soldiers of Destiny.
Finally, Eamon Ryan’s personal rating of 27% is in or around that which he has been
garnering over the course of this opinion Poll series, and peaks amongst 18-34 year olds
and females.

21
Sunday Times/Behaviour & Attitudes
Opinion Poll Series
Support for Abortion
Respondents in today’s poll were also asked whether they would or would not support a
change in the law to permit abortion in cases where the life of the mother is at risk.
In response, eight in ten of all eligible Irish voters suggested that they would support a
change in the law, a figure which is highest amongst males, those aged 18-54 years,
ABC1 white collar workers, and people living in the Greater Dublin area.
Resistance to such a change in the law is, on the other hand, highest among Fianna Fáil
(20% opposed to a change in the law to permit abortion) and Sinn Féin (17% opposed)
party supporters.

Tabular Report

SeptemberTeleBar 2012 Sunday Times/Behaviour & Attitudes Opinion Poll
J3719
Table 1 Fieldwork : 4th - 9th September 2012 Page 1
Q1 Are you eligible to vote in Irish General Elections, or not?
Base : All Irish Adults 18+ Total Gender Age Class Region Area Party Support
Male Female 18-34 35-54 55+ ABC1 C2DE F Dublin Lein-ster
Mun-ster
Conn/Ulster
Urban Rural FiannaFail
Fine Gael
Lab-our
Green Party
Sinn Fein
Indep/Others
Wouldnot/DK
Weighted Total 3,421 1,676 1,745 1,163 1,262 996 1,375 1,793 253 988 869 944 618 2,092 1,329 409 739 246 69 440 404 1,114
Unweighted Total 979 482 497 338 359 282 462 480 37 276 253 268 181 670 309 126 217 85 20 117 119 295
Yes, eligible 3,227 1,552 1,676 1,038 1,196 994 1,258 1,728 242 897 828 886 613 1,939 1,288 396 730 244 54 432 387 984
94% 93% 96% 89% 95% 100% 91% 96% 96% 91% 95% 94% 99% 93% 97% 97% 99% 99% 78% 98% 96% 88%
No – not eligible 145 90 55 88 55 2 101 32 11 81 23 39 1 118 26 8 9 1 13 7 8 98
4% 5% 3% 8% 4% 0% 7% 2% 4% 8% 3% 4% 0% 6% 2% 2% 1% 1% 18% 2% 2% 9%
Don’t know 49 35 14 37 11 - 16 33 - 9 17 19 3 35 14 5 - - 3 2 8 31
1% 2% 1% 3% 1% - 1% 2% - 1% 2% 2% 0% 2% 1% 1% - - 4% 0% 2% 3%

SeptemberTeleBar 2012 Sunday Times/Behaviour & Attitudes Opinion Poll
J3719
Table 1 Fieldwork : 4th - 9th September 2012 Page 2
Q1 Are you eligible to vote in Irish General Elections, or not?
Base : All Irish Adults 18+ Total Likelihood
Wouldvote
Woulddefinitely vote
Wouldprobably vote
Might/might not
Wouldnot Vote
Weighted Total 3,421 2,754 2,278 476 122 503
Unweighted Total 979 792 661 131 43 133
Yes, eligible 3,227 2,651 2,227 424 114 430
94% 96% 98% 89% 93% 85%
No – not eligible 145 76 43 33 4 56
4% 3% 2% 7% 3% 11%
Don’t know 49 28 9 19 5 17
1% 1% 0% 4% 4% 3%

SeptemberTeleBar 2012 Sunday Times/Behaviour & Attitudes Opinion Poll
J3719
Table 2 Fieldwork : 4th - 9th September 2012 Page 3
Q2 Would you say you are satisfied or dissatisfied with the manner in which the Government is running the country?
Base : All Irish Voters Total Gender Age Class Region Area Party Support
Male Female 18-34 35-54 55+ ABC1 C2DE F Dublin Lein-ster
Mun-ster
Conn/Ulster
Urban Rural FiannaFail
Fine Gael
Lab-our
Green Party
Sinn Fein
Indep/Others
Wouldnot/DK
Weighted Total 3,227 1,552 1,676 1,038 1,196 994 1,258 1,728 242 897 828 886 613 1,939 1,288 396 730 244 54 432 387 984
Unweighted Total 923 449 474 298 344 281 430 458 35 253 239 251 179 624 299 121 214 84 14 114 113 263
Satisfied 763 469 294 256 243 264 375 285 103 204 175 216 165 445 318 40 412 78 6 33 45 149
24% 30% 18% 25% 20% 27% 30% 17% 42% 23% 21% 24% 27% 23% 25% 10% 56% 32% 11% 8% 12% 15%
Dissatisfied 2,316 993 1,323 698 925 693 819 1,358 139 654 586 645 430 1,407 908 352 287 159 40 389 335 753
72% 64% 79% 67% 77% 70% 65% 79% 58% 73% 71% 73% 70% 73% 71% 89% 39% 65% 74% 90% 87% 77%
No opinion 148 90 59 83 27 38 64 84 - 39 67 25 18 87 61 4 32 7 8 9 7 82
5% 6% 3% 8% 2% 4% 5% 5% - 4% 8% 3% 3% 4% 5% 1% 4% 3% 15% 2% 2% 8%

SeptemberTeleBar 2012 Sunday Times/Behaviour & Attitudes Opinion Poll
J3719
Table 2 Fieldwork : 4th - 9th September 2012 Page 4
Q2 Would you say you are satisfied or dissatisfied with the manner in which the Government is running the country?
Base : All Irish Voters Total Likelihood
Wouldvote
Woulddefinitely vote
Wouldprobably vote
Might/might not
Wouldnot Vote
Weighted Total 3,227 2,651 2,227 424 114 430
Unweighted Total 923 768 653 115 39 108
Satisfied 763 687 572 115 15 58
24% 26% 26% 27% 13% 13%
Dissatisfied 2,316 1,847 1,569 278 96 344
72% 70% 70% 66% 85% 80%
No opinion 148 118 86 31 2 29
5% 4% 4% 7% 2% 7%

SeptemberTeleBar 2012 Sunday Times/Behaviour & Attitudes Opinion Poll
J3719
Table 3 Fieldwork : 4th - 9th September 2012 Page 5
Q3 Would you say you are satisfied or dissatisfied with the way Mr. Kenny is doing his job as Taoiseach?
Base : All Irish Voters Total Gender Age Class Region Area Party Support
Male Female 18-34 35-54 55+ ABC1 C2DE F Dublin Lein-ster
Mun-ster
Conn/Ulster
Urban Rural FiannaFail
Fine Gael
Lab-our
Green Party
Sinn Fein
Indep/Others
Wouldnot/DK
Weighted Total 3,227 1,552 1,676 1,038 1,196 994 1,258 1,728 242 897 828 886 613 1,939 1,288 396 730 244 54 432 387 984
Unweighted Total 923 449 474 298 344 281 430 458 35 253 239 251 179 624 299 121 214 84 14 114 113 263
Satisfied 1,240 666 573 424 423 392 557 553 130 347 309 321 259 708 532 68 558 123 11 101 103 277
38% 43% 34% 41% 35% 39% 44% 32% 54% 39% 37% 36% 42% 36% 41% 17% 76% 50% 20% 23% 26% 28%
Dissatisfied 1,795 779 1,016 493 740 562 610 1,073 112 500 439 526 331 1,108 687 320 152 111 35 310 269 597
56% 50% 61% 48% 62% 57% 48% 62% 46% 56% 53% 59% 54% 57% 53% 81% 21% 46% 65% 72% 69% 61%
No opinion 193 106 87 120 32 40 91 102 - 50 80 39 23 124 69 8 20 10 8 20 16 111
6% 7% 5% 12% 3% 4% 7% 6% - 6% 10% 4% 4% 6% 5% 2% 3% 4% 15% 5% 4% 11%

SeptemberTeleBar 2012 Sunday Times/Behaviour & Attitudes Opinion Poll
J3719
Table 3 Fieldwork : 4th - 9th September 2012 Page 6
Q3 Would you say you are satisfied or dissatisfied with the way Mr. Kenny is doing his job as Taoiseach?
Base : All Irish Voters Total Likelihood
Wouldvote
Woulddefinitely vote
Wouldprobably vote
Might/might not
Wouldnot Vote
Weighted Total 3,227 2,651 2,227 424 114 430
Unweighted Total 923 768 653 115 39 108
Satisfied 1,240 1,139 944 195 33 61
38% 43% 42% 46% 29% 14%
Dissatisfied 1,795 1,409 1,231 178 74 289
56% 53% 55% 42% 65% 67%
No opinion 193 102 51 52 6 81
6% 4% 2% 12% 5% 19%

SeptemberTeleBar 2012 Sunday Times/Behaviour & Attitudes Opinion Poll
J3719
Table 4 Fieldwork : 4th - 9th September 2012 Page 7
Q4 Would you say you are satisfied or dissatisfied with the way Mr. Gilmore is doing his job as Tanaiste?
Base : All Irish Voters Total Gender Age Class Region Area Party Support
Male Female 18-34 35-54 55+ ABC1 C2DE F Dublin Lein-ster
Mun-ster
Conn/Ulster
Urban Rural FiannaFail
Fine Gael
Lab-our
Green Party
Sinn Fein
Indep/Others
Wouldnot/DK
Weighted Total 3,227 1,552 1,676 1,038 1,196 994 1,258 1,728 242 897 828 886 613 1,939 1,288 396 730 244 54 432 387 984
Unweighted Total 923 449 474 298 344 281 430 458 35 253 239 251 179 624 299 121 214 84 14 114 113 263
Satisfied 1,083 549 534 351 393 338 443 508 132 292 244 316 229 635 447 73 469 128 22 126 78 187
34% 35% 32% 34% 33% 34% 35% 29% 55% 32% 29% 36% 37% 33% 35% 18% 64% 53% 40% 29% 20% 19%
Dissatisfied 1,767 804 963 484 708 576 634 1,033 101 486 450 517 315 1,075 692 303 223 107 24 268 258 584
55% 52% 57% 47% 59% 58% 50% 60% 42% 54% 54% 58% 51% 55% 54% 77% 31% 44% 45% 62% 67% 59%
No opinion 377 199 179 203 94 80 181 188 9 120 134 53 70 229 148 20 38 9 8 38 52 213
12% 13% 11% 20% 8% 8% 14% 11% 4% 13% 16% 6% 11% 12% 12% 5% 5% 4% 15% 9% 13% 22%

SeptemberTeleBar 2012 Sunday Times/Behaviour & Attitudes Opinion Poll
J3719
Table 4 Fieldwork : 4th - 9th September 2012 Page 8
Q4 Would you say you are satisfied or dissatisfied with the way Mr. Gilmore is doing his job as Tanaiste?
Base : All Irish Voters Total Likelihood
Wouldvote
Woulddefinitely vote
Wouldprobably vote
Might/might not
Wouldnot Vote
Weighted Total 3,227 2,651 2,227 424 114 430
Unweighted Total 923 768 653 115 39 108
Satisfied 1,083 976 837 139 30 73
34% 37% 38% 33% 27% 17%
Dissatisfied 1,767 1,406 1,194 212 67 267
55% 53% 54% 50% 59% 62%
No opinion 377 269 195 73 16 90
12% 10% 9% 17% 14% 21%

SeptemberTeleBar 2012 Sunday Times/Behaviour & Attitudes Opinion Poll
J3719
Table 5 Fieldwork : 4th - 9th September 2012 Page 9
Q5 Would you say you are satisfied or dissatisfied with the way Mr. Martin is doing his job as leader of Fianna Fail?
Base : All Irish Voters Total Gender Age Class Region Area Party Support
Male Female 18-34 35-54 55+ ABC1 C2DE F Dublin Lein-ster
Mun-ster
Conn/Ulster
Urban Rural FiannaFail
Fine Gael
Lab-our
Green Party
Sinn Fein
Indep/Others
Wouldnot/DK
Weighted Total 3,227 1,552 1,676 1,038 1,196 994 1,258 1,728 242 897 828 886 613 1,939 1,288 396 730 244 54 432 387 984
Unweighted Total 923 449 474 298 344 281 430 458 35 253 239 251 179 624 299 121 214 84 14 114 113 263
Satisfied 1,108 571 537 295 407 406 437 571 100 251 285 366 204 614 495 251 310 87 12 108 111 229
34% 37% 32% 28% 34% 41% 35% 33% 41% 28% 34% 41% 33% 32% 38% 63% 42% 36% 23% 25% 29% 23%
Dissatisfied 1,675 752 923 539 638 498 601 934 139 507 406 450 312 1,046 629 117 338 139 27 282 240 532
52% 48% 55% 52% 53% 50% 48% 54% 58% 57% 49% 51% 51% 54% 49% 29% 46% 57% 51% 65% 62% 54%
No opinion 444 228 216 204 151 90 219 223 3 139 138 70 98 280 164 28 82 18 14 42 36 224
14% 15% 13% 20% 13% 9% 17% 13% 1% 15% 17% 8% 16% 14% 13% 7% 11% 7% 26% 10% 9% 23%

SeptemberTeleBar 2012 Sunday Times/Behaviour & Attitudes Opinion Poll
J3719
Table 5 Fieldwork : 4th - 9th September 2012 Page 10
Q5 Would you say you are satisfied or dissatisfied with the way Mr. Martin is doing his job as leader of Fianna Fail?
Base : All Irish Voters Total Likelihood
Wouldvote
Woulddefinitely vote
Wouldprobably vote
Might/might not
Wouldnot Vote
Weighted Total 3,227 2,651 2,227 424 114 430
Unweighted Total 923 768 653 115 39 108
Satisfied 1,108 997 854 143 29 76
34% 38% 38% 34% 26% 18%
Dissatisfied 1,675 1,321 1,139 182 58 280
52% 50% 51% 43% 51% 65%
No opinion 444 333 234 99 27 74
14% 13% 10% 23% 23% 17%

SeptemberTeleBar 2012 Sunday Times/Behaviour & Attitudes Opinion Poll
J3719
Table 6 Fieldwork : 4th - 9th September 2012 Page 11
Q6 Would you say you are satisfied or dissatisfied with the way Mr. Adams is doing his job as leader of Sinn Fein?
Base : All Irish Voters Total Gender Age Class Region Area Party Support
Male Female 18-34 35-54 55+ ABC1 C2DE F Dublin Lein-ster
Mun-ster
Conn/Ulster
Urban Rural FiannaFail
Fine Gael
Lab-our
Green Party
Sinn Fein
Indep/Others
Wouldnot/DK
Weighted Total 3,227 1,552 1,676 1,038 1,196 994 1,258 1,728 242 897 828 886 613 1,939 1,288 396 730 244 54 432 387 984
Unweighted Total 923 449 474 298 344 281 430 458 35 253 239 251 179 624 299 121 214 84 14 114 113 263
Satisfied 1,267 696 571 437 465 365 382 797 89 374 317 339 238 762 506 170 196 79 29 354 151 289
39% 45% 34% 42% 39% 37% 30% 46% 37% 42% 38% 38% 39% 39% 39% 43% 27% 32% 54% 82% 39% 29%
Dissatisfied 1,420 584 836 416 535 469 644 649 127 386 357 417 257 879 540 171 412 128 11 43 205 451
44% 38% 50% 40% 45% 47% 51% 38% 53% 43% 43% 47% 42% 45% 42% 43% 56% 52% 20% 10% 53% 46%
No opinion 540 272 269 184 195 161 232 282 26 137 154 129 119 298 242 55 122 38 14 34 32 245
17% 18% 16% 18% 16% 16% 18% 16% 11% 15% 19% 15% 19% 15% 19% 14% 17% 16% 26% 8% 8% 25%

SeptemberTeleBar 2012 Sunday Times/Behaviour & Attitudes Opinion Poll
J3719
Table 6 Fieldwork : 4th - 9th September 2012 Page 12
Q6 Would you say you are satisfied or dissatisfied with the way Mr. Adams is doing his job as leader of Sinn Fein?
Base : All Irish Voters Total Likelihood
Wouldvote
Woulddefinitely vote
Wouldprobably vote
Might/might not
Wouldnot Vote
Weighted Total 3,227 2,651 2,227 424 114 430
Unweighted Total 923 768 653 115 39 108
Satisfied 1,267 1,088 924 164 41 135
39% 41% 41% 39% 36% 31%
Dissatisfied 1,420 1,166 1,004 163 47 194
44% 44% 45% 38% 42% 45%
No opinion 540 397 299 98 25 101
17% 15% 13% 23% 22% 23%

SeptemberTeleBar 2012 Sunday Times/Behaviour & Attitudes Opinion Poll
J3719
Table 7 Fieldwork : 4th - 9th September 2012 Page 13
Q7 Would you say you are satisfied or dissatisfied with the way Mr. Ryan is doing his job as leader of The Green Party?
Base : All Irish Voters Total Gender Age Class Region Area Party Support
Male Female 18-34 35-54 55+ ABC1 C2DE F Dublin Lein-ster
Mun-ster
Conn/Ulster
Urban Rural FiannaFail
Fine Gael
Lab-our
Green Party
Sinn Fein
Indep/Others
Wouldnot/DK
Weighted Total 3,227 1,552 1,676 1,038 1,196 994 1,258 1,728 242 897 828 886 613 1,939 1,288 396 730 244 54 432 387 984
Unweighted Total 923 449 474 298 344 281 430 458 35 253 239 251 179 624 299 121 214 84 14 114 113 263
Satisfied 885 400 485 323 306 256 342 440 103 215 237 251 182 513 372 127 217 80 49 121 93 198
27% 26% 29% 31% 26% 26% 27% 25% 43% 24% 29% 28% 30% 26% 29% 32% 30% 33% 91% 28% 24% 20%
Dissatisfied 1,479 755 724 430 591 458 555 791 133 402 394 423 257 891 588 192 323 114 5 196 230 418
46% 49% 43% 41% 49% 46% 44% 46% 55% 45% 48% 48% 42% 46% 46% 49% 44% 47% 9% 45% 59% 42%
No opinion 864 397 467 284 299 281 361 496 6 280 197 212 175 535 328 77 190 50 - 114 64 368
27% 26% 28% 27% 25% 28% 29% 29% 2% 31% 24% 24% 28% 28% 25% 19% 26% 21% - 27% 16% 37%

SeptemberTeleBar 2012 Sunday Times/Behaviour & Attitudes Opinion Poll
J3719
Table 7 Fieldwork : 4th - 9th September 2012 Page 14
Q7 Would you say you are satisfied or dissatisfied with the way Mr. Ryan is doing his job as leader of The Green Party?
Base : All Irish Voters Total Likelihood
Wouldvote
Woulddefinitely vote
Wouldprobably vote
Might/might not
Wouldnot Vote
Weighted Total 3,227 2,651 2,227 424 114 430
Unweighted Total 923 768 653 115 39 108
Satisfied 885 773 664 110 35 70
27% 29% 30% 26% 31% 16%
Dissatisfied 1,479 1,167 983 184 51 250
46% 44% 44% 43% 45% 58%
No opinion 864 710 580 130 28 110
27% 27% 26% 31% 24% 26%

SeptemberTeleBar 2012 Sunday Times/Behaviour & Attitudes Opinion Poll
J3719
Table 8 Fieldwork : 4th - 9th September 2012 Page 15
Q8 If there was a General Election tomorrow, to which party or independent candidate would you give your first preference vote?
Base : All Irish Voters Total Gender Age Class Region Area Party Support
Male Female 18-34 35-54 55+ ABC1 C2DE F Dublin Lein-ster
Mun-ster
Conn/Ulster
Urban Rural FiannaFail
Fine Gael
Lab-our
Green Party
Sinn Fein
Indep/Others
Wouldnot/DK
Weighted Total 3,227 1,552 1,676 1,038 1,196 994 1,258 1,728 242 897 828 886 613 1,939 1,288 396 730 244 54 432 387 984
Unweighted Total 923 449 474 298 344 281 430 458 35 253 239 251 179 624 299 121 214 84 14 114 113 263
Fianna Fail 396 228 168 101 149 147 133 227 36 62 85 169 80 214 181 396 - - - - - -
12% 15% 10% 10% 12% 15% 11% 13% 15% 7% 10% 19% 13% 11% 14% 100% - - - - - -
Fine Gael 730 392 338 247 254 228 351 288 92 167 177 222 164 397 333 - 730 - - - - -
23% 25% 20% 24% 21% 23% 28% 17% 38% 19% 21% 25% 27% 20% 26% - 100% - - - - -
Labour 244 142 102 91 81 73 151 93 - 122 45 59 15 187 57 - - 244 - - - -
8% 9% 6% 9% 7% 7% 12% 5% - 14% 5% 7% 2% 10% 4% - - 100% - - - -
Green Party 54 19 35 21 23 10 12 42 - 13 4 13 24 46 7 - - - 54 - - -
2% 1% 2% 2% 2% 1% 1% 2% - 1% 0% 1% 4% 2% 1% - - - 100% - - -
Sinn Fein 432 218 213 180 170 81 107 319 6 147 103 91 91 296 136 - - - - 432 - -
13% 14% 13% 17% 14% 8% 8% 18% 3% 16% 12% 10% 15% 15% 11% - - - - 100% - -
Independent/Other 387 185 203 76 175 136 188 179 21 144 122 88 33 236 152 - - - - - 387 -
12% 12% 12% 7% 15% 14% 15% 10% 9% 16% 15% 10% 5% 12% 12% - - - - - 100% -
Don’t know 682 246 436 239 240 203 243 397 43 199 202 140 141 417 265 - - - - - - 682
21% 16% 26% 23% 20% 20% 19% 23% 18% 22% 24% 16% 23% 21% 21% - - - - - - 69%
Would not vote 302 122 180 83 103 116 75 184 43 43 90 104 65 146 156 - - - - - - 302
9% 8% 11% 8% 9% 12% 6% 11% 18% 5% 11% 12% 11% 8% 12% - - - - - - 31%

SeptemberTeleBar 2012 Sunday Times/Behaviour & Attitudes Opinion Poll
J3719
Table 8 Fieldwork : 4th - 9th September 2012 Page 16
Q8 If there was a General Election tomorrow, to which party or independent candidate would you give your first preference vote?
Base : All Irish Voters Total Likelihood
Wouldvote
Woulddefinitely vote
Wouldprobably vote
Might/might not
Wouldnot Vote
Weighted Total 3,227 2,651 2,227 424 114 430
Unweighted Total 923 768 653 115 39 108
Fianna Fail 396 341 298 43 21 33
12% 13% 13% 10% 19% 8%
Fine Gael 730 697 605 91 13 21
23% 26% 27% 22% 11% 5%
Labour 244 227 211 17 8 9
8% 9% 9% 4% 7% 2%
Green Party 54 34 28 6 4 16
2% 1% 1% 1% 3% 4%
Sinn Fein 432 398 342 57 3 30
13% 15% 15% 13% 3% 7%
Independent/Other 387 326 285 40 10 47
12% 12% 13% 9% 9% 11%
Don’t know 682 566 425 141 52 58
21% 21% 19% 33% 45% 14%
Would not vote 302 62 32 30 3 216
9% 2% 1% 7% 2% 50%

SeptemberTeleBar 2012 Sunday Times/Behaviour & Attitudes Opinion Poll
J3719
Table 9 Fieldwork : 4th - 9th September 2012 Page 17
Q8 If there was a General Election tomorrow, to which party or independent candidate would you give your first preference vote?
Base : All Irish VotersAll voters excluding undecided
Total Gender Age Class Region Area Party Support
Male Female 18-34 35-54 55+ ABC1 C2DE F Dublin Lein-ster
Mun-ster
Conn/Ulster
Urban Rural FiannaFail
Fine Gael
Lab-our
Green Party
Sinn Fein
Indep/Others
Wouldnot/DK
Weighted Total 2,243 1,184 1,059 716 852 675 940 1,147 156 655 537 642 407 1,377 866 396 730 244 54 432 387 -
Unweighted Total 660 348 312 211 248 201 325 311 24 191 164 185 119 451 209 121 214 84 14 114 113 -
Fianna Fail 396 228 168 101 149 147 133 227 36 62 85 169 80 214 181 396 - - - - - -
18% 19% 16% 14% 17% 22% 14% 20% 23% 9% 16% 26% 20% 16% 21% 100% - - - - - -
Fine Gael 730 392 338 247 254 228 351 288 92 167 177 222 164 397 333 - 730 - - - - -
33% 33% 32% 35% 30% 34% 37% 25% 59% 26% 33% 35% 40% 29% 38% - 100% - - - - -
Labour 244 142 102 91 81 73 151 93 - 122 45 59 15 187 57 - - 244 - - - -
11% 12% 10% 13% 9% 11% 16% 8% - 19% 8% 9% 4% 14% 7% - - 100% - - - -
Green Party 54 19 35 21 23 10 12 42 - 13 4 13 24 46 7 - - - 54 - - -
2% 2% 3% 3% 3% 1% 1% 4% - 2% 1% 2% 6% 3% 1% - - - 100% - - -
Sinn Fein 432 218 213 180 170 81 107 319 6 147 103 91 91 296 136 - - - - 432 - -
19% 18% 20% 25% 20% 12% 11% 28% 4% 22% 19% 14% 22% 21% 16% - - - - 100% - -
Independent/Other 387 185 203 76 175 136 188 179 21 144 122 88 33 236 152 - - - - - 387 -
17% 16% 19% 11% 21% 20% 20% 16% 14% 22% 23% 14% 8% 17% 18% - - - - - 100% -

SeptemberTeleBar 2012 Sunday Times/Behaviour & Attitudes Opinion Poll
J3719
Table 9 Fieldwork : 4th - 9th September 2012 Page 18
Q8 If there was a General Election tomorrow, to which party or independent candidate would you give your first preference vote?
Base : All Irish VotersAll voters excluding undecided
Total Likelihood
Wouldvote
Woulddefinitely vote
Wouldprobably vote
Might/might not
Wouldnot Vote
Weighted Total 2,243 2,023 1,770 254 59 156
Unweighted Total 660 599 530 69 23 36
Fianna Fail 396 341 298 43 21 33
18% 17% 17% 17% 36% 21%
Fine Gael 730 697 605 91 13 21
33% 34% 34% 36% 21% 13%
Labour 244 227 211 17 8 9
11% 11% 12% 7% 13% 6%
Green Party 54 34 28 6 4 16
2% 2% 2% 3% 7% 10%
Sinn Fein 432 398 342 57 3 30
19% 20% 19% 22% 5% 19%
Independent/Other 387 326 285 40 10 47
17% 16% 16% 16% 17% 30%

SeptemberTeleBar 2012 Sunday Times/Behaviour & Attitudes Opinion Poll
J3719
Table 10 Fieldwork : 4th - 9th September 2012 Page 19
Adjusted Party Support : Q8 If there was a General Election tomorrow, to which party or independent candidate would you give your first preference vote?
Total Gender Age Class Region Area Party Support
Male Female 18-34 35-54 55+ ABC1 C2DE F Dublin Lein-ster
Mun-ster
Conn/Ulster
Urban Rural FiannaFail
Fine Gael
Lab-our
Green Party
Sinn Fein
Indep/Others
Wouldnot/DK
Weighted Total 1,810 925 885 454 754 603 794 871 146 562 449 489 310 1,103 707 298 561 245 35 326 345 -
Unweighted Total 534 278 256 137 216 181 274 239 21 159 134 149 92 363 171 95 183 74 8 86 88 -
Fianna Fail 298 167 130 53 136 110 101 161 35 58 77 102 61 165 133 298 - - - - - -
16% 18% 15% 12% 18% 18% 13% 19% 24% 10% 17% 21% 20% 15% 19% 100% - - - - - -
Fine Gael 561 301 260 151 212 198 286 195 79 119 123 190 129 283 278 - 561 - - - - -
31% 33% 29% 33% 28% 33% 36% 22% 55% 21% 27% 39% 41% 26% 39% - 100% - - - - -
Labour 245 142 103 79 84 82 148 97 - 131 56 42 15 195 50 - - 245 - - - -
14% 15% 12% 17% 11% 14% 19% 11% - 23% 13% 9% 5% 18% 7% - - 100% - - - -
Green Party 35 12 23 7 14 15 9 26 - 11 - 6 18 30 6 - - - 35 - - -
2% 1% 3% 1% 2% 2% 1% 3% - 2% - 1% 6% 3% 1% - - - 100% - - -
Sinn Fein 326 148 178 115 131 80 81 242 4 107 81 76 61 218 108 - - - - 326 - -
18% 16% 20% 25% 17% 13% 10% 28% 3% 19% 18% 16% 20% 20% 15% - - - - 100% - -
Independent/Other 345 155 190 50 177 119 169 149 27 135 112 72 26 213 132 - - - - - 345 -
19% 17% 22% 11% 23% 20% 21% 17% 19% 24% 25% 15% 8% 19% 19% - - - - - 100% -

SeptemberTeleBar 2012 Sunday Times/Behaviour & Attitudes Opinion Poll
J3719
Table 10 Fieldwork : 4th - 9th September 2012 Page 20
Adjusted Party Support : Q8 If there was a General Election tomorrow, to which party or independent candidate would you give your first preference vote?
Total Likelihood
Wouldvote
Woulddefinitely vote
Wouldprobably vote
Might/might not
Wouldnot Vote
Weighted Total 1,810 1,810 1,810 - - -
Unweighted Total 534 534 534 - - -
Fianna Fail 298 298 298 - - -
16% 16% 16% - - -
Fine Gael 561 561 561 - - -
31% 31% 31% - - -
Labour 245 245 245 - - -
14% 14% 14% - - -
Green Party 35 35 35 - - -
2% 2% 2% - - -
Sinn Fein 326 326 326 - - -
18% 18% 18% - - -
Independent/Other 345 345 345 - - -
19% 19% 19% - - -

SeptemberTeleBar 2012 Sunday Times/Behaviour & Attitudes Opinion Poll
J3719
Table 11 Fieldwork : 4th - 9th September 2012 Page 21
Q10 Would you or would you not support a change in the law to permit abortion in cases where the life of the mother is at risk?
Base : All Irish Voters Total Gender Age Class Region Area Party Support
Male Female 18-34 35-54 55+ ABC1 C2DE F Dublin Lein-ster
Mun-ster
Conn/Ulster
Urban Rural FiannaFail
Fine Gael
Lab-our
Green Party
Sinn Fein
Indep/Others
Wouldnot/DK
Weighted Total 3,227 1,552 1,676 1,038 1,196 994 1,258 1,728 242 897 828 886 613 1,939 1,288 396 730 244 54 432 387 984
Unweighted Total 923 449 474 298 344 281 430 458 35 253 239 251 179 624 299 121 214 84 14 114 113 263
Would support change 2,575 1,280 1,296 863 972 740 1,037 1,343 195 735 691 698 452 1,534 1,041 314 611 223 49 322 329 728
80% 82% 77% 83% 81% 74% 82% 78% 81% 82% 83% 79% 74% 79% 81% 79% 84% 91% 91% 75% 85% 74%
Would not support change 461 183 279 135 149 177 152 267 42 106 115 133 107 277 184 78 83 15 5 74 44 163
14% 12% 17% 13% 12% 18% 12% 15% 17% 12% 14% 15% 17% 14% 14% 20% 11% 6% 9% 17% 11% 17%
Don’t know/no opinion (DO NOT READ OUT)
191 89 102 39 75 77 68 118 5 57 22 55 55 128 63 4 37 6 - 35 15 94
6% 6% 6% 4% 6% 8% 5% 7% 2% 6% 3% 6% 9% 7% 5% 1% 5% 3% - 8% 4% 10%

SeptemberTeleBar 2012 Sunday Times/Behaviour & Attitudes Opinion Poll
J3719
Table 11 Fieldwork : 4th - 9th September 2012 Page 22
Q10 Would you or would you not support a change in the law to permit abortion in cases where the life of the mother is at risk?
Base : All Irish Voters Total Likelihood
Wouldvote
Woulddefinitely vote
Wouldprobably vote
Might/might not
Wouldnot Vote
Weighted Total 3,227 2,651 2,227 424 114 430
Unweighted Total 923 768 653 115 39 108
Would support change 2,575 2,143 1,798 346 87 326
80% 81% 81% 81% 77% 76%
Would not support change 461 351 289 62 24 86
14% 13% 13% 15% 21% 20%
Don’t know/no opinion (DO NOT READ OUT)
191 156 140 16 3 18
6% 6% 6% 4% 2% 4%

SeptemberTeleBar 2012 Sunday Times/Behaviour & Attitudes Opinion Poll
J3719
Table 12 Fieldwork : 4th - 9th September 2012 Page 23
Q11 How likely would you be to vote if there was a General Election tomorrow?
Base : All Irish Voters Total Gender Age Class Region Area Party Support
Male Female 18-34 35-54 55+ ABC1 C2DE F Dublin Lein-ster
Mun-ster
Conn/Ulster
Urban Rural FiannaFail
Fine Gael
Lab-our
Green Party
Sinn Fein
Indep/Others
Wouldnot/DK
Weighted Total 3,227 1,552 1,676 1,038 1,196 994 1,258 1,728 242 897 828 886 613 1,939 1,288 396 730 244 54 432 387 984
Unweighted Total 923 449 474 298 344 281 430 458 35 253 239 251 179 624 299 121 214 84 14 114 113 263
Would definitely vote 2,227 1,062 1,165 554 934 738 926 1,149 152 704 533 595 394 1,377 849 298 605 211 28 342 285 457
69% 68% 69% 53% 78% 74% 74% 66% 63% 78% 64% 67% 64% 71% 66% 75% 83% 86% 52% 79% 74% 46%
Would probably vote 424 226 198 262 84 78 148 239 37 90 134 107 93 232 193 43 91 17 6 57 40 171
13% 15% 12% 25% 7% 8% 12% 14% 15% 10% 16% 12% 15% 12% 15% 11% 12% 7% 12% 13% 10% 17%
Might/might not vote 114 47 67 61 25 28 33 79 1 18 29 31 32 72 42 21 13 8 4 3 10 54
4% 3% 4% 6% 2% 3% 3% 5% 0% 2% 4% 4% 5% 4% 3% 5% 2% 3% 7% 1% 3% 6%
Would probably not vote 241 118 123 111 65 65 111 111 19 61 74 63 43 133 108 23 12 9 5 20 38 133
7% 8% 7% 11% 5% 7% 9% 6% 8% 7% 9% 7% 7% 7% 8% 6% 2% 4% 9% 5% 10% 14%
Would definitely not vote 189 84 105 44 71 74 32 124 33 12 58 71 48 103 86 10 9 - 11 10 8 141
6% 5% 6% 4% 6% 7% 3% 7% 14% 1% 7% 8% 8% 5% 7% 3% 1% - 21% 2% 2% 14%
Don’t know 33 15 18 5 17 11 8 25 - 12 - 18 3 23 10 - - - - - 5 28
1% 1% 1% 1% 1% 1% 1% 1% - 1% - 2% 0% 1% 1% - - - - - 1% 3%
Mean 4.33 4.34 4.32 4.13 4.48 4.36 4.46 4.28 4.06 4.59 4.22 4.26 4.22 4.38 4.26 4.51 4.74 4.76 3.65 4.62 4.46 3.70

SeptemberTeleBar 2012 Sunday Times/Behaviour & Attitudes Opinion Poll
J3719
Table 12 Fieldwork : 4th - 9th September 2012 Page 24
Q11 How likely would you be to vote if there was a General Election tomorrow?
Base : All Irish Voters Total Likelihood
Wouldvote
Woulddefinitely vote
Wouldprobably vote
Might/might not
Wouldnot Vote
Weighted Total 3,227 2,651 2,227 424 114 430
Unweighted Total 923 768 653 115 39 108
Would definitely vote 2,227 2,227 2,227 - - -
69% 84% 100% - - -
Would probably vote 424 424 - 424 - -
13% 16% - 100% - -
Might/might not vote 114 - - - 114 -
4% - - - 100% -
Would probably not vote 241 - - - - 241
7% - - - - 56%
Would definitely not vote 189 - - - - 189
6% - - - - 44%
Don’t know 33 - - - - -
1% - - - - -
Mean 4.33 4.84 5.00 4.00 3.00 1.56

SeptemberTeleBar 2012 Sunday Times/Behaviour & Attitudes Opinion Poll
J3719
Table 13 Fieldwork : 4th - 9th September 2012 Page 25
Q12 And finally, to which party or independent candidate did you give your first preference vote in last February’s General Election?
Base : All Irish Voters Total Gender Age Class Region Area Party Support
Male Female 18-34 35-54 55+ ABC1 C2DE F Dublin Lein-ster
Mun-ster
Conn/Ulster
Urban Rural FiannaFail
Fine Gael
Lab-our
Green Party
Sinn Fein
Indep/Others
Wouldnot/DK
Weighted Total 3,227 1,552 1,676 1,038 1,196 994 1,258 1,728 242 897 828 886 613 1,939 1,288 396 730 244 54 432 387 984
Unweighted Total 923 449 474 298 344 281 430 458 35 253 239 251 179 624 299 121 214 84 14 114 113 263
Fianna Fail 386 230 156 93 137 156 97 232 57 50 111 163 61 187 199 264 34 1 2 6 24 54
12% 15% 9% 9% 11% 16% 8% 13% 24% 6% 13% 18% 10% 10% 15% 67% 5% 1% 4% 1% 6% 5%
Fine Gael 988 487 502 221 412 355 422 460 106 251 212 314 211 546 443 36 554 41 - 76 85 197
31% 31% 30% 21% 35% 36% 34% 27% 44% 28% 26% 35% 34% 28% 34% 9% 76% 17% - 18% 22% 20%
Labour 414 185 229 99 176 139 212 202 - 202 79 115 15 320 94 11 37 147 11 60 18 130
13% 12% 14% 9% 15% 14% 17% 12% - 23% 10% 13% 2% 17% 7% 3% 5% 60% 20% 14% 5% 13%
Green Party 24 14 10 6 6 13 10 14 - 8 6 - 11 22 3 - 6 - 10 - 6 3
1% 1% 1% 1% 0% 1% 1% 1% - 1% 1% - 2% 1% 0% - 1% - 18% - 2% 0%
Workers Party - - - - - - - - - - - - - - - - - - - - - -
- - - - - - - - - - - - - - - - - - - - - -
Sinn Fein 257 137 120 95 141 21 75 177 5 71 60 37 88 186 70 15 4 5 11 199 6 17
8% 9% 7% 9% 12% 2% 6% 10% 2% 8% 7% 4% 14% 10% 5% 4% 1% 2% 21% 46% 2% 2%
Independent/Other 293 149 145 68 117 108 137 135 21 102 91 63 37 182 111 11 13 13 - 24 141 91
9% 10% 9% 7% 10% 11% 11% 8% 9% 11% 11% 7% 6% 9% 9% 3% 2% 5% - 6% 36% 9%
Don’t know 423 116 307 161 123 138 137 247 39 110 103 116 94 230 192 40 45 16 4 28 44 246
13% 7% 18% 16% 10% 14% 11% 14% 16% 12% 12% 13% 15% 12% 15% 10% 6% 7% 7% 6% 11% 25%
Did not vote 443 234 208 295 83 64 168 261 14 104 165 77 97 266 177 18 39 21 16 39 63 247
14% 15% 12% 28% 7% 6% 13% 15% 6% 12% 20% 9% 16% 14% 14% 5% 5% 9% 30% 9% 16% 25%

SeptemberTeleBar 2012 Sunday Times/Behaviour & Attitudes Opinion Poll
J3719
Table 13 Fieldwork : 4th - 9th September 2012 Page 26
Q12 And finally, to which party or independent candidate did you give your first preference vote in last February’s General Election?
Base : All Irish Voters Total Likelihood
Wouldvote
Woulddefinitely vote
Wouldprobably vote
Might/might not
Wouldnot Vote
Weighted Total 3,227 2,651 2,227 424 114 430
Unweighted Total 923 768 653 115 39 108
Fianna Fail 386 341 293 48 16 26
12% 13% 13% 11% 14% 6%
Fine Gael 988 902 807 96 24 62
31% 34% 36% 23% 21% 14%
Labour 414 347 328 19 11 42
13% 13% 15% 5% 10% 10%
Green Party 24 24 22 3 - -
1% 1% 1% 1% - -
Workers Party - - - - - -
- - - - - -
Sinn Fein 257 232 192 40 3 22
8% 9% 9% 9% 2% 5%
Independent/Other 293 262 238 24 8 22
9% 10% 11% 6% 7% 5%
Don’t know 423 361 251 110 24 31
13% 14% 11% 26% 21% 7%
Did not vote 443 181 96 85 29 226
14% 7% 4% 20% 25% 52%

SeptemberTeleBar 2012 Sunday Times/Behaviour & Attitudes Opinion Poll
J3719
Table 14 Fieldwork : 4th - 9th September 2012 Page 27
Q13 And finally, to which party or independent candidate did you give your first preference vote in last February’s General Election?
Base : All Irish VotersAll VotersExcluding did not vote (Last Gen Election)
Total Gender Age Class Region Area Party Support
Male Female 18-34 35-54 55+ ABC1 C2DE F Dublin Lein-ster
Mun-ster
Conn/Ulster
Urban Rural FiannaFail
Fine Gael
Lab-our
Green Party
Sinn Fein
Indep/Others
Wouldnot/DK
Weighted Total 2,362 1,201 1,161 581 989 792 954 1,220 189 684 560 693 423 1,443 919 337 647 207 34 365 280 491
Unweighted Total 690 356 334 169 280 241 335 328 27 194 174 193 128 464 226 103 187 73 7 94 89 137
Fianna Fail 386 230 156 93 137 156 97 232 57 50 111 163 61 187 199 264 34 1 2 6 24 54
16% 19% 13% 16% 14% 20% 10% 19% 30% 7% 20% 24% 15% 13% 22% 78% 5% 1% 7% 2% 9% 11%
Fine Gael 988 487 502 221 412 355 422 460 106 251 212 314 211 546 443 36 554 41 - 76 85 197
42% 41% 43% 38% 42% 45% 44% 38% 56% 37% 38% 45% 50% 38% 48% 11% 86% 20% - 21% 30% 40%
Labour 414 185 229 99 176 139 212 202 - 202 79 115 15 320 94 11 37 147 11 60 18 130
18% 15% 20% 17% 18% 18% 22% 17% - 30% 14% 17% 3% 22% 10% 3% 6% 71% 32% 16% 7% 26%
Green Party 24 14 10 6 6 13 10 14 - 8 6 - 11 22 3 - 6 - 10 - 6 3
1% 1% 1% 1% 1% 2% 1% 1% - 1% 1% - 3% 1% 0% - 1% - 29% - 2% 1%
Workers Party - - - - - - - - - - - - - - - - - - - - - -
- - - - - - - - - - - - - - - - - - - - - -
Sinn Fein 257 137 120 95 141 21 75 177 5 71 60 37 88 186 70 15 4 5 11 199 6 17
11% 11% 10% 16% 14% 3% 8% 15% 2% 10% 11% 5% 21% 13% 8% 5% 1% 2% 32% 54% 2% 3%
Independent/Other 293 149 145 68 117 108 137 135 21 102 91 63 37 182 111 11 13 13 - 24 141 91
12% 12% 12% 12% 12% 14% 14% 11% 11% 15% 16% 9% 9% 13% 12% 3% 2% 6% - 7% 50% 19%

SeptemberTeleBar 2012 Sunday Times/Behaviour & Attitudes Opinion Poll
J3719
Table 14 Fieldwork : 4th - 9th September 2012 Page 28
Q13 And finally, to which party or independent candidate did you give your first preference vote in last February’s General Election?
Base : All Irish VotersAll VotersExcluding did not vote (Last Gen Election)
Total Likelihood
Wouldvote
Woulddefinitely vote
Wouldprobably vote
Might/might not
Wouldnot Vote
Weighted Total 2,362 2,108 1,879 229 61 174
Unweighted Total 690 622 554 68 19 45
Fianna Fail 386 341 293 48 16 26
16% 16% 16% 21% 26% 15%
Fine Gael 988 902 807 96 24 62
42% 43% 43% 42% 39% 36%
Labour 414 347 328 19 11 42
18% 16% 17% 8% 18% 24%
Green Party 24 24 22 3 - -
1% 1% 1% 1% - -
Workers Party - - - - - -
- - - - - -
Sinn Fein 257 232 192 40 3 22
11% 11% 10% 17% 4% 13%
Independent/Other 293 262 238 24 8 22
12% 12% 13% 10% 12% 13%

SeptemberTeleBar 2012 Sunday Times/Behaviour & Attitudes Opinion Poll
J3719
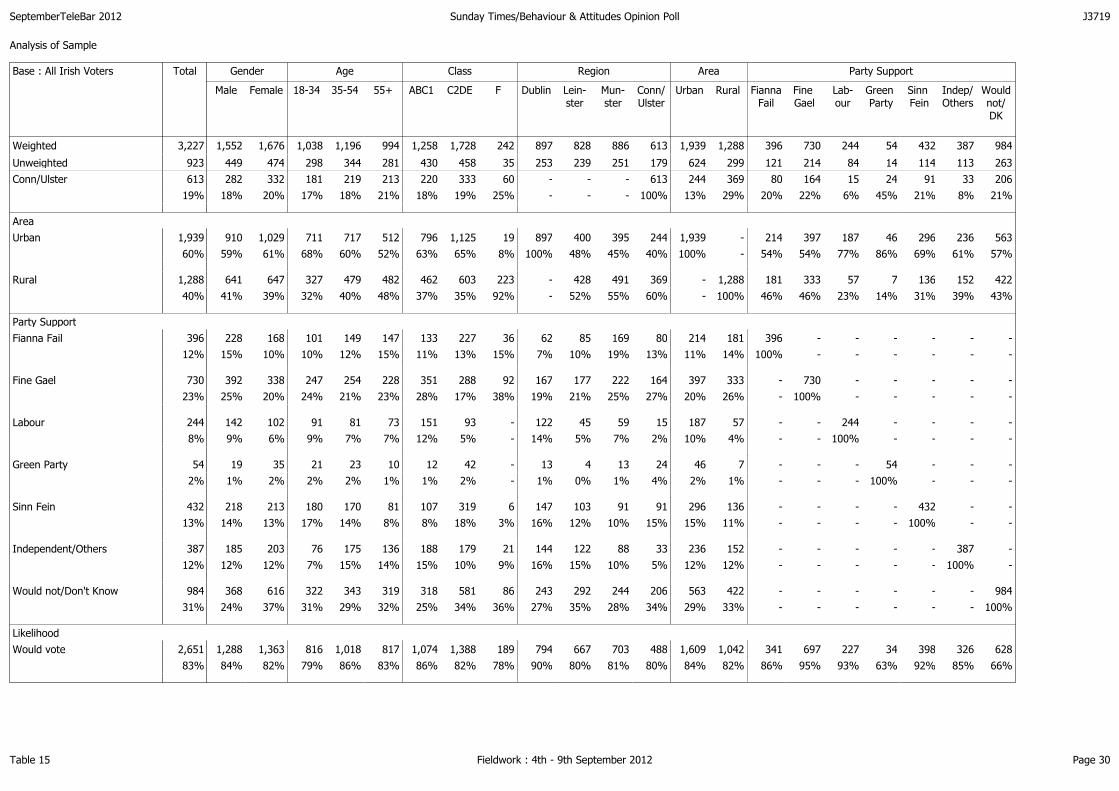
Table 15 Fieldwork : 4th - 9th September 2012 Page 29
Analysis of Sample
Base : All Irish Voters Total Gender Age Class Region Area Party Support
Male Female 18-34 35-54 55+ ABC1 C2DE F Dublin Lein-ster
Mun-ster
Conn/Ulster
Urban Rural FiannaFail
Fine Gael
Lab-our
Green Party
Sinn Fein
Indep/Others
Wouldnot/DK
Weighted 3,227 1,552 1,676 1,038 1,196 994 1,258 1,728 242 897 828 886 613 1,939 1,288 396 730 244 54 432 387 984
Unweighted 923 449 474 298 344 281 430 458 35 253 239 251 179 624 299 121 214 84 14 114 113 263
Gender
Male 1,552 1,552 - 520 574 457 616 821 115 401 415 451 282 910 641 228 392 142 19 218 185 368
48% 100% - 50% 48% 46% 49% 48% 48% 45% 50% 51% 46% 47% 50% 58% 54% 58% 35% 51% 48% 37%
Female 1,676 - 1,676 518 621 537 642 907 127 496 413 434 332 1,029 647 168 338 102 35 213 203 616
52% - 100% 50% 52% 54% 51% 52% 52% 55% 50% 49% 54% 53% 50% 42% 46% 42% 65% 49% 52% 63%
Age
18-34 1,038 520 518 1,038 - - 434 549 54 325 252 276 181 711 327 101 247 91 21 180 76 322
32% 34% 31% 100% - - 35% 32% 22% 36% 30% 31% 30% 37% 25% 25% 34% 37% 39% 42% 20% 33%
35-54 1,196 574 621 - 1,196 - 498 627 71 347 306 324 219 717 479 149 254 81 23 170 175 343
37% 37% 37% - 100% - 40% 36% 29% 39% 37% 37% 36% 37% 37% 38% 35% 33% 43% 39% 45% 35%
55+ 994 457 537 - - 994 326 551 117 226 270 285 213 512 482 147 228 73 10 81 136 319
31% 29% 32% - - 100% 26% 32% 48% 25% 33% 32% 35% 26% 37% 37% 31% 30% 18% 19% 35% 32%
Class
ABC1 1,258 616 642 434 498 326 1,258 - - 433 292 310 220 796 462 133 351 151 12 107 188 318
39% 40% 38% 42% 42% 33% 100% - - 48% 35% 35% 36% 41% 36% 34% 48% 62% 21% 25% 48% 32%
C2DE 1,728 821 907 549 627 551 - 1,728 - 464 472 459 333 1,125 603 227 288 93 42 319 179 581
54% 53% 54% 53% 52% 55% - 100% - 52% 57% 52% 54% 58% 47% 57% 39% 38% 79% 74% 46% 59%
F 242 115 127 54 71 117 - - 242 - 65 117 60 19 223 36 92 - - 6 21 86
7% 7% 8% 5% 6% 12% - - 100% - 8% 13% 10% 1% 17% 9% 13% - - 1% 5% 9%
Region
Dublin 897 401 496 325 347 226 433 464 - 897 - - - 897 - 62 167 122 13 147 144 243
28% 26% 30% 31% 29% 23% 35% 27% - 100% - - - 46% - 16% 23% 51% 23% 34% 37% 25%
Lein-ster 828 415 413 252 306 270 292 472 65 - 828 - - 400 428 85 177 45 4 103 122 292
26% 27% 25% 24% 26% 27% 23% 27% 27% - 100% - - 21% 33% 22% 24% 19% 7% 24% 32% 30%
Mun-ster 886 451 434 276 324 285 310 459 117 - - 886 - 395 491 169 222 59 13 91 88 244
27% 29% 26% 27% 27% 29% 25% 27% 48% - - 100% - 20% 38% 43% 30% 25% 24% 21% 23% 25%
SeptemberTeleBar 2012 Sunday Times/Behaviour & Attitudes Opinion Poll
J3719
Table 15 Fieldwork : 4th - 9th September 2012 Page 30
Analysis of Sample
Base : All Irish Voters Total Gender Age Class Region Area Party Support
Male Female 18-34 35-54 55+ ABC1 C2DE F Dublin Lein-ster
Mun-ster
Conn/Ulster
Urban Rural FiannaFail
Fine Gael
Lab-our
Green Party
Sinn Fein
Indep/Others
Wouldnot/DK
Weighted 3,227 1,552 1,676 1,038 1,196 994 1,258 1,728 242 897 828 886 613 1,939 1,288 396 730 244 54 432 387 984
Unweighted 923 449 474 298 344 281 430 458 35 253 239 251 179 624 299 121 214 84 14 114 113 263
Conn/Ulster 613 282 332 181 219 213 220 333 60 - - - 613 244 369 80 164 15 24 91 33 206
19% 18% 20% 17% 18% 21% 18% 19% 25% - - - 100% 13% 29% 20% 22% 6% 45% 21% 8% 21%
Area
Urban 1,939 910 1,029 711 717 512 796 1,125 19 897 400 395 244 1,939 - 214 397 187 46 296 236 563
60% 59% 61% 68% 60% 52% 63% 65% 8% 100% 48% 45% 40% 100% - 54% 54% 77% 86% 69% 61% 57%
Rural 1,288 641 647 327 479 482 462 603 223 - 428 491 369 - 1,288 181 333 57 7 136 152 422
40% 41% 39% 32% 40% 48% 37% 35% 92% - 52% 55% 60% - 100% 46% 46% 23% 14% 31% 39% 43%
Party Support
Fianna Fail 396 228 168 101 149 147 133 227 36 62 85 169 80 214 181 396 - - - - - -
12% 15% 10% 10% 12% 15% 11% 13% 15% 7% 10% 19% 13% 11% 14% 100% - - - - - -
Fine Gael 730 392 338 247 254 228 351 288 92 167 177 222 164 397 333 - 730 - - - - -
23% 25% 20% 24% 21% 23% 28% 17% 38% 19% 21% 25% 27% 20% 26% - 100% - - - - -
Labour 244 142 102 91 81 73 151 93 - 122 45 59 15 187 57 - - 244 - - - -
8% 9% 6% 9% 7% 7% 12% 5% - 14% 5% 7% 2% 10% 4% - - 100% - - - -
Green Party 54 19 35 21 23 10 12 42 - 13 4 13 24 46 7 - - - 54 - - -
2% 1% 2% 2% 2% 1% 1% 2% - 1% 0% 1% 4% 2% 1% - - - 100% - - -
Sinn Fein 432 218 213 180 170 81 107 319 6 147 103 91 91 296 136 - - - - 432 - -
13% 14% 13% 17% 14% 8% 8% 18% 3% 16% 12% 10% 15% 15% 11% - - - - 100% - -
Independent/Others 387 185 203 76 175 136 188 179 21 144 122 88 33 236 152 - - - - - 387 -
12% 12% 12% 7% 15% 14% 15% 10% 9% 16% 15% 10% 5% 12% 12% - - - - - 100% -
Would not/Don't Know 984 368 616 322 343 319 318 581 86 243 292 244 206 563 422 - - - - - - 984
31% 24% 37% 31% 29% 32% 25% 34% 36% 27% 35% 28% 34% 29% 33% - - - - - - 100%
Likelihood
Would vote 2,651 1,288 1,363 816 1,018 817 1,074 1,388 189 794 667 703 488 1,609 1,042 341 697 227 34 398 326 628
83% 84% 82% 79% 86% 83% 86% 82% 78% 90% 80% 81% 80% 84% 82% 86% 95% 93% 63% 92% 85% 66%

SeptemberTeleBar 2012 Sunday Times/Behaviour & Attitudes Opinion Poll
J3719
Table 15 Fieldwork : 4th - 9th September 2012 Page 31
Analysis of Sample
Base : All Irish Voters Total Gender Age Class Region Area Party Support
Male Female 18-34 35-54 55+ ABC1 C2DE F Dublin Lein-ster
Mun-ster
Conn/Ulster
Urban Rural FiannaFail
Fine Gael
Lab-our
Green Party
Sinn Fein
Indep/Others
Wouldnot/DK
Weighted 3,227 1,552 1,676 1,038 1,196 994 1,258 1,728 242 897 828 886 613 1,939 1,288 396 730 244 54 432 387 984
Unweighted 923 449 474 298 344 281 430 458 35 253 239 251 179 624 299 121 214 84 14 114 113 263
Might/might not 114 47 67 61 25 28 33 79 1 18 29 31 32 72 42 21 13 8 4 3 10 54
4% 3% 4% 6% 2% 3% 3% 5% 0% 2% 4% 4% 5% 4% 3% 5% 2% 3% 7% 1% 3% 6%
Would not Vote 430 202 228 155 136 139 143 236 52 73 132 133 91 236 194 33 21 9 16 30 47 275
13% 13% 14% 15% 12% 14% 11% 14% 21% 8% 16% 15% 15% 12% 15% 8% 3% 4% 29% 7% 12% 29%
Mean 4.33 4.34 4.32 4.13 4.48 4.36 4.46 4.28 4.06 4.59 4.22 4.26 4.22 4.38 4.26 4.51 4.74 4.76 3.65 4.62 4.46 3.70
Marital Status
Single 974 538 437 632 221 121 376 520 79 275 255 230 211 628 347 107 217 89 28 159 101 273
30% 35% 26% 61% 19% 12% 30% 30% 33% 31% 31% 26% 34% 32% 27% 27% 30% 36% 52% 37% 26% 28%
Married 1,605 791 814 216 772 617 654 829 122 387 426 533 259 874 731 248 410 98 10 157 242 439
50% 51% 49% 21% 65% 62% 52% 48% 50% 43% 51% 60% 42% 45% 57% 63% 56% 40% 19% 36% 62% 45%
Co-habiting 256 96 160 153 99 4 116 140 - 127 51 29 48 228 28 3 56 36 2 63 19 77
8% 6% 10% 15% 8% 0% 9% 8% - 14% 6% 3% 8% 12% 2% 1% 8% 15% 4% 15% 5% 8%
Widowed 210 42 168 3 19 189 59 109 42 46 52 43 69 87 123 20 34 2 3 21 7 123
7% 3% 10% 0% 2% 19% 5% 6% 17% 5% 6% 5% 11% 4% 10% 5% 5% 1% 5% 5% 2% 13%
Divorced/seperated 164 84 81 30 73 61 38 126 - 62 33 51 19 110 54 10 11 19 8 31 18 66
5% 5% 5% 3% 6% 6% 3% 7% - 7% 4% 6% 3% 6% 4% 3% 2% 8% 16% 7% 5% 7%
Refused 18 2 16 5 11 2 13 4 - - 11 - 7 13 5 6 2 - 3 - - 7
1% 0% 1% 0% 1% 0% 1% 0% - - 1% - 1% 1% 0% 2% 0% - 5% - - 1%

SeptemberTeleBar 2012 Sunday Times/Behaviour & Attitudes Opinion Poll
J3719
Table 15 Fieldwork : 4th - 9th September 2012 Page 32
Analysis of Sample
Base : All Irish Voters Total Likelihood
Wouldvote
Woulddefinitely vote
Wouldprobably vote
Might/might not
Wouldnot Vote
Weighted 3,227 2,651 2,227 424 114 430
Unweighted 923 768 653 115 39 108
Gender
Male 1,552 1,288 1,062 226 47 202
48% 49% 48% 53% 41% 47%
Female 1,676 1,363 1,165 198 67 228
52% 51% 52% 47% 59% 53%
Age
18-34 1,038 816 554 262 61 155
32% 31% 25% 62% 53% 36%
35-54 1,196 1,018 934 84 25 136
37% 38% 42% 20% 22% 32%
55+ 994 817 738 78 28 139
31% 31% 33% 18% 24% 32%
Class
ABC1 1,258 1,074 926 148 33 143
39% 41% 42% 35% 29% 33%
C2DE 1,728 1,388 1,149 239 79 236
54% 52% 52% 56% 70% 55%
F 242 189 152 37 1 52
7% 7% 7% 9% 1% 12%
Region
Dublin 897 794 704 90 18 73
28% 30% 32% 21% 17% 17%
Lein-ster 828 667 533 134 29 132
26% 25% 24% 32% 26% 31%
Mun-ster 886 703 595 107 31 133
27% 27% 27% 25% 28% 31%

SeptemberTeleBar 2012 Sunday Times/Behaviour & Attitudes Opinion Poll
J3719
Table 15 Fieldwork : 4th - 9th September 2012 Page 33
Analysis of Sample
Base : All Irish Voters Total Likelihood
Wouldvote
Woulddefinitely vote
Wouldprobably vote
Might/might not
Wouldnot Vote
Weighted 3,227 2,651 2,227 424 114 430
Unweighted 923 768 653 115 39 108
Conn/Ulster 613 488 394 93 32 91
19% 18% 18% 22% 29% 21%
Area
Urban 1,939 1,609 1,377 232 72 236
60% 61% 62% 55% 63% 55%
Rural 1,288 1,042 849 193 42 194
40% 39% 38% 45% 37% 45%
Party Support
Fianna Fail 396 341 298 43 21 33
12% 13% 13% 10% 19% 8%
Fine Gael 730 697 605 91 13 21
23% 26% 27% 22% 11% 5%
Labour 244 227 211 17 8 9
8% 9% 9% 4% 7% 2%
Green Party 54 34 28 6 4 16
2% 1% 1% 1% 3% 4%
Sinn Fein 432 398 342 57 3 30
13% 15% 15% 13% 3% 7%
Independent/Others 387 326 285 40 10 47
12% 12% 13% 9% 9% 11%
Would not/Don't Know 984 628 457 171 54 275
31% 24% 21% 40% 48% 64%
Likelihood
Would vote 2,651 2,651 2,227 424 - -
83% 100% 100% 100% - -

SeptemberTeleBar 2012 Sunday Times/Behaviour & Attitudes Opinion Poll
J3719
Table 15 Fieldwork : 4th - 9th September 2012 Page 34
Analysis of Sample
Base : All Irish Voters Total Likelihood
Wouldvote
Woulddefinitely vote
Wouldprobably vote
Might/might not
Wouldnot Vote
Weighted 3,227 2,651 2,227 424 114 430
Unweighted 923 768 653 115 39 108
Might/might not 114 - - - 114 -
4% - - - 100% -
Would not Vote 430 - - - - 430
13% - - - - 100%
Mean 4.33 4.84 5.00 4.00 3.00 1.56
Marital Status
Single 974 787 569 218 47 135
30% 30% 26% 51% 42% 31%
Married 1,605 1,340 1,225 115 34 214
50% 51% 55% 27% 30% 50%
Co-habiting 256 216 198 18 13 27
8% 8% 9% 4% 11% 6%
Widowed 210 173 122 51 13 21
7% 7% 5% 12% 12% 5%
Divorced/seperated 164 117 95 23 6 33
5% 4% 4% 5% 5% 8%
Refused 18 18 18 - - -
1% 1% 1% - - -

SeptemberTeleBar 2012 Sunday Times/Behaviour & Attitudes Opinion Poll
J3719
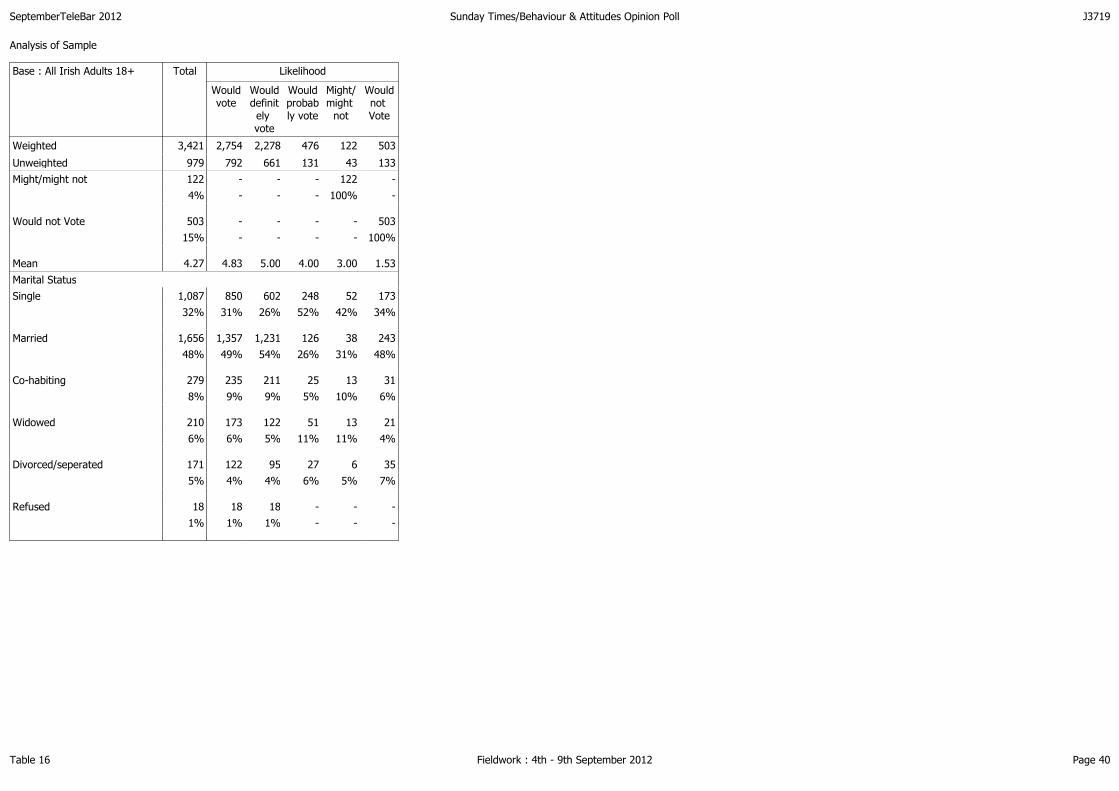
Table 16 Fieldwork : 4th - 9th September 2012 Page 35
Analysis of Sample
Base : All Irish Adults 18+ Total Gender Age Class Region Area Party Support
Male Female 18-34 35-54 55+ ABC1 C2DE F Dublin Lein-ster
Mun-ster
Conn/Ulster
Urban Rural FiannaFail
Fine Gael
Lab-our
Green Party
Sinn Fein
Indep/Others
Wouldnot/DK
Weighted 3,421 1,676 1,745 1,163 1,262 996 1,375 1,793 253 988 869 944 618 2,092 1,329 409 739 246 69 440 404 1,114
Unweighted 979 482 497 338 359 282 462 480 37 276 253 268 181 670 309 126 217 85 20 117 119 295
Gender
Male 1,676 1,676 - 594 624 459 695 862 119 459 437 492 286 1,009 668 241 401 142 33 227 190 443
49% 100% - 51% 49% 46% 51% 48% 47% 46% 50% 52% 46% 48% 50% 59% 54% 58% 47% 52% 47% 40%
Female 1,745 - 1,745 569 638 537 680 931 134 529 432 452 332 1,084 661 168 338 104 37 213 215 670
51% - 100% 49% 51% 54% 49% 52% 53% 54% 50% 48% 54% 52% 50% 41% 46% 42% 53% 48% 53% 60%
Age
18-34 1,163 594 569 1,163 - - 498 599 65 371 280 327 182 800 363 109 251 92 33 184 86 408
34% 35% 33% 100% - - 36% 33% 26% 38% 32% 35% 30% 38% 27% 27% 34% 37% 47% 42% 21% 37%
35-54 1,262 624 638 - 1,262 - 551 640 71 391 319 330 222 780 482 153 260 81 27 174 182 385
37% 37% 37% - 100% - 40% 36% 28% 40% 37% 35% 36% 37% 36% 37% 35% 33% 39% 40% 45% 35%
55+ 996 459 537 - - 996 326 553 117 226 270 287 213 512 484 147 228 73 10 81 136 321
29% 27% 31% - - 100% 24% 31% 46% 23% 31% 30% 35% 24% 36% 36% 31% 30% 14% 19% 34% 29%
Class
ABC1 1,375 695 680 498 551 326 1,375 - - 510 303 335 223 904 471 138 360 153 18 113 194 399
40% 41% 39% 43% 44% 33% 100% - - 52% 35% 36% 36% 43% 35% 34% 49% 62% 26% 26% 48% 36%
C2DE 1,793 862 931 599 640 553 - 1,793 - 477 501 480 335 1,170 623 234 288 93 51 320 189 617
52% 51% 53% 52% 51% 56% - 100% - 48% 58% 51% 54% 56% 47% 57% 39% 38% 74% 73% 47% 55%
F 253 119 134 65 71 117 - - 253 - 65 128 60 19 235 36 92 - - 6 21 97
7% 7% 8% 6% 6% 12% - - 100% - 7% 14% 10% 1% 18% 9% 12% - - 1% 5% 9%
Region
Dublin 988 459 529 371 391 226 510 477 - 988 - - - 988 - 69 172 124 16 147 149 312
29% 27% 30% 32% 31% 23% 37% 27% - 100% - - - 47% - 17% 23% 51% 23% 33% 37% 28%
Lein-ster 869 437 432 280 319 270 303 501 65 - 869 - - 430 439 87 180 45 6 106 133 313
25% 26% 25% 24% 25% 27% 22% 28% 26% - 100% - - 21% 33% 21% 24% 19% 8% 24% 33% 28%
Mun-ster 944 492 452 327 330 287 335 480 128 - - 944 - 426 518 169 223 59 23 97 90 283
28% 29% 26% 28% 26% 29% 24% 27% 51% - - 100% - 20% 39% 41% 30% 24% 33% 22% 22% 25%

SeptemberTeleBar 2012 Sunday Times/Behaviour & Attitudes Opinion Poll
J3719
Table 16 Fieldwork : 4th - 9th September 2012 Page 36
Analysis of Sample
Base : All Irish Adults 18+ Total Gender Age Class Region Area Party Support
Male Female 18-34 35-54 55+ ABC1 C2DE F Dublin Lein-ster
Mun-ster
Conn/Ulster
Urban Rural FiannaFail
Fine Gael
Lab-our
Green Party
Sinn Fein
Indep/Others
Wouldnot/DK
Weighted 3,421 1,676 1,745 1,163 1,262 996 1,375 1,793 253 988 869 944 618 2,092 1,329 409 739 246 69 440 404 1,114
Unweighted 979 482 497 338 359 282 462 480 37 276 253 268 181 670 309 126 217 85 20 117 119 295
Conn/Ulster 618 286 332 182 222 213 223 335 60 - - - 618 246 372 85 164 15 24 91 33 206
18% 17% 19% 16% 18% 21% 16% 19% 24% - - - 100% 12% 28% 21% 22% 6% 35% 21% 8% 19%
Area
Urban 2,092 1,009 1,084 800 780 512 904 1,170 19 988 430 426 246 2,092 - 225 406 188 54 304 253 662
61% 60% 62% 69% 62% 51% 66% 65% 7% 100% 50% 45% 40% 100% - 55% 55% 77% 78% 69% 62% 59%
Rural 1,329 668 661 363 482 484 471 623 235 - 439 518 372 - 1,329 184 333 57 15 136 152 452
39% 40% 38% 31% 38% 49% 34% 35% 93% - 50% 55% 60% - 100% 45% 45% 23% 22% 31% 38% 41%
Party Support
Fianna Fail 409 241 168 109 153 147 138 234 36 69 87 169 85 225 184 409 - - - - - -
12% 14% 10% 9% 12% 15% 10% 13% 14% 7% 10% 18% 14% 11% 14% 100% - - - - - -
Fine Gael 739 401 338 251 260 228 360 288 92 172 180 223 164 406 333 - 739 - - - - -
22% 24% 19% 22% 21% 23% 26% 16% 36% 17% 21% 24% 27% 19% 25% - 100% - - - - -
Labour 246 142 104 92 81 73 153 93 - 124 45 59 15 188 57 - - 246 - - - -
7% 8% 6% 8% 6% 7% 11% 5% - 13% 5% 6% 2% 9% 4% - - 100% - - - -
Green Party 69 33 37 33 27 10 18 51 - 16 6 23 24 54 15 - - - 69 - - -
2% 2% 2% 3% 2% 1% 1% 3% - 2% 1% 2% 4% 3% 1% - - - 100% - - -
Sinn Fein 440 227 213 184 174 81 113 320 6 147 106 97 91 304 136 - - - - 440 - -
13% 14% 12% 16% 14% 8% 8% 18% 3% 15% 12% 10% 15% 15% 10% - - - - 100% - -
Independent/Others 404 190 215 86 182 136 194 189 21 149 133 90 33 253 152 - - - - - 404 -
12% 11% 12% 7% 14% 14% 14% 11% 8% 15% 15% 10% 5% 12% 11% - - - - - 100% -
Would not/Don't Know 1,114 443 670 408 385 321 399 617 97 312 313 283 206 662 452 - - - - - - 1,114
33% 26% 38% 35% 30% 32% 29% 34% 38% 32% 36% 30% 33% 32% 34% - - - - - - 100%
Likelihood
Would vote 2,754 1,365 1,389 869 1,069 817 1,141 1,425 189 848 681 735 491 1,694 1,061 351 702 229 44 403 337 688
81% 83% 81% 76% 86% 83% 84% 81% 76% 87% 79% 80% 80% 82% 81% 86% 95% 93% 64% 92% 85% 64%

SeptemberTeleBar 2012 Sunday Times/Behaviour & Attitudes Opinion Poll
J3719
Table 16 Fieldwork : 4th - 9th September 2012 Page 37
Analysis of Sample
Base : All Irish Adults 18+ Total Gender Age Class Region Area Party Support
Male Female 18-34 35-54 55+ ABC1 C2DE F Dublin Lein-ster
Mun-ster
Conn/Ulster
Urban Rural FiannaFail
Fine Gael
Lab-our
Green Party
Sinn Fein
Indep/Others
Wouldnot/DK
Weighted 3,421 1,676 1,745 1,163 1,262 996 1,375 1,793 253 988 869 944 618 2,092 1,329 409 739 246 69 440 404 1,114
Unweighted 979 482 497 338 359 282 462 480 37 276 253 268 181 670 309 126 217 85 20 117 119 295
Might/might not 122 55 67 66 28 28 34 87 1 19 37 31 32 78 44 23 13 8 5 3 10 60
4% 3% 4% 6% 2% 3% 3% 5% 0% 2% 4% 3% 5% 4% 3% 6% 2% 3% 7% 1% 3% 6%
Would not Vote 503 234 269 215 147 141 188 257 59 108 148 156 92 294 210 35 21 9 20 34 52 333
15% 14% 16% 19% 12% 14% 14% 15% 24% 11% 17% 17% 15% 14% 16% 9% 3% 4% 29% 8% 13% 31%
Mean 4.27 4.29 4.25 3.99 4.46 4.36 4.37 4.24 3.97 4.49 4.15 4.19 4.21 4.30 4.22 4.48 4.74 4.76 3.56 4.59 4.41 3.62
Marital Status
Single 1,087 616 471 715 251 121 443 555 90 331 277 263 213 713 374 118 220 89 40 161 106 353
32% 37% 27% 62% 20% 12% 32% 31% 36% 34% 32% 28% 34% 34% 28% 29% 30% 36% 57% 37% 26% 32%
Married 1,656 820 836 243 796 617 695 840 122 415 438 543 259 925 731 248 416 99 14 164 247 468
48% 49% 48% 21% 63% 62% 51% 47% 48% 42% 50% 58% 42% 44% 55% 61% 56% 40% 20% 37% 61% 42%
Co-habiting 279 108 171 165 109 4 124 155 - 131 58 42 48 242 37 3 56 36 2 63 25 93
8% 6% 10% 14% 9% 0% 9% 9% - 13% 7% 4% 8% 12% 3% 1% 8% 15% 3% 14% 6% 8%
Widowed 210 42 168 3 19 189 59 109 42 46 52 43 69 87 123 20 34 2 3 21 7 123
6% 3% 10% 0% 1% 19% 4% 6% 16% 5% 6% 5% 11% 4% 9% 5% 5% 1% 4% 5% 2% 11%
Divorced/seperated 171 88 82 32 76 63 41 130 - 64 33 52 21 112 58 13 11 19 8 31 18 69
5% 5% 5% 3% 6% 6% 3% 7% - 6% 4% 6% 3% 5% 4% 3% 2% 8% 12% 7% 5% 6%
Refused 18 2 16 5 11 2 13 4 - - 11 - 7 13 5 6 2 - 3 - - 7
1% 0% 1% 0% 1% 0% 1% 0% - - 1% - 1% 1% 0% 1% 0% - 4% - - 1%

SeptemberTeleBar 2012 Sunday Times/Behaviour & Attitudes Opinion Poll
J3719
Table 16 Fieldwork : 4th - 9th September 2012 Page 38
Analysis of Sample
Base : All Irish Adults 18+ Total Likelihood
Wouldvote
Woulddefinitely vote
Wouldprobably vote
Might/might not
Wouldnot Vote
Weighted 3,421 2,754 2,278 476 122 503
Unweighted 979 792 661 131 43 133
Gender
Male 1,676 1,365 1,105 260 55 234
49% 50% 49% 55% 45% 47%
Female 1,745 1,389 1,173 216 67 269
51% 50% 51% 45% 55% 53%
Age
18-34 1,163 869 573 296 66 215
34% 32% 25% 62% 54% 43%
35-54 1,262 1,069 967 102 28 147
37% 39% 42% 21% 23% 29%
55+ 996 817 738 78 28 141
29% 30% 32% 16% 23% 28%
Class
ABC1 1,375 1,141 969 172 34 188
40% 41% 43% 36% 28% 37%
C2DE 1,793 1,425 1,157 267 87 257
52% 52% 51% 56% 71% 51%
F 253 189 152 37 1 59
7% 7% 7% 8% 1% 12%
Region
Dublin 988 848 743 106 19 108
29% 31% 33% 22% 16% 21%
Lein-ster 869 681 533 148 37 148
25% 25% 23% 31% 31% 29%
Mun-ster 944 735 608 126 31 156
28% 27% 27% 27% 26% 31%

SeptemberTeleBar 2012 Sunday Times/Behaviour & Attitudes Opinion Poll
J3719
Table 16 Fieldwork : 4th - 9th September 2012 Page 39
Analysis of Sample
Base : All Irish Adults 18+ Total Likelihood
Wouldvote
Woulddefinitely vote
Wouldprobably vote
Might/might not
Wouldnot Vote
Weighted 3,421 2,754 2,278 476 122 503
Unweighted 979 792 661 131 43 133
Conn/Ulster 618 491 394 96 32 92
18% 18% 17% 20% 27% 18%
Area
Urban 2,092 1,694 1,420 274 78 294
61% 61% 62% 58% 64% 58%
Rural 1,329 1,061 858 202 44 210
39% 39% 38% 42% 36% 42%
Party Support
Fianna Fail 409 351 301 50 23 35
12% 13% 13% 10% 19% 7%
Fine Gael 739 702 607 96 13 21
22% 26% 27% 20% 10% 4%
Labour 246 229 212 17 8 9
7% 8% 9% 3% 6% 2%
Green Party 69 44 28 16 5 20
2% 2% 1% 3% 4% 4%
Sinn Fein 440 403 342 61 3 34
13% 15% 15% 13% 3% 7%
Independent/Others 404 337 289 49 10 52
12% 12% 13% 10% 8% 10%
Would not/Don't Know 1,114 688 500 188 60 333
33% 25% 22% 39% 49% 66%
Likelihood
Would vote 2,754 2,754 2,278 476 - -
81% 100% 100% 100% - -
SeptemberTeleBar 2012 Sunday Times/Behaviour & Attitudes Opinion Poll
J3719
Table 16 Fieldwork : 4th - 9th September 2012 Page 40
Analysis of Sample
Base : All Irish Adults 18+ Total Likelihood
Wouldvote
Woulddefinitely vote
Wouldprobably vote
Might/might not
Wouldnot Vote
Weighted 3,421 2,754 2,278 476 122 503
Unweighted 979 792 661 131 43 133
Might/might not 122 - - - 122 -
4% - - - 100% -
Would not Vote 503 - - - - 503
15% - - - - 100%
Mean 4.27 4.83 5.00 4.00 3.00 1.53
Marital Status
Single 1,087 850 602 248 52 173
32% 31% 26% 52% 42% 34%
Married 1,656 1,357 1,231 126 38 243
48% 49% 54% 26% 31% 48%
Co-habiting 279 235 211 25 13 31
8% 9% 9% 5% 10% 6%
Widowed 210 173 122 51 13 21
6% 6% 5% 11% 11% 4%
Divorced/seperated 171 122 95 27 6 35
5% 4% 4% 6% 5% 7%
Refused 18 18 18 - - -
1% 1% 1% - - -

Questionnaire

BEHAVIOUR & ATTITUDES POLL QUESTIONNAIRE – Sept 2012
Good Morning/afternoon/evening my name is ………………… (Name) and I am calling from
Behaviour and Attitudes, the independent market research company based in Dublin.
We are currently conducting a study on a number of issues. The study will take less than 10
minutes to complete.
The interview will be conducted in accordance with Market Research Society guidelines - all
results will be shown in aggregate form and for quality control purposes this call may be
monitored by a supervisor.
ASK ALL ADULTS 18YRS+
Q.1 Would you say you are satisfied or dissatisfied with the manner in which the
Government is running the country?
Satisfied 1
Dissatisfied 2
No opinion 3
Q.2 Would you say you are satisfied or dissatisfied with the way Mr. Kenny is doing his job
as Taoiseach?
Satisfied 1
Dissatisfied 2
No opinion 3
Q.3 Would you say you are satisfied or dissatisfied with the way Mr. Gilmore is doing his
job as Tanaiste?
Satisfied 1
Dissatisfied 2
No opinion 3
Q.4 Would you say you are satisfied or dissatisfied with the way Mr. Martin is doing his job
as leader of Fianna Fail?
Satisfied 1
Dissatisfied 2
No opinion 3
J.3985

Q.5 Would you say you are satisfied or dissatisfied with the way Mr. Adams is doing his job
as leader of Sinn Fein?
Satisfied 1
Dissatisfied 2
No opinion 3
Q.6 Would you say you are satisfied or dissatisfied with the way Mr. Ryan is doing his job
as leader of The Green Party?
Satisfied 1
Dissatisfied 2
No opinion 3
Q.7 If there was a General Election tomorrow, to which party or independent candidate
would you give your first preference vote? DO NOT READ OUT. IF RESPONDENT
UNSURE PROBE: Please think about it for a minute.
Fianna Fail 1
Fine Gael 2
Labour Party 3
Green Party 4
Workers Party 5
Sinn Fein 6
Independent 7
Other specify _________________ 8
Don’t know 9
Would not vote 10
Q.8 Would you or would you not support a change in the law to permit abortion in cases
where the life of the mother is at risk?
Would support change 1
Would not support change 2
Don’t know/no opinion 3

Q.9 How likely would you be to vote if there was a General Election tomorrow? PROBE TO APPROPRIATE CODE
Would definitely vote 1
Would probably vote 2
Might/might not vote 3
Would probably not vote 4
Would definitely not vote 5
Don’t know 6
Q.10 And to which party or independent candidate did you give your first preference vote in last year’s General Election? DO NOT READ OUT
Q.11 Are you eligible to vote in Irish General Elections, or not?
Yes, eligible 1
No – not eligible 2
Don’t know 3
Q.12 And are you an Irish citizen, or not?
Yes 1
No 2
Don’t know 3
Fianna Fail 1
Fine Gael 2
Labour 3
Green Party 4
Workers Party 5
Sinn Fein 6
Independent 7
Other specify _________________ 8
Don’t know 9
Did not vote 10

Thank You