sunday%20times%20april%20opinion%20poll
DESCRIPTION
http://banda.ie/assets/files/Sunday%20Times%20April%20Opinion%20Poll.pdfTRANSCRIPT

Sunday Times /Behaviour & Attitudes April 2012 Opinion Poll 11th – 17th April, 2012
Prepared for
Prepared by Ian McShane
J.3760

Technical Appendix

3
Technical Appendix
The results of this opinion poll are based upon a representative sample of 946 eligible Irish voters aged 18 years +.
As such, the results can be deemed to be accurate to within plus or minus 3.3 percentage points at the 95% confidence level.
Fieldwork was conducted over the period 11th – 17th April, 2012, with interviewing carried out at the Behaviour & Attitudes Computer Aided Telephone Interviewing (CATI) Unit at Milltown House in Dublin.
Interviewing was conducted across all 43 constituencies in the country with households selected for interview by way of Random Digit Dialling (RDD).
The sample is split across RDD landline numbers and RDD mobile telephone numbers, so as to ensure that individuals living in landline only households, mobile only households, and households with both a landline and mobile telephone are represented in their correct proportions.

4
Technical Appendix
The subsequent survey results are weighted to reflect the known demographic profile of Irish adults, utilising the most recently published census population estimates from the Central Statistics Office (CSO).
Today’s Poll sees the introduction of a technical adjustment factor to Party Support levels, designed to smooth the effects of extreme highs and lows in support levels for individual parties as measured at a single point in time, and taking variable election day turnout levels into account.
All aspects of the survey, including the Party Support adjustment factor, are implemented in accordance with the technical and ethical guidelines set down by the Association of Irish Market Research Organisations (AIMRO) and the European Society of Opinion & Market Research (ESOMAR).

Charted Summary

6
Sunday Times/Behaviour & Attitudes Government and Party Leader Satisfaction Levels
12th February
2011 (f/w: 31st Jan – 12th Feb, 2011)
24th August, 2011
(f/w 16th – 24th August, 2011)
2nd October,
2011 (f/w 20th Sept – 2nd Oct, 2011)
18th October,
2011 (f/w 16th – 18th
Oct, 2011)
12th December,
2011 (f/w 7th-12th Dec, 2011)
20th February,
2012 (f/w 15th – 20th
Feb. 2012)
19th April, 2012
(f/w 11th – 17th Apr. 2012)
The Government
5% 42% 34% 36% 26% 26% 29%
Micheál Martin
43% 40% 31% 36% 40% 33% 34%
Enda Kenny 40% 62% 51% 58% 44% 41% 47%
Eamon Gilmore
55% 52% 43% 46% 35% 34% 37%
Gerry Adams 40% 48% 50% 50% 48% 46% 43%
Eamon Ryan - 34% 30% 30% 30% 25% 29%
Q.2 Q.3
Would you say you are satisfied or dissatisfied with the manner in which the Government is running the country? Would you say you are satisfied or dissatisfied with the way (…..) is doing his job as (…….)?

7
Sunday Times/Behaviour & Attitudes Core Party Support Levels
12th February
2011 (f/w: 31st Jan
– 12th Feb, 2011)
24th August, 2011
(f/w 16th – 24th August, 2011)
2nd October,
2011 (f/w 20th Sept – 2nd Oct, 2011)
18th October,
2011 (f/w 16th – 18th
Oct, 2011)
12th December,
2011 (f/w 7th-12th Dec, 2011)
20th February,
2012 (f/w 15th – 20th
Feb. 2012)
19th April, 2012
(f/w 11th – 17th Apr. 2012)
Fianna Fáil 11% 12% 11% 11% 15% 11% 12%
Fine Gael 26% 35% 26% 27% 22% 23% 22%
Labour 17% 9% 10% 11% 8% 7% 7%
Sinn Féin 10% 10% 12% 14% 15% 18% 14%
Green Party 1% 2% 3% 1% 1% 1% 3%
Independents/ Others
10% 10% 10% 9% 12% 11% 12%
Undecided 25% 22% 28% 27% 27% 30% 30%
Q.7 If there was a General Election tomorrow, to which party or independent candidate would you give your first preference vote?

8
Sunday Times/Behaviour & Attitudes Party Support Levels (Excluding Undecideds - Unadjusted)
12th February, 2011
(f/w: 31st Jan – 12th Feb,
2011)
General Election Result 25th
February
24th August, 2011
(f/w 16th – 24th August, 2011)
2nd October,
2011 (f/w 20th Sept
– 2nd Oct, 2011)
18th October,
2011 (f/w 16th – 18th
Oct, 2011)
12th December,
2011 (f/w 7th-12th Dec, 2011)
20th February,
2012 (f/w 15th – 20th Feb.
2012)
19th April, 2012
(f/w 11th – 17th Apr.
2012)
Fianna Fáil 15% 17% 15% 15% 15% 20% 16% 17%
Fine Gael 34% 36% 44% 36% 37% 30% 32% 32%
Labour 23% 19% 12% 14% 15% 11% 10% 10%
Sinn Féin 14% 10% 13% 17% 19% 21% 25% 20%
Green Party 2% 2% 2% 4% 1% 3% 2% 5%
Independent/Others
14% 16% 12% 13% 13% 15% 15% 17%
Q.7 If there was a General Election tomorrow, to which party or independent candidate would you give your first preference vote?
9
Party Support Adjustment Factor: Technical Note
Predicting election results on the basis of poll data is not an exact science. All the evidence shows that support for individual parties can swing dramatically in the period between elections- very often outside the bounds of historic election results.
Generally speaking one expects support for Government parties to decline in mid term with a corresponding rise in support for the Opposition. This is, of course, particularly true when times are tough.
The present situation is compounded by the fact that we have a coalition Government with quite different patterns of response among the constituent parties. Fine Gael voters are - by and large - behind Mr. Kenny and the performance of his Government. The same cannot be said for Labour and Mr. Gilmore. In these circumstances one might expect a greater swing in mood against Labour: with the opposition parties sharing a common base with them most likely to benefit.

10
Party Support Adjustment Factor: Technical Note
What to do in these circumstances? Most polling companies in Britain and Ireland publish their raw survey results as an index of fluctuations in the emotional mood of voters. They also build in an adjustment based on a number of factors. Where we have reports of how people voted in the last general election as well as how they intend to vote in the next one we can use these data to model the likely level of swing from the last election results.
We then add back in the forecasts of voters who have not voted last time or do not answer that particular question.
Finally we take into account each individuals stated likelihood of voting in a forthcoming General Election.
This is the basis of the adjusted voting forecast in Behaviour & Attitudes polls.

11
Party Support Levels (Excluding Undecided - Adjusted)
Adjusted figures based on:
All who state they would definitely vote
Weighting of those respondents who give a definite answer as to who they would vote for in a general election and who they voted for in the last election, in line with the result of the last election.
Making no adjustment to stated voting intention of those who do not indicate how they voted in last election.
2nd October, 2011
(f/w 20th Sept – 2nd Oct, 2011)
18th October,
2011 (f/w 16th – 18th
Oct, 2011)
12th December,
2011 (f/w 7th-12th Dec, 2011)
20th February,
2012 (f/w 15th – 20th
Feb. 2012)
19th April, 2012
(f/w 11th – 17th Apr. 2012)
Fianna Fáil 16% 14% 18% 16% 15%
Fine Gael 34% 35% 29% 33% 33%
Labour 16% 16% 12% 13% 14%
Sinn Féin 14% 17% 19% 20% 16%
Green Party 3% 1% 3% 2% 5%
Independents/ Others
17% 16% 18% 16% 18%

12
Likely Voting Intention in Referendum
Q.8 As you are probably aware, on May 31st next a referendum will be held in relation to the European Union Fiscal Treaty – otherwise known as the Fiscal Compact Treaty. In the referendum, people will be asked to vote either in favour of or against the Treaty. Are you yourself likely to vote yes in favour of the European Union Fiscal Treaty, or no against the European Union Fiscal Treaty?
Base: All Eligible Voters
Total
Gender Age Class Region Area
Male Female 18-34 35-54 55+ ABC1 C2DE F Dublin Leins ter
Munster Conn/ Ulster
Urban Rural
Base: 946 466 480 287 367 292 387 496 63 253 232 266 194 642 304 % % % % % % % % % % % % % % %
Will vote yes in favour of treaty
42 50 33 31 38 59 43 38 57 41 46 42 34 39 45
Will vote no against treaty 27 28 25 27 32 20 27 29 13 26 21 31 30 28 25
Don’t know 29 18 39 40 26 20 27 31 25 32 31 23 29 31 25
Will not vote 3 4 2 3 4 * 3 2 6 1 1 3 7 1 5

13
How well do you understand Referendum
Q.9 And thinking of the forthcoming European Union Fiscal Treaty Referendum. On a scale of 1 to 5 where 5 is you understand it very well and 1 is you do not understand it at all, how well do you feel you understand what the European Union Fiscal Treaty referendum is about?
Base: All Eligible Voters
Total
Gender Age Class Region Area
Male Female 18-34 35-54 55+ ABC1 C2DE F Dublin Leins ter
Munster Conn/ Ulster
Urban Rural
Base: 946 466 480 287 367 292 387 496 63 253 232 266 194 642 304 % % % % % % % % % % % % % % %
Understand it very well 6 9 2 4 4 9 7 5 4 5 6 7 3 7 4
Understand it quite well 12 16 8 6 14 17 14 11 11 13 10 12 11 11 13
Understand it to some extent 27 28 27 21 34 27 31 25 26 30 26 27 25 26 30
Do not understand it particularly well
23 20 26 30 20 20 20 26 18 19 28 23 24 23 24
Do not understand it at all
32 26 38 40 29 27 28 33 41 32 30 31 36 33 30

14
Likely Voting Intentions x Understanding
Q.8 As you are probably aware, on May 31st next a referendum will be held in relation to the European Union Fiscal Treaty – otherwise known as the Fiscal Compact Treaty. In the referendum, people will be asked to vote either in favour of or against the Treaty. Are you yourself likely to vote yes in favour of the European Union Fiscal Treaty, or no against the European Union Fiscal Treaty?
Base: All Eligible Voters Total
Treaty Understanding
Understand Don’t Understand
Base: 946 445 501 % % %
Will vote yes in favour of treaty 42 57 29
Will vote no against treaty 27 30 24
Don’t know 29 10 44
Will not vote 3 2 3

Commentary

16
Sunday Times/Behaviour & Attitudes Opinion Poll Series Background
Fieldwork for today’s poll was conducted over the period Wednesday 11th to Tuesday 17th April 2012.
Since February’s poll, on-going qualitative research conducted by Behaviour & Attitudes would suggest that the Irish electorate has become significantly more engaged in the political process.
At a macro level, Fine Gael Government ministers, most notably Taoiseach Enda Kenny, continue to promote Ireland and Irish Industry on the world stage.
The general public has taken note of these initiatives with, for example, Irish involvement in the establishment of a two billion euro equine centre in the Tianjin Equine culture city in China having received widespread media coverage in Ireland.
The announcement that Irish unemployment levels fell slightly in March was also noted with relief by many beleaguered citizens, giving some hope that their jobs may be more secure now than they were just a few months ago.

17
Sunday Times/Behaviour & Attitudes Opinion Poll Series Background
Indeed, the most recent Behaviour & Attitudes Consumer & Business Confidence reports, published this week, both register a slight improvement in sentiment.
Thus, the proportion of small to medium enterprise business owners/directors expecting business levels to increase over the next 12 months has improved since last quarter, as has consumers’ belief that the economy will improve over the next 12 months.
All of these measures suggest to us that the Irish voter is beginning to form the view that the Irish economy has finally reached the bottom, and that it may begin to improve, however marginally, over the course of this year and next.
There is, however, a stark difference between voters’ view of the economy in the medium to long term, and their ability to manage their day to day finances in the face of increased austerity measures.
Specific developments which will have influenced people’s voting intentions in recent weeks will of course include the introduction and management of the €100 household charge and the confusion surrounding the amount that householders will have to pay for the installation of water meters when they come into operation in 2014.

18
Sunday Times/Behaviour & Attitudes Opinion Poll Series Background
February’s Opinion Poll indicated that as many as 600,000 householders do not intend to pay the household charge at all.
With hundreds of thousands of homes yet to pay the charge, the issue continues to rankle with the electorate at a deeply emotive level.
Meanwhile, the recently convened teachers and Garda Unions conferences merely served to remind the public of the severe cutbacks we have already witnessed across a whole range of public services.
All in all, therefore, while the general public is beginning to exhibit tentative signs of hope that the recession is unlikely to deepen any further, anger towards specific Government Departments and their ministers has been rising, as witnessed by the public demonstrations staged at both the recent Fine Gael and Labour Party conferences.
Apart from the impact of all of these dynamics on party support levels, the key question in advance of today’s poll was how the current zeitgeist may be influencing people’s likelihood to vote in favour of, or against the forthcoming fiscal compact treaty. The subsequent sections of this report deal with both of these key issues in turn.

19
Sunday Times/Behaviour & Attitudes Opinion Poll Series
European Union Fiscal Treaty Referendum
The European Union Fiscal Treaty – otherwise known as the Fiscal Compact Treaty – Referendum will be held on Thursday, 31st May next.
As such, fieldwork for this poll was conducted 6-7 weeks before polling, with the public mood surrounding the Referendum likely to ebb and flow between now and polling day.
As the wording of the actual Referendum has yet to be published, respondents in today’s poll were simply asked whether they were likely to vote yes, in favour of the European Union Fiscal Treaty or no, against.
The results of the poll indicate that the outcome of the Referendum is far from certain, and that a full and clear explanation as to the full implications of both a yes and a no vote is required before the electorate is in a position to make its final decision on the matter.

20
Sunday Times/Behaviour & Attitudes Opinion Poll Series
European Union Fiscal Treaty Referendum
As of this week, 42% indicate that they are likely to vote in favour of ratifying the Treaty, 27% against it, with 32% undecided either way. Once the undecideds are excluded from the equation, 61% currently indicate they will vote yes, and 39% no.
Based on these figures, particularly the high level of undecided voters, the Referendum has yet to be won or lost.
If those campaigning for a yes vote can distil their message into a plain argument that acceptance of the treaty can only consolidate Ireland’s position in Europe and facilitate slow but steady economic recovery over the next couple of years, then the Referendum will pass.
If, on the other hand, the vote becomes a referendum on the hardship and austerity imposed on Ireland by the EU through the bailout programme then, given the prevailing mood of the electorate, it will be defeated.

21
Sunday Times/Behaviour & Attitudes Opinion Poll Series
European Union Fiscal Treaty Referendum
As it stands, the percentage of those likely to vote yes peaks amongst male voters (50%), those aged 55 years plus (59%), Fine Gael (70%) and Fianna Fail (55%) supporters. Six in ten of all Sinn Fein supporters indicate they intend to vote no, with a further 29% of them still undecided.
The jury is still very much out for younger (18-34 years) and female voters, with 43% of the former and 41% of the latter indicating they are unsure how they will vote.
Respondents were also asked how well they feel they understand what the European Union Fiscal Treaty Referendum is about.
It is well established by now that voters who have a limited understand of the details of a referendum are more likely to either not vote at all, or vote no in protest at the perceived failure of the establishment to adequately explain the facts of the matter.

22
Sunday Times/Behaviour & Attitudes Opinion Poll Series
European Union Fiscal Treaty Referendum
For example, a poll conducted by Behaviour & Attitudes for the Referendum Commission two days before the defeated June 2008 Lisbon I Referendum indicated that just 12% understood it very/quite well, 32% understood it to some extent, while 27% did not understand it at all.
In the immediate aftermath of the Lisbon II referendum which was of course passed, 32% of those surveyed in a B&A poll indicated they had understood it very/quite well, 40% to some extent, while just 11% suggested they had not understood it at all.
This analysis would suggest that in or around 30% of the electorate should understand the EU Treaty very/quite well, and no more than 15%-20% should indicate they do not understand it at all by voting day if it is to have a reasonable chance of being passed.
Today’s figures indicate that just 18% of the electorate currently understand the EU Fiscal Treaty referendum very/quite well, while 32% do not understand it at all. The yes camp has less than six week within which to bridge this informational gap.

23
Sunday Times/Behaviour & Attitudes Opinion Poll Series
Party Support & Leader Satisfaction Levels
Government satisfaction levels have not changed at a significant level since December’s Post-Budget poll, at which stage satisfaction with the administration dropped ten percentage points over the previous October’s survey.
Thus, satisfaction with the Government now stands at just 29%, with a full 65% dissatisfied with the Government and a further 6% expressing no opinion. With over half (55%) of Fine Gael supporters and two-thirds (68%) of Labour supporters currently unhappy with the performance of the Government, it is no wonder that opposition parties have been faring so well in the polls over the last number of months.
Enda Kenny’s personal satisfaction rating has, however improved to 47% in today’s poll, albeit with a corresponding 46% expressing dissatisfaction with his performance as Taoiseach. Kenny’s improved rating since February’s poll has been driven primarily by an increase in satisfaction amongst older (55 years plus) voters.

24
Sunday Times/Behaviour & Attitudes Opinion Poll Series
Party Support & Leader Satisfaction Levels
With regard to main party support levels, today’s poll ratings are, in all but one instance, within one or two percentage points of those prevailing in the last poll.
Thus, Fine Gael remains the largest party in terms of support, followed by Sinn Féin, Fianna Fáil and the Labour Party, with Independents/Others drawing support from one in six of the electorate.
The one exception with regard to shifts in opinion since February is that of Sinn Féin, which witnesses a drop of four percentage points over the last eight weeks, now sitting at a still credible 16% rating, based on adjusted party support levels.
It will be recalled that Sinn Féin’s recent increases in support have been primarily amongst those aged 18-34 years and those from the more blue collar (C2DE) worker socio-economic grouping.
25
Sunday Times/Behaviour & Attitudes Opinion Poll Series
Party Support & Leader Satisfaction Levels
In today’s poll, Sinn Féin’s greatest losses in support have been amongst 18-34 year olds and C2DEs, many of whom seem to have drifted towards the Independents.
From Sinn Féin’s perspective, the message is clear. Support for the party has grown significantly since the general election, although its support base is disproportionately influenced by those segments of the population who are unlikely to vote on election day. In addition, support levels for the party have been more volatile than they have been for any of the other parties over the last number of months, suggesting that it is the one party whose fortunes are most closely tied to the fluctuating peaks and troughs of voter sentiment.
While Sinn Féin undoubtedly harbours ambitions to enter Government at some stage over the next ten years, the combined Fine Gael/Labour 47% share of vote suggests they have quite some work to do before their aspirations are likely to be realised.

Tabular Report

April TeleBar 2012 Sunday Times/Behaviour & Attitudes Opinion Poll
J3719
Table 1 Fieldwork : 11th - 17th April 2012 Page 1
Q1 Are you eligible to vote in Irish General Elections, or not?
Base : All Irish Adults 18+ Total Gender Age Class Region Area Party Support
Male Female 18-34 35-54 55+ ABC1 C2DE F Dublin Lein-ster
Mun-ster
Conn/Ulster
Urban Rural FiannaFail
Fine Gael
Lab-our
Green Party
Sinn Fein
Indep/Others
Wouldnot/DK
Weighted Total 3,421 1,678 1,743 1,166 1,264 991 1,373 1,794 254 981 864 957 618 2,092 1,329 391 752 230 104 463 385 1,092
Unweighted Total 979 477 502 307 378 294 401 514 64 265 237 272 204 666 313 108 235 79 28 123 105 299Yes, eligible 3,306 1,635 1,671 1,097 1,222 987 1,330 1,726 250 940 843 937 586 2,018 1,287 385 734 230 104 455 383 1,010
97% 97% 96% 94% 97% 100% 97% 96% 98% 96% 98% 98% 95% 96% 97% 99% 98% 100% 100% 98% 99% 93%
No – not eligible 87 25 62 55 30 2 37 46 4 32 11 19 25 60 27 6 11 - - 7 2 613% 1% 4% 5% 2% 0% 3% 3% 2% 3% 1% 2% 4% 3% 2% 1% 1% - - 2% 1% 6%
Don’t know 28 18 10 14 13 2 6 22 - 9 10 2 8 14 14 - 7 - - 1 - 201% 1% 1% 1% 1% 0% 0% 1% - 1% 1% 0% 1% 1% 1% - 1% - - 0% - 2%

April TeleBar 2012 Sunday Times/Behaviour & Attitudes Opinion Poll
J3719
Table 1 Fieldwork : 11th - 17th April 2012 Page 2
Q1 Are you eligible to vote in Irish General Elections, or not?
Base : All Irish Adults 18+ Total Likelihood Treaty Understanding
Wouldvote
Woulddefinitely vote
Wouldprobably vote
Might/might
not
Wouldnot Vote
Don't Understand
Understand
Weighted Total 3,421 2,809 2,384 425 148 418 1,890 1,531
Unweighted Total 979 804 682 122 42 122 522 457Yes, eligible 3,306 2,763 2,362 401 146 361 1,822 1,484
97% 98% 99% 94% 99% 86% 96% 97%
No – not eligible 87 30 14 15 1 49 50 373% 1% 1% 4% 1% 12% 3% 2%
Don’t know 28 16 8 9 - 8 19 101% 1% 0% 2% - 2% 1% 1%

April TeleBar 2012 Sunday Times/Behaviour & Attitudes Opinion Poll
J3719
Table 2 Fieldwork : 11th - 17th April 2012 Page 3
Q2 Would you say you are satisfied or dissatisfied with the manner in which the Government is running the country?
Base : All Irish Voters Total Gender Age Class Region Area Party Support
Male Female 18-34 35-54 55+ ABC1 C2DE F Dublin Lein-ster
Mun-ster
Conn/Ulster
Urban Rural FiannaFail
Fine Gael
Lab-our
Green Party
Sinn Fein
Indep/Others
Wouldnot/DK
Weighted Total 3,306 1,635 1,671 1,097 1,222 987 1,330 1,726 250 940 843 937 586 2,018 1,287 385 734 230 104 455 383 1,010
Unweighted Total 946 466 480 287 367 292 387 496 63 253 232 266 194 642 304 106 230 79 28 119 104 278Satisfied 967 552 415 237 309 421 411 418 138 288 274 283 122 556 411 123 455 74 26 24 48 217
29% 34% 25% 22% 25% 43% 31% 24% 55% 31% 33% 30% 21% 28% 32% 32% 62% 32% 25% 5% 13% 21%
Dissatisfied 2,139 978 1,162 775 838 526 815 1,215 109 575 536 618 410 1,327 812 236 253 128 64 418 320 71765% 60% 70% 71% 69% 53% 61% 70% 44% 61% 64% 66% 70% 66% 63% 61% 34% 56% 61% 92% 83% 71%
No opinion 199 105 95 84 75 40 103 92 3 77 33 35 54 135 64 27 27 28 14 13 15 766% 6% 6% 8% 6% 4% 8% 5% 1% 8% 4% 4% 9% 7% 5% 7% 4% 12% 13% 3% 4% 8%

April TeleBar 2012 Sunday Times/Behaviour & Attitudes Opinion Poll
J3719
Table 2 Fieldwork : 11th - 17th April 2012 Page 4
Q2 Would you say you are satisfied or dissatisfied with the manner in which the Government is running the country?
Base : All Irish Voters Total Likelihood Treaty Understanding
Wouldvote
Woulddefinitely vote
Wouldprobably vote
Might/might
not
Wouldnot Vote
Don't Understand
Understand
Weighted Total 3,306 2,763 2,362 401 146 361 1,822 1,484
Unweighted Total 946 792 677 115 41 105 501 445Satisfied 967 894 800 94 3 54 399 568
29% 32% 34% 24% 2% 15% 22% 38%
Dissatisfied 2,139 1,715 1,432 283 135 273 1,280 85965% 62% 61% 71% 93% 76% 70% 58%
No opinion 199 153 130 23 8 34 142 576% 6% 6% 6% 6% 9% 8% 4%

April TeleBar 2012 Sunday Times/Behaviour & Attitudes Opinion Poll
J3719
Table 3 Fieldwork : 11th - 17th April 2012 Page 5
Q3 Would you say you are satisfied or dissatisfied with the way Mr. Kenny is doing his job as Taoiseach?
Base : All Irish Voters Total Gender Age Class Region Area Party Support
Male Female 18-34 35-54 55+ ABC1 C2DE F Dublin Lein-ster
Mun-ster
Conn/Ulster
Urban Rural FiannaFail
Fine Gael
Lab-our
Green Party
Sinn Fein
Indep/Others
Wouldnot/DK
Weighted Total 3,306 1,635 1,671 1,097 1,222 987 1,330 1,726 250 940 843 937 586 2,018 1,287 385 734 230 104 455 383 1,010
Unweighted Total 946 466 480 287 367 292 387 496 63 253 232 266 194 642 304 106 230 79 28 119 104 278Satisfied 1,562 834 728 429 561 572 652 752 157 451 390 479 242 945 616 171 633 130 50 109 117 351
47% 51% 44% 39% 46% 58% 49% 44% 63% 48% 46% 51% 41% 47% 48% 44% 86% 56% 49% 24% 31% 35%
Dissatisfied 1,516 713 804 571 583 363 557 876 83 408 399 425 284 915 601 179 84 83 50 301 254 56146% 44% 48% 52% 48% 37% 42% 51% 33% 43% 47% 45% 48% 45% 47% 46% 11% 36% 48% 66% 66% 55%
No opinion 228 88 139 98 79 52 121 98 9 81 54 33 59 158 70 36 18 17 3 44 12 987% 5% 8% 9% 6% 5% 9% 6% 4% 9% 6% 4% 10% 8% 5% 9% 2% 7% 3% 10% 3% 10%

April TeleBar 2012 Sunday Times/Behaviour & Attitudes Opinion Poll
J3719
Table 3 Fieldwork : 11th - 17th April 2012 Page 6
Q3 Would you say you are satisfied or dissatisfied with the way Mr. Kenny is doing his job as Taoiseach?
Base : All Irish Voters Total Likelihood Treaty Understanding
Wouldvote
Woulddefinitely vote
Wouldprobably vote
Might/might
not
Wouldnot Vote
Don't Understand
Understand
Weighted Total 3,306 2,763 2,362 401 146 361 1,822 1,484
Unweighted Total 946 792 677 115 41 105 501 445Satisfied 1,562 1,392 1,209 183 45 102 750 812
47% 50% 51% 46% 31% 28% 41% 55%
Dissatisfied 1,516 1,221 1,038 183 69 213 907 61046% 44% 44% 46% 47% 59% 50% 41%
No opinion 228 149 114 35 33 46 165 637% 5% 5% 9% 22% 13% 9% 4%

April TeleBar 2012 Sunday Times/Behaviour & Attitudes Opinion Poll
J3719
Table 4 Fieldwork : 11th - 17th April 2012 Page 7
Q4 Would you say you are satisfied or dissatisfied with the way Mr. Gilmore is doing his job as Tanaiste?
Base : All Irish Voters Total Gender Age Class Region Area Party Support
Male Female 18-34 35-54 55+ ABC1 C2DE F Dublin Lein-ster
Mun-ster
Conn/Ulster
Urban Rural FiannaFail
Fine Gael
Lab-our
Green Party
Sinn Fein
Indep/Others
Wouldnot/DK
Weighted Total 3,306 1,635 1,671 1,097 1,222 987 1,330 1,726 250 940 843 937 586 2,018 1,287 385 734 230 104 455 383 1,010
Unweighted Total 946 466 480 287 367 292 387 496 63 253 232 266 194 642 304 106 230 79 28 119 104 278Satisfied 1,210 640 570 306 436 468 484 603 124 332 302 409 167 702 508 109 501 135 34 101 78 252
37% 39% 34% 28% 36% 47% 36% 35% 49% 35% 36% 44% 29% 35% 39% 28% 68% 59% 33% 22% 20% 25%
Dissatisfied 1,722 839 884 584 677 461 685 925 113 471 449 489 313 1,052 670 237 183 78 54 313 271 58152% 51% 53% 53% 55% 47% 51% 54% 45% 50% 53% 52% 53% 52% 52% 62% 25% 34% 52% 69% 71% 58%
No opinion 373 156 218 206 109 58 161 199 14 137 92 39 105 264 110 39 50 17 16 41 34 17711% 10% 13% 19% 9% 6% 12% 12% 5% 15% 11% 4% 18% 13% 9% 10% 7% 7% 15% 9% 9% 17%

April TeleBar 2012 Sunday Times/Behaviour & Attitudes Opinion Poll
J3719
Table 4 Fieldwork : 11th - 17th April 2012 Page 8
Q4 Would you say you are satisfied or dissatisfied with the way Mr. Gilmore is doing his job as Tanaiste?
Base : All Irish Voters Total Likelihood Treaty Understanding
Wouldvote
Woulddefinitely vote
Wouldprobably vote
Might/might
not
Wouldnot Vote
Don't Understand
Understand
Weighted Total 3,306 2,763 2,362 401 146 361 1,822 1,484
Unweighted Total 946 792 677 115 41 105 501 445Satisfied 1,210 1,096 949 147 39 64 554 656
37% 40% 40% 37% 26% 18% 30% 44%
Dissatisfied 1,722 1,416 1,225 190 79 214 990 73252% 51% 52% 47% 54% 59% 54% 49%
No opinion 373 251 187 64 28 83 277 9611% 9% 8% 16% 19% 23% 15% 6%

April TeleBar 2012 Sunday Times/Behaviour & Attitudes Opinion Poll
J3719
Table 5 Fieldwork : 11th - 17th April 2012 Page 9
Q5 Would you say you are satisfied or dissatisfied with the way Mr. Martin is doing his job as leader of Fianna Fail?
Base : All Irish Voters Total Gender Age Class Region Area Party Support
Male Female 18-34 35-54 55+ ABC1 C2DE F Dublin Lein-ster
Mun-ster
Conn/Ulster
Urban Rural FiannaFail
Fine Gael
Lab-our
Green Party
Sinn Fein
Indep/Others
Wouldnot/DK
Weighted Total 3,306 1,635 1,671 1,097 1,222 987 1,330 1,726 250 940 843 937 586 2,018 1,287 385 734 230 104 455 383 1,010
Unweighted Total 946 466 480 287 367 292 387 496 63 253 232 266 194 642 304 106 230 79 28 119 104 278Satisfied 1,128 548 580 320 344 464 490 547 91 262 332 377 158 671 457 273 328 84 37 70 103 233
34% 34% 35% 29% 28% 47% 37% 32% 37% 28% 39% 40% 27% 33% 35% 71% 45% 36% 36% 15% 27% 23%
Dissatisfied 1,655 830 825 560 719 376 624 902 129 482 396 457 321 986 669 103 320 105 48 294 234 54750% 51% 49% 51% 59% 38% 47% 52% 52% 51% 47% 49% 55% 49% 52% 27% 44% 46% 46% 65% 61% 54%
No opinion 522 257 265 216 160 146 216 277 30 197 115 103 107 361 162 10 86 41 18 90 46 23016% 16% 16% 20% 13% 15% 16% 16% 12% 21% 14% 11% 18% 18% 13% 3% 12% 18% 18% 20% 12% 23%

April TeleBar 2012 Sunday Times/Behaviour & Attitudes Opinion Poll
J3719
Table 5 Fieldwork : 11th - 17th April 2012 Page 10
Q5 Would you say you are satisfied or dissatisfied with the way Mr. Martin is doing his job as leader of Fianna Fail?
Base : All Irish Voters Total Likelihood Treaty Understanding
Wouldvote
Woulddefinitely vote
Wouldprobably vote
Might/might
not
Wouldnot Vote
Don't Understand
Understand
Weighted Total 3,306 2,763 2,362 401 146 361 1,822 1,484
Unweighted Total 946 792 677 115 41 105 501 445Satisfied 1,128 1,024 891 133 10 77 577 551
34% 37% 38% 33% 7% 21% 32% 37%
Dissatisfied 1,655 1,332 1,139 193 93 219 900 75550% 48% 48% 48% 64% 61% 49% 51%
No opinion 522 407 332 75 43 64 344 17816% 15% 14% 19% 29% 18% 19% 12%

April TeleBar 2012 Sunday Times/Behaviour & Attitudes Opinion Poll
J3719
Table 6 Fieldwork : 11th - 17th April 2012 Page 11
Q6 Would you say you are satisfied or dissatisfied with the way Mr. Adams is doing his job as leader of Sinn Fein?
Base : All Irish Voters Total Gender Age Class Region Area Party Support
Male Female 18-34 35-54 55+ ABC1 C2DE F Dublin Lein-ster
Mun-ster
Conn/Ulster
Urban Rural FiannaFail
Fine Gael
Lab-our
Green Party
Sinn Fein
Indep/Others
Wouldnot/DK
Weighted Total 3,306 1,635 1,671 1,097 1,222 987 1,330 1,726 250 940 843 937 586 2,018 1,287 385 734 230 104 455 383 1,010
Unweighted Total 946 466 480 287 367 292 387 496 63 253 232 266 194 642 304 106 230 79 28 119 104 278Satisfied 1,434 786 648 421 602 411 508 839 86 379 363 444 248 866 568 157 270 93 46 364 191 312
43% 48% 39% 38% 49% 42% 38% 49% 35% 40% 43% 47% 42% 43% 44% 41% 37% 40% 45% 80% 50% 31%
Dissatisfied 1,240 616 624 429 412 398 523 613 104 363 321 364 192 777 463 180 355 91 46 51 120 39238% 38% 37% 39% 34% 40% 39% 36% 41% 39% 38% 39% 33% 38% 36% 47% 48% 40% 45% 11% 31% 39%
No opinion 632 233 399 247 208 178 298 274 60 199 159 129 146 376 256 48 110 46 11 39 72 30619% 14% 24% 22% 17% 18% 22% 16% 24% 21% 19% 14% 25% 19% 20% 13% 15% 20% 11% 9% 19% 30%

April TeleBar 2012 Sunday Times/Behaviour & Attitudes Opinion Poll
J3719
Table 6 Fieldwork : 11th - 17th April 2012 Page 12
Q6 Would you say you are satisfied or dissatisfied with the way Mr. Adams is doing his job as leader of Sinn Fein?
Base : All Irish Voters Total Likelihood Treaty Understanding
Wouldvote
Woulddefinitely vote
Wouldprobably vote
Might/might
not
Wouldnot Vote
Don't Understand
Understand
Weighted Total 3,306 2,763 2,362 401 146 361 1,822 1,484
Unweighted Total 946 792 677 115 41 105 501 445Satisfied 1,434 1,252 1,101 151 71 101 798 636
43% 45% 47% 38% 48% 28% 44% 43%
Dissatisfied 1,240 1,027 876 152 33 169 666 57438% 37% 37% 38% 23% 47% 37% 39%
No opinion 632 483 385 98 43 91 358 27519% 17% 16% 24% 29% 25% 20% 19%

April TeleBar 2012 Sunday Times/Behaviour & Attitudes Opinion Poll
J3719
Table 7 Fieldwork : 11th - 17th April 2012 Page 13
Q7 Would you say you are satisfied or dissatisfied with the way Mr. Ryan is doing his job as leader of The Green Party?
Base : All Irish Voters Total Gender Age Class Region Area Party Support
Male Female 18-34 35-54 55+ ABC1 C2DE F Dublin Lein-ster
Mun-ster
Conn/Ulster
Urban Rural FiannaFail
Fine Gael
Lab-our
Green Party
Sinn Fein
Indep/Others
Wouldnot/DK
Weighted Total 3,306 1,635 1,671 1,097 1,222 987 1,330 1,726 250 940 843 937 586 2,018 1,287 385 734 230 104 455 383 1,010
Unweighted Total 946 466 480 287 367 292 387 496 63 253 232 266 194 642 304 106 230 79 28 119 104 278Satisfied 963 472 491 333 330 300 426 470 67 264 233 290 176 596 367 168 185 66 88 108 85 263
29% 29% 29% 30% 27% 30% 32% 27% 27% 28% 28% 31% 30% 30% 29% 44% 25% 29% 85% 24% 22% 26%
Dissatisfied 1,293 663 630 461 489 343 472 731 91 358 343 367 225 778 515 104 344 84 14 208 188 34639% 41% 38% 42% 40% 35% 35% 42% 36% 38% 41% 39% 38% 39% 40% 27% 47% 37% 14% 46% 49% 34%
No opinion 1,050 500 550 303 403 343 432 525 92 319 267 280 184 644 405 113 206 79 2 139 110 40132% 31% 33% 28% 33% 35% 32% 30% 37% 34% 32% 30% 31% 32% 31% 29% 28% 35% 2% 31% 29% 40%

April TeleBar 2012 Sunday Times/Behaviour & Attitudes Opinion Poll
J3719
Table 7 Fieldwork : 11th - 17th April 2012 Page 14
Q7 Would you say you are satisfied or dissatisfied with the way Mr. Ryan is doing his job as leader of The Green Party?
Base : All Irish Voters Total Likelihood Treaty Understanding
Wouldvote
Woulddefinitely vote
Wouldprobably vote
Might/might
not
Wouldnot Vote
Don't Understand
Understand
Weighted Total 3,306 2,763 2,362 401 146 361 1,822 1,484
Unweighted Total 946 792 677 115 41 105 501 445Satisfied 963 824 708 116 54 81 536 427
29% 30% 30% 29% 37% 22% 29% 29%
Dissatisfied 1,293 1,056 910 146 43 177 713 58039% 38% 39% 37% 30% 49% 39% 39%
No opinion 1,050 882 744 138 49 103 573 47732% 32% 32% 34% 33% 29% 31% 32%

April TeleBar 2012 Sunday Times/Behaviour & Attitudes Opinion Poll
J3719
Table 8 Fieldwork : 11th - 17th April 2012 Page 15
Q8 If there was a General Election tomorrow, to which party or independent candidate would you give your first preference vote?
Base : All Irish Voters Total Gender Age Class Region Area Party Support
Male Female 18-34 35-54 55+ ABC1 C2DE F Dublin Lein-ster
Mun-ster
Conn/Ulster
Urban Rural FiannaFail
Fine Gael
Lab-our
Green Party
Sinn Fein
Indep/Others
Wouldnot/DK
Weighted Total 3,306 1,635 1,671 1,097 1,222 987 1,330 1,726 250 940 843 937 586 2,018 1,287 385 734 230 104 455 383 1,010
Unweighted Total 946 466 480 287 367 292 387 496 63 253 232 266 194 642 304 106 230 79 28 119 104 278Fianna Fail 385 206 179 91 118 177 168 183 35 92 108 128 57 220 166 385 - - - - - -
12% 13% 11% 8% 10% 18% 13% 11% 14% 10% 13% 14% 10% 11% 13% 100% - - - - - -
Fine Gael 734 416 318 160 279 295 305 336 93 201 214 199 121 435 300 - 734 - - - - -22% 25% 19% 15% 23% 30% 23% 19% 37% 21% 25% 21% 21% 22% 23% - 100% - - - - -
Labour 230 94 136 90 77 62 109 115 6 74 76 74 5 170 60 - - 230 - - - -7% 6% 8% 8% 6% 6% 8% 7% 3% 8% 9% 8% 1% 8% 5% - - 100% - - - -
Green Party 104 37 67 53 37 14 35 68 1 61 10 16 17 79 25 - - - 104 - - -3% 2% 4% 5% 3% 1% 3% 4% 0% 6% 1% 2% 3% 4% 2% - - - 100% - - -
Workers Party 5 - 5 - 1 3 - 5 - 5 - - - 5 - - - - - - - -0% - 0% - 0% 0% - 0% - 0% - - - 0% - - - - - - - -
Sinn Fein 455 259 195 205 172 77 149 303 2 119 94 107 135 276 178 - - - - 455 - -14% 16% 12% 19% 14% 8% 11% 18% 1% 13% 11% 11% 23% 14% 14% - - - - 100% - -
Independent/Other 383 224 159 125 154 104 164 176 43 116 85 99 83 205 178 - - - - - 383 -12% 14% 9% 11% 13% 11% 12% 10% 17% 12% 10% 11% 14% 10% 14% - - - - - 100% -
Don’t know 770 315 455 288 283 199 315 404 52 233 201 215 121 465 305 - - - - - - 77023% 19% 27% 26% 23% 20% 24% 23% 21% 25% 24% 23% 21% 23% 24% - - - - - - 76%
Would not vote 240 83 158 84 102 55 86 138 17 40 55 98 47 164 77 - - - - - - 2407% 5% 9% 8% 8% 6% 6% 8% 7% 4% 7% 10% 8% 8% 6% - - - - - - 24%

April TeleBar 2012 Sunday Times/Behaviour & Attitudes Opinion Poll
J3719
Table 8 Fieldwork : 11th - 17th April 2012 Page 16
Q8 If there was a General Election tomorrow, to which party or independent candidate would you give your first preference vote?
Base : All Irish Voters Total Likelihood Treaty Understanding
Wouldvote
Woulddefinitely vote
Wouldprobably vote
Might/might
not
Wouldnot Vote
Don't Understand
Understand
Weighted Total 3,306 2,763 2,362 401 146 361 1,822 1,484
Unweighted Total 946 792 677 115 41 105 501 445Fianna Fail 385 346 308 39 22 17 215 171
12% 13% 13% 10% 15% 5% 12% 12%
Fine Gael 734 689 632 57 13 32 280 45422% 25% 27% 14% 9% 9% 15% 31%
Labour 230 202 187 15 14 13 114 1157% 7% 8% 4% 10% 4% 6% 8%
Green Party 104 98 85 13 3 3 68 363% 4% 4% 3% 2% 1% 4% 2%
Workers Party 5 5 5 - - - 1 30% 0% 0% - - - 0% 0%
Sinn Fein 455 351 295 56 45 48 264 19114% 13% 13% 14% 31% 13% 14% 13%
Independent/Other 383 360 304 56 14 9 182 20112% 13% 13% 14% 10% 2% 10% 14%
Don’t know 770 645 514 132 11 99 502 26823% 23% 22% 33% 7% 27% 28% 18%
Would not vote 240 66 31 35 25 139 195 467% 2% 1% 9% 17% 38% 11% 3%

April TeleBar 2012 Sunday Times/Behaviour & Attitudes Opinion Poll
J3719
Table 9 Fieldwork : 11th - 17th April 2012 Page 17
Q8 If there was a General Election tomorrow, to which party or independent candidate would you give your first preference vote?
Base : All Irish VotersAll voters excluding undecided
Total Gender Age Class Region Area Party Support
Male Female 18-34 35-54 55+ ABC1 C2DE F Dublin Lein-ster
Mun-ster
Conn/Ulster
Urban Rural FiannaFail
Fine Gael
Lab-our
Green Party
Sinn Fein
Indep/Others
Wouldnot/DK
Weighted Total 2,295 1,237 1,059 725 837 733 929 1,185 182 667 587 623 418 1,389 906 385 734 230 104 455 383 -
Unweighted Total 668 360 308 198 254 216 279 340 49 184 166 180 137 446 222 106 230 79 28 119 104 -Fianna Fail 385 206 179 91 118 177 168 183 35 92 108 128 57 220 166 385 - - - - - -
17% 17% 17% 13% 14% 24% 18% 15% 19% 14% 18% 21% 14% 16% 18% 100% - - - - - -
Fine Gael 734 416 318 160 279 295 305 336 93 201 214 199 121 435 300 - 734 - - - - -32% 34% 30% 22% 33% 40% 33% 28% 51% 30% 36% 32% 29% 31% 33% - 100% - - - - -
Labour 230 94 136 90 77 62 109 115 6 74 76 74 5 170 60 - - 230 - - - -10% 8% 13% 12% 9% 8% 12% 10% 4% 11% 13% 12% 1% 12% 7% - - 100% - - - -
Green Party 104 37 67 53 37 14 35 68 1 61 10 16 17 79 25 - - - 104 - - -5% 3% 6% 7% 4% 2% 4% 6% 0% 9% 2% 3% 4% 6% 3% - - - 100% - - -
Workers Party 5 - 5 - 1 3 - 5 - 5 - - - 5 - - - - - - - -0% - 0% - 0% 0% - 0% - 1% - - - 0% - - - - - - - -
Sinn Fein 455 259 195 205 172 77 149 303 2 119 94 107 135 276 178 - - - - 455 - -20% 21% 18% 28% 21% 11% 16% 26% 1% 18% 16% 17% 32% 20% 20% - - - - 100% - -
Independent/Other 383 224 159 125 154 104 164 176 43 116 85 99 83 205 178 - - - - - 383 -17% 18% 15% 17% 18% 14% 18% 15% 24% 17% 15% 16% 20% 15% 20% - - - - - 100% -

April TeleBar 2012 Sunday Times/Behaviour & Attitudes Opinion Poll
J3719
Table 9 Fieldwork : 11th - 17th April 2012 Page 18
Q8 If there was a General Election tomorrow, to which party or independent candidate would you give your first preference vote?
Base : All Irish VotersAll voters excluding undecided
Total Likelihood Treaty Understanding
Wouldvote
Woulddefinitely vote
Wouldprobably vote
Might/might
not
Wouldnot Vote
Don't Understand
Understand
Weighted Total 2,295 2,051 1,817 235 111 123 1,125 1,170
Unweighted Total 668 598 531 67 26 41 321 347Fianna Fail 385 346 308 39 22 17 215 171
17% 17% 17% 17% 19% 14% 19% 15%
Fine Gael 734 689 632 57 13 32 280 45432% 34% 35% 24% 12% 26% 25% 39%
Labour 230 202 187 15 14 13 114 11510% 10% 10% 6% 13% 11% 10% 10%
Green Party 104 98 85 13 3 3 68 365% 5% 5% 5% 3% 3% 6% 3%
Workers Party 5 5 5 - - - 1 30% 0% 0% - - - 0% 0%
Sinn Fein 455 351 295 56 45 48 264 19120% 17% 16% 24% 41% 39% 23% 16%
Independent/Other 383 360 304 56 14 9 182 20117% 18% 17% 24% 13% 7% 16% 17%

April TeleBar 2012 Sunday Times/Behaviour & Attitudes Opinion Poll
J3719
Table 10 Fieldwork : 11th - 17th April 2012 Page 19
Adjusted Party Support : Q8 If there was a General Election tomorrow, to which party or independent candidate would you give your first preference vote?
Total Gender Age Class Region Area Party Support
Male Female 18-34 35-54 55+ ABC1 C2DE F Dublin Lein-ster
Mun-ster
Conn/Ulster
Urban Rural FiannaFail
Fine Gael
Lab-our
Green Party
Sinn Fein
Indep/Others
Wouldnot/DK
Weighted Total 1,807 1,000 806 470 702 634 743 927 136 579 471 440 316 1,138 668 273 595 250 86 282 317 -
Unweighted Total 534 294 240 118 223 193 226 270 38 159 134 138 102 361 173 85 199 66 21 78 83 -Fianna Fail 273 152 121 42 90 140 100 150 23 75 69 88 41 158 115 273 - - - - - -
15% 15% 15% 9% 13% 22% 13% 16% 17% 13% 15% 20% 13% 14% 17% 100% - - - - - -
Fine Gael 595 354 241 93 245 256 227 284 84 161 185 150 99 344 250 - 595 - - - - -33% 35% 30% 20% 35% 40% 30% 31% 62% 28% 39% 34% 31% 30% 37% - 100% - - - - -
Labour 250 107 143 94 79 77 126 115 9 92 87 65 5 201 48 - - 250 - - - -14% 11% 18% 20% 11% 12% 17% 12% 7% 16% 19% 15% 1% 18% 7% - - 100% - - - -
Green Party 86 33 53 43 29 14 34 50 1 61 8 5 13 65 21 - - - 86 - - -5% 3% 7% 9% 4% 2% 5% 5% 1% 10% 2% 1% 4% 6% 3% - - - 100% - - -
Workers Party 5 - 5 - 1 3 - 5 - 5 - - - 5 - - - - - - - -0% - 1% - 0% 1% - 1% - 1% - - - 0% - - - - - - - -
Sinn Fein 282 166 116 97 115 69 106 174 2 76 53 59 94 177 105 - - - - 282 - -16% 17% 14% 21% 16% 11% 14% 19% 2% 13% 11% 13% 30% 16% 16% - - - - 100% - -
Independent/Other 317 189 128 101 142 74 151 150 16 110 69 73 65 188 129 - - - - - 317 -18% 19% 16% 21% 20% 12% 20% 16% 12% 19% 15% 17% 20% 17% 19% - - - - - 100% -

April TeleBar 2012 Sunday Times/Behaviour & Attitudes Opinion Poll
J3719
Table 10 Fieldwork : 11th - 17th April 2012 Page 20
Adjusted Party Support : Q8 If there was a General Election tomorrow, to which party or independent candidate would you give your first preference vote?
Total Likelihood Treaty Understanding
Wouldvote
Woulddefinitely vote
Wouldprobably vote
Might/might
not
Wouldnot Vote
Don't Understand
Understand
Weighted Total 1,807 1,807 1,807 - - - 783 1,023
Unweighted Total 534 534 534 - - - 224 310Fianna Fail 273 273 273 - - - 138 135
15% 15% 15% - - - 18% 13%
Fine Gael 595 595 595 - - - 198 39733% 33% 33% - - - 25% 39%
Labour 250 250 250 - - - 119 13114% 14% 14% - - - 15% 13%
Green Party 86 86 86 - - - 50 365% 5% 5% - - - 6% 4%
Workers Party 5 5 5 - - - 1 30% 0% 0% - - - 0% 0%
Sinn Fein 282 282 282 - - - 138 14416% 16% 16% - - - 18% 14%
Independent/Other 317 317 317 - - - 139 17818% 18% 18% - - - 18% 17%
April TeleBar 2012 Sunday Times/Behaviour & Attitudes Opinion Poll
J3719
Table 11 Fieldwork : 11th - 17th April 2012 Page 21
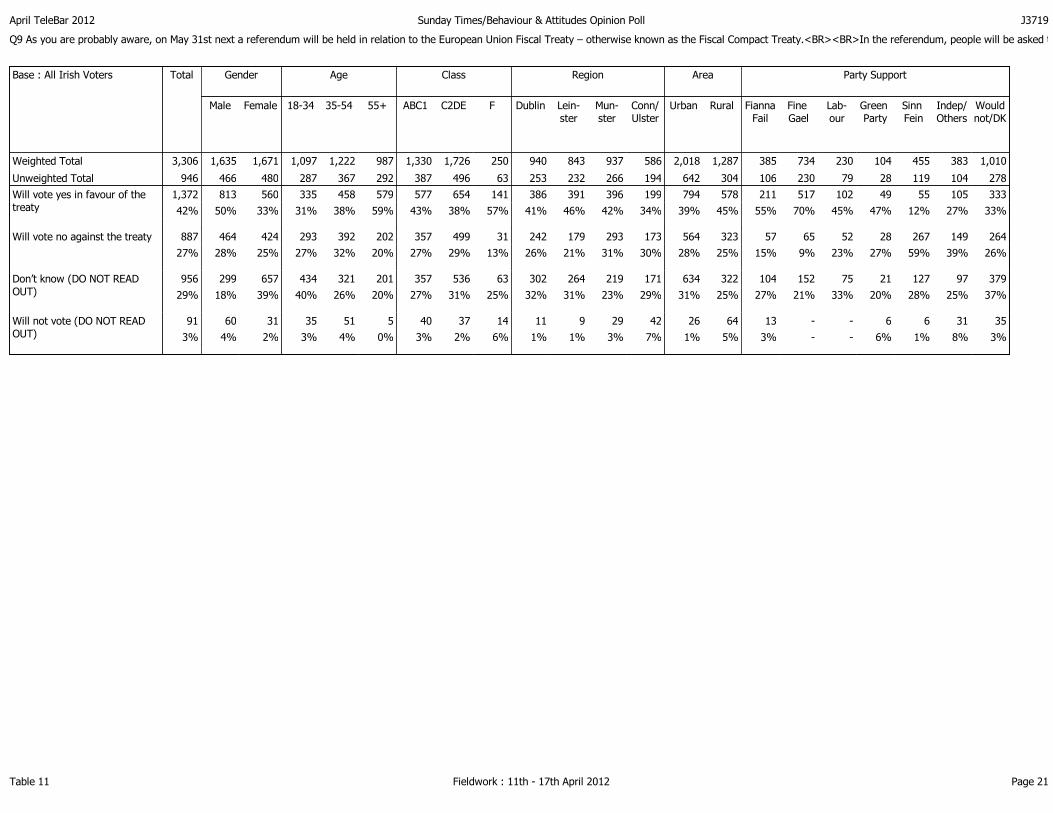
Q9 As you are probably aware, on May 31st next a referendum will be held in relation to the European Union Fiscal Treaty – otherwise known as the Fiscal Compact Treaty.<BR><BR>In the referendum, people will be asked to vote either in favour of or against the Treaty.<BR><BR>Are you yourself likely to vote yes in favour of the European Union Fiscal Treaty, or no against the European Union Fiscal Treaty?<BR><BR><FONT color=#ff6600>PLEASE READ OUT</FONT>
Base : All Irish Voters Total Gender Age Class Region Area Party Support
Male Female 18-34 35-54 55+ ABC1 C2DE F Dublin Lein-ster
Mun-ster
Conn/Ulster
Urban Rural FiannaFail
Fine Gael
Lab-our
Green Party
Sinn Fein
Indep/Others
Wouldnot/DK
Weighted Total 3,306 1,635 1,671 1,097 1,222 987 1,330 1,726 250 940 843 937 586 2,018 1,287 385 734 230 104 455 383 1,010
Unweighted Total 946 466 480 287 367 292 387 496 63 253 232 266 194 642 304 106 230 79 28 119 104 278Will vote yes in favour of the treaty
1,372 813 560 335 458 579 577 654 141 386 391 396 199 794 578 211 517 102 49 55 105 33342% 50% 33% 31% 38% 59% 43% 38% 57% 41% 46% 42% 34% 39% 45% 55% 70% 45% 47% 12% 27% 33%
Will vote no against the treaty 887 464 424 293 392 202 357 499 31 242 179 293 173 564 323 57 65 52 28 267 149 26427% 28% 25% 27% 32% 20% 27% 29% 13% 26% 21% 31% 30% 28% 25% 15% 9% 23% 27% 59% 39% 26%
Don’t know (DO NOT READ OUT)
956 299 657 434 321 201 357 536 63 302 264 219 171 634 322 104 152 75 21 127 97 37929% 18% 39% 40% 26% 20% 27% 31% 25% 32% 31% 23% 29% 31% 25% 27% 21% 33% 20% 28% 25% 37%
Will not vote (DO NOT READ OUT)
91 60 31 35 51 5 40 37 14 11 9 29 42 26 64 13 - - 6 6 31 353% 4% 2% 3% 4% 0% 3% 2% 6% 1% 1% 3% 7% 1% 5% 3% - - 6% 1% 8% 3%

April TeleBar 2012 Sunday Times/Behaviour & Attitudes Opinion Poll
J3719
Table 11 Fieldwork : 11th - 17th April 2012 Page 22
Q9 As you are probably aware, on May 31st next a referendum will be held in relation to the European Union Fiscal Treaty – otherwise known as the Fiscal Compact Treaty.<BR><BR>In the referendum, people will be asked to vote either in favour of or against the Treaty.<BR><BR>Are you yourself likely to vote yes in favour of the European Union Fiscal Treaty, or no against the European Union Fiscal Treaty?<BR><BR><FONT color=#ff6600>PLEASE READ OUT</FONT>
Base : All Irish Voters Total Likelihood Treaty Understanding
Wouldvote
Woulddefinitely vote
Wouldprobably vote
Might/might
not
Wouldnot Vote
Don't Understand
Understand
Weighted Total 3,306 2,763 2,362 401 146 361 1,822 1,484
Unweighted Total 946 792 677 115 41 105 501 445Will vote yes in favour of the treaty
1,372 1,254 1,120 134 16 98 520 85342% 45% 47% 33% 11% 27% 29% 57%
Will vote no against the treaty 887 710 590 120 54 116 441 44727% 26% 25% 30% 37% 32% 24% 30%
Don’t know (DO NOT READ OUT)
956 754 615 139 57 120 807 14829% 27% 26% 35% 39% 33% 44% 10%
Will not vote (DO NOT READ OUT)
91 45 37 8 19 27 54 363% 2% 2% 2% 13% 7% 3% 2%

April TeleBar 2012 Sunday Times/Behaviour & Attitudes Opinion Poll
J3719
Table 12 Fieldwork : 11th - 17th April 2012 Page 23
Q10 And thinking of the forthcoming European Union Fiscal Treaty Referendum.<BR><BR>On a scale of 1 to 5 where 5 is you understand it very well and 1 is you do not understand it at all, how well do you feel you understand what the European Union Fiscal Treaty referendum is about? <BR><BR><FONT color=#ff6600>PLEASE READ OUT</FONT>
Base : All Irish Voters Total Gender Age Class Region Area Party Support
Male Female 18-34 35-54 55+ ABC1 C2DE F Dublin Lein-ster
Mun-ster
Conn/Ulster
Urban Rural FiannaFail
Fine Gael
Lab-our
Green Party
Sinn Fein
Indep/Others
Wouldnot/DK
Weighted Total 3,306 1,635 1,671 1,097 1,222 987 1,330 1,726 250 940 843 937 586 2,018 1,287 385 734 230 104 455 383 1,010
Unweighted Total 946 466 480 287 367 292 387 496 63 253 232 266 194 642 304 106 230 79 28 119 104 2781 Do not understand it at all 1,054 420 634 438 349 267 374 578 102 304 250 288 212 673 380 106 138 67 30 166 116 430
32% 26% 38% 40% 29% 27% 28% 33% 41% 32% 30% 31% 36% 33% 30% 28% 19% 29% 29% 36% 30% 43%
2 Do not understand it particularly well
768 333 435 324 243 201 272 452 45 180 235 212 141 459 309 109 143 47 38 98 66 26723% 20% 26% 30% 20% 20% 20% 26% 18% 19% 28% 23% 24% 23% 24% 28% 19% 21% 37% 22% 17% 26%
3 Understand it to some extent 906 459 447 230 412 264 414 426 66 280 221 256 149 523 383 105 276 57 20 111 119 21827% 28% 27% 21% 34% 27% 31% 25% 26% 30% 26% 27% 25% 26% 30% 27% 38% 25% 19% 24% 31% 22%
4 Understand it quite well 395 268 126 61 166 168 181 186 28 126 88 115 65 227 167 40 130 49 16 41 63 5212% 16% 8% 6% 14% 17% 14% 11% 11% 13% 10% 12% 11% 11% 13% 10% 18% 21% 15% 9% 17% 5%
5 Understand it very well 183 154 29 44 53 86 89 84 10 51 47 66 19 136 48 26 48 9 - 38 19 446% 9% 2% 4% 4% 9% 7% 5% 4% 5% 6% 7% 3% 7% 4% 7% 7% 4% - 8% 5% 4%
Mean 2.36 2.64 2.09 2.04 2.45 2.60 2.50 2.27 2.20 2.41 2.34 2.42 2.21 2.35 2.37 2.40 2.74 2.50 2.21 2.31 2.49 2.02

April TeleBar 2012 Sunday Times/Behaviour & Attitudes Opinion Poll
J3719
Table 12 Fieldwork : 11th - 17th April 2012 Page 24
Q10 And thinking of the forthcoming European Union Fiscal Treaty Referendum.<BR><BR>On a scale of 1 to 5 where 5 is you understand it very well and 1 is you do not understand it at all, how well do you feel you understand what the European Union Fiscal Treaty referendum is about? <BR><BR><FONT color=#ff6600>PLEASE READ OUT</FONT>
Base : All Irish Voters Total Likelihood Treaty Understanding
Wouldvote
Woulddefinitely vote
Wouldprobably vote
Might/might
not
Wouldnot Vote
Don't Understand
Understand
Weighted Total 3,306 2,763 2,362 401 146 361 1,822 1,484
Unweighted Total 946 792 677 115 41 105 501 4451 Do not understand it at all 1,054 771 624 146 67 192 1,054 -
32% 28% 26% 37% 46% 53% 58% -
2 Do not understand it particularly well
768 634 492 142 51 83 768 -23% 23% 21% 35% 35% 23% 42% -
3 Understand it to some extent 906 803 727 75 25 71 - 90627% 29% 31% 19% 17% 20% - 61%
4 Understand it quite well 395 392 365 27 - 3 - 39512% 14% 15% 7% - 1% - 27%
5 Understand it very well 183 163 153 10 3 11 - 1836% 6% 6% 3% 2% 3% - 12%
Mean 2.36 2.47 2.55 2.03 1.77 1.77 1.42 3.51

April TeleBar 2012 Sunday Times/Behaviour & Attitudes Opinion Poll
J3719
Table 13 Fieldwork : 11th - 17th April 2012 Page 25
Q11 How likely would you be to vote if there was a General Election tomorrow?
Base : All Irish Voters Total Gender Age Class Region Area Party Support
Male Female 18-34 35-54 55+ ABC1 C2DE F Dublin Lein-ster
Mun-ster
Conn/Ulster
Urban Rural FiannaFail
Fine Gael
Lab-our
Green Party
Sinn Fein
Indep/Others
Wouldnot/DK
Weighted Total 3,306 1,635 1,671 1,097 1,222 987 1,330 1,726 250 940 843 937 586 2,018 1,287 385 734 230 104 455 383 1,010
Unweighted Total 946 466 480 287 367 292 387 496 63 253 232 266 194 642 304 106 230 79 28 119 104 278Would definitely vote 2,362 1,218 1,144 585 946 830 990 1,201 170 741 609 612 400 1,459 903 308 632 187 85 295 304 545
71% 74% 68% 53% 77% 84% 74% 70% 68% 79% 72% 65% 68% 72% 70% 80% 86% 82% 82% 65% 79% 54%
Would probably vote 401 142 258 212 110 78 141 212 48 63 126 150 62 225 175 39 57 15 13 56 56 16612% 9% 15% 19% 9% 8% 11% 12% 19% 7% 15% 16% 11% 11% 14% 10% 8% 7% 12% 12% 14% 16%
Might/might not vote 146 76 71 84 59 4 62 73 12 31 19 65 31 75 71 22 13 14 3 45 14 364% 5% 4% 8% 5% 0% 5% 4% 5% 3% 2% 7% 5% 4% 6% 6% 2% 6% 3% 10% 4% 4%
Would probably not vote 188 94 94 98 59 31 76 101 11 31 63 38 56 109 79 14 27 4 2 39 6 966% 6% 6% 9% 5% 3% 6% 6% 4% 3% 7% 4% 10% 5% 6% 4% 4% 2% 2% 9% 1% 10%
Would definitely not vote 173 83 90 96 39 38 45 119 9 58 20 67 27 122 51 4 5 9 1 9 3 1425% 5% 5% 9% 3% 4% 3% 7% 4% 6% 2% 7% 5% 6% 4% 1% 1% 4% 1% 2% 1% 14%
Don’t know 36 22 14 22 9 6 16 21 - 16 6 6 9 27 9 - - - - 11 - 251% 1% 1% 2% 1% 1% 1% 1% - 2% 1% 1% 2% 1% 1% - - - - 2% - 3%
Mean 4.40 4.44 4.37 4.02 4.54 4.66 4.49 4.33 4.44 4.51 4.48 4.29 4.30 4.40 4.41 4.64 4.75 4.60 4.71 4.33 4.70 3.89

April TeleBar 2012 Sunday Times/Behaviour & Attitudes Opinion Poll
J3719
Table 13 Fieldwork : 11th - 17th April 2012 Page 26
Q11 How likely would you be to vote if there was a General Election tomorrow?
Base : All Irish Voters Total Likelihood Treaty Understanding
Wouldvote
Woulddefinitely vote
Wouldprobably vote
Might/might
not
Wouldnot Vote
Don't Understand
Understand
Weighted Total 3,306 2,763 2,362 401 146 361 1,822 1,484
Unweighted Total 946 792 677 115 41 105 501 445Would definitely vote 2,362 2,362 2,362 - - - 1,117 1,245
71% 85% 100% - - - 61% 84%
Would probably vote 401 401 - 401 - - 289 11212% 15% - 100% - - 16% 8%
Might/might not vote 146 - - - 146 - 118 284% - - - 100% - 6% 2%
Would probably not vote 188 - - - - 188 139 496% - - - - 52% 8% 3%
Would definitely not vote 173 - - - - 173 136 365% - - - - 48% 7% 2%
Don’t know 36 - - - - - 23 131% - - - - - 1% 1%
Mean 4.40 4.85 5.00 4.00 3.00 1.52 4.17 4.69

April TeleBar 2012 Sunday Times/Behaviour & Attitudes Opinion Poll
J3719
Table 14 Fieldwork : 11th - 17th April 2012 Page 27
Q12 And finally, to which party or independent candidate did you give your first preference vote in last February’s General Election?
Base : All Irish Voters Total Gender Age Class Region Area Party Support
Male Female 18-34 35-54 55+ ABC1 C2DE F Dublin Lein-ster
Mun-ster
Conn/Ulster
Urban Rural FiannaFail
Fine Gael
Lab-our
Green Party
Sinn Fein
Indep/Others
Wouldnot/DK
Weighted Total 3,306 1,635 1,671 1,097 1,222 987 1,330 1,726 250 940 843 937 586 2,018 1,287 385 734 230 104 455 383 1,010
Unweighted Total 946 466 480 287 367 292 387 496 63 253 232 266 194 642 304 106 230 79 28 119 104 278Fianna Fail 513 244 269 98 171 244 201 266 46 150 125 168 70 279 234 272 57 9 10 21 36 107
16% 15% 16% 9% 14% 25% 15% 15% 18% 16% 15% 18% 12% 14% 18% 71% 8% 4% 10% 5% 9% 11%
Fine Gael 978 493 485 186 436 356 414 453 111 270 241 284 183 565 413 34 548 21 23 53 66 23330% 30% 29% 17% 36% 36% 31% 26% 44% 29% 29% 30% 31% 28% 32% 9% 75% 9% 22% 12% 17% 23%
Labour 351 160 191 111 129 111 146 201 4 106 90 137 19 246 105 15 10 157 2 26 38 10211% 10% 11% 10% 11% 11% 11% 12% 2% 11% 11% 15% 3% 12% 8% 4% 1% 68% 2% 6% 10% 10%
Green Party 49 26 23 11 18 19 28 21 - 30 - 9 9 39 9 1 - - 23 7 - 181% 2% 1% 1% 1% 2% 2% 1% - 3% - 1% 2% 2% 1% 0% - - 22% 1% - 2%
Workers Party 1 - 1 - 1 - - 1 - 1 - - - 1 - - - - - - - -0% - 0% - 0% - - 0% - 0% - - - 0% - - - - - - - -
Sinn Fein 240 131 109 79 122 39 81 159 - 86 47 32 76 163 77 - 1 - - 200 16 237% 8% 7% 7% 10% 4% 6% 9% - 9% 6% 3% 13% 8% 6% - 0% - - 44% 4% 2%
Independent/Other 364 212 152 132 135 98 115 213 36 68 88 110 98 195 170 8 34 7 5 68 162 7711% 13% 9% 12% 11% 10% 9% 12% 14% 7% 10% 12% 17% 10% 13% 2% 5% 3% 5% 15% 42% 8%
Don’t know 409 157 253 180 131 98 165 201 44 92 142 104 72 245 164 21 40 26 27 26 39 23112% 10% 15% 16% 11% 10% 12% 12% 17% 10% 17% 11% 12% 12% 13% 5% 5% 11% 26% 6% 10% 23%
Did not vote 399 212 187 300 78 21 179 212 9 136 110 94 59 285 114 34 44 9 13 53 26 21912% 13% 11% 27% 6% 2% 13% 12% 4% 14% 13% 10% 10% 14% 9% 9% 6% 4% 13% 12% 7% 22%

April TeleBar 2012 Sunday Times/Behaviour & Attitudes Opinion Poll
J3719
Table 14 Fieldwork : 11th - 17th April 2012 Page 28
Q12 And finally, to which party or independent candidate did you give your first preference vote in last February’s General Election?
Base : All Irish Voters Total Likelihood Treaty Understanding
Wouldvote
Woulddefinitely vote
Wouldprobably vote
Might/might
not
Wouldnot Vote
Don't Understand
Understand
Weighted Total 3,306 2,763 2,362 401 146 361 1,822 1,484
Unweighted Total 946 792 677 115 41 105 501 445Fianna Fail 513 480 428 52 23 10 278 235
16% 17% 18% 13% 16% 3% 15% 16%
Fine Gael 978 884 794 90 21 64 435 54230% 32% 34% 22% 15% 18% 24% 37%
Labour 351 292 238 53 22 37 215 13711% 11% 10% 13% 15% 10% 12% 9%
Green Party 49 38 35 3 2 8 24 251% 1% 1% 1% 1% 2% 1% 2%
Workers Party 1 1 1 - - - 1 -0% 0% 0% - - - 0% -
Sinn Fein 240 208 189 19 - 29 110 1307% 8% 8% 5% - 8% 6% 9%
Independent/Other 364 340 298 42 10 11 196 16811% 12% 13% 10% 7% 3% 11% 11%
Don’t know 409 365 282 83 10 20 273 13712% 13% 12% 21% 7% 6% 15% 9%
Did not vote 399 154 96 58 57 180 290 10912% 6% 4% 14% 39% 50% 16% 7%

April TeleBar 2012 Sunday Times/Behaviour & Attitudes Opinion Poll
J3719
Table 15 Fieldwork : 11th - 17th April 2012 Page 29
Q13 And finally, to which party or independent candidate did you give your first preference vote in last February’s General Election?
Base : All Irish Voters : All Voters Excluding did not vote (Last Gen Election)
Total Gender Age Class Region Area Party Support
Male Female 18-34 35-54 55+ ABC1 C2DE F Dublin Lein-ster
Mun-ster
Conn/Ulster
Urban Rural FiannaFail
Fine Gael
Lab-our
Green Party
Sinn Fein
Indep/Others
Wouldnot/DK
Weighted Total 2,497 1,266 1,231 617 1,013 867 986 1,314 197 712 591 739 455 1,488 1,009 330 650 194 64 375 318 560
Unweighted Total 728 378 350 164 305 259 302 376 50 199 172 210 146 484 244 87 205 66 19 97 86 166Fianna Fail 513 244 269 98 171 244 201 266 46 150 125 168 70 279 234 272 57 9 10 21 36 107
21% 19% 22% 16% 17% 28% 20% 20% 23% 21% 21% 23% 15% 19% 23% 82% 9% 5% 16% 6% 11% 19%
Fine Gael 978 493 485 186 436 356 414 453 111 270 241 284 183 565 413 34 548 21 23 53 66 23339% 39% 39% 30% 43% 41% 42% 35% 56% 38% 41% 38% 40% 38% 41% 10% 84% 11% 36% 14% 21% 42%
Labour 351 160 191 111 129 111 146 201 4 106 90 137 19 246 105 15 10 157 2 26 38 10214% 13% 16% 18% 13% 13% 15% 15% 2% 15% 15% 18% 4% 17% 10% 5% 2% 81% 4% 7% 12% 18%
Green Party 49 26 23 11 18 19 28 21 - 30 - 9 9 39 9 1 - - 23 7 - 182% 2% 2% 2% 2% 2% 3% 2% - 4% - 1% 2% 3% 1% 0% - - 36% 2% - 3%
Workers Party 1 - 1 - 1 - - 1 - 1 - - - 1 - - - - - - - -0% - 0% - 0% - - 0% - 0% - - - 0% - - - - - - - -
Sinn Fein 240 131 109 79 122 39 81 159 - 86 47 32 76 163 77 - 1 - - 200 16 2310% 10% 9% 13% 12% 4% 8% 12% - 12% 8% 4% 17% 11% 8% - 0% - - 53% 5% 4%
Independent/Other 364 212 152 132 135 98 115 213 36 68 88 110 98 195 170 8 34 7 5 68 162 7715% 17% 12% 21% 13% 11% 12% 16% 18% 10% 15% 15% 21% 13% 17% 2% 5% 4% 8% 18% 51% 14%

April TeleBar 2012 Sunday Times/Behaviour & Attitudes Opinion Poll
J3719
Table 15 Fieldwork : 11th - 17th April 2012 Page 30
Q13 And finally, to which party or independent candidate did you give your first preference vote in last February’s General Election?
Base : All Irish Voters : All Voters Excluding did not vote (Last Gen Election)
Total Likelihood Treaty Understanding
Wouldvote
Woulddefinitely vote
Wouldprobably vote
Might/might
not
Wouldnot Vote
Don't Understand
Understand
Weighted Total 2,497 2,243 1,984 259 79 161 1,259 1,238
Unweighted Total 728 652 580 72 19 53 357 371Fianna Fail 513 480 428 52 23 10 278 235
21% 21% 22% 20% 29% 6% 22% 19%
Fine Gael 978 884 794 90 21 64 435 54239% 39% 40% 35% 27% 40% 35% 44%
Labour 351 292 238 53 22 37 215 13714% 13% 12% 21% 28% 23% 17% 11%
Green Party 49 38 35 3 2 8 24 252% 2% 2% 1% 3% 5% 2% 2%
Workers Party 1 1 1 - - - 1 -0% 0% 0% - - - 0% -
Sinn Fein 240 208 189 19 - 29 110 13010% 9% 10% 7% - 18% 9% 10%
Independent/Other 364 340 298 42 10 11 196 16815% 15% 15% 16% 13% 7% 16% 14%
April TeleBar 2012 Sunday Times/Behaviour & Attitudes Opinion Poll
J3719
Table 16 Fieldwork : 11th - 17th April 2012 Page 31
Analysis of Sample
Base : All Irish Voters Total Gender Age Class Region Area
Male Female 18-34 35-54 55+ ABC1 C2DE F Dublin Lein-ster
Mun-ster
Conn/Ulster
Urban Rural
Weighted 3,306 1,635 1,671 1,097 1,222 987 1,330 1,726 250 940 843 937 586 2,018 1,287
Unweighted 946 466 480 287 367 292 387 496 63 253 232 266 194 642 304GenderMale 1,635 1,635 - 560 620 454 679 791 165 519 381 456 278 1,044 590
49% 100% - 51% 51% 46% 51% 46% 66% 55% 45% 49% 47% 52% 46%
Female 1,671 - 1,671 537 602 533 651 935 85 421 462 481 308 974 69751% - 100% 49% 49% 54% 49% 54% 34% 45% 55% 51% 53% 48% 54%
Age18-34 1,097 560 537 1,097 - - 539 500 58 367 283 267 180 769 328
33% 34% 32% 100% - - 41% 29% 23% 39% 34% 29% 31% 38% 25%
35-54 1,222 620 602 - 1,222 - 510 627 85 298 315 383 226 683 53937% 38% 36% - 100% - 38% 36% 34% 32% 37% 41% 39% 34% 42%
55+ 987 454 533 - - 987 280 599 107 275 244 287 180 566 42130% 28% 32% - - 100% 21% 35% 43% 29% 29% 31% 31% 28% 33%
ClassABC1 1,330 679 651 539 510 280 1,330 - - 478 343 320 189 910 420
40% 42% 39% 49% 42% 28% 100% - - 51% 41% 34% 32% 45% 33%
C2DE 1,726 791 935 500 627 599 - 1,726 - 459 431 508 328 1,090 63652% 48% 56% 46% 51% 61% - 100% - 49% 51% 54% 56% 54% 49%
F 250 165 85 58 85 107 - - 250 3 69 109 69 18 2328% 10% 5% 5% 7% 11% - - 100% 0% 8% 12% 12% 1% 18%
RegionDublin 940 519 421 367 298 275 478 459 3 940 - - - 940 -
28% 32% 25% 33% 24% 28% 36% 27% 1% 100% - - - 47% -
Lein-ster 843 381 462 283 315 244 343 431 69 - 843 - - 441 40225% 23% 28% 26% 26% 25% 26% 25% 27% - 100% - - 22% 31%

April TeleBar 2012 Sunday Times/Behaviour & Attitudes Opinion Poll
J3719
Table 16 Fieldwork : 11th - 17th April 2012 Page 32
Analysis of Sample
Base : All Irish Voters Total Gender Age Class Region Area
Male Female 18-34 35-54 55+ ABC1 C2DE F Dublin Lein-ster
Mun-ster
Conn/Ulster
Urban Rural
Weighted 3,306 1,635 1,671 1,097 1,222 987 1,330 1,726 250 940 843 937 586 2,018 1,287
Unweighted 946 466 480 287 367 292 387 496 63 253 232 266 194 642 304Mun-ster 937 456 481 267 383 287 320 508 109 - - 937 - 419 518
28% 28% 29% 24% 31% 29% 24% 29% 44% - - 100% - 21% 40%
Conn/Ulster 586 278 308 180 226 180 189 328 69 - - - 586 218 36818% 17% 18% 16% 18% 18% 14% 19% 28% - - - 100% 11% 29%
AreaUrban 2,018 1,044 974 769 683 566 910 1,090 18 940 441 419 218 2,018 -
61% 64% 58% 70% 56% 57% 68% 63% 7% 100% 52% 45% 37% 100% -
Rural 1,287 590 697 328 539 421 420 636 232 - 402 518 368 - 1,28739% 36% 42% 30% 44% 43% 32% 37% 93% - 48% 55% 63% - 100%
Party SupportFianna Fail 385 206 179 91 118 177 168 183 35 92 108 128 57 220 166
12% 13% 11% 8% 10% 18% 13% 11% 14% 10% 13% 14% 10% 11% 13%
Fine Gael 734 416 318 160 279 295 305 336 93 201 214 199 121 435 30022% 25% 19% 15% 23% 30% 23% 20% 37% 21% 25% 21% 21% 22% 23%
Labour 230 94 136 90 77 62 109 115 6 74 76 74 5 170 607% 6% 8% 8% 6% 6% 8% 7% 3% 8% 9% 8% 1% 8% 5%
Green Party 104 37 67 53 37 14 35 68 1 61 10 16 17 79 253% 2% 4% 5% 3% 1% 3% 4% 0% 7% 1% 2% 3% 4% 2%
Sinn Fein 455 259 195 205 172 77 149 303 2 119 94 107 135 276 17814% 16% 12% 19% 14% 8% 11% 18% 1% 13% 11% 11% 23% 14% 14%
Independent/Others 383 224 159 125 154 104 164 176 43 116 85 99 83 205 17812% 14% 10% 11% 13% 11% 12% 10% 17% 12% 10% 11% 14% 10% 14%
Would not/Don't Know 1,010 398 613 372 385 253 401 541 68 273 256 314 167 629 38231% 24% 37% 34% 32% 26% 30% 31% 27% 29% 30% 33% 29% 31% 30%
Likelihood

April TeleBar 2012 Sunday Times/Behaviour & Attitudes Opinion Poll
J3719
Table 16 Fieldwork : 11th - 17th April 2012 Page 33
Analysis of Sample
Base : All Irish Voters Total Gender Age Class Region Area
Male Female 18-34 35-54 55+ ABC1 C2DE F Dublin Lein-ster
Mun-ster
Conn/Ulster
Urban Rural
Weighted 3,306 1,635 1,671 1,097 1,222 987 1,330 1,726 250 940 843 937 586 2,018 1,287
Unweighted 946 466 480 287 367 292 387 496 63 253 232 266 194 642 304Would vote 2,763 1,360 1,403 797 1,057 909 1,131 1,413 218 805 735 761 462 1,684 1,078
84% 84% 85% 74% 87% 93% 86% 83% 87% 87% 88% 82% 80% 85% 84%
Might/might not 146 76 71 84 59 4 62 73 12 31 19 65 31 75 714% 5% 4% 8% 5% 0% 5% 4% 5% 3% 2% 7% 5% 4% 6%
Would not Vote 361 176 184 194 98 69 121 219 20 89 83 105 84 231 13011% 11% 11% 18% 8% 7% 9% 13% 8% 10% 10% 11% 14% 12% 10%
Mean 4.40 4.44 4.37 4.02 4.54 4.66 4.49 4.33 4.44 4.51 4.48 4.29 4.30 4.40 4.41Marital StatusSingle 917 451 466 593 248 76 419 443 55 330 203 215 168 625 292
28% 28% 28% 54% 20% 8% 32% 26% 22% 35% 24% 23% 29% 31% 23%
Married 1,666 872 794 245 813 607 624 883 158 369 446 544 306 924 74150% 53% 47% 22% 67% 62% 47% 51% 63% 39% 53% 58% 52% 46% 58%
Co-habiting 299 171 129 205 70 25 173 113 13 86 68 85 60 199 1009% 10% 8% 19% 6% 2% 13% 7% 5% 9% 8% 9% 10% 10% 8%
Widowed 231 68 163 - 7 224 50 163 18 71 74 54 33 144 877% 4% 10% - 1% 23% 4% 9% 7% 8% 9% 6% 6% 7% 7%
Divorced/seperated 193 74 120 54 84 56 64 123 6 84 52 39 18 125 686% 5% 7% 5% 7% 6% 5% 7% 2% 9% 6% 4% 3% 6% 5%
Refused - - - - - - - - - - - - - - -- - - - - - - - - - - - - - -

April TeleBar 2012 Sunday Times/Behaviour & Attitudes Opinion Poll
J3719
Table 16 Fieldwork : 11th - 17th April 2012 Page 34
Analysis of Sample
Base : All Irish Voters Total Party Support Likelihood Treaty Understanding
FiannaFail
Fine Gael
Lab-our
Green Party
Sinn Fein
Indep/Others
Wouldnot/DK
Wouldvote
Woulddefinitely vote
Wouldprobably vote
Might/might
not
Wouldnot Vote
Don't Understand
Understand
Weighted 3,306 385 734 230 104 455 383 1,010 2,763 2,362 401 146 361 1,822 1,484
Unweighted 946 106 230 79 28 119 104 278 792 677 115 41 105 501 445GenderMale 1,635 206 416 94 37 259 224 398 1,360 1,218 142 76 176 753 882
49% 53% 57% 41% 36% 57% 59% 39% 49% 52% 36% 52% 49% 41% 59%
Female 1,671 179 318 136 67 195 159 613 1,403 1,144 258 71 184 1,069 60351% 47% 43% 59% 64% 43% 41% 61% 51% 48% 64% 48% 51% 59% 41%
Age18-34 1,097 91 160 90 53 205 125 372 797 585 212 84 194 762 335
33% 24% 22% 39% 51% 45% 33% 37% 29% 25% 53% 57% 54% 42% 23%
35-54 1,222 118 279 77 37 172 154 385 1,057 946 110 59 98 591 63137% 30% 38% 34% 35% 38% 40% 38% 38% 40% 27% 41% 27% 32% 42%
55+ 987 177 295 62 14 77 104 253 909 830 78 4 69 468 51830% 46% 40% 27% 14% 17% 27% 25% 33% 35% 20% 2% 19% 26% 35%
ClassABC1 1,330 168 305 109 35 149 164 401 1,131 990 141 62 121 645 685
40% 43% 42% 47% 34% 33% 43% 40% 41% 42% 35% 42% 34% 35% 46%
C2DE 1,726 183 336 115 68 303 176 541 1,413 1,201 212 73 219 1,030 69652% 47% 46% 50% 66% 67% 46% 54% 51% 51% 53% 50% 61% 57% 47%
F 250 35 93 6 1 2 43 68 218 170 48 12 20 147 1038% 9% 13% 3% 1% 1% 11% 7% 8% 7% 12% 8% 6% 8% 7%
RegionDublin 940 92 201 74 61 119 116 273 805 741 63 31 89 483 457
28% 24% 27% 32% 59% 26% 30% 27% 29% 31% 16% 21% 25% 27% 31%
Lein-ster 843 108 214 76 10 94 85 256 735 609 126 19 83 486 35725% 28% 29% 33% 10% 21% 22% 25% 27% 26% 31% 13% 23% 27% 24%

April TeleBar 2012 Sunday Times/Behaviour & Attitudes Opinion Poll
J3719
Table 16 Fieldwork : 11th - 17th April 2012 Page 35
Analysis of Sample
Base : All Irish Voters Total Party Support Likelihood Treaty Understanding
FiannaFail
Fine Gael
Lab-our
Green Party
Sinn Fein
Indep/Others
Wouldnot/DK
Wouldvote
Woulddefinitely vote
Wouldprobably vote
Might/might
not
Wouldnot Vote
Don't Understand
Understand
Weighted 3,306 385 734 230 104 455 383 1,010 2,763 2,362 401 146 361 1,822 1,484
Unweighted 946 106 230 79 28 119 104 278 792 677 115 41 105 501 445Mun-ster 937 128 199 74 16 107 99 314 761 612 150 65 105 500 437
28% 33% 27% 32% 15% 24% 26% 31% 28% 26% 37% 45% 29% 27% 29%
Conn/Ulster 586 57 121 5 17 135 83 167 462 400 62 31 84 353 23318% 15% 16% 2% 17% 30% 22% 17% 17% 17% 15% 21% 23% 19% 16%
AreaUrban 2,018 220 435 170 79 276 205 629 1,684 1,459 225 75 231 1,132 886
61% 57% 59% 74% 76% 61% 54% 62% 61% 62% 56% 52% 64% 62% 60%
Rural 1,287 166 300 60 25 178 178 382 1,078 903 175 71 130 689 59839% 43% 41% 26% 24% 39% 46% 38% 39% 38% 44% 48% 36% 38% 40%
Party SupportFianna Fail 385 385 - - - - - - 346 308 39 22 17 215 171
12% 100% - - - - - - 13% 13% 10% 15% 5% 12% 12%
Fine Gael 734 - 734 - - - - - 689 632 57 13 32 280 45422% - 100% - - - - - 25% 27% 14% 9% 9% 15% 31%
Labour 230 - - 230 - - - - 202 187 15 14 13 114 1157% - - 100% - - - - 7% 8% 4% 10% 4% 6% 8%
Green Party 104 - - - 104 - - - 98 85 13 3 3 68 363% - - - 100% - - - 4% 4% 3% 2% 1% 4% 2%
Sinn Fein 455 - - - - 455 - - 351 295 56 45 48 264 19114% - - - - 100% - - 13% 13% 14% 31% 13% 15% 13%
Independent/Others 383 - - - - - 383 - 360 304 56 14 9 182 20112% - - - - - 100% - 13% 13% 14% 10% 2% 10% 14%
Would not/Don't Know 1,010 - - - - - - 1,010 711 545 166 36 238 697 31431% - - - - - - 100% 26% 23% 41% 24% 66% 38% 21%
Likelihood

April TeleBar 2012 Sunday Times/Behaviour & Attitudes Opinion Poll
J3719
Table 16 Fieldwork : 11th - 17th April 2012 Page 36
Analysis of Sample
Base : All Irish Voters Total Party Support Likelihood Treaty Understanding
FiannaFail
Fine Gael
Lab-our
Green Party
Sinn Fein
Indep/Others
Wouldnot/DK
Wouldvote
Woulddefinitely vote
Wouldprobably vote
Might/might
not
Wouldnot Vote
Don't Understand
Understand
Weighted 3,306 385 734 230 104 455 383 1,010 2,763 2,362 401 146 361 1,822 1,484
Unweighted 946 106 230 79 28 119 104 278 792 677 115 41 105 501 445Would vote 2,763 346 689 202 98 351 360 711 2,763 2,362 401 - - 1,405 1,357
84% 90% 94% 88% 94% 79% 94% 72% 100% 100% 100% - - 78% 92%
Might/might not 146 22 13 14 3 45 14 36 - - - 146 - 118 284% 6% 2% 6% 3% 10% 4% 4% - - - 100% - 7% 2%
Would not Vote 361 17 32 13 3 48 9 238 - - - - 361 275 8611% 5% 4% 6% 3% 11% 2% 24% - - - - 100% 15% 6%
Mean 4.40 4.64 4.75 4.60 4.71 4.33 4.70 3.89 4.85 5.00 4.00 3.00 1.52 4.17 4.69Marital StatusSingle 917 98 151 69 33 168 95 301 691 514 178 62 146 576 341
28% 25% 21% 30% 32% 37% 25% 30% 25% 22% 44% 42% 41% 32% 23%
Married 1,666 204 450 115 30 184 218 460 1,480 1,312 167 42 136 823 84250% 53% 61% 50% 29% 40% 57% 46% 54% 56% 42% 29% 38% 45% 57%
Co-habiting 299 41 55 19 12 57 23 92 238 204 34 18 36 168 1319% 11% 7% 8% 12% 13% 6% 9% 9% 9% 8% 12% 10% 9% 9%
Widowed 231 40 57 14 7 9 11 93 211 198 14 1 18 118 1137% 10% 8% 6% 6% 2% 3% 9% 8% 8% 3% 1% 5% 7% 8%
Divorced/seperated 193 3 21 11 22 37 36 64 143 135 8 24 24 136 576% 1% 3% 5% 21% 8% 9% 6% 5% 6% 2% 16% 7% 7% 4%
Refused - - - - - - - - - - - - - - -- - - - - - - - - - - - - - -

April TeleBar 2012 Sunday Times/Behaviour & Attitudes Opinion Poll
J3719
Table 17 Fieldwork : 11th - 17th April 2012 Page 37
Analysis of Sample
Base : All Irish Adults 18+ Total Gender Age Class Region Area
Male Female 18-34 35-54 55+ ABC1 C2DE F Dublin Lein-ster
Mun-ster
Conn/Ulster
Urban Rural
Weighted 3,421 1,678 1,743 1,166 1,264 991 1,373 1,794 254 981 864 957 618 2,092 1,329
Unweighted 979 477 502 307 378 294 401 514 64 265 237 272 204 666 313GenderMale 1,678 1,678 - 595 626 456 688 820 169 537 391 457 292 1,065 612
49% 100% - 51% 50% 46% 50% 46% 67% 55% 45% 48% 47% 51% 46%
Female 1,743 - 1,743 571 638 535 685 974 85 444 473 500 326 1,027 71751% - 100% 49% 50% 54% 50% 54% 33% 45% 55% 52% 53% 49% 54%
Age18-34 1,166 595 571 1,166 - - 561 543 62 397 298 276 195 814 352
34% 35% 33% 100% - - 41% 30% 24% 40% 35% 29% 32% 39% 27%
35-54 1,264 626 638 - 1,264 - 529 651 85 309 321 393 241 711 55437% 37% 37% - 100% - 39% 36% 33% 31% 37% 41% 39% 34% 42%
55+ 991 456 535 - - 991 282 601 107 275 244 289 182 568 42329% 27% 31% - - 100% 21% 34% 42% 28% 28% 30% 30% 27% 32%
ClassABC1 1,373 688 685 561 529 282 1,373 - - 510 349 322 193 947 426
40% 41% 39% 48% 42% 29% 100% - - 52% 40% 34% 31% 45% 32%
C2DE 1,794 820 974 543 651 601 - 1,794 - 469 447 526 353 1,127 66752% 49% 56% 47% 51% 61% - 100% - 48% 52% 55% 57% 54% 50%
F 254 169 85 62 85 107 - - 254 3 69 109 73 18 2357% 10% 5% 5% 7% 11% - - 100% 0% 8% 11% 12% 1% 18%
RegionDublin 981 537 444 397 309 275 510 469 3 981 - - - 981 -
29% 32% 25% 34% 24% 28% 37% 26% 1% 100% - - - 47% -
Lein-ster 864 391 473 298 321 244 349 447 69 - 864 - - 451 41325% 23% 27% 26% 25% 25% 25% 25% 27% - 100% - - 22% 31%
April TeleBar 2012 Sunday Times/Behaviour & Attitudes Opinion Poll
J3719
Table 17 Fieldwork : 11th - 17th April 2012 Page 38
Analysis of Sample
Base : All Irish Adults 18+ Total Gender Age Class Region Area
Male Female 18-34 35-54 55+ ABC1 C2DE F Dublin Lein-ster
Mun-ster
Conn/Ulster
Urban Rural
Weighted 3,421 1,678 1,743 1,166 1,264 991 1,373 1,794 254 981 864 957 618 2,092 1,329
Unweighted 979 477 502 307 378 294 401 514 64 265 237 272 204 666 313Mun-ster 957 457 500 276 393 289 322 526 109 - - 957 - 435 522
28% 27% 29% 24% 31% 29% 23% 29% 43% - - 100% - 21% 39%
Conn/Ulster 618 292 326 195 241 182 193 353 73 - - - 618 225 39418% 17% 19% 17% 19% 18% 14% 20% 29% - - - 100% 11% 30%
AreaUrban 2,092 1,065 1,027 814 711 568 947 1,127 18 981 451 435 225 2,092 -
61% 64% 59% 70% 56% 57% 69% 63% 7% 100% 52% 45% 36% 100% -
Rural 1,329 612 717 352 554 423 426 667 235 - 413 522 394 - 1,32939% 36% 41% 30% 44% 43% 31% 37% 93% - 48% 55% 64% - 100%
Party SupportFianna Fail 391 206 185 96 118 177 169 187 35 94 108 132 57 221 170
11% 12% 11% 8% 9% 18% 12% 10% 14% 10% 12% 14% 9% 11% 13%
Fine Gael 752 418 334 164 293 295 313 345 93 207 215 199 130 443 30922% 25% 19% 14% 23% 30% 23% 19% 37% 21% 25% 21% 21% 21% 23%
Labour 230 94 136 90 77 62 109 115 6 74 76 74 5 170 607% 6% 8% 8% 6% 6% 8% 6% 3% 8% 9% 8% 1% 8% 4%
Green Party 104 37 67 53 37 14 35 68 1 61 10 16 17 79 253% 2% 4% 5% 3% 1% 3% 4% 0% 6% 1% 2% 3% 4% 2%
Sinn Fein 463 263 200 214 172 77 149 307 6 120 94 109 140 281 18214% 16% 11% 18% 14% 8% 11% 17% 2% 12% 11% 11% 23% 13% 14%
Independent/Others 385 226 159 125 154 106 164 178 43 116 85 99 85 205 18011% 13% 9% 11% 12% 11% 12% 10% 17% 12% 10% 10% 14% 10% 14%
Would not/Don't Know 1,092 433 659 423 414 255 434 590 68 305 275 328 184 688 40432% 26% 38% 36% 33% 26% 32% 33% 27% 31% 32% 34% 30% 33% 30%
Likelihood

April TeleBar 2012 Sunday Times/Behaviour & Attitudes Opinion Poll
J3719
Table 17 Fieldwork : 11th - 17th April 2012 Page 39
Analysis of Sample
Base : All Irish Adults 18+ Total Gender Age Class Region Area
Male Female 18-34 35-54 55+ ABC1 C2DE F Dublin Lein-ster
Mun-ster
Conn/Ulster
Urban Rural
Weighted 3,421 1,678 1,743 1,166 1,264 991 1,373 1,794 254 981 864 957 618 2,092 1,329
Unweighted 979 477 502 307 378 294 401 514 64 265 237 272 204 666 313Would vote 2,809 1,375 1,433 828 1,071 909 1,149 1,442 218 816 752 765 475 1,707 1,101
83% 83% 83% 72% 86% 92% 85% 81% 86% 85% 88% 80% 78% 83% 84%
Might/might not 148 76 72 85 59 4 62 74 12 31 19 65 32 77 714% 5% 4% 7% 5% 0% 5% 4% 5% 3% 2% 7% 5% 4% 5%
Would not Vote 418 200 218 231 115 73 137 258 24 112 83 121 102 274 14412% 12% 13% 20% 9% 7% 10% 15% 9% 12% 10% 13% 17% 13% 11%
Mean 4.35 4.40 4.31 3.95 4.49 4.65 4.45 4.27 4.39 4.45 4.48 4.24 4.20 4.34 4.37Marital StatusSingle 953 468 485 620 257 76 427 467 59 348 205 218 182 651 302
28% 28% 28% 53% 20% 8% 31% 26% 23% 35% 24% 23% 29% 31% 23%
Married 1,713 894 819 276 828 609 643 912 158 384 455 550 325 945 76850% 53% 47% 24% 65% 61% 47% 51% 62% 39% 53% 57% 53% 45% 58%
Co-habiting 318 174 143 216 78 25 186 119 13 95 77 85 60 214 1049% 10% 8% 18% 6% 2% 14% 7% 5% 10% 9% 9% 10% 10% 8%
Widowed 233 68 165 - 7 226 52 163 18 71 74 56 33 146 877% 4% 9% - 1% 23% 4% 9% 7% 7% 9% 6% 5% 7% 7%
Divorced/seperated 204 74 131 54 95 56 65 133 6 84 52 49 19 136 686% 4% 8% 5% 7% 6% 5% 7% 2% 9% 6% 5% 3% 7% 5%
Refused - - - - - - - - - - - - - - -- - - - - - - - - - - - - - -

April TeleBar 2012 Sunday Times/Behaviour & Attitudes Opinion Poll
J3719
Table 17 Fieldwork : 11th - 17th April 2012 Page 40
Analysis of Sample
Base : All Irish Adults 18+ Total Party Support Likelihood Treaty Understanding
FiannaFail
Fine Gael
Lab-our
Green Party
Sinn Fein
Indep/Others
Wouldnot/DK
Wouldvote
Woulddefinitely vote
Wouldprobably vote
Might/might
not
Wouldnot Vote
Don't Understand
Understand
Weighted 3,421 391 752 230 104 463 385 1,092 2,809 2,384 425 148 418 1,890 1,531
Unweighted 979 108 235 79 28 123 105 299 804 682 122 42 122 522 457GenderMale 1,678 206 418 94 37 263 226 433 1,375 1,227 149 76 200 774 903
49% 53% 56% 41% 36% 57% 59% 40% 49% 51% 35% 51% 48% 41% 59%
Female 1,743 185 334 136 67 200 159 659 1,433 1,157 276 72 218 1,116 62751% 47% 44% 59% 64% 43% 41% 60% 51% 49% 65% 49% 52% 59% 41%
Age18-34 1,166 96 164 90 53 214 125 423 828 605 224 85 231 807 359
34% 25% 22% 39% 51% 46% 33% 39% 29% 25% 53% 57% 55% 43% 23%
35-54 1,264 118 293 77 37 172 154 414 1,071 949 123 59 115 613 65137% 30% 39% 34% 35% 37% 40% 38% 38% 40% 29% 40% 27% 32% 43%
55+ 991 177 295 62 14 77 106 255 909 830 78 4 73 470 52029% 45% 39% 27% 14% 17% 28% 23% 32% 35% 18% 2% 17% 25% 34%
ClassABC1 1,373 169 313 109 35 149 164 434 1,149 998 151 62 137 673 700
40% 43% 42% 47% 34% 32% 42% 40% 41% 42% 35% 42% 33% 36% 46%
C2DE 1,794 187 345 115 68 307 178 590 1,442 1,215 227 74 258 1,067 72852% 48% 46% 50% 66% 66% 46% 54% 51% 51% 53% 50% 62% 56% 48%
F 254 35 93 6 1 6 43 68 218 170 48 12 24 150 1037% 9% 12% 3% 1% 1% 11% 6% 8% 7% 11% 8% 6% 8% 7%
RegionDublin 981 94 207 74 61 120 116 305 816 749 67 31 112 517 465
29% 24% 28% 32% 59% 26% 30% 28% 29% 31% 16% 21% 27% 27% 30%
Lein-ster 864 108 215 76 10 94 85 275 752 616 136 19 83 492 37225% 28% 29% 33% 10% 20% 22% 25% 27% 26% 32% 13% 20% 26% 24%

April TeleBar 2012 Sunday Times/Behaviour & Attitudes Opinion Poll
J3719
Table 17 Fieldwork : 11th - 17th April 2012 Page 41
Analysis of Sample
Base : All Irish Adults 18+ Total Party Support Likelihood Treaty Understanding
FiannaFail
Fine Gael
Lab-our
Green Party
Sinn Fein
Indep/Others
Wouldnot/DK
Wouldvote
Woulddefinitely vote
Wouldprobably vote
Might/might
not
Wouldnot Vote
Don't Understand
Understand
Weighted 3,421 391 752 230 104 463 385 1,092 2,809 2,384 425 148 418 1,890 1,531
Unweighted 979 108 235 79 28 123 105 299 804 682 122 42 122 522 457Mun-ster 957 132 199 74 16 109 99 328 765 616 150 65 121 509 448
28% 34% 26% 32% 15% 24% 26% 30% 27% 26% 35% 44% 29% 27% 29%
Conn/Ulster 618 57 130 5 17 140 85 184 475 403 72 32 102 372 24618% 15% 17% 2% 17% 30% 22% 17% 17% 17% 17% 22% 24% 20% 16%
AreaUrban 2,092 221 443 170 79 281 205 688 1,707 1,467 241 77 274 1,184 908
61% 57% 59% 74% 76% 61% 53% 63% 61% 62% 57% 52% 66% 63% 59%
Rural 1,329 170 309 60 25 182 180 404 1,101 917 184 71 144 706 62239% 43% 41% 26% 24% 39% 47% 37% 39% 38% 43% 48% 34% 37% 41%
Party SupportFianna Fail 391 391 - - - - - - 351 312 39 22 19 220 171
11% 100% - - - - - - 13% 13% 9% 15% 5% 12% 11%
Fine Gael 752 - 752 - - - - - 701 636 65 13 37 294 45822% - 100% - - - - - 25% 27% 15% 9% 9% 16% 30%
Labour 230 - - 230 - - - - 202 187 15 14 13 114 1157% - - 100% - - - - 7% 8% 4% 10% 3% 6% 8%
Green Party 104 - - - 104 - - - 98 85 13 3 3 68 363% - - - 100% - - - 3% 4% 3% 2% 1% 4% 2%
Sinn Fein 463 - - - - 463 - - 351 295 56 45 56 272 19114% - - - - 100% - - 13% 12% 13% 30% 13% 14% 12%
Independent/Others 385 - - - - - 385 - 360 304 56 14 11 182 20311% - - - - - 100% - 13% 13% 13% 10% 3% 10% 13%
Would not/Don't Know 1,092 - - - - - - 1,092 741 559 182 37 279 737 35532% - - - - - - 100% 26% 23% 43% 25% 67% 39% 23%
Likelihood

April TeleBar 2012 Sunday Times/Behaviour & Attitudes Opinion Poll
J3719
Table 17 Fieldwork : 11th - 17th April 2012 Page 42
Analysis of Sample
Base : All Irish Adults 18+ Total Party Support Likelihood Treaty Understanding
FiannaFail
Fine Gael
Lab-our
Green Party
Sinn Fein
Indep/Others
Wouldnot/DK
Wouldvote
Woulddefinitely vote
Wouldprobably vote
Might/might
not
Wouldnot Vote
Don't Understand
Understand
Weighted 3,421 391 752 230 104 463 385 1,092 2,809 2,384 425 148 418 1,890 1,531
Unweighted 979 108 235 79 28 123 105 299 804 682 122 42 122 522 457Would vote 2,809 351 701 202 98 351 360 741 2,809 2,384 425 - - 1,436 1,373
83% 90% 93% 88% 94% 78% 93% 70% 100% 100% 100% - - 77% 91%
Might/might not 148 22 13 14 3 45 14 37 - - - 148 - 120 284% 6% 2% 6% 3% 10% 4% 4% - - - 100% - 6% 2%
Would not Vote 418 19 37 13 3 56 11 279 - - - - 418 308 11112% 5% 5% 6% 3% 12% 3% 26% - - - - 100% 17% 7%
Mean 4.35 4.63 4.72 4.60 4.71 4.28 4.68 3.80 4.85 5.00 4.00 3.00 1.50 4.13 4.62Marital StatusSingle 953 98 159 69 33 176 95 320 708 521 186 63 164 608 344
28% 25% 21% 30% 32% 38% 25% 29% 25% 22% 44% 43% 39% 32% 22%
Married 1,713 208 459 115 30 184 220 493 1,502 1,326 176 42 159 845 86950% 53% 61% 50% 29% 40% 57% 45% 53% 56% 41% 28% 38% 45% 57%
Co-habiting 318 42 55 19 12 57 23 109 243 204 40 18 41 180 1389% 11% 7% 8% 12% 12% 6% 10% 9% 9% 9% 12% 10% 9% 9%
Widowed 233 40 57 14 7 9 11 95 211 198 14 1 20 120 1137% 10% 8% 6% 6% 2% 3% 9% 8% 8% 3% 1% 5% 6% 7%
Divorced/seperated 204 3 21 11 22 37 36 76 144 135 9 24 34 137 676% 1% 3% 5% 21% 8% 9% 7% 5% 6% 2% 16% 8% 7% 4%
Refused - - - - - - - - - - - - - - -- - - - - - - - - - - - - - -

Questionnaire

BEHAVIOUR & ATTITUDES POLL QUESTIONNAIRE – APRIL 2012
Good Morning/afternoon/evening my name is ………………… (Name) and I am calling from Behaviour and Attitudes, the independent market research company based in Dublin.
We are currently conducting a study on a number of issues. The study will take less than 10 minutes to complete.
The interview will be conducted in accordance with Market Research Society guidelines - all results will be shown in aggregate form and for quality control purposes this call may be monitored by a supervisor.
Q.1 Would you say you are satisfied or dissatisfied with the manner in which the Government is running the country?
ASK ALL ADULTS 18YRS+
Satisfied 1
Dissatisfied 2
No opinion 3
Q.2 Would you say you are satisfied or dissatisfied with the way Mr. Kenny is doing his job as Taoiseach?
Satisfied 1
Dissatisfied 2
No opinion 3
Q.3 Would you say you are satisfied or dissatisfied with the way Mr. Gilmore is doing his job as Tanaiste?
Satisfied 1
Dissatisfied 2
No opinion 3
Q.4 Would you say you are satisfied or dissatisfied with the way Mr. Martin is doing his job as leader of Fianna Fail?
Satisfied 1
Dissatisfied 2
No opinion 3
J.3760

Q.5 Would you say you are satisfied or dissatisfied with the way Mr. Adams is doing his job as leader of Sinn Fein?
Satisfied 1
Dissatisfied 2
No opinion 3
Q.6 Would you say you are satisfied or dissatisfied with the way Mr. Ryan is doing his job as leader of The Green Party?
Satisfied 1
Dissatisfied 2
No opinion 3
Q.7 If there was a General Election tomorrow, to which party or independent candidate would you give your first preference vote? DO NOT READ OUT
Fianna Fail 1
Fine Gael 2
Labour Party 3
Green Party 4
Workers Party 5
Sinn Fein 6
Independent 7
Other specify _________________ 8
Don’t know 9
Would not vote 10
Q.8 As you are probably aware, on May 31st
next a referendum will be held in relation to the European Union Fiscal Treaty – otherwise known as the Fiscal Compact Treaty. In the referendum, people will be asked to vote either in favour of or against the Treaty. Are you yourself likely to vote yes in favour of the European Union Fiscal Treaty, or no against the European Union Fiscal Treaty?
Will vote yes in favour of the treaty 1
Will vote no against the treaty 2
Don’t know 3
Will not vote 4

Q.9 And thinking of the forthcoming European Union Fiscal Treaty Referendum. On a scale of 1 to 5 where 5 is you understand it very well and 1 is you do not understand it at all, how well do you feel you understand what the European Union Fiscal Treaty referendum is about? PROBE TO APPROPRIATE CODE
Understand it very well
Understand it quite well
Understand it to some extent
Do not understand it
particularly well
Do not understand it at
all
5 4 3 2 1
Q.10 How likely would you be to vote if there was a General Election tomorrow? PROBE TO APPROPRIATE CODE
Would definitely vote 1 Would probably vote 2 Might/might not vote 3 Would probably not vote 4 Would definitely not vote 5 Don’t know 6
Q.11 And to which party or independent candidate did you give your first preference vote in last year’s General Electio
n? DO NOT READ OUT
Q.12 Are you eligible to vote in Irish General Elections, or not?
Yes, eligible 1
No – not eligible 2
Don’t know 3
Fianna Fail 1
Fine Gael 2
Labour 3
Green Party 4
Workers Party 5
Sinn Fein 6
Independent 7
Other specify _________________ 8
Don’t know 9
Did not vote 10

Q.13 And are you an Irish citizen, or not?
Yes 1
No 2
Don’t know 3

Thank You