sunday editions. electronic media may release after 5:00...
TRANSCRIPT
(FILe taC-ICbgtr/EAGLETON POLL
FOR Rflfl3E SUNDAY, AUGUST 12 1990 CONTACT: JANICE BALI-CURSIRSE SL/EP 29-5 (EP 79-5) ‘ OR BOB CARTER
RELEASE INFORMATION
A story based on the survey findings presented in this release and background memo willappear in Sunday’s Star-Ledger. Other newspapers may also use this information in theirSunday editions. Electronic media may release after 5:00 p.m. Saturday, August 11, 1990.We ask users to properly attribute this copyrighted information to the “Star-Ledger/EagletonPoll.”
THE PHYSICAL HEALTH OF NEW JERSEYANS
SMOKING IS DOWN; STRESS IS UP
Overall, New Jerseyans are feeling good about their own health. In a self-
assessment, about 3-in-4 state residents say that they are in excellent or good health. In
addition, less than half of the state’s residents say they have ever smoked cigarettes--a 13
point decline from five years ago, and less than 3-in-lO now smoke. Also on the plus
(7 side, more than 8-in-b say they exercise regularly and eat well-balanced meals.
However, in the latest Star-Ledger/Eagleton Poll state residents have also
identified some health problems. Fifty-six percent have recently been under a lot of
stress and 1-in-3 say they are overweight. Based on their drinking habits, 30 percent of
New Jerseyans are at moderate or high risk of having an alcohol problem.
The survey, conducted by telephone between July 2 and 10 with 800 New Jersey
adults, also found that while about 9-in-b have some type of medical insurance or
health plan, 10 percent do not have health care coverage.
While 77 percent of the state’s residents describe their physical health as
excellent (36%) or good (41%), this is a 6 point decline from five years ago when
-more
ATIThTION RADIO STATItAsbaI eilN. aft 5S pa aS rday,J-”” U, 19W frc. -:V
(201) 932-3605 (Rutgers Feature Phone).
HE STATE UNt!PSN cc NPW JB&V
RUT(3ERS Eagleton - Institute Ca Politics • New- irtnwitk-. New JersevO8W • 2017628,22?U ‘. H
EP79-5 (SL/EP29-5) Page 2
C83 percent rated their health positively. As would be expected, New Jerseyans who are
50 years old or older are less likely to say they are in excellent or good health (64%)
than those who are 30 to 49 years old (86%) or 18-29 years old (84%).
There are other signs of good health in New Jersey. Eighty-five percent feel they
eat regular and well balanced meals and 84 percent get some kind of exercise on a
regular basis. These percentages are almost the same as was reported five years ago.
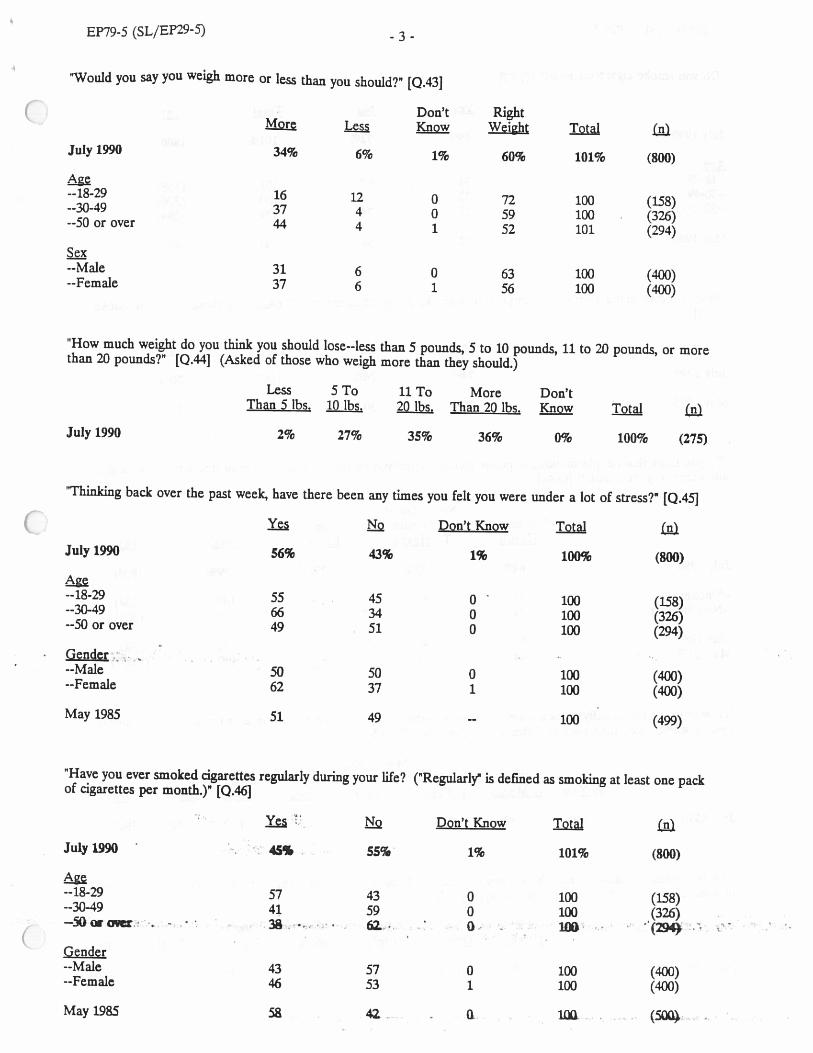
Compared to five years ago, fewer people in the Garden State have tried
smoking. Forty-five percent of the state’s residents report that they have ever smoked
cigarettes regularly compared to 55 percent who have not. In 1985, 58 percent said they
had smoked regularly at some time. Younger state residents (57%) are more likely to
say they had smoked than those who are 30-49 years old (41%) or 50 years or older
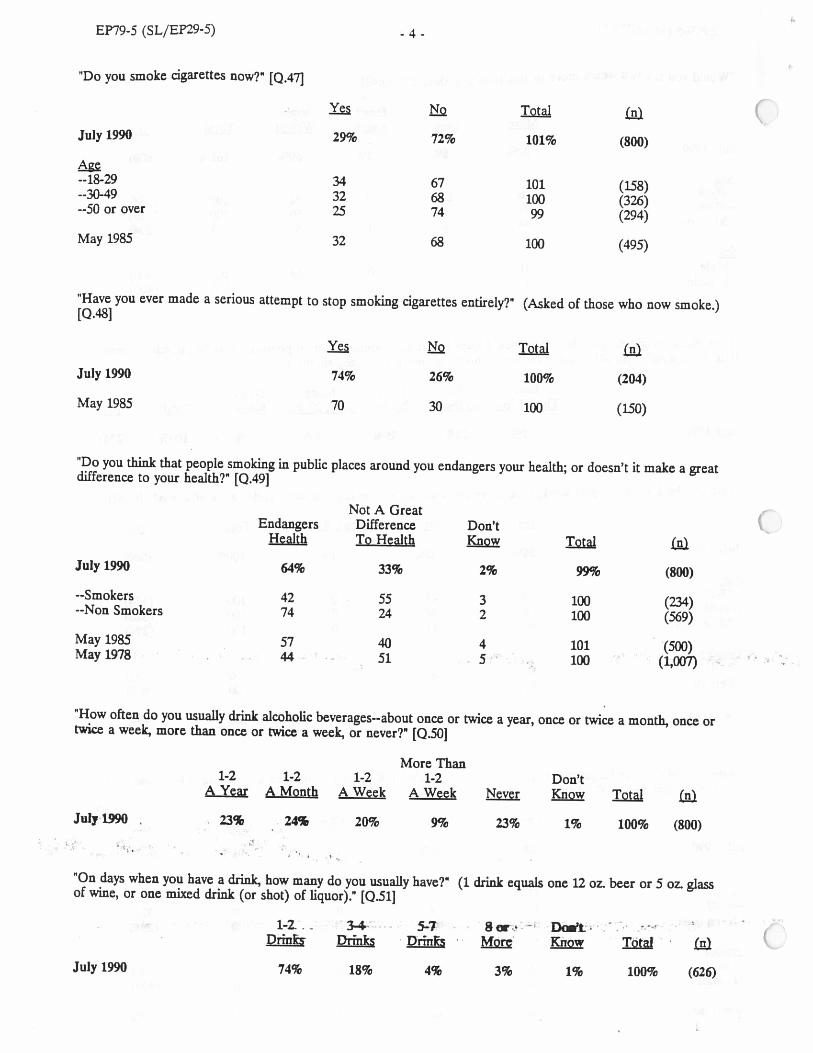
(38%). In addition, just 29 percent report they are still smoking. This is just slightly
less than the 32 percent who said they were still smoking in 1985. Among those who
still smoke, 74 percent have seriously tried to stop. In comparison, five years ago 70
percent said that they had tried to stop smoking.
About 2-in-3 state residents (64%) feel that people smoking in public places
endangers their own health. This is a 7 point increase from 57 percent who felt this way
in 1985 and a 20 point change from 44 percent in 1978. By a margin of almost 2-to-i,
more non- smokers (74%) than smokers (42%) view public smoking as a health hazard.• “Clearly, people in New Jersey have changed their opinions about smoking,”
commented Janice Bailou, Director of the Poll. ‘There is major shift in their concern
about smoking in public places and fewer people are experimenting with cigarette
srnnkinp’ ..
-more-
EP79-5 (SL/EP25) Page 3
Stress, being overweight, and alcohol use are three other unhealthy conditions
that effect state residents. A majority of New Jerseyans experience stress. And, since
1985 there has been a 5 point increase in the number reporting a lot of stress in the
previous week--56 percent compared to 51 percent. Those most likely to report stress
are people 30-49 years old (66%), while those 18-29 years old (55%) and 50 years old or
older (49%) are less likely to experience stress. More women (62%) than men (50%)
say they suffer from stress.
Being overweight is a concern for 34 percent of New Jerseyans. Women (37%)
are more likely than men (31%) to say they weigh more than they should. Seven-in-ten
of those who feel they are overweight would like to lose more than ten pounds—36
percent feel they should lose more than 20 pounds and 35 percent would like to drop 11
to 20 pounds.
Alcohol abuse is a potential health problem for 3-in-10 state residents. Based on
the frequency and amount New Jerseyans say they drink, 5 percent can be classified as
having a high risk of an alcohol problem, 25 percent a moderate risk, and 44 percent a
low risk. Twenty-fIve percent say they do not usually drink. Younger state residents are
twice as likely to be in the high risk category. Eleven percent of those who are 18-29
compared to 5 percent who are 30-49 and 2 percent of those over fifty years old have a
high risk of having an alcohol problem. In addition, men (38%) are more likely than
women (24%) to be considered a high or moderate risk drinker.
Eighty-nine percent of the state’s residents have some type of health care
coverage. However, those:.wha are 18-29 years old (79%) are less likely to have any
type of medical plan than those who are 30-49 years old (94%) or 50 years old or older
(93%). While.alrnnct all--99 percent-,eJ thnsahaving family izwnniec.af.mare than.
-more-

EP79-6 (SL/EP29-5) Page 4
$50,000 have health care coverage, 92 percent of those with incomes of $30,001-$50,000 çand 91 percent of those in the $20,001$30,000 range have medical insurance. A much
lower 83 percent of people with family incomes less than $20,000 have health coverage.
A medical check-up is an annual event for 66 percent of those who live in the
Garden State. This is a 4 point increase from the 62 percent who reported annual
medical exams in 1985. This recent survey also shows that 10 percent have a medical
exam once every two years, 12 percent every two to five years, and 10 percent less than
once every 5 years. Seventy-three percent of residents who are 50 years old or older say
they have an annual exam compared to 67 percent of those 18-29 years old and 59
percent of New Jerseyans who are 30-49 years old. Women (74%) are more likely than
men (58%) to have an annual medical exam.
-30-
Copyright, August 12, 1990, The Eagleton Institute and Newark Star-Ledger.
C.

(Flit %tar-ICbgCr/EAGLETON POLL
BACKGROUND MEMO-RETE4SE SLfEPI9-5 (EP79-5h SUNDAY, AUGUST 12. 1990
The latest L r/Eagleton Poll was conducted between July 2 and 10, 1990, when a random sample of 800New Jerseyans, 18 years and older, was interviewed by telephone. The sampling error associated with this sizesample is .±.3.S percent at a 95 percent confidence interval. Sampling error does not take into account the otherpossible sources of error inherent in any public opinion study. The questions and figures referred to in this releaseare presented below. The Location of each question on the actual questionnaire is indicated in brackets.
“Now on another topic, how would you describe your own state of physical health these days--excellent, good, onlyfair or poor?” [0.39]
Only Don’tExcellent Good Eir Know
July 1990 36% 41% 17% 7% 0% 101% (800)
--18-29 49 35 10 7 0 101 (158)--30-49 41 45 11 2 0 99 (326)--SOorover 23 41 26 11 0 101 (294)
May1985 34 49 15 3 101 (500)June 1981 32 51 13 4 100 (1,000)
9n 1981 the question asked, “Would you say your health, in general, is excellent, good, only fair or poor?”
“About how often do you see a doctor for a medical check-un or physical exam, once a year, once every two years,two to five years, or less than once every five years?” [0.40]
LessThanOnce Once Every Every Once Every .Don’t
A Year 2 Years 2-5 Years 5 Years Know IctlJuly 1990 66% 10% 12% 10% 1% 99% (800)
--18-29 67 13 11 8 1 100 (158)--30-49 59 13 16 12 0 100 (325)--Soorover 73 5 10 11 1 100 (294)
Gender--Male 58 11 17 14 0 100 (400)--Female 74 9 7 7 2 99 (400)
May 1985 62 14 10 13 1 100 (498)
fliE STATE UNSSW Cf NEW £V
RUTC3ER.S Eagletan institute - Politics • New; Brunick • New deney 0&901 • 201/828-221O.
EPc’9-5 (SL/EP295)- 2-
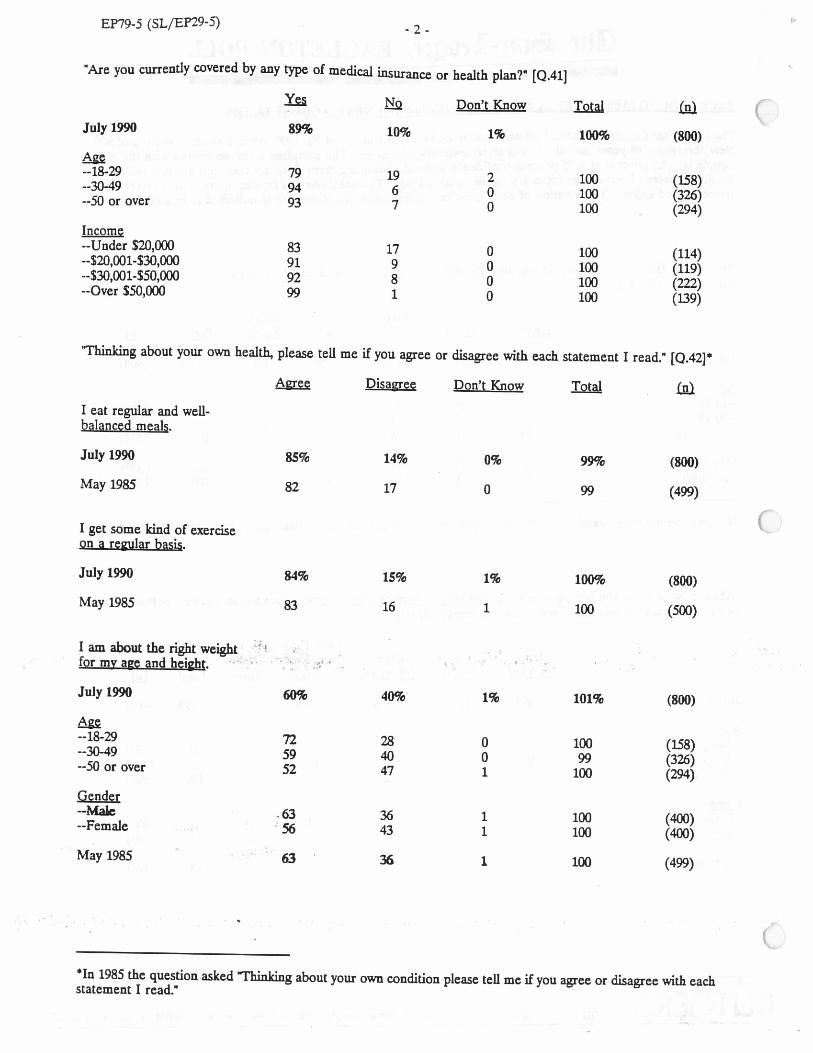
“Are you currently covered by any type of medical insurance or health plan?” [0.41]
Don’t Know çJuly 1990 89% 10% 1% 100% (804))
--18-29 79 19 2 100 (158)--30-49 94 6 0 100 (326)--S0orover 93 7 0 100 (294)1ncom--Under $20,000 83 17 0 100 (114)--$20,001-$30,000 91 9 0 100 (119)--$30,001-$50,000 92 8 0 100 (222)--Over$50,000 99 1 0 100 (139)
‘Thinking about your own health, please tell me if you agree or disagree with each statement I read.” [0.42]
Agree Disaaree Don’t Know £111I eat regular and weUbalanced meals.
July 1990 85% 14% 0% 99% (800)
May 1985 82 17 0 99 (499)
I get some kind of exerciseon a reu1ar basis.
July 1990 84% 15% 1% 100% (800)
May 1985 83 16 1 100 (500)
I am aba the right weightfor my ae and heiht.
July 1990 60% 40% 1% 101% (800)
--18-29 72 28 0 100 (158)--30-49 59 40 0 99 (326)--Soorover 52 47 1 100 (294)
Gender-Male .63 36 1 100 (400)--Female :56 43 1 100 (400)
May1985 63 36 1 100 (499)
1n 1985 the question asked “Thinking about your own condition please tell me if you agree or disagree with eachstatement I read.”
EP79-5 (SL/Efl95)- 3 -
‘Would , you weigh more or less than you should?” [0.431
Don’t RightKnow Weight I1
July 1990 34% 6% 1% 60% 101% (800)
--18-29 16 12 0 72 100 (158)--30-49 37 4 0 59 100 (326)--5oorover 44 4 1 52 10]. (294)
--Male 31 6 0 63 100 (400)--Female 37 6 1 56 100 (400)
How much weight do you think you should lose--less than 5 pounds, 5 to 10 pounds, 11 to 21) pounds, or morethan 20 pounds?” [Q.44] (Asked of those who weigh more than they should.)
Less 5 To 11 To More Don’tThan 5 lbs. 10 1b5, 20 lbs. Than 20 lbs. Know Ic1Lal
July 1990 2% 27% 35% 36% 0% 100% (275)
“Thinking back over the past week, have there been any times you felt you were under a lot of stress?” [Q-1
C Don’t Know I1July 1990 56% 43% 1% 100% (800)
--18-29 55 45 0 100 (158)--30-49 66 34 0 100 (326)--Soorover 49 51 0 100 (294)
Gender - -
--Male 50 50 0 100 (400)--Female 62 37 1 100 (400)
May1985 51 49 -- 100 (499)
“Have you ever smoked cigarettes regularly during your life? (“Regularly is defined as smoking at least one packof cigarettes per month.)’ [Q.46]
Don’t Know
July 1990 45% 55% 101% (800)
--18-29 57 43 0 100 (158)--30-49 41 59 0 100 (326)
38 - 6Z H 0. 100
Gender--Male 43 57 0 100 (400)--Female 46 53 1 100 (400)
May1985 58 . 42 . (5O0
Erg-s (SL/EP29-5)- 4.
“Do you smoke cigarettes flow?” [Q.47]
IQti (July 1990 29% 72% 101% (800)
--18-29 34 67 101 (158)..3(J-49 32 68 100 (326)—50 or over 25 74 99 (294)
May 1985 32 68 100 (495)
‘Have you ever made a serious attempt to stop smoking cigarettes entirely?” (Asked of those who flow smoke.)[Q.48J
12th £111July 1990 74% 26% 100% (204)
May 1985 70 30 100 (150)
‘Do you think that people smoking in public places around you endangers your health; or doesn’t it make a greatdifference to your health?” [Q.49J
Not A GreatEndangers Difference Don’t
Health To Health Know 12thJuly 1990 64% 33% 2% 99% (800)
--Smokers 42 55 3 100 (234)--Non Smokers 74 24 2 100 (569)
May1985 57 40 4 101 (500)May1978 44 51 5 100 (1,007)
“How often do you usually drink alcoholic beverages--about once or twice a year, once or twice a month, once ortwice a week, more than once or twice a week, or never?” 10.501
More Than1-2 1-2 1-2 1-2 Don’t
A Year A Month A Week A Week Never Know ]gjJJuly L990 23% 24% 20% 9% 23% 1% 100% (800)
“On days when you have a drink, how many do you usually have?” (1 drink equals one 12 oz. beer or 5 a. glassof wine, or one mixed drink (or shot) of liquor).” [Oil]
1-Z. 3-4 .J-.. 5-7 - Dai. :.• --•
Drinks Drinks Drinks More Know
July 1990 74% 18% 4% 3% 1% 100% (626)

EP79-5 (SL/EP29$)- -
ALCOHOL RISK CLASSIFICA-I’IONS*
Low Moderate HighAbstains RinkJuly 1990 25% 44% 25% 5% 99% (800)
--18-29 23 41 26 11 101 (158)3Q49 16 53 26 5 100 (326)--50orover 32 39 26 2 (294)Gender--Male 24 38 31 7 100 (400)--Female 26 51 20 4 101 (400)
Alcohol risk is estimated by combining information about usual frequency of drinking and quantity of drinksconsumed. Those who did not drink are classified as “abstainers”; those drinking between one and four drinks nomore than twice a month are “low risk”; ode ate risk’ includes those who have between one and four drinks onceor more per week; “high risk” are those who have five or more drinks per drinking occassion.
C
(
