summary of technical information - kathrein · pdf filesummary of technical information . ......
TRANSCRIPT

Summary of Technical Information

I. UMTS - the Future Mobile Communication System page 31. Network Planning page 32. WCDMA Technology and RET Benefits page 43. Conclusion page 6
II. Antenna Isolation with Site Sharing page 71. Factors Influencing the Isolation Value page 72. Save Distance between two Panel Antennas page 103. Optimised Minimum Distance between two Antennas page 10
III. Advanced Dipole Technology page 111. Introduction page 112. Kathrein´s dipole based Xpol-antenna design page 113. Typical measurements page 164. CPR against azimuth page 16
III. Indoor Environment page 191. Typical room page 192. Indoor antennas just convert the RF power page 193. Unobtrusive design page 194. Flexible signal distribution with Splitters and Tappers page 205. Advanced Indoor System Dual Band page 21
IV. Downtilting of antennas page 221. Downtilting the vertical pattern page 222. Optimum downtilt angles page 243. Consequences regarding the electrical parameters page 27
VI. Passive Intermodulation at Base Station Antennas page 281. Introduction page 282. What is Intermodulation? page 293. Where do intermodulation products come from? page 304. Why is intermodulation a problem? page 315. What solutions are there? page 33

3
The four letters UMTS, the abbreviation for
Universal Mobile Telecommunication System, are
already well known among the general public.
They stand for high data transmission rates and
multi media applications. The start of this new
system has been postponed many times due to
general delays in the technology as well as
scepticism in carrying out such huge investments.
But the thumbs are now up and many licensees
have to fulfil regulations regarding a minimum
coverage before the end of 2003.
While the end users do not care so much about
the used technology, UMTS means a big step
forward compared to GSM.
The main technology for implementing the
3. Generation of mobile systems will be WCDMA
(Wideband Code Division Multiple Access). The
applied frequency range is 1920–2170 MHz,
which contains two paired blocks of 60 MHz each.
UMTS – the Future Mobile Communication System
The technologies used with GSM and UMTS have
a big influence on network planning and the
required network optimisation due to some
essential differences.
In both cases, the vertical pattern downtilt plays a
major role concentrating the radiated power into
the cell to be covered and controlling the
interference from adjacent cells.
Network Planning
Traditionally with GSM, the downtilt angle has to
be altered only when the network structure
changes e.g. by adding new sites, which happens
may be once or twice a year. In this case it is
acceptable to send out installation teams to sites
to change the mechanical or electrical adjustable
downtilt angles of the antennas.
STMUMSGnosirapmoCAMDCWAMDTsseccA
(Time Division Multiple Access) (Wideband Code Division Multiple Access)separation of the subscribers separation of the subscribers
sedoc ybstols emit ybFrequency plan certain frequencies per cell the same full bandwidth in each cellHand over registration only in one cell registration in two or more cells
(hard hand over) (soft hand over)elbairavdexifezis lleC

4
With UMTS, there is a complex relationship
between capacity, coverage and interference. It is
expected that the electrical downtilt of the
antennas has to be modified several times a day!
It is clear that the previous technologies cannot
provide the fast and permanent access to vary the
downtilt angle of the antennas. This led to the
concept of a remote electrical downtilt (RET)
controlled from a central location within the
network e.g. the operational and maintenance
center (OMC).
In essence, CDMA uses the same frequency
band in each cell with the unpleasant
disadvantage for a specific subscriber that all the
other subscribers are ‘noise’ and cause
interference. Consequently, power levels in
CDMA networks are kept to a minimum in order to
reduce this interference. The power levels might
even be below the noise level, and a certain
subscriber can only be identified by using codes.
Power adjustment and cell breathing
To keep the noise low within a cell, the transmit
power of the downlink (base station) is also
altered. For each subscriber, the base station has
to provide exactly the right minimum power. This
requires an extensive and fast power adjustment.
If the load in the cell rises, either by an increased
number of subscribers, or by higher transfer data
rates, the power and with it the noise level will
grow and finally hinder communication. The base
station gets at its limit concerning power adjust-
ment and responses by turning down the power,
consequently reducing the coverage area and
with it the number of subscribers. This process
will continue until the power control is recovered.
The effect of a variable coverage area due to an
increased load and noise is called ‘cell breathing’.
The graph below describes the relationship
between number of users, noise increase and
cell range.
With RET it is possible to partly compensate
this effect and to optimise the power distribution in
critical areas.
WCDMA Technology and RET Benefits
Cell breathing and noise increase in UMTS voice
source: HU Berlin
number of users
nois
e in
crea
se
cell
rang
e [k
m]
1.61.41.2
10.80.60.40.2
0
20181614121086420
0 10 20 30 40 50

5
areas. For example, during rush hours the
network can concentrate on train stations or
airports. Furthermore, the network can be
adopted to meet the temporary requirements of
special events like music festivals, exhibitions or
major sporting events.
Network expansions
If a network grows due to an increased number of
subscribers, additional sites are generally added
in between the already existing ones. To avoid
interference between the sites, downtilt angles
have to be reset by installation teams who have to
visit each individual site.
With RET this adaptation could be carried out
centrally from the OMC without any work at the
site.
Soft hand over
To improve the low power uplink situation, sub-
scribers may be registered in more than one cell.
That means the weak signals are received in two
or three cells and added up by the system. It is
estimated that approximately 30 %– 40 % of the
subscribers will be in such a ‘soft-handover’
condition. This technology provides some benefits
regarding the uplink levels but on the other hand
it eats up capacity.
The amount of soft handover can be adjusted by
RET changing the overlapping areas in the
network.
High traffic area
Skilful planning, adding RET features to your
network, may increase capacity in high traffic
Antennacoverage
BTS
BTS
BTS
BTS
BTS
BTS
High traffic orsoft handover area
Decreasing the downtilt
Increasing the coverage

6
Conclusion
According to equipment suppliers and OEM’s,
remote electrical tilt will become a major feature of
UMTS networks.
For the operators, the decisive question with
respect to the implementation of RET systems is
the level of investment required. The correspond-
ing tenor forecast is that RET will be payed off
quite quickly:
– due to the achieved network optimisation, up to
20 % of WCDMA equipment can be saved
– the network will show lower bit failure rates and
a smaller amount of drop calls
The network operators, especially those in
Europe, have more experience with GSM than
with CDMA and now face the problem with
various new sites of how to decide in advance,
whether or not to use RET.
The Kathrein concept to upgrade the RET func-
tion with already installed antennas considers this
dilemma and allows the operators to postpone the
decision until tests have been performed.

7
Antenna Isolation with Site Sharing
Due to the environmental restrictions and growing
shortage of available sites, site-sharing has
become more and more regular. Apart from static
aspects, isolation between the antennas on the
same site is the biggest problem.
To get different systems with two separate
antennas working properly, an isolation of at
least 70–80 dB between both networks is
necessary. This isolation cannot be achieved
by the antennas alone. It must be generated
with the combination of filter isolation together
with the isolation of the antennas. The required
isolation offered, from the antennas should be
at least 30 dB.
Factors Influencing the Isolation Value
For the isolation values, different influencing
factors have to be considered:
Electrical specifications:With the same mechanical settings at a site,
variations of the electrical specifications impact
the isolation:
Frequency: Antennas are not filters! They also
receive frequencies out of the band they are
specified for. However, for these frequencies
they show worse VSWR values. The resulting
mismatch creates an attenuation called mismatch
loss, that increases the isolation between two
antennas.
Therefore, antennas operated in different
frequencies have higher isolation values than
antennas operated in the same frequency band.
Polarisation: The lowest isolation figures
apply, when two antennas have the same
polarisation. If the polarisation is different, the
isolation values increase. Taking one antenna
with vertical and one with slanted polarisation,
mainly the vertical component of the slanted
polarisation is responsible for the isolation. Due to
the fact that the amplitude of this vertical
component is 3 dB smaller compared to the
complete signal, the isolation is approx. 3 dB
higher.
Half-power beam width: With two antennas side
by side and facing into the same direction,
radiation against each other (orthogonal to the
main beam) finally determines the isolation.
The broader the half-power beam width, the hig-
her the radiation level at +/–90°. Consequently
the isolation decreases with a growing half-power
beam width of the two antennas. (see picture 1,
next page)
Electrical tilt: The electrical tilt is achieved by
feeding the dipoles with unequal phases of a
signal. The different phases lower the coupling
between two antennas, resulting in higher
isolation values for antennas equipped with fixed
or adjustable electrical tilt, rather than for anten-
nas without electrical tilt. (see picture 2, next
page)
Mechanical settings:Keeping the electrical specifications of two
antennas constant at a site, also variations of the
mechanical settings influence the isolation:

8
Vertical or horizontal separation: Antennas
have very dedicated radiation patterns with nulls
above and below the antennas main beam. This
results in a very small radiation level towards an
antenna that is directly above or below. Therefore,
two vertical separated antennas show higher
isolation values than two horizontally separated
antennas at the same distance. (see picture 3,
next page)
Angle: The signal level behind the antenna is
much smaller than the one in front or even at
+/–90°. If now two antennas do not point into the
same direction, but are separated through an
angle (e.g. 120°) between them, the mutual level
of radiation becomes less. For this reason, the
isolation grows with the azimuth angle between
the two antennas.
Pole-/Wall-Mounting: Despite the relatively
high front-to-back ratio of panel antennas,
the influence of a large plane (e.g. building
fascade) behind the antenna cannot be
completely neglected. The reflections from the
surface usually result in a slightly smaller
radiation pattern than normal, decreasing the
level of radiation towards the neighbouring
antenna.
Picture 1: Isolation values for different half-power beam width’s
0 0.25 0.5 0.75 1 1.25
55
50
45
40
35
30
Isol
atio
n dB
Distance a/m
65°
741 622: XPol A-Panel 824–960 65° 17dBi 9°T742 212: XPol F-Panel 1710–2170 65° 18dBi 0°–8°T
Picture 2: Isolation values for different downtilt angles
0
55
50
45
40
35
30
Isol
atio
n dB
Distance a/m
742 212: XPol F-Panel 1710–2170 65° 18dBi 0°–8°T742 212: XPol F-Panel 1710–2170 65° 18dBi 0°–8°T
0.5 1 1.5 2 2.5 3 3.5 4 4.5
0°T
2°T
4°T
6°T
8°T
0 0.25 0.5 0.75 1 1.25
50
48
46
44
42
40
38
36
34
32
30
Isol
atio
n dB
Distance a/m
90°
739 661: XPol A-Panel 806–960 90° 15dBi 8°T742 212: XPol F-Panel 1710–2170 65° 18dBi 0°–8°T
a

9
0
50
45
40
35
30
Isol
atio
n dB
Distance a/m, Distance b/m
739 707: XPol F-Panel 1710–1880 90° 16.5dBi 2°T
0.5 1 1.5 2 2.5 3 3.5 4
Horizontal separation
Vertical separation
a
Horizontal separation Vertical separation
bPicture 3: Vertical / horizontal separation
0
50
45
40
35
30
Isol
atio
n dB
Distance a/m
739 707: XPol F-Panel 1710–1880 90° 16.5dBi 2°T
0.5 1 1.5 2 2.5 3 3.5 4
Antennas on pipe masts
Antennas close to reflective structure
a
Antennas on pipe masts Antennas close toreflective structure
a
Picture 4: Pole / wall mounting
Therefore, two same antennas mounted on a wall
show higher isolation values than if being
mounted on a pole. (see picture 4, below)
Design: One of the biggest influencing factors is
the design of the antennas, since the current at
the edges of the reflector significantly influences
the isolation between two antennas. These
currents depend on the construction and the
kind of the radiating elements used (e.g. dipole,
patch).
Therefore, isolation values of one manufacturer
may not be used for antennas from another.
Kathrein antennas, with their proven dipole
construction, are designed for high isolation
values.

10
However, the stated save distance (see above)
is only a save distance and not the optimised
minimal possible distance. This distance may only
be found with measurements.
Kathrein has done a number of isolation
measurements for typical site configurations, that
are available for our customers.
In these measurements we have measured
values up to 50 dB. Values of more than 50 dB
also depend on the special site due to reflections
from buildings or parts of the pole. Therefore,
these values can no longer be seen as typical.
Optimised Minimum Distance between two Antennas
Save Distance between two Panel Antennas
There is a standard question of network planners
about the required minimum save distance for two
panel antennas in order to achieve isolation
values of more than 30 dB.
Vertical separation: The isolation values for
vertical separation are always quite good, there-
fore typically only the minimum possible distance
is needed.
Horizontal separation: The minimum save
distance depends on the wavelength and on the
horizontal half-power beamwidth:
Save distance a for an isolation value of 30 dB:
Angle separation: Taking a 120° angle, 30 dB of
isolation are already reached with the minimum
mechanical distance.
2 λ 65°
2.5 λ 90°
3 λ 105°
4.5 λ 120°
a
Minimum distance a Horizontal half-power beam width
(λ = wavelength)

The dipole is the oldest and most approved radia-
ting element in the field of mobile communication.
It is the basis for nearly every professional anten-
na type such as the yagi antenna, the log. peri-
odic antenna, and particular the panel antenna.
The latest development of panel antennas leads
to the sophisticated technology of slanted dual
polarization (Xpol).
Is the dipole technology suitable to fulfil thegrowing and stringent requirements ? Can
these odd metal structures still compete withnewer solutions like the patch radiator on aprinted board ?
The answer is definitely yes ! This article will
show that the dipole technology more than other
concepts provide the flexibility to perfect certain
characteristics without the effect of destroying
others. This feature is specific important for the
design of dual band cross-polarized antennas.
2.1 General description
Electrical :
Xpol antennas consist of two independently wor-
king slanted dipole systems, one for
+45° polarization and the other for -45° polariza-
tion.
The dipoles are symmetrically positioned in front
of a reflector screen. Both the power distribution
and the impedance transformation are carried out
by a low loss cable harness. Additional elements
for beam-shaping and isolation perfect the
design.
Mechanical:
The radome consists of a completely closed self-
supporting fiber-glass profile, into which the metal
parts are inserted. There are no drill-holes at all in
the profile, which is closed by two end caps with
short sealing rings. This concept offers ideal
permanent protection against environmental
influences and increases the
mechanical stability.
The improved separation of the electrical and the
mechanical function facilitates the optimization of
particular performances.
Advanced Dipole Technology
Antennen . Electronic
2. Kathreins’s dipole based Xpol-antenna design
1. Introduction
11

Antennen . Electronic
2.2. Outstanding characteristics2.2.1 Symmetrical construction
Xpol antennas are available with horizontal half
power beam widths of 65° and 90°. Starting from
a standard vertical polarized antenna, the requi-
red dipole-pair for 65° and the single dipole for
90° are rotated by +45° and -45°, resulting in
orthogonal polarizations (see fig. 1).
While the dipoles of the 90° type form an „X“ on
which the expression Xpol antenna is based, the
basic 65° dipole system is a rhomb.
Both designs are fully symmetrical referred to
the center line of the reflector screen, which is
the basic condition for symmetrical horizontal
radiation patterns .
65° Half-power Beam Width 90° Half-power Beam Width
Fig. 1: General construction of Xpol-antennas
Reflector
Dipolesystem
Feedingharness
-45 +45˚-45˚ +45˚
12

2.2.2 Beam-shaping
The dipole technology offers a high flexibility in
modeling the radiation patterns.
Beam width and shape are defined by the dipole
position to the reflector and the reflector dimen-
sions. Particular the vertical edges of the reflector
screen have a decisive influence on vertically
polarized components.
For slanted polarizations, consisting of vertical
and horizontal components, parasitic elements in
the reflector screen as further beam-shaping ele-
ments are added, which mainly have an effect on
horizontally polarized components.
Thus already the patterns of the basic dipole
system are optimized, which means a great
benefit in combining them. The quality of the
resulting pattern is improved regarding sidelobes
and gain, and the required number of single ele-
ments is minimized (see item 2.2.4.).
In addition, with the separate adjustability of the
vertical and the horizontal components, the resul-
ting polarizations are controllable.
Orthogonal polarizations provide the best pola-
rization diversity gain results, therefore the hori-
zontal radiation patterns for the vertical and the
horizontal component are standard measure-
ments for Xpol antennas.
If the patterns half power beam widths and there-
by the gain values resp. the amplitudes are iden-
tical, the polarizations are orientated +/- 45° and
consequently orthogonal (fig. 2).
Fig. 2: Vertical (V) and horizontal (H) components and resulting polarizations:
a) Equal amplitudes (V=1/H=1) ? orthogonal polarizations
b) Different amplitudes (V=1/H=0.7) ? non-orthogonal polarizations
90˚˚54-˚54+ V V
H-H
70˚
V -35˚
-H
V+35˚
H
Antennen . Electronic
13

The polarization diversity technology assigns
both systems of an Xpol-antenna to work in the
Rx- and Tx-mode simultaneously. Therefore a
minimum isolation of 30 dB between the antenna
inputs is required.
Kathrein’s dipole design guarantees a min. isola-
tion of 32 dB. Measurements of each antenna
during the production show a typical value of 35
dB !
Within the basic dipole system („X“ and „rhomb“),
the symmetrical construction provides high isola-
tion, while the isolation from one bay to the next
is improved by patented decoupling measures.
A perfect polarization orthogonality results in a
high cross-polar ratio (CPR), which is determined
by measuring the horizontal radiation patterns
with the operating polarizations +45° and -45°.
The CPR compares the level difference between
the similar polarized signals (co-polar) and the
dissimilar polarized signals (cross-polar) of the
radiated wave. A high CPR stands for a high
uncorrelation of the two signals and consequent-
ly for a good polarization diversity performance.
The dipole design provides excellent values also
apart from the main direction (coverage sector
width +/- 60°) and even at +/- 90° (see item 4)!
Antennen . Electronic
2.2.3 High isolation between the two antenna systems
Low-loss flexible semi-rigid coax cables distribu-
te the power to each dipole and take care of the
impedance transformation. The diameter of the
cables (and the corresponding attenuation)
varies with the application, diameters of 0.250?,
0.141? and 0.085? are in operation.
This system produces only a minimal attenuation,
which will become apparent by comparing it with
a printed circuit solution. As a standard the corre-
sponding cross-section of the conductive lines is
between the 0.085? and the 0.141? cable.
In addition these lines are open and radiate a part
of the power, which causes further losses.
That means, to reach the same gain values,
antennas using a printed board power distribution
have to compensate the higher losses by additio-
nal bays of radiating elements! This results in a
roughly 20% higher vertical antenna length and a
smaller vertical beam width.
Another advantage of the cable harness is the
flexibility regarding versions with electrical down-
tilt. The required variation of the phase relations
between the radiating elements is carried out
easily by changing the length of the cables. It is
not necessary to redesign the entire antenna.
2.2.4 Low-loss power distribution by cables
14

Antennen . Electronic
Since more than 15 years Kathrein is doing rese-
arch on the reduction of intermodulation (IM) pro-
ducts. There was already a self-designed measu-
ring device for IM products at 450 MHz with a
dynamic range of 160 dB in operation, when such
a device was not available on the market.
The extremely valuable experiences flowed into
the antenna design and determine for example
the applied material, the possible material combi-
nations and how a contact between two parts
should look like.
Kathrein antennas provide a typical 3rd order
IM-products attenuation of -150 dBc using two
transmitters with an output power of 20 W
(43 dBm) each.
2.2.5 Low intermodulation products
Antennas are confronted with all the environ-
mental influences such as cold and hot tempera-
tures, rain, ice, snow, lightning and high wind
velocities.
Kathrein antennas are well prepared, the mecha-
nical design is based on the environmental con-
ditions according to ETS 300 019-1-4.
Regarding the deviation of the electrical parame-
ters, especially rain, ice and snow on the radome
may cause problem because of their dielectric
parameters. Due to the fact that the antenna dep-
ths became smaller and smaller, this dielectric
load is very close to the radiating elements, wor-
king as an additional capacity. Consequently the
operational frequency range is shifted, which
goes together with the deterioration of electrical
parameters like VSWR, isolation and CPR.
The Kathrein dipole technology is highly resistant
against rain, ice and snow. Dipoles are very slim
structures with a small surface and therefore the
occurring additional capacity is relatively low.
Due to their larger surface, the capacity in-
fluence on patches is much higher. For example,
a wet radome can change the isolation of a patch
antenna significantly, while a dipole antenna
reacts much more good natured.
2.2.6 Continuance of the electrical parameters against enviromental influences
15

Antennen . Electronic
The following antenna parameters have a decisive
influence on the network and are important for the
judgement of antennas :
1. Half power beam width for co-polar polarization
2. Half power beam width for vertical / horizontal polarization
3. Front-to-back ratio - co-polar
4. Front-to-back ratio - total power
5. Cross-polar ratio
For a high cross-polar attenuation the half power
beam widths of the three polarization components
co-polar, vertical and horizontal are similar. This fea-
ture is perfectly performed by Kathrein´s Xpol-
antennas and consequently there is no need for net-
work planning reasons to differentiate between the
above polarization components.
These measurements also provide the front-to-back
ratio, which is an important feature for the network
planning. The front-to-back ratio can be determi-
ned as the worst case of either the vertical or the
horizontal polarized components. It is only requi-
red to calculate the total power, if the two compo-
nents have similar levels. In case of identical
levels, the total power value is 3 dB less compa-
red to the individual components.
Xpol dipole antennas provide typical front-to-back
ratios of 24 – 30 dB total power.
The following figures show the co-polar and
cross-polar as well as the vertical and horizontal
polarized patterns of 65° and 90° antennas.
Beside the symmetry of the patterns, the scalar
printout with a linear scale in dB shows clearly the
cross-polar ratio in each azimuth direction. The
dipole design provides excellent values also
apart from the main direction and even at +/- 90°!
Please note as well the high front-to-back ratio for
the co-polar and the cross-polar signal.
3. Typical measurements
Fig. 3: Typical horizontal co-polar and cross-polar pattern for 65° beam width (measurement)
0
-5
-10
-15
-20
-25
-30
-35
-40-180 -120 -60 0 60 120 180
XPol A-Panel 800/900 65˚ 17dBihorizontal radiation pattern
120˚-sector
azimuth [deg]
rela
tive
gain
[dB
]
co-polcross-pol
16

Antennen . Electronic
Fig. 4: Typical 65° horizontal pattern of vertical and horizontal polarized component (measurement)
0
-5
-10
-15
-20
-25
-30
-35
-40-180 -120 -60 0 60 120 180
XPol A-Panel 800/900 65˚ 17dBihorizontal radiation pattern
120˚-sector
azimuth [deg]
rela
tive
gain
[dB
]
hor. polarizedvert. polarized
Fig. 5: Typical horizontal co-polar and cross-polar pattern for 90° beam width (measurement)
0
-5
-10
-15
-20
-25
-30
-35
-40-180 -120 -60 0 60 120 180
XPol A-Panel 800/900 90˚ 17dBihorizontal radiation pattern
120˚-sector
azimuth [deg]
rela
tive
gain
[dB
]
co-polcross-pol
17

Antennen . Electronic
Fig. 6: Typical 90° horizontal pattern of vertical and horizontal polarized components (measurement)
0
-5
-10
-15
-20
-25
-30
-35
-40-180 -120 -60 0 60 120 180
XPol A-Panel 800/900 90˚ 17dBihorizontal radiation pattern
120˚-sector
azimuth [deg]
rela
tive
gain
[dB
]
hor. polarizedvert. polarized
Fig. 7: CPR values against azimuth (according patterns fig. 3 and 4)
30
25
20
15
10
5
0-90 -60 -30 0 30 60 90
XPol A-Panel 800/900 65˚ 17dBiCross Polar Ratio
120˚-sector
azimuth [deg]
CP
R [d
B]
As already mentioned, the dipole design provides
excellent CPR values not only in main direction
but even at +/- 90°.
It is important for the coverage of a standard sec-
tor, to rely on high CPR values and consequently
on high diversity gains also at the sector edges,
where the antenna gain is already considerably
reduced.
4. CPR against azimuth
18

1. Lots of reflections from the walls, ceiling,
floor, furniture and persons (see sketch
above), destroy the free space radiation
patterns and the corresponding antenna gain.
2. The dimensions of normal rooms do not fulfil
the far field conditions (distance to the
antennas more than 3 m for GSM 900,
respectively 1.5 m for GSM 1800).
3. Therefore the measured far field patterns do
not apply; specific radiation patterns and
gains provide no benefit within closed rooms.
Kathrein refers to this physical facts with its pre-
sent indoor program with mainly two omni versi-
ons for ceiling mounting and one directional
antenna for wall mounting.
Apart from single band antennas, also multiband
versions are available.
Indoor Environment
Typical room
Indoor antennas just convert the RF power
Most clients prefer unobtrusive antenna appea-
rance in indoor applications. Kathrein reacted on
this demand by redesigning the most sold indoor
antennas 737 602 and 738 749.
The shape of the new models 741 571 and
741 572 adapts perfectly to the requirements of
modern buildings. In addition these antennas are
multiband types operating from 824 – 2170 MHz
and suitable for UMTS as well.
Unobtrusive design
2,5
m
Antennen . Electronic
19
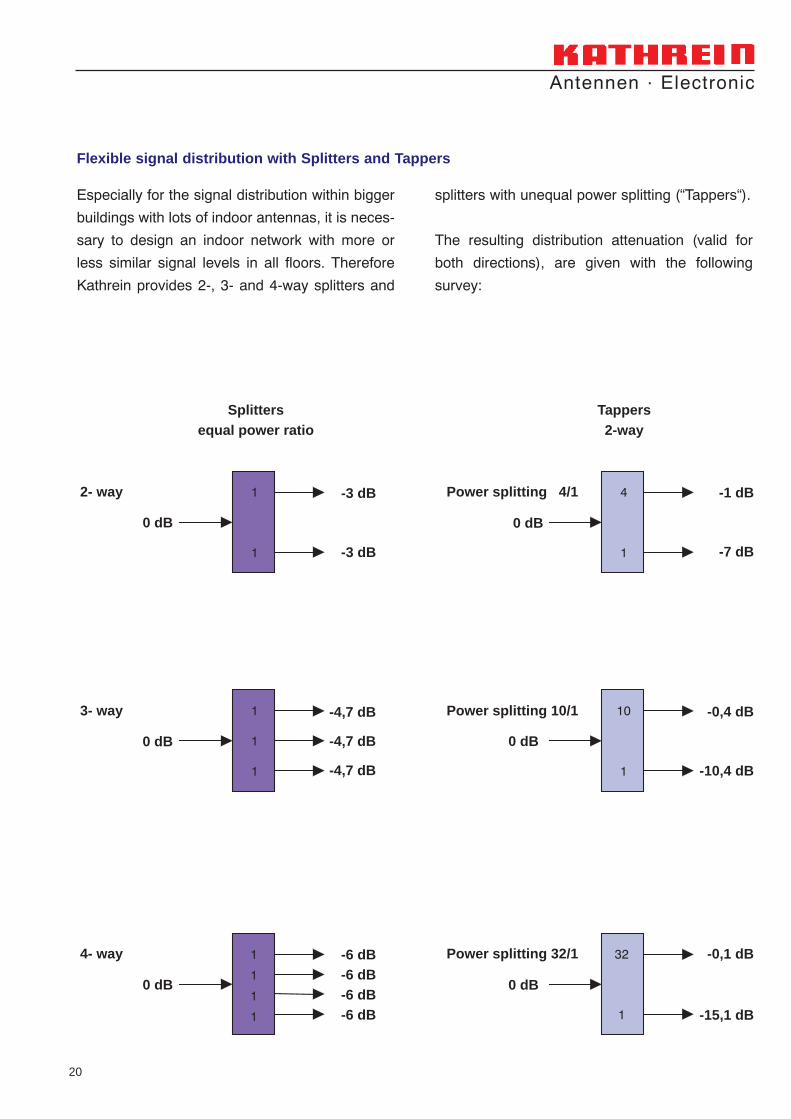
Especially for the signal distribution within bigger
buildings with lots of indoor antennas, it is neces-
sary to design an indoor network with more or
less similar signal levels in all floors. Therefore
Kathrein provides 2-, 3- and 4-way splitters and
splitters with unequal power splitting (“Tappers“).
The resulting distribution attenuation (valid for
both directions), are given with the following
survey:
Flexible signal distribution with Splitters and Tappers
Antennen . Electronic
Splittersequal power ratio
Tappers2-way
2- way Power splitting 4/11
1
0 dB
-3 dB
-3 dB
4
1
0 dB
-1 dB
-7 dB
3- way Power splitting 10/1
4- way Power splitting 32/1
1
1
1
-4,7 dB
-4,7 dB
-4,7 dB
0 dB
1
1
1
1
-6 dB-6 dB-6 dB-6 dB
0 dB
10
1
-0,4 dB
-10,4 dB
0 dB
32
1
-0,1 dB
-15,1 dB
0 dB
20

Similar signal levels in all floors (without cable losses)
Advanced Indoor System Dual Band
Antennen . Electronic
4-way Splitter K63 22 64 1
4-way Splitter K63 22 64 1
2-way Splitter K63 22 62 1
3-way Splitter K63 22 63 1
4-way Splitter K63 22 64 1
2-way Splitter K63 22 62 1
directional antenna forwall mounting
738573
omni antenna forceiling mounting
741572 -13,4 dB
-13,4 dB
-13,1 dB
-12,4 dB
-12,4 dB
-12,4 dB
-6,4 dB
-6,4 dB
-3,4 dB
-2,4 dB
-8,4 dB
-10,4 dB
-7,4 dB
-1,4 dB
-0,4 dB
41
41
10
1
41
Combiner 792 902
GSM 900Base Station
GSM 1800Base Station
2-way SplitterK 63 22 62 1
2-way Tapper 4/1K 63 23 60 61
2-way Tapper 4/1K 63 23 60 61
2-way Tapper 4/1K 63 23 60 61
2-way Tapper 10/1K 63 23 61 01
5. Floor
4. Floor
6. Floor
3. Floor
2. Floor
1. Floor
relative signal strength 0 dB
-9,4 dB
21

Network planners often have the problem that the
base station antenna provides an overcoverage.
If the overlapping area between two cells is too
large, increased switching between the base sta-
tion (handover) occurs, which strains the system.
There may even be disturbances of a neighbou-
ring cell with the same frequency.
In general, the vertical pattern of an antenna
radiates the main energy towards the horizon.
Only that part of the energy which is radiated
below the horizon can be used for the coverage
of the sector. Downtilting the antenna limits the
range by reducing the field strength in the horiz-
on and increases the radiated power in the cell
that is actually to be covered.
The simplest method of downtilting the vertical
diagram of a directional antenna is a mechanical
tipping to achieve a certain angle while using an
adjustable joint. (see Figure 1) But the required
downtilt is only valid for the main direction of the
horizontal radiation pattern. In the tilt axis direc-
tion (+/-90° from main beam) there is no downtilt
at all. Between the angles of 0° and 90° the
downtilt angle varies according to the azimuth
direction.
This results in a horizontal half-power beam
width, which gets bigger with increasing downtilt
angles. The resulting gain reduction depends on
the azimuth direction. This effect can rarely be
taken into consideration in the network planning
(see Figure 2).
Downtilting of antennas
Antennen . Electronic
1.1 Mechanical downtilt
1. Downtilting the vertical pattern
22
3 dB
10
0
90°
0°
+90
Fig. 2:Changes in the horizontal radiation pattern when various downtilt angels are used (compared to the horizon)
Fig. 1:Mechanically downtilted A-Panel
MECHANICAL DOWNTILT
0°6°8°10°
036
91215
20

Antennen . Electronic
1.2 Electrical downtilt
In general, the dipols of an antenna are fed with
the same phase via the distribution system. By
altering the phases, the main direction of the ver-
tical radiation pattern can be adjusted. Figure 3,
shows dipols that are fed from top to bottom with
a rising phase of 70°. The different phases are
achieved by using feeder cables of different
lengths for each dipole.
The electrical downtilt has the advantage, that the
adjusted downtilt angle is constant over the whole
azimuth range. The horizontal half-power beam
width remains unaltered (see Figure 4). However,
the downtilt angle is fixed and cannot be chan-
ged.
23
3 dB
10
0
-90°
0°
+90
0°6°8°10°
ELECTRICAL
Figure 4:Changes in the radiation pattern using various downtilt angles
Figure 3:Phase variations for a fixed el. downtilt
1.3 Adjustable electrical downtilt
With this technique it is possible to combine the
advantages of the mechanical downtilt (i. e.
adjustment possibility) with those of electrical
downtilt (horizontal half-power beam independent
of downtilt angle). Instead of using different fixed
cables to achieve the various phases for the dipo-
les, mechanical phase-shifters are used.
P = 1
P = 2
P = 3.5
P = 2
P = 1
Phase-shifter
+ +?
+?
- -?
-?
Figure 5:Phase diagram of an adjustable phase-shifter
? = 0˚
? = 70˚
? = 140˚
? = 210˚
? = 280˚

Figure 6: Downtilt adjusting mechanism (with scale) for A-Panels
In standard applications the purpose of using a
downtilt is to limit the field strength in the horizon.
Considerable limitation is achieved if the radiated
power in the horizon is limited by 6 dB. This
means that one can easily predict the smallest
efficient tilt angle by simply tilting the vertical
radation pattern until the field strength in the hori-
zon is reduced by 6 dB.
But there is also a second important point when
calculating the optimum downtilt angle. Apart
from the main beam, vertical radiation patterns
also have two or more side lobes depending on
the number of dipoles within the antenna (see
Figure 7).
Maximum field strength reduction in the horizon is
achieved if the minimum between the main beam
and the first side-lobe is orientated towards the
horizon.
Antennen . Electronic
24
The adjustment mechanisms can be positioned
either on the rearside (Eurocell panels) or on the
bottom (F-Panels, A-Panels) of the antenna.
These phase-shifters can be used to set various
downtilt angles which remain constant over the
whole azimuth range.
2. Optimum downtilt angles
The optimum tilt angle for a particular antenna
depends on the vertical radiation pattern, especi-
ally on the half-power beam width, and therefore
also on the actual length of the antenna.
2.1 How to calculate the optimum downtilt angle

Antennen . Electronic
As the Figure 8 shows, the minimum tilt angle
that would be efficient lies at around 50° (power
in the horizon reduced by 6 dB). Using such an
angle, the antenna would beam more or less
directly into the ground. Therefore the use of a
downtilt with very small antennas (i.e. length up
to 500 mm) can not be recommended.
2.2 Small antennas – vertical half-power beam width 70°
25
Main beam
First upper side-lobe
Figure 7: Typical vertical radiation pattern
If the tilt angle is set too high, the field strength is
not reduced, but is increased again by the first
side-lobe.
Figure 8: Minimum efficient tilt angle for small antennas
10
3
0

Antennen . Electronic
The minimum efficient tilt angle for these anten-
nas (length 1.3 m) lies at 8°. At an angle of 19°
the first side-lobe lies on the horizon. This provi-
2.3 Standard antennas – vertical half-power beam width 13°
The minimum efficient tilt angle for these anten-
nas (length 2.6 m) lies at around 3°–4°. At an
angle of 8°–9° the first side-lobe lies on the hori-
zon. This provides a good range of angles for the
efficient tilting of long antennas.
2.4 Long antennas – vertical half-power beam width 6.5°
26
10
3
0
des a good range of angles for the efficient tilting
of standard antennas.
Figure 9: Minimum efficient tilt angle for standard antennas
Figure 11: Minimum efficient tilt angle for long antennas
10
3
0
10
3
0
Figure 10: First side-lobe lies on the horizon

Antennen . Electronic
For some special locations (e.g. on the tops of
high mountains, on the roof-tops of tall buildings
or for coverage in the street below etc.) a very
high downtilt angle might be necessary. To achie-
ve such high downtilt angles, a combination of
mechanically and electrically downtilted antennas
is also possible.
2.5 High downtilt angles for special locations
27
Taking all the above into account, it is easy to
imagine, how very sophisticated the development
of electrically adjustable downtilt antennas is,
since intensive measurements have to be carried
out.
All the electrical parameters must fulfil the speci-
fications with every single downtilt angle.
Electrical values such as those for side-lobe sup-
pression, isola-tion, cross-polar ratio, intermodu-
lation or beam tracking are especially critical.
Kathrein´s lengthy and outstanding experience
with vertical polarized electrical adjustable anten-
nas has enabled us to fully optimize the charac-
teristics of the new X-polarized and dual-band
X-polarized antenna models.
3. Consequences regarding the electrical parameters

Antennen . Electronic
28
Passive Intermodulation at Base Station Antennas
If a base station antenna transmits two or more
signals at a time, non-linearities can cause inter-
ferences, which may block one or more receiving
channels of the base station antenna. This can
result in a connection breakdown to a mobile.
1. Introduction
Figure 1: Base station communicating with two mobiles
The risk for this problem to occur increases with
the number of transmitting (Tx) frequencies
connected to one base station antenna.
With the standard XPol-antennas 2 Tx-antennas
are combined (see Figure 2).
Figure 2: XPol antenna with two duplexers
The latest technology using dual-band, dual-pola-
rised (XXPol) antennas, now again doubles the
number of antennas and hence also the number
of carriers in one radome, to combine both the
900 and 1800 MHz systems. But this also means
a further possible increase in interferences pro-
blems.
These interference problems are called
“Intermodulation”.
Tx1 Rxa Tx2 Rxb

Antennen . Electronic
Intermodulation products of even orders
Intermodulation (IM) is an undesirable modula-
tion which leads to unwelcome alterations to the
high frequency carrier output.
An input signal put into a linear passive device at
a certain frequency f1 will produce an output sig-
nal with no modification to the frequency.
Here only the amplitude and the phase can be
modified.
However, if the same signal is put into a passive
device with non-linear transmission characte-
ristics, then this will result in distortions to the
time-scale, leading to changes in the frequency.
This means that, in addition to the carrier fre-
quency f1, several harmonics are produced: 2 f1,
3 f1, 4 f1, ..., n f1.
Moreover, if the input signal contains two or more
frequency components, f1 and f2, the output
signal will generate a spectral composition. In
addition to the harmonics, this new spectral com-
position also includes all possible frequency com-
binations. These frequency combinations can be
expressed by the equation:
2. What is Intermodulation?
IMP = nf1± mf2IMP: Inter Modulation Products
n,m = 1, 2, 3, ...
Only the IMP > 0 are physically relevant.
The order of the IMP can be equated as: O = n + m
There are IMP of even and odd orders. The pro-
ducts of even orders have a large spacing to the
original Tx frequencies and therefore cause no
problems with single band antennas. The most
troublesome IMP are those of the odd orders:
Intermodulation products of odd orders
Since the IMP frequencies of the odd orders lie
very close to the original frequencies, they can
appear within the received signal band-width
and thereby degrade the overall communication
system.
29
2nd Order f1 + f2 / f2 – f1 3rd Order 2f1 – f2
4th Order 2 f1 + 2 f2 / 2 f2 – 2 f1 5th Order 3f1 – 2f2
7th Order 4f1 – 3f2
Large spacing compared to the original frequencies Close to the original frequencies

Antennen . Electronic
If high-power signals of different frequencies
exist, any device with non-linear voltage-current
characteristics will generate intermodulation
products. The level will depend on the degree of
the non-linearity and on the power-ratings of the
incident frequencies.
3. Where do intermodulation products come from?
Level
Frequency
Rx Tx
f f f f f f f f f
2f2 – f1
3f2 – f1
4f2 – f1
2f1 – f2
3f1 – f2
4f1 – f2
f1 f2
Level
Frequency
f1 f2
f
Figure 3: Input signals
Figure 4: IM spectrum of odd orders
30

Antennen . Electronic
Contact non-linearities at metal/metal joins
Contact non-linearities arise where discontinui-
ties exist in the current path of the contact. They
may have various causes and are not normally
visible to the naked eye. The following are poten-
tial causes:
Current mobile telephone systems are designed to
operate with a transmitting frequency range Tx and
a slightly shifted receiving frequency range Rx.
Problems arise when intermodulation products
occur in the receiving Rx frequency range (see
also Figure 4) which degrade the reception per-
formance. The following example for GSM 900
shows that, under certain conditions, the intermo-
dulation products of 3rd, 5th and even 7th or higher
orders may fall in the receiving band.
Material and surface-plating non-linearities
There are two main categories of non-linearities:
• Surface condition of the join, e.g. dirt, surface textures, ...
• Electron tunnelling effect in metal insulator metal joins
• Contact mating: Poor contact spring force or poor contact quality
• Non-linear conductive materials or treated surfaces (e.g. the treatment of
copper foils on printed circuit boards (PCB´s) – patch antennas on PCB)
• Magneto-resistance effect in non-magnetic materials
• Non-linearity due to non-linear dielectric
• Non-linearity due to variations of permeability into ferromagnetic materials
Material non-linearity is an important source of
intermodulation products if two or more signals
pass through ferro-magnetic material.
But the result of a poor contact join is of far more
significance!
4. Why is intermodulation a problem?
GSM 900Tx Band Rx Band
935 – 960 MHz 890 – 915 MHzIntermodulation Products f1 f2 fIM
3rd Order 2f1 - f2 936 MHz 958 MHz 914 MHz5th Order 3f1 - 2f2 938 MHz 956 MHz 902 MHz7th Order 4f1 - 3f2 941 MHz 952 MHz 908 MHz
31

Antennen . Electronic
The most disturbing intermodulation products in
the GSM 900 and 1800 systems are those of the
3rd order. These are the products with the highest
power level and also the ones that lie closest to
the original transmitting frequencies. These pro-
ducts may block the equivalent Rx channels. It is
therefore absolutely essential to keep the IMP´s
to a minimum level below the sensitivity of the
receiving equipment.
IM = 10 log PIMP3 [dBm]
These products are measured as Intermodulation Levels in either dBm or dBc.
The total intermodulation level compared to a power-rating of 1 mW is expressed in dBm:
IM = 10 log(PIMP3/PTx [dBc]
On the other hand, dBc is defined as the ratio of the third order intermodulation product
to the incident Tx carrier signal power:
The levels of intermodulation products according to the GSM standard are shown
in the following table:
A comparison of the carrier level and the level of the IMP expressed in distances
clearely illustrates this fact:
Level of IM products accord. GSM Standard < – 103 dBm(3rd order)
Referred to two carriers of 20 W each < – 146 dBc(43 dBm)
IM attenuation of Kathrein antennas Typically < –150 dBc
Comparison Carrier IM Product0 dBm — 150 dBm
Average distance earth – sun 150 Mill. kilometermm 51,0ecnatsid tnelaviuqE
32

In view of all the facts mentioned, the following
points must be taken into consideration when
designing passive devices such as antennas,
cables and connectors:
Antennen . Electronic
5. What solutions are there?
• All components such as feeder cables, jumpers, connectors etc. must fulfil the IM standards.
• All connectors must have good points of contact.
• Particular materials such as copper, brass or aluminium are recommended. Other materials
like steel and nickel should to be avoided in the signal path.
• Material combinations with a high chemical electrical potential should not be used as any
thin corrosion layer between the materials will act as a semi-conductor.
• All points of contact should be well-defined and fixed.
• All cable connections should be soldered.
Engineers at KATHREIN have been researching
ways of reducing intermodulation (IM) products for
more than 15 years now. Long before other such
devices became available on the market, Kathrein
developed a company-designed IM product measu-
ring device for the 450 MHz frequency with an ope-
rating sensitivity of –160 dBc.
Kathrein´s long-standing and extremely valuable
experience is incorporated into all our antenna
designs and helps to determine for example the
best material to use, all possible material combina-
tions and also what a point of contact between two
antenna parts should look like.
Kathrein antennas typically show a 3rd order
intermodulation product attenuation of –150 dBc,
where two transmitters each with an output
power-rating of 20 W (43 dBm) are used.
As explained earlier, there is an increased risk of
intermodulation with XX-pol. antennas since four
Tx antennas are used. IMP´s of the 2nd order
may also cause problems with XX-pol. antennas
due to the combination of the 900 and the
1800 MHz frequencies. Kathrein has therefore
introduced a 100% final test rate for intermodula-
tion products in their serial production of all
XX-pol. antennas.
33

internet: http://www.kathrein.de KATHREIN-Werke KG Phone +49 8031 184-0 Fax +49 8031 184-306 Anton-Kathrein-Straße 1 - 3 P.O. Box 10 04 44 83004 Rosenheim Germany