summary of safety and effectiveness data (ssed)pma p170025: fda summary of safety and effectiveness...
TRANSCRIPT

PMA P170025: FDA Summary of Safety and Effectiveness Data Page 1
SUMMARY OF SAFETY AND EFFECTIVENESS DATA (SSED)
I. GENERAL INFORMATION
Device Generic Name: HBV DNA quantitative test
Device Trade Name: Aptima® HBV Quant assay
Device Procode: MKT
Applicant’s Name and Address: Hologic, Inc. 10210 Genetic Center Drive San Diego, CA 92121
Date(s) of Panel Recommendation: None
Premarket Approval Application (PMA) Number: P170025
Date of FDA Notice of Approval: January 23, 2018
II. INDICATIONS FOR USE The Aptima HBV Quant assay is an in vitro nucleic acid amplification test for the quantitation of hepatitis B virus (HBV) DNA in human plasma and serum on the fully automated Panther® system. Plasma may be prepared in ethylenediaminetetraacetic acid (EDTA), anticoagulant citrate dextrose (ACD) solution, and plasma preparation tubes (PPTs). Serum may be prepared in serum tubes and serum separator tubes (SSTs). Specimens are tested using the fully automated Panther system for sample processing, amplification, and quantitation. Specimens containing HBV genotypes A, B, C, D, E, F, G, and H are validated for quantitation in the assay. The Aptima HBV Quant assay is intended for use as an aid in the management of patients with chronic HBV infections undergoing HBV antiviral drug therapy. The assay can be used to measure HBV DNA levels at baseline and during treatment to aid in assessing viral response to treatment. The results from the Aptima HBV Quant assay must be interpreted within the context of all relevant clinical and laboratory findings. Assay performance for determining the clinical stage of HBV infection has not been established. Clinical performance characteristics have been established for individuals treated with tenofovir disoproxil fumarate or entecavir. The Aptima HBV Quant assay is not approved for use as a screening test for the presence of HBV DNA in blood or blood products or as a diagnostic test to confirm the presence of HBV infection.

PMA P170025: FDA Summary of Safety and Effectiveness Data Page 2
III. CONTRAINDICATIONS
There are no known contraindications. IV. WARNINGS AND PRECAUTIONS
The warnings and precautions can be found in the Aptima HBV Quant assay labeling. V. DEVICE DESCRIPTION
The Aptima HBV Quant assay involves three main steps, which all take place in a single tube on the Panther system: target capture, target amplification by transcription-mediated amplification (TMA), and detection of the amplification products (amplicon) by the fluorescent labeled probes (torches). During target capture, viral DNA is isolated from specimens. The specimen is treated with a detergent to solubilize the viral envelope, denature proteins, and release viral genomic DNA. Capture oligonucleotides hybridize to highly conserved regions of the HBV genome, if present, in the test specimen. The hybridized target is then captured onto magnetic micro-particles that are separated from the specimen in a magnetic field. Wash steps remove extraneous components from the reaction tube. Target amplification occurs via transcription-based nucleic acid amplification method that utilizes two enzymes, MMLV (Moloney murine leukemia virus) reverse transcriptase and T7 RNA polymerase. The reverse transcriptase is used to generate a DNA copy of the target sequence which contains a promoter sequence for T7 RNA polymerase. T7 RNA polymerase produces multiple copies of RNA amplicon from the DNA copy template. The Aptima HBV Quant assay utilizes the TMA method to amplify two regions: polymerase gene and surface gene of the HBV genome. This dual target region approach mitigates the risk of under-quantitation from one of the target regions due to potential mutations. Amplifications of those regions are achieved using specific primers designed to amplify HBV genotypes A, B, C, D, E, F, G, and H. The dual target region approach with primer design targeting the most conserved regions ensure accurate quantitation of the HBV DNA. Detection is achieved using single-stranded nucleic acid torches that are present during the amplification of the target and hybridize specifically to the amplicon as it is generated in real-time. Each torch has a fluorophore and a quencher. The quencher suppresses the signal of the fluorophore when not hybridized to the amplicon. When the torch binds to the amplicon, the quencher is moved further away from the fluorophore and it will emit a signal at a specific wavelength when excited by a light source. More torch hybridizes when more amplicon is present creating higher fluorescent signal. The time taken for the fluorescent signal to reach a threshold is proportional to the starting HBV DNA concentration. Each reaction has an internal calibrator/internal control (IC) which controls for variations in specimen processing, amplification, and detection. The concentration of a sample is determined automatically by the Panther system software

PMA P170025: FDA Summary of Safety and Effectiveness Data Page 3
using the HBV and IC signals for each reaction and comparing them to calibration information. Components of the Aptima HBV Quant assay Kit The Aptima HBV Quant assay kit (100 tests) for the Panther system consists of 4 reagent kits:
Box 1: Aptima HBV Quant assay kit which contains the following reagents:
• Amplification Reagent • Enzyme Reagent • Promoter Reagent • Target Capture Reagent • Amplification Reconstitution Reagent • Enzyme Reconstitution Reagent • Promoter Reconstitution Reagent
Box 2: Aptima HBV Quant Controls kit which contains the following reagents:
• Negative Control • Low Positive Control • High Positive Control
Box 3: Aptima HBV Quant Calibrator kit which contains the following reagent:
• Positive Calibrator Box 4: Aptima HBV Quant Target Enhancer Reagent Box
• Target Enhancer Reagent
There is one ancillary kit required to perform the assay (available separately): Aptima Assay Fluids kit (also known as Universal Fluids Kit) which contains the following reagents:
• Wash Solution • Buffer for Deactivation Fluid • Oil Reagent
The Aptima Specimen Diluent kit is one optional ancillary kit which can be procured separately. The Aptima Specimen Diluent reagent provided in this kit is used to dilute plasma and serum specimens that are tested with the Aptima HBV Quant assay on the Panther system.
Quality Control Procedures The Aptima HBV Quant assay contains three quality controls: 1. Assay Calibration An assay calibration must be completed to generate valid results. A single positive calibrator is run in triplicate each time a reagent kit is loaded on the Panther system. Once established, the calibration is valid for up to 24 hours. Software on the Panther

PMA P170025: FDA Summary of Safety and Effectiveness Data Page 4
system alerts the operator when a calibration is required. The operator scans a calibration coefficient found on the Master Lot Barcode Sheet provided with each reagent kit. During processing, criteria for acceptance of the calibrator are automatically verified by the software on the Panther system. If less than two of the calibrator replicates are valid, the software automatically invalidates the run. Samples in an invalidated run must be retested using a freshly prepared calibrator and freshly prepared controls. 2. Negative and Positive Controls A set of assay controls must be tested to generate valid results. One replicate of the negative control, the low positive control, and the high positive control must be tested each time a reagent kit is loaded on the Panther system. Once established, the control measurements are valid for up to 24 hours. Software on the Panther system alerts the operator when controls measurements are required. During processing, criteria for acceptance of controls are automatically verified by software on the Panther system. To generate valid results, the negative control must give a result of “Not Detected” and the positive controls must give results within predefined parameters. If any one of the controls has an invalid result, the software automatically invalidates the run. Samples in an invalidated run must be retested using a freshly prepared calibrator and freshly prepared controls. 3. Internal Calibrator/Internal Control Each sample contains an internal calibrator/internal control (IC). During processing, IC acceptance criteria are automatically verified by the Panther system software. If an IC result is invalid, the sample result is invalidated. Every sample with an invalid IC result must be retested to obtain a valid result. The Panther system software is designed to accurately verify processes when procedures are performed following the instructions provided in this package insert and the Panther System Operator's Manual. Interpretation of Results The Panther system automatically determines the concentration of HBV DNA for specimens and controls by comparing the results to a calibration curve. HBV DNA concentrations are reported in IU/mL and log10 IU/mL. The interpretation of results is provided in Table 1. If the dilution option is used to dilute specimens, the Panther system automatically calculates the HBV concentration for the neat specimen by multiplying the diluted concentration by the dilution factor and diluted samples will be flagged as diluted. For diluted specimens, results listed as “Not Detected” or “<10 detected” may be generated by diluting a specimen with a concentration above, but close to the LoD (limit of detection) or LLoQ (lower limit of quantitation). It is recommended to collect and test another neat specimen if a quantitative result is not obtained.

PMA P170025: FDA Summary of Safety and Effectiveness Data Page 5
Table 1: Results Interpretation Reported Aptima HBV Quant assay Result Interpretation
IU/mL Log10 IU/mLa
Not Detected Not Detected HBV DNA not detected. <10 detected <1.00 HBV DNA is detected but at a level below
the LLoQ 10 to 1,000,000,000 1.00 to 9.00 HBV DNA concentration is within the linear
range of 10 to 1,000,000,000 IU/mL
> 1,000,000,000 > 9.00 HBV DNA concentration is above the ULoQc Invalidb Invalidb Error indicated in the generation of the result.
Specimen should be retested aValue is truncated to two decimal places. b Invalid results are displayed in blue colored font. cSerum and plasma specimens with value above the ULoQ may be diluted and retested to determine a quantitative result within the linear range Note: For diluted specimens with neat concentrations greater than the ULoQ, results will be reported using scientific notation.
VI. ALTERNATIVE PRACTICES AND PROCEDURES
There are currently several FDA approved in vitro diagnostic tests for the quantitation of HBV DNA from patient samples. The patient’s medical history and thorough clinical examination, in addition to serology, PCR or nucleic acid testing (NAT), determination of liver enzyme levels, and biopsy of the liver will provide further information on the status of an HBV infection. Each alternative has its own advantages and disadvantages. A patient should fully discuss these alternatives with his/her physician to select the method that best meets expectations and lifestyle.
VII. MARKETING HISTORY
The Aptima HBV Quant assay, accessory kits, and Aptima Specimen Diluent are marketed in multiple countries. The device has not been withdrawn from marketing for any reasons related to its safety or effectiveness. The following is a list of countries where the product is distributed: • Austria • Lithuania • Belgium • Sweden • Czech Republic • Luxembourg • Bulgaria • Spain • Denmark • Malta • Croatia • Italy • Estonia • The Netherlands • Cyprus • Australia • Finland • Norway • Greece • Canada • France • Poland • Iceland • Germany • Romania • Latvia • Hungary • Switzerland • Liechtenstein

PMA P170025: FDA Summary of Safety and Effectiveness Data Page 6
• Ireland • United Kingdom • Slovenia VIII. POTENTIAL ADVERSE EFFECTS OF THE DEVICE ON HEALTH
When used according to the instructions in the package insert, there are no known potential direct adverse effects on health. The results of the Aptima HBV Quant assay must be interpreted within the context of all relevant clinical and laboratory findings. Failure of the Aptima HBV Quant assay to perform as indicated due to human error or other cause may lead to improper patient management. An incorrect low test result or a false negative result may lead to an inappropriate treatment decision, delay in initiation of treatment, and premature discontinuation of antiviral therapy An incorrect high test result or a false positive may contribute to a change in therapy, unnecessary treatment, prolonged duration of therapy, or may impact the psychological well being of the patient. Inaccurate results around clinically significant HBV DNA levels such as 2,000 IU/mL and 20,000 IU/mL may impact patient management. Because medical practitioners usually obtain multiple (serial) measurements through the course of the disease, the risk of acting on a single result is lowered. In addition, other laboratory markers (e.g. ALT) may also provide additional information to the medical practitioner to guide patient management. Thus the risks are mitigated by the availability of other medical history information and other laboratory test results.
IX. SUMMARY OF NONCLINICAL STUDIES
A. Laboratory Studies
Limit of Detection (LoD) Using the 3rd HBV WHO International Standard The LoD was determined by testing dilutions of the 3rd HBV WHO International Standard (NIBSC 10/264, genotype A) in HBV negative human plasma and serum. A total of 9 panel members were tested over 3 days on 3 Panther systems with 3 reagent lots. Probit analysis was used to determine the LoD. The LoD for the Aptima HBV Quant assay using the 3rd HBV WHO Internation Standard standard 4.8 IU/mL for plasma and 5.9 IU/mL for serum. Limit of Detection by HBV Genotype The LoD across genotypes was determined by testing dilutions of HBV positive clinical specimens for genotypes A, B, C, D, E, F, G and H in HBV negative human plasma and serum. Each panel was tested on multiple Panther systems over multiple days with multiple reagent lots. Probit analysis was used to determine the LoD. The LoD for each genotype is shown in Table 2.

PMA P170025: FDA Summary of Safety and Effectiveness Data Page 7
Table 2: HBV DNA Genotype LoD in Plasma and Serum Genotype Plasma IU/mL Serum IU/mL
A 3.3 4.1 B 2.9 3.9 C 4.9 5.2 D 5.7 5.4 E 5.8 5.8 F 3.0 4.0 G 2.8 7.4 H 5.5 6.3
Linear Range Genotype A: The linear range was established by testing panels of HBV genotype A virus (0.78 log10 IU/mL to 7.30 log10 IU/mL ) and plasmid DNA (5.30 log10 IU/mL to 9.18 log10 IU/mL) diluted in HBV negative human plasma and serum according to CLSI EP06-A. The Aptima HBV Quant assay demonstrated linearity across the range tested with an upper limit of quantitation (ULoQ) of 9.0 log10 IU/mL as shown in Figure 1.
Figure 1: Linearity in Plasma and Serum
Linearity Across HBV Genotypes: The linearity of HBV genotypes was established by testing individual clinical positive samples for genotypes A, E, F, G, and H, and PEI 1st WHO Reference panels (PEI 5086/08) for genotypes B, C, and D. Virus was used for the lower range of the assay (4 log IU/mL and below for genotypes A-G, 3 log IU/mL and below for genotype H), and plasmid DNA was used for the upper range with a 2 log overlap. Dilutions in negative human plasma were tested for all genotypes. Linearity was demonstrated across the range tested for all genotypes tested as shown in Figure 2 and Table 3 for plasma and for serum. The Aptima HBV

PMA P170025: FDA Summary of Safety and Effectiveness Data Page 8
Quant assay on the Panther system demonstrated linearity across genotypes and serum and plasma with a dynamic range of 1.0 log IU/mL to 9.0 log IU/mL.
Figure 2: Linear Range and Linearity (Plasma)
Table 3: Linear Fit Equations across Genotypes (Plasma) Genotype Linear Equation Maximum Non-
linearity (log10 IU/mL)
A y = 0.9919 x + 0.0395 0.09 B y = 1.0238 x – 0.2043 N/A* C y = 1.0124 x – 0.2475 0.10 D y = 1.0196 x – 0.2987 0.07 E y = 0.9872 x + 0.0832 0.13 F y = 0.9958 x + 0.1273 0.14 G y = 1.0013 x – 0.0466 0.11 H y = 1.0561 x – 0.323 -0.05
*No 2nd/3rd order polynomial fit is statistically better than a linear fit at the significance level for genotype B.
Lower Limit of Quantitation (LLoQ) Using the 3rd HBV WHO International Standard: The lower limit of quantitation (LLoQ) is defined as the lowest concentration at which HBV DNA is reliably quantitated within a total error, according to CLSI EP17-A2. Total error was estimated by two methods: Total Analytical Error (TAE) = |bias| + 2SD, and Total Error (TE) = SQRT(2) x 2SD. To ensure accuracy and precision of measurements, the total error of the Aptima HBV Quant assay was set at 1 log10 IU/mL (i.e., at the LLoQ, the difference between two measurements of more than 1 log10 IU/mL is statistically significant).

PMA P170025: FDA Summary of Safety and Effectiveness Data Page 9
The LLoQ was determined by testing panels of the 3rd WHO International Standard for Hepatitis B Virus DNA (NIBSC 10/264, genotype A) diluted in HBV negative human plasma and serum. Forty-five (45) replicates of each dilution were tested with each of three reagent lots for a minimum of 135 replicates per dilution. For a given matrix, the lowest observed result within a reagent lot that met the accuracy goal (TE≤ 1 log10 IU/mL and TAE≤ 1 log10 IU/mL) with >95% detection and greater than or equal to the LOD was selected as the LLoQ for that reagent lot. The highest LLoQ observed across all reagent lots tested was selected as the final LLoQ for that matrix which is 6 IU/mL (0.79 log IU/mL) for plasma and 8 IU/mL (0.88 log IU/mL) for serum. The LLoQ was established across genotypes (see next section "Determination of the Lower Limit of Quantitation (LLoQ) Across HBV Genotypes"). This genotype data establishes the overall LLoQ for the assay as 10 IU/mL. Determination of LLoQ Across HBV Genotype: The LLoQ across genotypes was determined by testing dilutions of HBV positive clinical specimens for genotypes A, B, C, D, E, F, G, and H in HBV negative human plasma and serum. Assignment of the concentration of clinical specimens was determined using an FDA approved assay. Thirty-six (36) replicates of each panel member were tested with each of two reagent lots for a minimum of 72 replicates per panel member. For a given genotype and matrix, the lowest observed result within a reagent lot that met the accuracy goal (TE≤ 1 log10 IU/mL and TAE≤ 1 log10 IU/mL) with >95% detection and greater than or equal to the LOD was selected as the LLoQ for that reagent lot. The highest LLoQ observed across the two reagent lots tested for a given genotype and matrix was selected as the final LLoQ for that genotype and matrix . The calculated LLoQ for genotypes A, B, C, D, E, F, G, and H in plasma and serum are summarized in Table 4: Summary of LLoQ Across Genotypes (Plasma and Serum). Genotype D in serum had the highest LLoQ at 9 IU/mL. This supports the overall LLoQ for the assay as 10 IU/mL.
Table 4: Summary of LLoQ Across Genotypes (Plasma and Serum)
HBV Genotype
Plasma LLoQ Serum LLoQ
(IU/ml) (log10 IU/ml) (IU/ml) (log10
IU/ml) A 7 0.85 6 0.81 B 6 0.75 5 0.72 C 6 0.75 6 0.81 D 8 0.91 9 0.96 E 8 0.88 8 0.89 F 7 0.86 6 0.76 G 4 0.65 8 0.89 H 7 0.83 6 0.81
Traceability to the 3rd HBV WHO International Standard: A series of secondary standards with known concentrations were used throughout product development and product manufacturing to establish traceability to the 3rd HBV WHO International

PMA P170025: FDA Summary of Safety and Effectiveness Data Page 10
Standard. The concentrations tested for the HBV WHO standard were between 2.0 and 4.0 log10 IU/mL, the secondary standards ranged in concentration from 2.4 to 8.4 log10 IU/mL. The Aptima HBV Quant assay controls and calibrators were also tested along with the secondary standards and the WHO standard. All of the panels had similar results, and they were distributed linearly across the assay's linear range, as presented in Figure 3.
Figure 3: Traceability Between 3rd WHO Standard and Calibrators and Controls
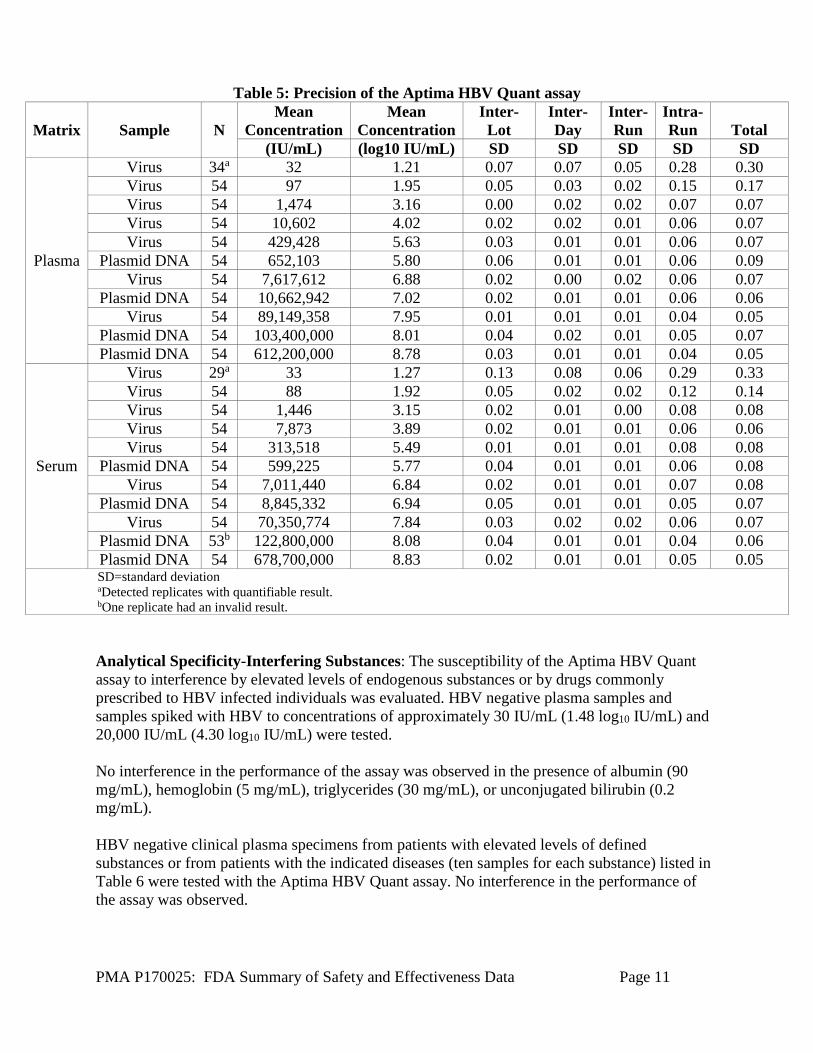
Precision-Within Laboratory: The Aptima HBV Quant precision panel was built by diluting HBV genotype A virus and HBV plasmid DNA into HBV-negative clinical plasma and HBV-negative clinical serum (the four highest panel members in each matrix were plasmid DNA). Eleven panel members in each matrix spanned the range of the assay (target concentrations of 1.30 log10 IU/mL to 8.90 log10 IU/mL), and were tested in three replicates per run by one operator, using three reagent lots on one Panther system over three days, two runs a day. Table 5 shows the precision of assay results (in log10 IU/mL) between days, between lots, between runs, within runs, and overall. Total variability was primarily due to the intra-run measurement (i.e., random error).
PMA P170025: FDA Summary of Safety and Effectiveness Data Page 11
Table 5: Precision of the Aptima HBV Quant assay
Matrix Sample N Mean
Concentration Mean
Concentration Inter-Lot
Inter-Day
Inter-Run
Intra-Run Total
(IU/mL) (log10 IU/mL) SD SD SD SD SD
Plasma
Virus 34a 32 1.21 0.07 0.07 0.05 0.28 0.30 Virus 54 97 1.95 0.05 0.03 0.02 0.15 0.17 Virus 54 1,474 3.16 0.00 0.02 0.02 0.07 0.07 Virus 54 10,602 4.02 0.02 0.02 0.01 0.06 0.07 Virus 54 429,428 5.63 0.03 0.01 0.01 0.06 0.07
Plasmid DNA 54 652,103 5.80 0.06 0.01 0.01 0.06 0.09 Virus 54 7,617,612 6.88 0.02 0.00 0.02 0.06 0.07
Plasmid DNA 54 10,662,942 7.02 0.02 0.01 0.01 0.06 0.06 Virus 54 89,149,358 7.95 0.01 0.01 0.01 0.04 0.05
Plasmid DNA 54 103,400,000 8.01 0.04 0.02 0.01 0.05 0.07 Plasmid DNA 54 612,200,000 8.78 0.03 0.01 0.01 0.04 0.05
Serum
Virus 29a 33 1.27 0.13 0.08 0.06 0.29 0.33 Virus 54 88 1.92 0.05 0.02 0.02 0.12 0.14 Virus 54 1,446 3.15 0.02 0.01 0.00 0.08 0.08 Virus 54 7,873 3.89 0.02 0.01 0.01 0.06 0.06 Virus 54 313,518 5.49 0.01 0.01 0.01 0.08 0.08
Plasmid DNA 54 599,225 5.77 0.04 0.01 0.01 0.06 0.08 Virus 54 7,011,440 6.84 0.02 0.01 0.01 0.07 0.08
Plasmid DNA 54 8,845,332 6.94 0.05 0.01 0.01 0.05 0.07 Virus 54 70,350,774 7.84 0.03 0.02 0.02 0.06 0.07
Plasmid DNA 53b 122,800,000 8.08 0.04 0.01 0.01 0.04 0.06 Plasmid DNA 54 678,700,000 8.83 0.02 0.01 0.01 0.05 0.05 SD=standard deviation aDetected replicates with quantifiable result. bOne replicate had an invalid result. Analytical Specificity-Interfering Substances: The susceptibility of the Aptima HBV Quant assay to interference by elevated levels of endogenous substances or by drugs commonly prescribed to HBV infected individuals was evaluated. HBV negative plasma samples and samples spiked with HBV to concentrations of approximately 30 IU/mL (1.48 log10 IU/mL) and 20,000 IU/mL (4.30 log10 IU/mL) were tested. No interference in the performance of the assay was observed in the presence of albumin (90 mg/mL), hemoglobin (5 mg/mL), triglycerides (30 mg/mL), or unconjugated bilirubin (0.2 mg/mL). HBV negative clinical plasma specimens from patients with elevated levels of defined substances or from patients with the indicated diseases (ten samples for each substance) listed in Table 6 were tested with the Aptima HBV Quant assay. No interference in the performance of the assay was observed.

PMA P170025: FDA Summary of Safety and Effectiveness Data Page 12
Table 6: Clinical Specimens Tested for Interference Antinuclear antibody (ANA) Systemic lupus erythematosus (SLE)
Rheumatoid factor (RF) Hyperglobulinemia Alcoholic cirrhosis (AC) Rheumatoid arthritis (RA)
Alcoholic hepatitis Anti-Jo1 antibody (JO-1) Non-alcoholic hepatitis Multiple myeloma (MM) Autoimmune hepatitis Hemolyzed (elevated hemoglobin)
Elevated alanine aminotransferase (ALT) Icteric (elevated bilirubin) Hepatocellular carcinoma (HCC) Lipemic (elevated lipid)
Multiple sclerosis (MS) Elevated protein
No interference in the performance of the assay was observed in the presence of the exogenous substances listed in Table 7 at concentrations at least three times the Cmax (human plasma).
Table 7: Exogenous Substances Tested for Interference
Exogenous Substance
Pool
Exogenous Substances Tested
1 Saquinavir, ritonavir, amprenavir, indinavir, lopinavir, nelfinavir mesylate 2 Clarithromycin, valganciclovir hydrochloride, efavirenz, nevirapine 3 Paroxetine HCI, enfuvirtide, zidovudine, didanosine, abacavir sulfate
4 Ribavirin, entecavir, adefovir dipivoxil, tenofovir disoproxil fumarate, lamivudine, ganciclovir, acyclovir
5 Stavudine, ciprofloxacin, fluoxetine, azithromycin, valacyclovir, sertraline, zalcitabine
6 Interferon alpha -2a, interferon alpha -2b, pegylated interferon alpha-2b
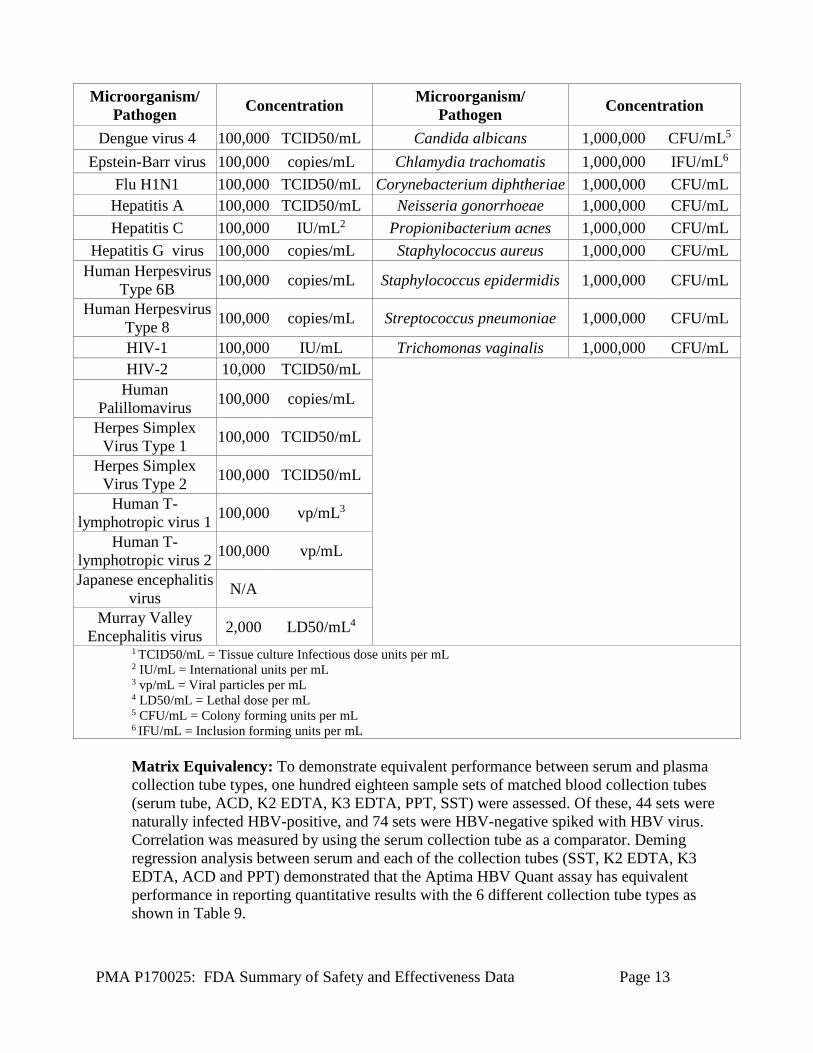
Analytical Specificity – Cross Reactivity: Potential cross-reactivity to the pathogens listed in Table 8 was evaluated in HBV negative human plasma in the presence or absence of 30 IU/mL (1.5 log10 IU/mL) and 20,000 IU/mL (4.3 log10 IU/mL) HBV DNA. No cross-reactivity or interference was observed.
Table 8: Pathogens Tested for Cross-Reactivity Microorganism/
Pathogen Concentration Microorganism/ Pathogen Concentration
Adenovirus type 5 100,000 TCID50/mL1 Parvo B19 100,000 IU/mL BK human
polyomavirus 1,000 TCID50/mL Rubella virus 10,000 TCID50/mL
Cytomegalovirus 100,000 TCID50/mL St. Louis Encephalitis virus 100,000 TCID50/mL Dengue virus 1 10,000 TCID50/mL vaccinia virus 1,000 TCID50/mL Dengue virus 2 10,000 TCID50/mL West Nile Virus 100,000 TCID50/mL Dengue virus 3 10,000 TCID50/mL Yellow Fever Virus 100,000 TCID50/mL
PMA P170025: FDA Summary of Safety and Effectiveness Data Page 13
Microorganism/ Pathogen Concentration Microorganism/
Pathogen Concentration
Dengue virus 4 100,000 TCID50/mL Candida albicans 1,000,000 CFU/mL5 Epstein-Barr virus 100,000 copies/mL Chlamydia trachomatis 1,000,000 IFU/mL6
Flu H1N1 100,000 TCID50/mL Corynebacterium diphtheriae 1,000,000 CFU/mL Hepatitis A 100,000 TCID50/mL Neisseria gonorrhoeae 1,000,000 CFU/mL Hepatitis C 100,000 IU/mL2 Propionibacterium acnes 1,000,000 CFU/mL
Hepatitis G virus 100,000 copies/mL Staphylococcus aureus 1,000,000 CFU/mL Human Herpesvirus
Type 6B 100,000 copies/mL Staphylococcus epidermidis 1,000,000 CFU/mL
Human Herpesvirus Type 8 100,000 copies/mL Streptococcus pneumoniae 1,000,000 CFU/mL
HIV-1 100,000 IU/mL Trichomonas vaginalis 1,000,000 CFU/mL HIV-2 10,000 TCID50/mL
Human Palillomavirus 100,000 copies/mL
Herpes Simplex Virus Type 1 100,000 TCID50/mL
Herpes Simplex Virus Type 2 100,000 TCID50/mL
Human T-lymphotropic virus 1 100,000 vp/mL3
Human T-lymphotropic virus 2 100,000 vp/mL
Japanese encephalitis virus N/A
Murray Valley Encephalitis virus 2,000 LD50/mL4
1 TCID50/mL = Tissue culture Infectious dose units per mL 2 IU/mL = International units per mL 3 vp/mL = Viral particles per mL 4 LD50/mL = Lethal dose per mL 5 CFU/mL = Colony forming units per mL 6 IFU/mL = Inclusion forming units per mL Matrix Equivalency: To demonstrate equivalent performance between serum and plasma collection tube types, one hundred eighteen sample sets of matched blood collection tubes (serum tube, ACD, K2 EDTA, K3 EDTA, PPT, SST) were assessed. Of these, 44 sets were naturally infected HBV-positive, and 74 sets were HBV-negative spiked with HBV virus. Correlation was measured by using the serum collection tube as a comparator. Deming regression analysis between serum and each of the collection tubes (SST, K2 EDTA, K3 EDTA, ACD and PPT) demonstrated that the Aptima HBV Quant assay has equivalent performance in reporting quantitative results with the 6 different collection tube types as shown in Table 9.

PMA P170025: FDA Summary of Safety and Effectiveness Data Page 14
Table 9: Matrix Equivalency Study
Blood Collection
Tube
Deming Regression
95% CI of Slope 95% CI of Intercept R2
Mean Difference
(log10) Lower Limit
Upper Limit
Lower Limit
Upper Limit
ACD y = 1.01x - 0.04 1.00 1.02 -0.10 0.01 0.998 -0.01 K2 EDTA y = 1.02x - 0.14 1.00 1.03 -0.20 -0.07 0.997 -0.07 K3 EDTA y = 1.01x - 0.12 1.00 1.03 -0.18 -0.06 0.997 -0.06
PPT y = 1.02x - 0.14 1.00 1.03 -0.21 -0.07 0.996 -0.06 SST y = 1.00x - 0.03 0.99 1.01 -0.07 0.03 0.999 -0.01
Sample Dilution Using Aptima Specimen Diluent (1:3): To assess the quantitation accuracy of HBV DNA in samples diluted with Aptima Specimen Diluent, samples that spanned the linear range (1.20 log10 IU/mL to 9.39 log10 IU/mL) were diluted 1:3 with Aptima Specimen Diluent (such as 240µL of sample combined with 480µL of Aptima Specimen Diluent). Each sample was tested neat and diluted (1:3) in triplicate. Testing was performed using one lot of assay reagents on two Panther systems with two Aptima Specimen Diluent lots. The difference between the average reported concentration in native matrix (dilution factor applied to the diluted sample result) and the average concentration in Aptima Specimen Diluent are shown in Table 10 for plasma and Table 11 for serum. The sample concentrations were accurately quantitated in the diluted samples.
Table 10: Plasma Specimen 1:3 Dilution Matrix Comparison Summary Plasma Matrix
Average Reported Concentration
(log10 IU/mL) n = 9
Diluent Average Reported
Concentration (log10 IU/mL) n = 18
Difference of Diluent from Plasma
Matrix (log IU10/mL)
1.20a 1.11b -0.09 1.56a 1.36b -0.20 2.15 2.04 -0.11 3.10 2.97 -0.13 3.92 3.89 -0.03 4.82 4.79 -0.03 5.70 5.70 0.00 7.07 6.98 -0.09 7.74 7.60 -0.14 8.74 8.62 -0.12 9.29 9.19 -0.10 9.39 9.29 -0.10
an=21 bn=42

PMA P170025: FDA Summary of Safety and Effectiveness Data Page 15
Table 11: Serum Specimen 1:3 Dilution Matrix Comparison Summary Serum Matrix Average Reported
Concentration (log10 IU/mL) n = 9
Diluent Average Reported
concentration (log10 IU/mL) n = 18
Difference of Diluent from Plasma Matrix (log IU10/mL)
1.21a 1.11b -0.10 1.54 a 1.36b -0.18 2.21 2.03 -0.18 3.06 2.98 -0.08 3.90 3.83 -0.07 4.77 4.76 -0.01 5.77 5.74 -0.03 7.03 7.00 -0.03 7.85 7.71 -0.14 8.87 8.76 -0.11 9.37 9.30 -0.07 9.46 9.36 -0.10
an=21 bn=42
Sample Dilution Using Aptima Specimen Diluent (1:100): To assess the quantitation accuracy of HBV DNA in samples diluted with Aptima Specimen Diluent, plasma or serum, eight individual plasma specimens and eight individual serum specimens spiked with HBV virus targeting between 6 to 8 log10 IU/mL, along with eight individual plasma specimens and eight individual serum specimens spiked with HBV plasmid DNA targeting 9.16 log10 IU/mL, were tested in 5 replicates. A 1:100 dilution was performed with one part sample and 99 parts Aptima Specimen Diluent just prior to testing. Testing was performed using one lot of assay reagents on two Panther systems with two Aptima Specimen Diluent lots. The difference between the average reported concentration in native matrix (dilution factor applied to the diluted sample result) and the average concentration in Aptima Specimen Diluent was calculated for each sample set as shown in Table 12 for plasma and Table 13 for serum.
Table 12: Plasma Specimen 1:100 Dilution Matrix Comparison Summary
Plasma Matrix Average Reported
Concentration (log10 IU/mL) n = 5
Diluent Average Reported
Concentration (log10 IU/mL) n = 10
Difference of Diluent from Plasma Matrix (log IU10/mL)
7.86 7.85 -0.01 7.84 7.83 -0.01 7.78 7.75 -0.03 7.80 7.80 0.00 6.58 6.53 -0.05 6.58 6.52 -0.06 6.58 6.53 -0.05

PMA P170025: FDA Summary of Safety and Effectiveness Data Page 16
6.58 6.53 -0.05 9.24a 9.05 a -0.19 9.21 a 9.05 a -0.16 9.25 a 9.03 a -0.22 9.27 a 9.04 a -0.23 9.13 a 8.82 a -0.31 9.12 a 8.81 a -0.31 9.09 a 8.84 a -0.25 9.05 a 8.84 a -0.21
aSpiked using plasmid DNA
Table 13: Serum Specimen 1:100 Dilution Matrix Comparison Study Serum Matrix
Average Reported Concentration
(log10 IU/mL) n = 5
Diluent Average Reported
concentration (log10 IU/mL) n = 10
Difference of Diluent from Plasma Matrix (log IU10/mL)
7.70 7.85 0.15 7.84 7.85 0.01 7.79 7.82 0.03 7.75 7.79 0.04 6.77 6.77 0.00 6.75 6.80 0.05 6.75 6.71 -0.04 6.70 6.73 0.03 9.27a 9.08a -0.19
9.24a 9.06a -0.18 9.29a 9.08a -0.21 9.31a 9.11a -0.20
9.14 a 8.91a -0.23 9.18a 8.92a -0.26 9.19a 8.90a -0.29
9.08 a 8.84 a -0.24 aSpiked using plasmid DNA
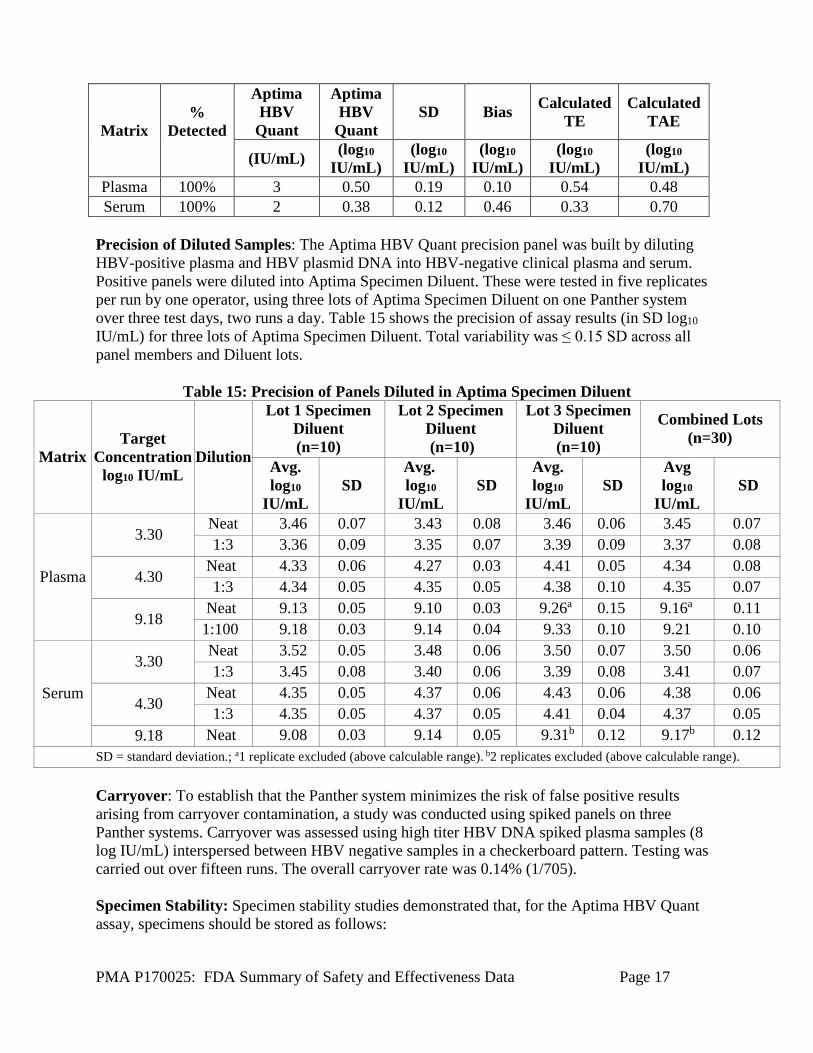
Confirmation of the LLoQ in Specimens Diluted in Aptima Specimen Diluent The LLoQ of the Aptima HBV Quant assay was confirmed with HBV genotype A clinical specimens diluted into Aptima Specimen Diluent. Specimens were prepared in HBV negative human plasma and serum at 21, 30, and 45 IU/mL. Each panel was diluted 1:3 into Aptima Specimen Diluent just prior to testing to give final concentrations of approximately 7, 10, and 15 IU/mL. Thirty-six (36) replicates of each panel member were tested with one reagent lot across three days. An LLoQ ≤ 10 IU/mL for HBV plasma and serum diluted into Aptima Specimen Diluent was confirmed as shown in Table 14.
Table 14: Confirmation of LLoQ - Samples in Aptima Specimen Diluent
PMA P170025: FDA Summary of Safety and Effectiveness Data Page 17
Matrix %
Detected
Aptima HBV
Quant
Aptima HBV
Quant SD Bias Calculated
TE Calculated
TAE
(IU/mL) (log10 IU/mL)
(log10 IU/mL)
(log10 IU/mL)
(log10 IU/mL)
(log10 IU/mL)
Plasma 100% 3 0.50 0.19 0.10 0.54 0.48 Serum 100% 2 0.38 0.12 0.46 0.33 0.70
Precision of Diluted Samples: The Aptima HBV Quant precision panel was built by diluting HBV-positive plasma and HBV plasmid DNA into HBV-negative clinical plasma and serum. Positive panels were diluted into Aptima Specimen Diluent. These were tested in five replicates per run by one operator, using three lots of Aptima Specimen Diluent on one Panther system over three test days, two runs a day. Table 15 shows the precision of assay results (in SD log10 IU/mL) for three lots of Aptima Specimen Diluent. Total variability was ≤ 0.15 SD across all panel members and Diluent lots.
Table 15: Precision of Panels Diluted in Aptima Specimen Diluent
Matrix Target
Concentration log10 IU/mL
Dilution
Lot 1 Specimen Diluent (n=10)
Lot 2 Specimen Diluent (n=10)
Lot 3 Specimen Diluent (n=10)
Combined Lots (n=30)
Avg. log10
IU/mL SD
Avg. log10
IU/mL SD
Avg. log10
IU/mL SD
Avg log10
IU/mL SD
Plasma
3.30 Neat 3.46 0.07 3.43 0.08 3.46 0.06 3.45 0.07 1:3 3.36 0.09 3.35 0.07 3.39 0.09 3.37 0.08
4.30 Neat 4.33 0.06 4.27 0.03 4.41 0.05 4.34 0.08 1:3 4.34 0.05 4.35 0.05 4.38 0.10 4.35 0.07
9.18 Neat 9.13 0.05 9.10 0.03 9.26a 0.15 9.16a 0.11
1:100 9.18 0.03 9.14 0.04 9.33 0.10 9.21 0.10
Serum
3.30 Neat 3.52 0.05 3.48 0.06 3.50 0.07 3.50 0.06 1:3 3.45 0.08 3.40 0.06 3.39 0.08 3.41 0.07
4.30 Neat 4.35 0.05 4.37 0.06 4.43 0.06 4.38 0.06 1:3 4.35 0.05 4.37 0.05 4.41 0.04 4.37 0.05
9.18 Neat 9.08 0.03 9.14 0.05 9.31b 0.12 9.17b 0.12 SD = standard deviation.; a1 replicate excluded (above calculable range). b2 replicates excluded (above calculable range). Carryover: To establish that the Panther system minimizes the risk of false positive results arising from carryover contamination, a study was conducted using spiked panels on three Panther systems. Carryover was assessed using high titer HBV DNA spiked plasma samples (8 log IU/mL) interspersed between HBV negative samples in a checkerboard pattern. Testing was carried out over fifteen runs. The overall carryover rate was 0.14% (1/705). Specimen Stability: Specimen stability studies demonstrated that, for the Aptima HBV Quant assay, specimens should be stored as follows:

PMA P170025: FDA Summary of Safety and Effectiveness Data Page 18
Whole blood can be stored at 2oC to 30oC and must be centrifuged within 24 hours of specimen collection. Plasma or serum may then be stored under one of the following conditions: • In the primary collection tube or specimen aliquot tube (SAT) at 2oC to 30oC for up to
24 hours. • In the primary collection tube or SAT at 2oC to 8oC for up to 5 days, or • In the SAT at -20oC for up to 60 days.
Real-Time Reagent (including Controls) Stability: Expiration dating for the Aptima HBV Quant assay has been established and approved as shown in Table 16:
Table 16: Real-Time Reagent Stability Kit Description Shelf Life
Aptima HBV Quant assay Kit 22 months at 2°C to 8°C Aptima HBV Quant Target Enhancer Reagent Kit 22 months at 15°C to 30°C Aptima HBV Quant Calibrator Kit 24 months at -15°C to -35°C Aptima HBV Quant Controls Kit 24 months at -15°C to -35°C
Antimicrobial Effectiveness (AET): Testing was performed and approved for the Aptima HIV-1 Quant Assay. The Aptima HBV Quant assay uses similar base formulations with minor differences in concentrations. Because the formulations are so similar and the preservatives used are identical, the AET established for the Aptima HIV-1 Quant assay verifies the preservative effectiveness for the Aptima HBV Quant assay. Results of the study were compared to the requirements of USP51. All reagents met the USP requirements for AET. Unlike Aptima HIV-1 Quant Assay, Aptima HBV Quant assay also contains Target Enhancer Reagent which is a concentrated solution of lithium hydroxide. No microbial control is needed since this reagent is caustic and self-preserving.

PMA P170025: FDA Summary of Safety and Effectiveness Data Page 19
X. SUMMARY OF PRIMARY CLINICAL STUDY(IES)
A. Study Design
The study was designed to assess the ability of the Aptima HBV Quant assay to predict virologic, biochemical, and serologic responses to HBV treatment at clinically relevant time points during 12-, 24-, or 48-week antiviral treatment.
1. Clinical Inclusion and Exclusion Criteria
Enrollment in the study was limited to patients who met the following inclusion criteria: • The subject is chronically infected with HBV (historical record of persistence of HBsAg for greater than 6 months). • The subject is initiating HBV antiviral therapy with either entecavir or tenofovir as indicated in the US FDA approved label (0.5 mg once daily of entecavir or 300 mg once daily for tenofovir), and has been treated for less than 12 weeks (±7 days).
o Treatment-naïve subjects and certain treatment-experienced subjects are eligible.
Treatment-experienced subjects who discontinued a previous nucleotide/nucleoside treatment regimen (eg, tenofovir, entecavir, adefovir, lamivudine, telbivudine) due to reasons other than treatment failure or resistance (ie, breakthrough, rebound, or non-response) or treatment success (eg, seroconversion) are eligible to participate (eg, discontinued due to pregnancy, cost). Previous treatment must have ended ≥6 months before the initiation of current treatment with entecavir or tenofovir. For subjects who have taken their first dose of current entecavir or tenofovir treatment, a standard of care HBV quantitative assay result is available for a sample that was collected ≤180 days before the start of therapy.
• The subject is at least 18 years of age at the time of enrollment • Adequate medical records are available for collection of protocol-defined demographics, baseline patient characteristics, medical history, virology, and specific laboratory results, and other information to verify enrollment criteria • The subject and/or legally authorized representative is willing and able to provide consent prior to providing a specimen(s)
Patients were not permitted to enroll in the study if they met any of the following exclusion criteria: • Treatment experienced subjects who discontinued an HBV treatment regimen due to treatment failure or resistance (ie breakthrough, rebound, nonresponse) or treatment success (eg., seroconversion) • Subject is in one of the following patient populations:

PMA P170025: FDA Summary of Safety and Effectiveness Data Page 20
o Acute HBV infection o Patients who are HBV immune tolerant o Human immunodeficiency virus (HIV) and/or hepatitis c virus (HCV) co-infection o Solid organ or bone marrow transplant recipients o Renal failure or dialysis o Evidence or history of hepatic decompensation o Evidence of history of hepatocellular carcinoma o Underlying liver disease other than HBV o Receiving chemotherapy, immunosuppressive agents o Subject is unsuitable for study participation based on the Investigator’s decision (eg., unlikely to comply with study visit schedule, significant medical complications)
• Participating in another investigational study that the Investigator believes might interfere with the subject’s participation in this study.
2. Response to Antiviral Therapy Definitions
Aptima HBV Quant assay clinical utility was assessed for individuals treated with tenofovir and entecavir. No information is available on the assay's clinical utility when other HBV antiviral therapies are used. Definitions: Early virologic response outcomes
• Week 12 and Week 24 virologic response = HBV DNA <10 IU/mL (<LLoQ) as assessed by the Aptima HBV Quant assay on the Panther system
• Week 12 alternative virologic response = HBV DNA ≥2 log10 decrease from baseline Week 24 alternative virologic response = HBV DNA <2000 IU/mL (for HBeAg+) or <50 IU/mL (for HBeAg-)
Clinical utility endpoints • Week 48 virologic response = HBV DNA <10 IU/mL (<LLoQ) as assessed by an FDA-approved HBV quantitative assay • Alternative Week 48 virologic response = HBV DNA <50 IU/mL as assessed by an FDA-approved HBV quantitative assay • Biochemical response = Normalization of ALT test results at Week 48 (ALT <30 U/L for males and <19 U/L for females) • Serologic response = Loss of HBeAg (HBeAg-negative results) at Week 48
Measures of association and predictive value
• Positive Predictive Value (PPV) = True Positive / (True Positive + False Positive) or the probability of response at Week 48 (for the clinical utility endpoint being assessed) in subjects with virologic response at the early time point
• Negative Predictive Value (NPV) = True Negative / (False Negative + True Negative) or the probability of non-response at Week 48 (for the clinical utility

PMA P170025: FDA Summary of Safety and Effectiveness Data Page 21
endpoint being assessed) in subjects with virologic non-response at the early time point
• Odds Ratio (OR) = (True Positive × True Negative) / (False Positive × False Negative)
3. Demographics The study enrolled 331 subjects from a total of 67 clinical sites. These were composed of 37 U.S. and 30 outside of U.S. clinical sites (Australia, Canada, Germany, Hungary, New Zealand, Romania, and Turkey) . Of the 331 enrolled subjects, 86 subjects were not evaluable due to withdrawal, discontinuation, early treatment halt, missing Week 48 results, or missing baseline HBV DNA viral load, or low baseline HBV DNA viral load. The remaining 245 subjects were evaluable for at least one of the clinical utility endpoints and included 126 HBeAg positive and 119 HBeAg negative subjects (Table 17).
Table 17: Demographics and Baseline Clinical Characteristics of Evaluable Subjects Characteristics Total
Total, N
N 245 Entecavir n (%) 94 (38.4) Tenofovir n (%) 151 (61.6) Sex, n (%) Male 154 (62.9)
Female 91 (37.1)
Age (years) Mean ± SD 43.5 ± 13.63
Median 44.0 Range 18 – 83
Age category (years), n (%) 18–29 40 (16.3)
30-49, n (%) 120 (49.0) 50-70, n (%) 80 (32.7) >70, n (%) 5 (2.0
Ethnicity, n (%) Hispanic or Latino 7 (2.9)
Not Hispanic or Latino 236 (96.3) Unknown/Refused 2 (0.8)
Racea, n, (%)
White 89 (36.3) Black or African American 16 (6.5)
Asian 132 (53.9) American Indian/Alaska
0 (0.0)
Native Hawaiian/Pacific
6 (2.4) Other 1 (0.4)
Unknown/Refused 1 (0.4)
Genotype, n (%)
A 28 (11.4) B 64 (26.1) C 36 (14.7) D 47 (19.2) E 2 (0.8) F 0 (0.0) G 0 (0.0) H 3 (1.2)
Unknown 65 (26.5)

PMA P170025: FDA Summary of Safety and Effectiveness Data Page 22
Characteristics Total HBV treatment status, n (%) Experienced 27 (11.0)
Naïve 218 (89.0)
Previous drug treatment, n (%)
Tenofovir 5 (18.5) Entecavir 4 (14.8) Adefovir 2 (7.4)
Lamivudine 1 (3.7) Telbivudine 0 (0.0) Interferon 10 (37.0)
Otherb 5 (18.5)
Previous treatment outcome, n (%)
Failure 1 (3.7) Success 0 (0.0)
Discontinued for other reasons 26 (96.3)
HBsAg serostatus, n (%) Positive/reactive 210 (85.7) Not Tested 35 (14.3)
Cirrhotic status, n (%) Cirrhotic 26 (10.6)
Non-cirrhotic 201 (82.0) Not Tested 18 (7.3)
HBV viral load (log10 IU/mL), n
Mean ± SD 6.3 ± 1.93 Median 6.4 Range 3 – 9
ALT (U/L) Mean ± SD 102.4 ± 175.97 Number above ULNc, n (%) 177 (85.9)
a Subjects may report multiple races b Various combinations of the specific drugs listed c The upper limit of normal range (ULN) for alanine aminotransferase (ALT) was 30 U/L for males and 19 U/L for females
4. Results
Predicting Week 48 Virologic Response, Defined as HBV DNA <10 IU/mL The primary definition of virologic response being HBV DNA <10 IU/mL was used for both early virologic response at Weeks 12 and 24, as well as the virologic response at Week 48. The association between early virologic responses at Weeks 12 and 24 and Week 48 clinical utility endpoints (virologic response, biochemical response, and serologic response) were assessed. Predicting Virologic Response at Week 48 Associations between virologic response at Week 48 and virologic response at Week 12 and Week 24 are summarized in Table 18.

PMA P170025: FDA Summary of Safety and Effectiveness Data Page 23
Table 18: PPV, NPV, and Odds Ratio for Virologic Response Predicated by Early Virologic Response During Treatment: Week 48 Virologic Response Defined as <10 IU/mL
HBeAg Status
Week of Early
Virologic Response
Treatment
PPV (%) NPV (%) OR
Estimate (95% CI) n/N Estimate
(95% CI) n/N Estimate (95% CI)a,b
HBeAg(+)
12
Entecavir 0.0 (0.0, 93.2) 0/1 82.5
(80.0, 88.4) 33/40 1.49 (<0.01, 30.95)
Tenofovir 100 (27.3, 100) 2/2 74.4
(72.6, 78.7) 61/82 14.30 (1.11, >999.99)
All 66.7 (15.4, 98.2) 2/3 77.0
(75.7, 79.9) 94/122 6.71 (0.62, 147.55)
24
Entecavir 50.0 (6.4, 93.2) 2/4 88.2
(83.5, 95.4) 30/34 7.50 (0.74, 79.76)
Tenofovir 75.0 (52.7, 92.3) 12/16 84.1
(78.5, 90.0) 58/69 15.81 (4.62, 65.54)
All 70.0 (50.3, 88.1) 14/20 85.4
(81.3, 90.1) 88/103 13.69 (4.74, 44.16)
HBeAg(-)
12
Entecavir 94.1 (87.1, 99.0) 32/34 22.2
(7.6, 36.0) 4/18 4.57 (0.80, 35.85)
Tenofovir 83.3 (70.5, 93.2) 25/30 46.9
(35.0, 58.9) 15/32 4.41 (1.42, 15.71)
All 89.1 (82.1, 94.7) 57/64 38.0
(29.0, 47.1) 19/50 4.99 (1.96, 14.00)
24
Entecavir 93.0 (88.0, 98.1) 40/43 37.5
(6.4, 67.2) 3/8 8.00 (1.21, 55.54)
Tenofovir 82.6 (74.3, 90.4) 38/46 75.0
(54.1, 92.0) 12/16 14.25 (3.92, 62.71)
All 87.6 (82.7, 92.6) 78/89 62.5
(44.8, 78.0) 15/24 11.82 (4.30, 34.94)
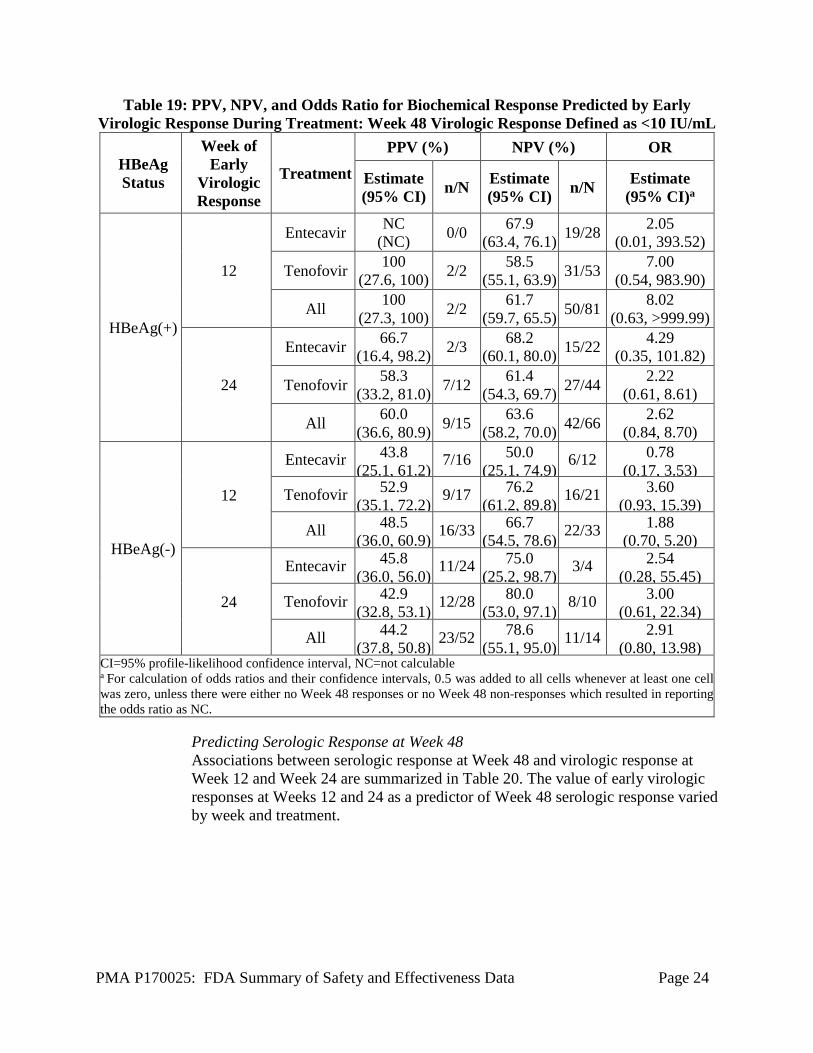
CI=95% profile-likelihood confidence interval a Shading indicates statistical significance of odds ratios. b For calculation of odds ratios and their confidence intervals, 0.5 was added to all cells whenever at least one cell was zero . Predicting Biochemical Response at Week 48 Associations between biochemical response at Week 48 and virologic response at Week 12 and Week 24 are summarized in Table 19.
PMA P170025: FDA Summary of Safety and Effectiveness Data Page 24
Table 19: PPV, NPV, and Odds Ratio for Biochemical Response Predicted by Early Virologic Response During Treatment: Week 48 Virologic Response Defined as <10 IU/mL
HBeAg Status
Week of Early
Virologic Response
Treatment PPV (%) NPV (%) OR
Estimate (95% CI) n/N Estimate
(95% CI) n/N Estimate (95% CI)a
HBeAg(+)
12
Entecavir NC (NC) 0/0 67.9
(63.4, 76.1) 19/28 2.05 (0.01, 393.52)
Tenofovir 100 (27.6, 100) 2/2 58.5
(55.1, 63.9) 31/53 7.00 (0.54, 983.90)
All 100 (27.3, 100) 2/2 61.7
(59.7, 65.5) 50/81 8.02 (0.63, >999.99)
24
Entecavir 66.7 (16.4, 98.2) 2/3 68.2
(60.1, 80.0) 15/22 4.29 (0.35, 101.82)
Tenofovir 58.3 (33.2, 81.0) 7/12 61.4
(54.3, 69.7) 27/44 2.22 (0.61, 8.61)
All 60.0 (36.6, 80.9) 9/15 63.6
(58.2, 70.0) 42/66 2.62 (0.84, 8.70)
HBeAg(-)
12
Entecavir 43.8 (25.1, 61.2)
7/16 50.0 (25.1, 74.9)
6/12 0.78 (0.17, 3.53)
Tenofovir 52.9 (35.1, 72.2) 9/17 76.2
(61.2, 89.8) 16/21 3.60 (0.93, 15.39)
All 48.5 (36.0, 60.9) 16/33 66.7
(54.5, 78.6) 22/33 1.88 (0.70, 5.20)
24
Entecavir 45.8 (36.0, 56.0) 11/24 75.0
(25.2, 98.7) 3/4 2.54 (0.28, 55.45)
Tenofovir 42.9 (32.8, 53.1) 12/28 80.0
(53.0, 97.1) 8/10 3.00 (0.61, 22.34)
All 44.2 (37.8, 50.8) 23/52 78.6
(55.1, 95.0) 11/14 2.91 (0.80, 13.98)
CI=95% profile-likelihood confidence interval, NC=not calculable a For calculation of odds ratios and their confidence intervals, 0.5 was added to all cells whenever at least one cell was zero, unless there were either no Week 48 responses or no Week 48 non-responses which resulted in reporting the odds ratio as NC.
Predicting Serologic Response at Week 48 Associations between serologic response at Week 48 and virologic response at Week 12 and Week 24 are summarized in Table 20. The value of early virologic responses at Weeks 12 and 24 as a predictor of Week 48 serologic response varied by week and treatment.

PMA P170025: FDA Summary of Safety and Effectiveness Data Page 25
Table 20: PPV, NPV, and Odds Ratio for Serologic Response PRedicted by Early Virologic Response During Treatment: Week 48 Virologic Response Defined as <10 IU/mL
PPV (%) NPV (%) OR
HBeAg Status
Week of Early
Virologic Response
Treatment Estimate (95% CI) n/N Estimate
(95% CI) n/N Estimate (95% CI)a
HBeAg(+) 12 Entecavir 100 (6.5, 100) 1/1 86.8
(84.2, 93.9) 33/38 18.27 (0.86, >999.99)
Tenofovir 0.0 (0.0, 72.0) 0/2 82.9
(81.7, 86.0) 68/82 0.95 (<0.01, 12.45)
All 33.3 (1.8, 84.3) 1/3 84.2
(83.1, 86.8) 101/120 2.66 (0.12, 29.11)
24 Entecavir 50.0 (6.4, 93.2) 2/4 88.2
(83.5, 95.4) 30/34 7.50 (0.74, 79.76)
Tenofovir 18.8 (3.1, 39.1) 3/16 84.1
(80.6, 89.1) 58/69 1.22 (0.25, 4.59)
All 25.0 (8.5, 43.6) 5/20 85.4
(82.5, 89.4) 88/103 1.96 (0.57, 5.94)
CI=95% profile-likelihood confidence interval a For calculation of odds ratios and their confidence intervals, 0.5 was added to all cells whenever at least one cell was zero.
Predicting Week 48 Virologic Response, Defined as HBV DNA <50 IU/mL (Alternative Definition)
Alternative definitions of early (Weeks 12 and 24) and Week 48 virologic responses also were assessed (see section X.A.2 Response to Antiviral Therapy Definitions). Associations between clinical utility endpoints and virologic response at Week 12 and Week 24, using these alternate definitions of virologic response are summarized in Table 21 (virologic response), Table 22 (biochemical response), and Table 23 (serologic response).
Table 21: PPV, NPV, and Odds Ratio for Virologic Response Predicted by Early Virologic
Response during Treatment: Week 48 Virologic Response Defined as <50 IU/mL
HBeAg Status
Week of Early
Virologic Response
Treatment
PPV (%) NPV (%) OR
Estimate (95% CI) n/N Estimate
(95% CI) n/N Estimate (95% CI)a,b
HBeAg(+) 12
Entecavir 34.2 (26.9, 39.2) 13/38 66.7
(16.1, 98.2) 2/3 1.04 (0.09, 23.60)
Tenofovir 55.1 (51.9, 59.4) 43/78 83.3
(43.5, 99.2) 5/6 6.14 (0.93, 120.54)
All 48.3 (45.6, 51.3) 56/116 77.8
(45.3, 97.1) 7/9 3.27 (0.75, 22.54)

PMA P170025: FDA Summary of Safety and Effectiveness Data Page 26
24
Entecavir 65.0 (51.3, 81.2) 13/20 100
(86.3, 100) 18/18 66.59 (7.20, >999.99)
Tenofovir 72.4 (64.7, 80.6) 42/58 88.9
(74.6, 97.2) 24/27 21.00 (6.28, 97.36)
All 70.5 (63.5, 77.9) 55/78 93.3
(84.0, 98.3) 42/45 33.47 (10.81, 148.13)
HBeAg(-)
12
Entecavir 100 (NC) 52/52 NC
(NC) 0/0 NC
Tenofovir 93.0 (89.1, 97.5) 53/57 60.0
(21.3, 93.3) 3/5 19.87 (2.62, 191.49)
All 96.3 (94.4, 98.7) 105/109 60.0
(21.1, 93.3) 3/5 39.37 (5.24, 376.77)
24
Entecavir 100 (NC) 47/47 0.0
(NC) 0/4 NC
Tenofovir 93.9 (88.6, 98.3) 46/49 30.8
(6.7, 52.4) 4/13 6.81 (1.30, 39.97)
All 96.9 (93.8, 99.2) 93/96 23.5
(7.0, 39.8) 4/17 9.54 (1.91, 53.22)
CI=95% profile-likelihood confidence interval, NC=not calculable a Shading indicates statistical significance of odds ratios. b For calculation of odds ratios and their confidence intervals, 0.5 was added to all cells whenever at least one cell was zero, unless there were either no Week 48 responses or no Week 48 non-responses, which resulted in reporting the odds ratio as NC.
Table 22: PPV, NPV, and Odds Ratio for Biochemical Response Predicted by Early
Virologic Response During Treatment: Week 48 Virologic Response Defined as <50 IU/mL PPV (%) NPV (%) OR
HBeAg Status
Week of Early
Virologic Response
Treatment Estimate (95% CI) n/N Estimate
(95% CI) n/N Estimate (95% CI)a,b
HBeAg(+)
12
Entecavir 33.3 (25.1, 39.0) 9/27 100
( 6.7, 100) 1/1 1.54 (0.07, 233.77)
Tenofovir 44.2 (39.6, 48.6) 23/52 66.7
(15.7, 98.2) 2/3 1.59 (0.14, 35.36)
All 40.5 (37.1, 43.7) 32/79 75.0
(23.9, 98.7) 3/4 2.04 (0.25, 42.30)
24
Entecavir 50.0 (31.2, 69.5) 7/14 81.8
(58.9, 97.1) 9/11 4.50 (0.79, 37.15)
Tenofovir 52.5 (44.0, 61.8) 21/40 81.3
(60.1, 96.7) 13/16 4.79 (1.30, 23.28)
All 51.9 (44.1, 60.2) 28/54 81.5
(66.4, 93.1) 22/27 4.74 (1.66, 15.82)
HBeAg(-) 12 Entecavir 46.4 (39.5, 52.6) 13/28 NC
(NC) 0/0 0.87 (<0.01, 166.17)

PMA P170025: FDA Summary of Safety and Effectiveness Data Page 27
Tenofovir 40.0 (33.6, 46.3) 14/35 100
(41.4, 100) 3/3 4.72
(0.41, 653.11) All 42.9
(39.6, 46.7) 27/63 100 (41.2, 100) 3/3 5.27
(0.48, 720.38)
24
Entecavir 44.0 (34.4, 52.7) 11/25 66.7
(16.3, 98.2) 2/3 1.57 (0.13, 36.42)
Tenofovir 41.4 (31.3, 51.1) 12/29 77.8
(48.6, 97.1) 7/9 2.47 (0.49, 18.57)
All 42.6 (36.4, 48.9) 23/54 75.0
(48.8, 93.7) 9/12 2.23 (0.59, 10.87)
CI=95% profile-likelihood confidence interval a Shading indicates statistical significance of odds ratios. b For calculation of odds ratios and their confidence intervals, 0.5 was added to all cells whenever at least one cell was zero.
Table 23: PPV, NPV, and Odds Ratio for Serologic Response Predicted by Early Virologic
Response During Treatment: Week 48 Virologic Response Defined as <50 IU/mL PPV (%) NPV (%) OR
HBeAg Status
Week of Early
Virologic Response
Treatment Estimate (95% CI) n/N Estimate
(95% CI) n/N Estimate (95% CI)a,b
HBeAg(+)
12 Entecavir 16.7 (10.4, 19.6) 6/36 100
(44.1, 100) 3/3 1.49 (0.12, 209.89)
Tenofovir 16.7 (12.9, 18.6) 13/78 83.3
(44.2, 99.2) 5/6 1.00 (0.14, 19.98)
All 16.7 (13.9, 18.1) 19/114 88.9
(58.8, 99.5) 8/9 1.60 (0.27, 30.56)
24 Entecavir 30.0 (16.5, 41.6) 6/20 100
(86.3, 100) 18/18 16.59 (1.72, >999.99)
Tenofovir 22.4 (16.9, 26.8) 13/58 96.3
(84.7, 99.9) 26/27 7.51 (1.37, 140.31)
All 24.4 (20.0, 28.4) 19/78 97.8
(90.4, 99.9) 44/45 14.17 (2.77, 259.25)
CI=95% profile-likelihood confidence interval a Shading indicates statistical significance of odds ratios. b For calculation of odds ratios and their confidence intervals, 0.5 was added to all cells whenever at least one cell was zero.
Conclusion Overall, the results demonstrated that the Aptima HBV Quant assay can be used to assess HBV DNA viral load in subjects with chronic HBV infection at the start of and during antiviral treatment. This study demonstrated that HBV DNA levels measured at baseline, and decreases in HBV DNA levels after 12 or 24 varied by week and treatment. The Aptima HBV Quant assay can be used to quantitate HBV DNA levels to aid in the management of chronic HBV-infected patients undergoing HBV antiviral therapy.

PMA P170025: FDA Summary of Safety and Effectiveness Data Page 28
B. Reproducibility
Reproducibility was evaluated on the Panther system at three external U.S. sites. Two operators performed testing at each site. Each operator performed two runs per day over three days, using three reagent lots over the course of testing. Each run had three replicates of each panel member. Overall, 108 replicates of each panel member were tested. Reproducibility was tested using panel members prepared with HBV-negative plasma. The positive panel members were positive for HBV genotypes A or C. HBV DNA concentrations spanned the linear range of the assay. Table 24 shows the reproducibility and precison of assay results for each positive panel member between sites, between operators/days, between lots, between runs, within runs, and overall. The coefficient of variation was calculated using the following equation where σ2 is the sample variance of the data after log10 transformation:
Table 24: Reproducibility of Aptima HBV Quant assay HBV DNA Levels on the Panther System in Positive Panel Members
Between Sites
Between Operators/
Daysa
Between Lots
Between Runs
Within Runs Total
GT N IU/mL Log10 IU/mL
SD (%CV)
SD (%CV)
SD (%CV)
SD (%CV)
SD (%CV)
SD (%CV)
A
108 17.6 1.85 0.059 (13.578)
<0.001 (<0.001)
0.138 (32.693)
0.090 (20.869)
0.178 (42.883)
0.250 (62.666)
108 129.4 2.092 0.009 (2.162)
0 (0)
0.074 (17.109)
0.051 (11.869)
0.106 (24.736)
0.139 (32.886)
107 1056.0 3.012 0.035 (7.994)
0.032 (7.432)
0.014 (3.246)
0.032 (7.356)
0.085 (19.666)
0.103 (24.060)
108 7663.0 3.875 0 (0)
0.027 (6.262)
0.040 (9.235)
0.044 (10.088)
0.066 (15.194)
0.092 (21.540)
108 188172.1 5.263 0.027 (6.281)
0.042 (9.707)
0.042 (9.787)
0.030 (6.829)
0.072 (16.689)
0.102 (23.772)
108 9389094.1 6.961 0.038 (8.846)
0 (0)
0.031 (7.237)
0.064 (14.791)
0.068 (15.756)
0.106 (24.692)
107 86664677.2 7.931 0.038 (8.692)
0.029 (6.753)
0.020 (4.584)
0.037 (8.635)
0.049 (11.375)
0.081 (18.725)
107 753726183.2 8.868 0.024 (5.476)
0.052 (11.997)
0.015 (3.499)
0.045 (10.304)
0.053 (12.187)
0.091 (21.163)
C
107 17.0 1.174 0.041 (9.521)
0.041 (9.392)
0.074 (17.147)
0.092 (21.438)
0.189 (45.704)
0.230 (57.010)
108 152.9 2.151 0.035 (8.127)
0 (0)
0.055 (12.706)
0.064 (14.925)
0.131 (30.748)
0.160 (38.013)
108 1363.8 3.125 0.042 (9.583)
0.023 (5.316)
0 (0)
0.061 (14.033)
0.055 (12.623)
0.094 (22.002)
108 9871.9 3.988 0.011 0.014 0.040 0.038 0.059 0.083

PMA P170025: FDA Summary of Safety and Effectiveness Data Page 29
Between Sites
Between Operators/
Daysa
Between Lots
Between Runs
Within Runs Total
GT N IU/mL Log10 IU/mL
SD (%CV)
SD (%CV)
SD (%CV)
SD (%CV)
SD (%CV)
SD (%CV)
(2.472) (32.70) (9.337) (8.801) (13.651) (19.291) 108 217400.5 5.329 0.031
(7.255) 0.047
(10.843) 0.016
(3.791) 0.026
(6.023) 0.063
(14.685) 0.090
(21.044) 108 12087179.5 7.069 0.046
(10.543) 0
(0) 0.02
(4.652) 0.064
(14.762) 0.073
(16.922) 0.109
(25.501) 108 577434712.8 7.754 0.044
(10.232) 0.028
(6.472) 0.013
(2.944) 0.043
(10.026) 0.052
(12.010) 0.087
(20.146) 108 572184754.9 8.749 0.042
(9.711) 0.048 11.160
0.028 6.374
0.034 7.740
0.048 11.081
0.091 (21.208)
%CV=log-normal coefficient of variation, GT=genotype, SD=standard deviation Note: Variability from some factors may be numerically negative. This can occur if the variability due to those factors is very small. In these cases, SD and CV are shown as 0. a Between Operators may be confounded with Between Days, therefore, Between Operators and Between Days estimates are combined in Between Operators/Days.
C. Safety and Effectiveness Results
1. Safety Results
There were no adverse effects of the device reported while the study was conducted.
2. Effectiveness Results
The analysis of effectiveness of the Aptima HBV Quant assay was assessed by determining the ability of the test to measure HBV DNA levels at baseline, during treatment, and after treatment. See results in Section X. A and B, above. Overall the clinical studies demonstrate the effectiveness of the Aptima HBV Quant assay in accurately measuring HBV DNA levels in patients undergoing treatment.
3. Subgroup Analyses
Not Applicable.
4. Pediatric Extrapolation In this premarket application, existing clinical data was not leveraged to support approval of a pediatric patient population.
D. Financial Disclosure
The Financial Disclosure by Clinical Investigators regulation (21 CFR 54) requires applicants who submit a marketing application to include certain information concerning the compensation to, and financial interests and arrangement of, any clinical investigator conducting clinical studies covered by the regulation. The pivotal clinical study included 70 investigators. None of the clinical investigators had

PMA P170025: FDA Summary of Safety and Effectiveness Data Page 30
disclosable financial interests/arrangements as defined in sections 54.2(a), (b), (c), and (f). The information provided does not raise any questions about the reliability of the data.
XI. PANEL MEETING RECOMMENDATION AND FDA’S POST-PANEL ACTION
In accordance with the provisions of section 515(c)(3) of the act as amended by the Safe Medical Devices Act of 1990, this PMA was not referred to the FDA Microbiology Devices Advisory Panel, an FDA advisory committee, for review and recommendation because the information in the PMA substantially duplicates information previously reviewed by this panel.
XII. CONCLUSIONS DRAWN FROM PRECLINICAL AND CLINICAL STUDIES
A. Effectiveness Conclusions
• The effectiveness of the Aptima HBV Quant assay has been demonstrated when used for the quantitation of HBV DNA in human plasma [EDTA, ACD, and PPTs] and serum and serum separation tubes (SST) for the management of patients undergoing treatment.
• There are no issues with endogenous interferents at physiological levels or with commonly administered medications.
• Whole blood can be stored at 2oC to 30oC and must be centrifuged within 24 hours of specimen collection. Plasma or serum may then be stored under one of the following conditions: o In the primary collection tube or specimen aliquot tube (SAT) at 2oC to 25oC
for up to 24 hours. o In the primary collection tube or SAT at 2oC to 8oC for up to 5 days, or o In the SAT at -20oC for up to 60 days.
• The preservatives that the Aptima HCV Quant Dx Assay reagents and controls contain have been shown to meet USP Chapter 51 criteria.
• The Aptima Quant Dx assay reagents can be stored at 2-8oC for 22 months. • The clinical performance was evaluated in an ethnically diverse population
representative of the intended use population (patients undergoing HBV therapy (see clinical performance studies, above).
B. Safety Conclusions
Based on the results of the analytical and clinical laboratory studies, the Aptima HBV Quant assay, when used according to the provided directions and in conjunction with other laboratory results and clinical information, should be safe and pose minimal risk to the patient due to incorrect test results.

PMA P170025: FDA Summary of Safety and Effectiveness Data Page 31
C. Benefit-Risk Determination
The benefits outweigh the risks at the level of performance observed in the pivotal clinical study. Complementary analytical studies strengthen this conclusion. Accurate detection and quantitation of HBV DNA is an essential component in the management of chronic HBV infected patients undergoing antiviral therapy. Risks include inaccurant quantification. This risk is substantially mitigated by device design (i.e., use of controls), the likelihood of additional testing for incorrect results, and the overall clinical assessment. 1. Patient Perspectives
This submission did not include specific information on patient perspectives for this device.
In conclusion, given the available information above, the data support that for the Aptima HBV Quant assay as an aid in the management of chronic HBV infected patients undergoing antiviral therapy the probable benefits outweigh the probable risks.
D. Overall Conclusions
The data in this application support the reasonable assurance of safety and effectiveness of this device when used in accordance with the indications for use. The device accurately measures the viral load in the patient at baseline and at intervals during antiviral therapy. Therefore, this device should benefit the physician and the patients in the management of chronic HBV infected individuals undergoing antiviral therapy when used according to the directions for use in the labeling.
XIII. CDRH DECISION
CDRH issued an approval order on January 23, 2018. The applicant’s manufacturing facilities have been inspected and found to be in compliance with the device Quality System (QS) regulation (21 CFR 820).
XIV. APPROVAL SPECIFICATIONS
Directions for use: See device labeling. Hazards to Health from Use of the Device: See Indications, Contraindications, Warnings, Precautions, and Adverse Events in the device labeling. Post-approval Requirements and Restrictions: See approval order.